comparing embedded design outcomes with and without … · national instruments matrixx ... an...
TRANSCRIPT

Comparing Embedded Design Outcomes With and Without
Model-Based Design
North American, European and Asian Markets: Automotive/Transportation, Industrial Automation, Medical, Military/Aerospace and Telecom/Datacom
Findings
Jerry Krasner, PhD., MBA
October 2010

Comparing Embedded Design Outcomes With and Without Model-Based Design
Jerry Krasner Ph.D., MBA
October 2010
Table of Contents
Executive Summary .......................................................................... 4
I. Overview .............................................................................. 8 II. Model-Based Design (MBD) ................................................ 9 III. Comparing MBD and non-MBD outcomes in
North America, Europe and Asia ...................................... 13 IV. Comparing MBD and non-MBD outcomes for
Automotive/Transportation, Industrial Automation, Medical, Mil-Aero, and Telecom/Datacom Designs .........16
V. Comparing MBD and non-MBD outcomes for Systems Engineering – The Uniqueness of the Systems market segment ................................................. 19
VI. Other Market Factors – Advantages of Adopting MBD as a Best Practice .................................... 23
Appendix ....................................................................................... 26

© 2010 American Technology International 3 of 28 Comparing Embedded Design Outcomes
About EMF: www.embeddedforecast.com
EMF is the premier market intelligence and advisory firm in the embedded technology industry. Embedded technology refers to the ubiquitous class of products which use some type of processor as a controller. These products include guided missiles, radars, and avionics as well as robots, automobiles, telecom gear, and medical electronics.
Embedded Market Forecasters (EMF) is the market research division of American Technology International, Inc. EMF clients range from startups to Global 100 companies worldwide. Founded by Dr. Jerry Krasner, a recognized authority on electronics markets, product development and channel distribution, EMF is headquartered in Framingham, Mass.
About the author:
Jerry Krasner, Ph.D., MBA is Vice President of Embedded Market Forecasters and its parent company, American Technology International. A recognized authority with over 30 years of embedded industry experience, Dr. Krasner has extensive clinical research and medical industrial experience, including the successful filing of more than a dozen 510k submissions.
Dr. Krasner served as President of Biocybernetics, Inc. and CLINCO, Inc., Executive Vice President of Plasmedics, Inc. and Clinical Development Corporation, and Director of Medical Sciences for the Carnegie-Mellon Institute of Research. He has been the principal investigator of several NIH funded clinical research programs.
Dr. Krasner was formerly Chairman of Biomedical Engineering at Boston University, and Chairman of Electrical and Computer Engineering at Wentworth Institute of Technology.
Dr. Krasner earned BSEE and MSEE degrees from Washington University, a Ph.D. in Medical Physiology/Biophysics from Boston University and an MBA from Nichols College. Contributors The author wishes to acknowledge the significant contributions of Larry Wilson, CEO of the Wilson Research Group, and Dolores A. Krasner, Senior Researcher at EMF, to this paper. Copyright 2010 by American Technology International, Inc, 638 Main, Ashland, MA 01721. All rights reserved. No part of this book covered by copyright hereon may be reproduced or copied in any manner whatsoever. Every effort has been made to provide accurate data. To the best of the editor’s knowledge, the data is reliable and complete, but no warranty is made for this.

© 2010 American Technology International 4 of 28 Comparing Embedded Design Outcomes
Executive Summary: Methodology and Results Based on the responses of 564 embedded developers to a detailed and comprehensive survey conducted by Embedded market Forecasters (EMF), developers were separated into two cadres; one consisted of developers that used any of the following methodologies:
Automatic code generation Model driven architecture Model driven development (MDD) or Model-based design (MBD) tools Modeling-simulation tools Rapid prototyping tools
This cadre also included developers that indicated that they used one of the following modeling tools:
IBM Rose Realtime IBM Rhapsody IBM Statemate National Instruments MATRIXx MathWorks Simulink MathWorks Stateflow
This cadre was named “Model-Based Design (MBD)”. The remainder of developers was placed in the second cadre named “non-MBD” Summary of Results An analysis was conducted to determine the total cost of development (TCD) between these cadres based on comparable design outcomes. The results presented herein show that:
1) MBD developments showed a significant TCD advantage over non- MBD developments worldwide (36.6%); in North America (24.4%); in Europe (37.6%) and in Asia (202.0%)
2) The number of developers used per project was smaller for MBD across all geographic areas – as well for all vertical markets examined
3) The percent of developer months lost to design cancellation or behind schedule design outcomes as a percent of total project developer months was consistently less for MBD developments across all verticals and geographic areas
For many years there has been a debate as to whether Model-Based Design (MBD) provided a measurable design benefit and whether it provided a long term
© 2010 American Technology International 5 of 28 Comparing Embedded Design Outcomes
financial ROI over comparable non-MBD developments. In 2008 EMF published its findings on the use of MBD for the Telecom and Datacom market segments which showed that MBD held a decisive advantage. In this report, EMF calculates a comparative ROI for a comprehensive worldwide analysis of MBD versus non-MBD designs. We break out our analysis to include: Geographic comparisons:
North America (USA, Canada, Mexico) Europe (Germany, France, Italy, UK ) Asia (Japan, Taiwan, India, Korea, Malaysia)
Embedded markets: Auto/transportation Industrial automation Telecom/Datacom Medical Mil-Aero
User profiles Systems engineers
Calculating the Total Cost of Development (hence, comparative ROI)
Number of hardware and software developers per project Number of months between design start and product shipment Percent of designs completed behind schedule – and number of months
lost Percent of designs cancelled – and number of months before cancellation
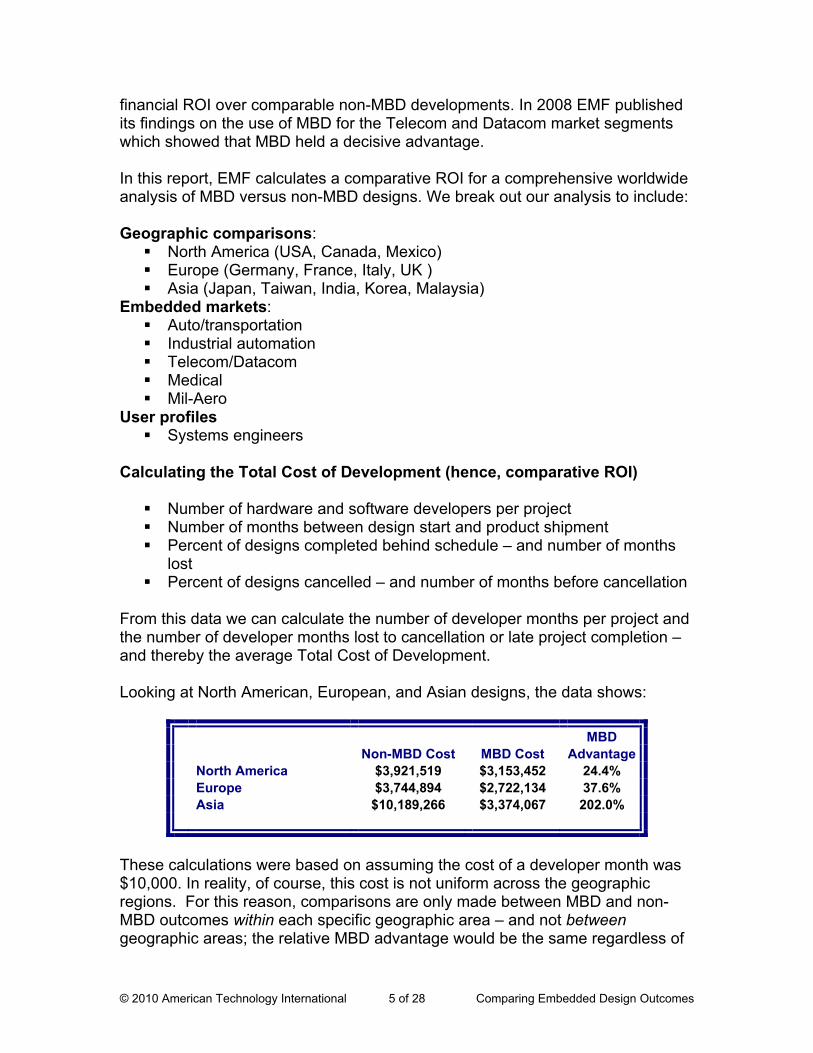
From this data we can calculate the number of developer months per project and the number of developer months lost to cancellation or late project completion – and thereby the average Total Cost of Development. Looking at North American, European, and Asian designs, the data shows:
MBD Non-MBD Cost MBD Cost Advantage North America $3,921,519 $3,153,452 24.4% Europe $3,744,894 $2,722,134 37.6% Asia $10,189,266 $3,374,067 202.0%
These calculations were based on assuming the cost of a developer month was $10,000. In reality, of course, this cost is not uniform across the geographic regions. For this reason, comparisons are only made between MBD and non-MBD outcomes within each specific geographic area – and not between geographic areas; the relative MBD advantage would be the same regardless of

© 2010 American Technology International 6 of 28 Comparing Embedded Design Outcomes
the local cost of a developer month. Looking at the five market segment verticals, the data shows:
Non-MBD
Cost MBD Cost MBD Advantage Telecom/Datacom $6,279,861 $3,224,478 94.9% Auto/Transportation $3,151,078 $2,270,597 38.8% Ind Automation $1,593,047 $1,605,783 -0.8% Medical $2,269,310 $1,265,059 79.4% Mil-Aero Special analysis
World World Industry Industry MBD Not MBD Devel time Months 13.4 13.1 % behind schedule 44.3% 49.9% Months behind 3.7 3.7 Ave Delay Months 1.63 1.83 % cancelled 10.1% 12.1% Months lost to cancellation 4.2 4.7 SW Developers/proj 11.0 16.3 HW Developers/proj 8.9 10.9 Total project developers 19.9 27.2 Average Developer months/project 266.2 358.1 Developer months lost to schedule 32.4 49.8 Developer months lost to cancellation 8.5 15.5 Total developer months/ project 307.1 423.4 At $10,000/developer month Average developer cost/project $2,662,098 $3,580,843 Average cost to delay $323,977 $497,835 Total developer cost/project $2,986,075 $4,078,677 MBD Adv 36.6%
Looking specifically at Systems Engineers, the data shows:

© 2010 American Technology International 7 of 28 Comparing Embedded Design Outcomes
Sys Eng MBD Sys Eng Not
MBD Devel time Months 12.9 11.7 % behind schedule 45.6% 56.5% Months behind 4.2 3.9 Ave Delay Months 1.89 2.18 % cancelled 11.4% 14.3% Months lost to cancellation 5.4 4.3 SW Developers/proj 8.9 12.4 Total project developers 8.9 12.4 Average Developer months/project 114.2 145.5 Developer months lost to schedule 16.8 27.1 Developer months lost to cancellation 5.5 7.7 Total developer months/ project 136.5 180.3 At $10,000/developer month Average developer cost/project $1,142,274 $1,454,944 Average cost to delay $167,669 $271,218 Total developer cost/project $1,309,944 $1,726,162 MBD Adv 31.8%
Systems engineers interface with software engineers (often OO developers), systems architects and hardware engineers. In the above table, the data was filtered to provide data for systems engineers that were doing software development. MBD is emerging as a preferred method for software design, deployment and maintenance. MBD enables the following advantages:
Code reuse Interoperability Easy code redeployment under frequent hardware changes necessitated
by processor end-of-life events Integrated documentation Enhanced design capabilities – better design outcomes The ability to integrate legacy code into a new design The ability to do systems level design – and systems within systems
design and analysis In analyzing and interpreting the data contained in this report, one needs to be careful when comparing the percent of behind schedule completions as well as the number of developers per project. MBD designs are usually more complex than non-MBD designs. There isn’t a one-to-one comparison other than the average total cost per development which we use extensively in this report. Notwithstanding, MBD outperforms non-MBD designs.

© 2010 American Technology International 8 of 28 Comparing Embedded Design Outcomes
I. Overview Complexities and uncertainties surrounding embedded software developments continue to escalate development costs and frequently challenge product “windows of opportunity”. Engineering costs associated with design delays are further exacerbated by the failure of most embedded designs to approximate pre-design expectations. Annual surveys by Embedded Market Forecasters (EMF) of embedded developers have clearly shown that software development is responsible for more than 80% of design delays and associated design complications. Whether the system is poorly conceived and specified or whether crucial algorithms fail to adequately address systems performance, traditional methods of embedded software development are yielding to a process known as “Model-Based Design (MBD)”. MBD uses executable models to unambiguously capture requirements, define design specifications, evaluate systems concepts, automatically generate code for rapid prototyping and for software development, and test earlier and more thoroughly. For many years there was a debate as to whether MBD provided a measurable design benefit and whether it provided a long term financial ROI. The arguments centered on finding a true basis from which comparable MBD and non-MBD developments could be compared. In 2008, EMF published a seminal report in which MBD could be compared with non-MBD developments across two vertical application markets based on embedded developer responses to EMF’s detailed surveys. Embedded developer data for Telecom and Datacom formed a unique opportunity to address whether MBD provided a measurable benefit – and if so, how much. What made this data unique is that the average number of developers per project and the number of lines of code (LOC) per project were nearly identical for MBD and non-MBD developments for both Telecom and Datacom. If there was to be a measurable difference, this would serve as the basis for an ideal comparison. The 2008 study showed these benefits of MBD for Telecom applications:
MBD developments got to market faster (9.4 months versus 11.6 months) MBD developments had fewer cancellations (7.2% compared with 14.0%) MBD had fewer behind schedule completions (19.7% versus 36.4%) MBD had a 31.8% ROI average total cost of development advantage
($2.65 million versus $3.66 million

© 2010 American Technology International 9 of 28 Comparing Embedded Design Outcomes
II. Model-Based Design (MBD) What is MBD? MBD emerged as a means of addressing the difficulties and complexities inherent in control systems designs. Developers recognized that software design needs to start before physical prototypes and systems are available. Traditional design processes resulted in the discovery of design and requirements errors late in the design cycle resulting in expensive delays and missed opportunities. In traditional design processes, design information is communicated and managed as text-based documentation. Frequently this documentation is difficult to comprehend. Code is created manually from specification and requirements documents that are time consuming and error prone. There is little tracking to ensure that changes are correctly implemented. Designs, such as those for avionics and automotive systems, have become too complex to develop and coordinate without the creation of a design environment common to all involved developers. MBD, used to its fullest, provides a single design environment that enables developers to use a single model of their entire system for data analysis, model visualization, testing and validation, and ultimately product deployment, with or without automatic code generation. At a minimum, MBD can be used as a specification that contains greater detail than text-based specifications. In real-time applications, it enables developers to evaluate multiple options, predict systems performance, test systems functionality by imposing I/O conditions that might be operationally expected (before product deployment), and test designs. Once the model is built and completely tested, accurate real-time software for the production embedded design is automatically generated, thereby saving time and reducing costs compared to traditional manual coding. MBD with automatic code generation can also be used in rapid prototyping, enabling subsystem designs to be tested and optimized. Although it is very important in highly complex design applications (e.g., guidance systems, engine controls, autopilots, anti-lock braking systems) that otherwise might be difficult to realize without it, MBD can be used effectively and economically for less complex designs. Furthermore, MBD creates a structure for software reuse that permits established designs to be effectively and reliably upgraded in a simpler and more cost-effective manner.

© 2010 American Technology International 10 of 28 Comparing Embedded Design Outcomes
Defining MBD in 2010 The questions that remained from the 2008 study, and were not addressed at that time, were in regard to how MBD versus non- MBD comparisons fared over a broad range of vertical applications, in comparative European and Asian developments, and in regard to the total embedded industry as well. The results of EMF’s analysis of these issues are the topic for this paper. The data presented herein comes from EMF’s annual detailed surveys of embedded developers. There were 1325 respondents to EMF’s 2009 and 2010 surveys. In 2010, five hundred and twenty six developers responded to the online survey, of which 86 were hardware engineers, 145 were software engineers, 72 were systems developers, 42 were systems architects, 48 were firmware engineers and 89 were engineering managers. In addition, 44 developers gave titles other than these listed. This provided an excellent distribution of experiences and viewpoints from which to draw inferences and conclusions. Statistically, the response is at a 95% confidence level, plus or minus 4.1%. 73.2% of respondents came from North America, while 15.1% were from Asia and 12.4% were from Europe. The results of the 2010 survey were consistent with those of 2009, and were used as the basis for the ROI calculations presented. EMF employs a unique market intelligence tool (the Executive Embedded dashboard) that permits an unlimited number of crosstabs and filters to be calculated and displayed that can relate any answer to any question in the extensive EMF survey database to any other. The Dashboard allows 5 such filters to be simultaneously displayed. In many cases, people responded to the survey based on their experiences across several verticals. In those cases, their responses are captured in the results for each vertical. The Dashboard allows EMF to define MBD in a multitude of ways. Previously, without the Dashboard, this was impossible to undertake. There were many possible ways to define serious MBD users and to exclude those that might have used a tool that could be associated with MBD developers. An example would be MATLAB or LabVIEW users. While many MBD developers might use these tools, many non-MBD users would be using these as well (for example, for data analysis or test-system development). Hence, we chose not to filter on either of these tools (the dashboard would let us see how many MBD and non-MBD developers actually used them). Another approach would be to filter on the most popular MBD development tools (e.g., Simulink, Rhapsody, etc.). But that would lead to a thorny issue about what tools to include and exclude.
© 2010 American Technology International 11 of 28 Comparing Embedded Design Outcomes
Also the comparison would need to be between users of our defined set of tools and the industry average (which would include these same users as well as others). We needed to show that, whatever definition we chose for MBD, it was consistent with the expected number of developers that expressed their use of MBD. This was a process that could only have been pursued with the Dashboard. Ultimately, we arrived at the following set of parameters to define MBD developers, any one of which was sufficient to characterize a respondent as an MBD developer (by establishing these parameters, we used the Dashboard to ensure that MBD developer characteristics were ultimately included from this limited set of parameters):
Automatic code generation Model driven development (MDD and MBD) Rapid Prototyping Model driven architecture Simulation-modeling based on UML, SysML, Scade, etc. Users of one or more of the following modeling tools: IBM Rose Realtime,
IBM Rhapsody, IBM Statemate, National Instruments MATRIXx, MathWorks Simulink, MathWorks Stateflow
The Dashboard allows any crosstab to be filtered according to Boolean notations (AND, OR, NOT). Hence we were able to define a non-MBD developer as someone who fits none of the six parameters. We were then able to simultaneously display MBD and non-MBD crosstabs and see how they compared for any question in the survey (e.g., number of software developers per project, OSes used, processors used, tools used, and tools purchased but not used, etc.) Market segment analysis was conducted in the following manner using the Dashboard. For example, developer comparisons for Industrial Automation were determined as follows:
MBD and non-MBD filters were created from the above six-part definition The dashboard was moved to the question “What are the primary
applications for your embedded design?” The MBD filter was modified (a Dashboard capability) to include “AND
Industrial Automation”, thereby creating a filter that created a dataset for industrial automation MBD developers.
This process was repeated for non-MBD developers, thereby creating a separate dataset for industrial automation developers that don’t use MBD
These two datasets were simultaneously displayed in separate Dashboard

© 2010 American Technology International 12 of 28 Comparing Embedded Design Outcomes
columns. The Dashboard questions regarding numbers of software and hardware developers per project; time from development start to shipment (time to market); percent of designs that are canceled (and number of months before cancellation); and percent of designs completed behind schedule (and number of months behind schedule) were then used to calculate the Total Cost of Development.

© 2010 American Technology International 13 of 28 Comparing Embedded Design Outcomes
III. Comparing MBD and non-MBD Designs In North America, Europe and Asia In determining comparative design outcomes, EMF uses the following criteria:
Number of developers per project (hardware and software) Time-to-shipment of project (months) Percent of designs completed behind schedule – and average number of
months behind Percent of designs cancelled – and average number of months before
cancellation From this data, EMF is able to calculate the average number of developer-months per project (number of developers per project multiplied by the shipping time in months), as well as the number of developer-months lost to cancellation (percent of design cancelled multiplied by the number of project developers multiplied by number of months expended before cancellation), and the number of months lost to late project completions (same calculation but using percent of design completed behind schedule). Table III-1 presents a comparison for the worldwide embedded industry at large.
World World Industry Industry MBD Not MBD Devel time Months 13.9 13.9 % behind schedule 40.8% 51.2% Months behind 3.5 4.0 Ave Delay Months 1.43 2.05 % cancelled 9.9% 12.1% Months lost to cancellation 4.0 4.0 SW Developers/proj 11.1 16.9 HW Developers/proj 9.6 10.1 Total project developers 20.7 27.0 Average Developer months/project 287.7 375.3 Developer months lost to schedule 29.6 55.3 Developer months lost to cancellation 8.2 13.1 Total developer months/ project 325.5 443.7 At $10,000/developer month Average developer cost/project $2,877,300 $3,753,000 Average cost to delay $295,596 $552,960 Total developer cost/project $3,172,896 $4,305,960 MBD Adv 35.7%
Table III-1: Design comparisons for worldwide embedded industry
© 2010 American Technology International 14 of 28 Comparing Embedded Design Outcomes
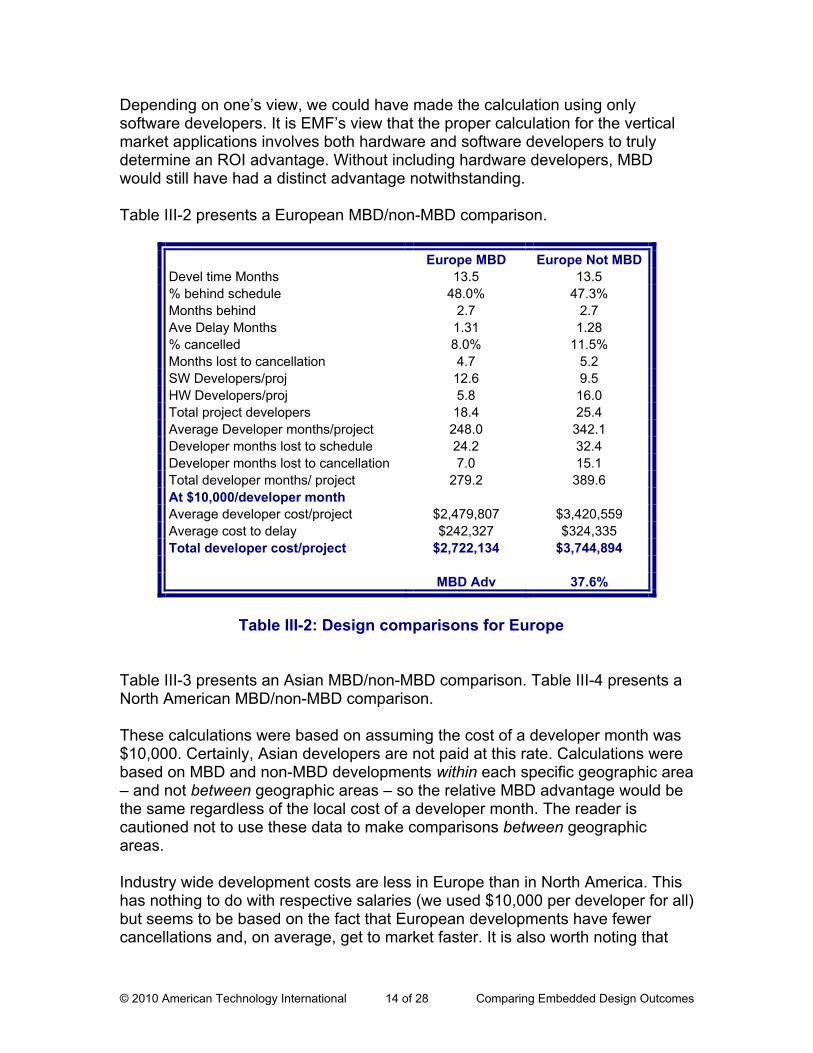
Depending on one’s view, we could have made the calculation using only software developers. It is EMF’s view that the proper calculation for the vertical market applications involves both hardware and software developers to truly determine an ROI advantage. Without including hardware developers, MBD would still have had a distinct advantage notwithstanding. Table III-2 presents a European MBD/non-MBD comparison.
Europe MBD Europe Not MBD Devel time Months 13.5 13.5 % behind schedule 48.0% 47.3% Months behind 2.7 2.7 Ave Delay Months 1.31 1.28 % cancelled 8.0% 11.5% Months lost to cancellation 4.7 5.2 SW Developers/proj 12.6 9.5 HW Developers/proj 5.8 16.0 Total project developers 18.4 25.4 Average Developer months/project 248.0 342.1 Developer months lost to schedule 24.2 32.4 Developer months lost to cancellation 7.0 15.1 Total developer months/ project 279.2 389.6 At $10,000/developer month Average developer cost/project $2,479,807 $3,420,559 Average cost to delay $242,327 $324,335 Total developer cost/project $2,722,134 $3,744,894 MBD Adv 37.6%
Table III-2: Design comparisons for Europe
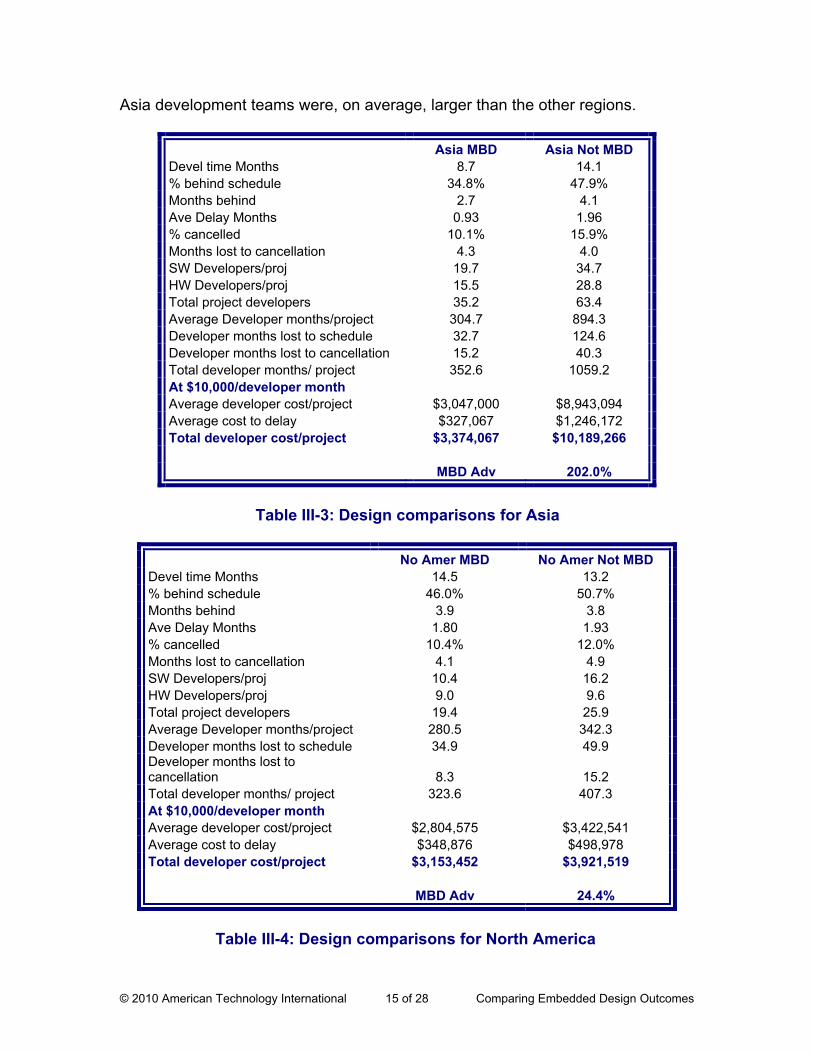
Table III-3 presents an Asian MBD/non-MBD comparison. Table III-4 presents a North American MBD/non-MBD comparison. These calculations were based on assuming the cost of a developer month was $10,000. Certainly, Asian developers are not paid at this rate. Calculations were based on MBD and non-MBD developments within each specific geographic area – and not between geographic areas – so the relative MBD advantage would be the same regardless of the local cost of a developer month. The reader is cautioned not to use these data to make comparisons between geographic areas. Industry wide development costs are less in Europe than in North America. This has nothing to do with respective salaries (we used $10,000 per developer for all) but seems to be based on the fact that European developments have fewer cancellations and, on average, get to market faster. It is also worth noting that
© 2010 American Technology International 15 of 28 Comparing Embedded Design Outcomes
Asia development teams were, on average, larger than the other regions.
Asia MBD Asia Not MBD Devel time Months 8.7 14.1 % behind schedule 34.8% 47.9% Months behind 2.7 4.1 Ave Delay Months 0.93 1.96 % cancelled 10.1% 15.9% Months lost to cancellation 4.3 4.0 SW Developers/proj 19.7 34.7 HW Developers/proj 15.5 28.8 Total project developers 35.2 63.4 Average Developer months/project 304.7 894.3 Developer months lost to schedule 32.7 124.6 Developer months lost to cancellation 15.2 40.3 Total developer months/ project 352.6 1059.2 At $10,000/developer month Average developer cost/project $3,047,000 $8,943,094 Average cost to delay $327,067 $1,246,172 Total developer cost/project $3,374,067 $10,189,266 MBD Adv 202.0%
Table III-3: Design comparisons for Asia
No Amer MBD No Amer Not MBD Devel time Months 14.5 13.2 % behind schedule 46.0% 50.7% Months behind 3.9 3.8 Ave Delay Months 1.80 1.93 % cancelled 10.4% 12.0% Months lost to cancellation 4.1 4.9 SW Developers/proj 10.4 16.2 HW Developers/proj 9.0 9.6 Total project developers 19.4 25.9 Average Developer months/project 280.5 342.3 Developer months lost to schedule 34.9 49.9 Developer months lost to cancellation 8.3 15.2 Total developer months/ project 323.6 407.3 At $10,000/developer month Average developer cost/project $2,804,575 $3,422,541 Average cost to delay $348,876 $498,978 Total developer cost/project $3,153,452 $3,921,519 MBD Adv 24.4%
Table III-4: Design comparisons for North America
© 2010 American Technology International 16 of 28 Comparing Embedded Design Outcomes
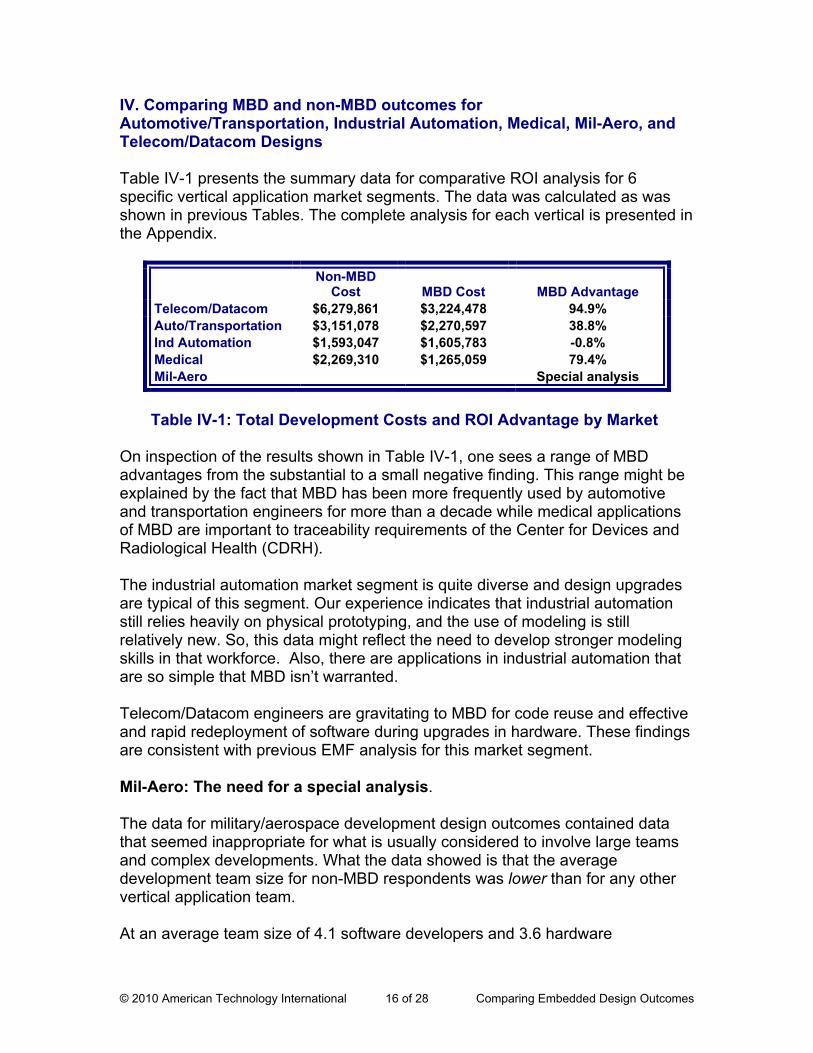
IV. Comparing MBD and non-MBD outcomes for Automotive/Transportation, Industrial Automation, Medical, Mil-Aero, and Telecom/Datacom Designs Table IV-1 presents the summary data for comparative ROI analysis for 6 specific vertical application market segments. The data was calculated as was shown in previous Tables. The complete analysis for each vertical is presented in the Appendix.
Non-MBD
Cost MBD Cost MBD Advantage Telecom/Datacom $6,279,861 $3,224,478 94.9% Auto/Transportation $3,151,078 $2,270,597 38.8% Ind Automation $1,593,047 $1,605,783 -0.8% Medical $2,269,310 $1,265,059 79.4% Mil-Aero Special analysis
Table IV-1: Total Development Costs and ROI Advantage by Market On inspection of the results shown in Table IV-1, one sees a range of MBD advantages from the substantial to a small negative finding. This range might be explained by the fact that MBD has been more frequently used by automotive and transportation engineers for more than a decade while medical applications of MBD are important to traceability requirements of the Center for Devices and Radiological Health (CDRH). The industrial automation market segment is quite diverse and design upgrades are typical of this segment. Our experience indicates that industrial automation still relies heavily on physical prototyping, and the use of modeling is still relatively new. So, this data might reflect the need to develop stronger modeling skills in that workforce. Also, there are applications in industrial automation that are so simple that MBD isn’t warranted. Telecom/Datacom engineers are gravitating to MBD for code reuse and effective and rapid redeployment of software during upgrades in hardware. These findings are consistent with previous EMF analysis for this market segment. Mil-Aero: The need for a special analysis. The data for military/aerospace development design outcomes contained data that seemed inappropriate for what is usually considered to involve large teams and complex developments. What the data showed is that the average development team size for non-MBD respondents was lower than for any other vertical application team. At an average team size of 4.1 software developers and 3.6 hardware

© 2010 American Technology International 17 of 28 Comparing Embedded Design Outcomes
developers (7.7 developers per project), this seemed contrary to what would intuitively be expected. What seemed odd was that these smaller mil/aero teams took over 13 months to complete an average design – which was only 3 months shorter than the more complex MBD undertakings involving an average of 24 developers per project. Consistent with this finding was that the percent of total developer months lost to cancellation or behind schedule completion as a percentage of the total developer months consumed per development was higher for the non-MBD designs. This is also consistent with worldwide MBD findings. We undertook an analysis of the data to see how we can best use our data to arrive at a fair comparison, given the strange nature of the derived data. What we found is that among all non-MBD mil-aero developers, the largest team size reported was less than 20 – whereas MBD developers consisted of team sizes between 19 and 399. Unfortunately, there wasn’t sufficient comparative data from which to make a statistically valid analysis. In an attempt to extract some insights into the use of MBD in mil-aero applications while accounting for the disparity of team sizes, we broke the relevant data into two cadres – one consisting of development teams with 6-9 developers and the other with team sizes of 10-19 developers.
Team size 6-9 developers Mil-Aero MBD Mil-Aero Not MBDDevel time Months 18.3 15.3 % behind schedule 20.8% 63.4% Months behind 4.3 4.1 Ave Delay Months 0.89 2.62 % cancelled 8.5% 15.4% Months lost to cancellation 5.9 5.0 SW Developers/proj 7.5 7.5 HW Developers/proj 4.1 6.3 Total project developers 11.6 13.8 Average Developer months/project 212.9 210.5 Developer months lost to schedule 10.3 36.1 Developer months lost to cancellation 5.8 10.6 Total developer months/ project 229.1 257.2 At $10,000/developer month Average developer cost/project $2,129,455 $2,105,469 Average cost to delay $103,481 $360,909 Total developer cost/project $2,232,935 $2,466,378 MBD Adv 10.5%
Table IV-2: Mil-Aero analysis for team size of 6-9 Developers
© 2010 American Technology International 18 of 28 Comparing Embedded Design Outcomes
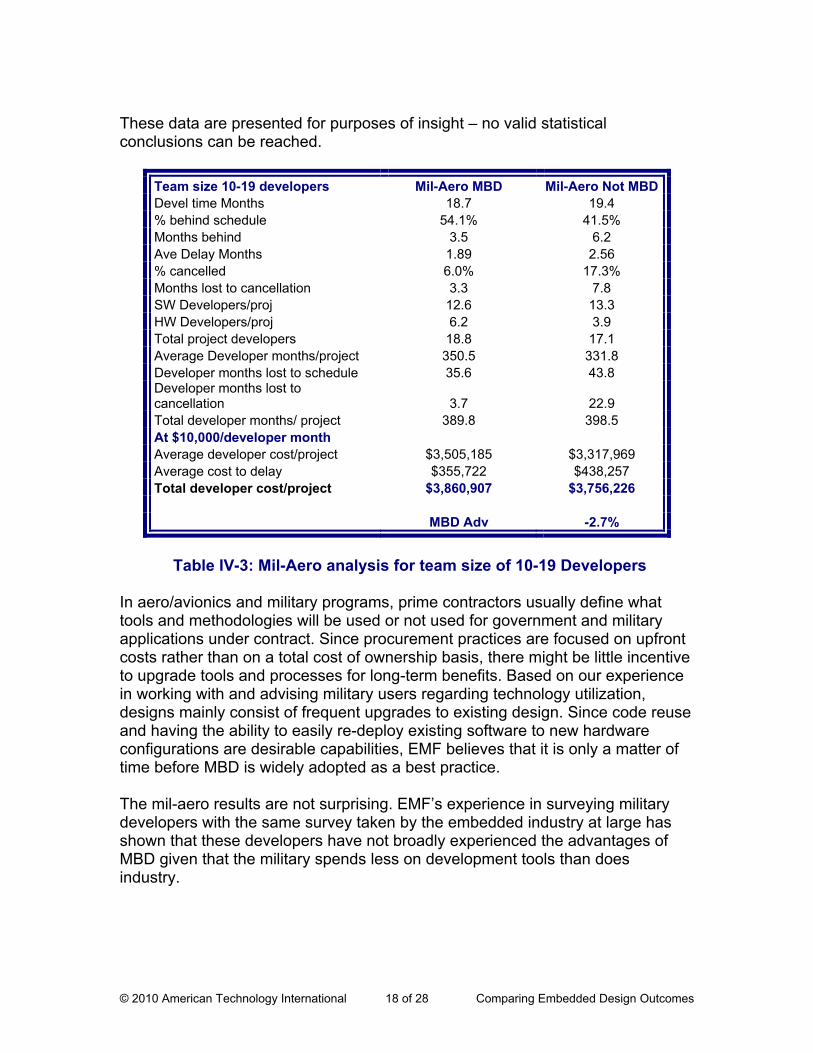
These data are presented for purposes of insight – no valid statistical conclusions can be reached.
Team size 10-19 developers Mil-Aero MBD Mil-Aero Not MBDDevel time Months 18.7 19.4 % behind schedule 54.1% 41.5% Months behind 3.5 6.2 Ave Delay Months 1.89 2.56 % cancelled 6.0% 17.3% Months lost to cancellation 3.3 7.8 SW Developers/proj 12.6 13.3 HW Developers/proj 6.2 3.9 Total project developers 18.8 17.1 Average Developer months/project 350.5 331.8 Developer months lost to schedule 35.6 43.8 Developer months lost to cancellation 3.7 22.9 Total developer months/ project 389.8 398.5 At $10,000/developer month Average developer cost/project $3,505,185 $3,317,969 Average cost to delay $355,722 $438,257 Total developer cost/project $3,860,907 $3,756,226 MBD Adv -2.7%
Table IV-3: Mil-Aero analysis for team size of 10-19 Developers In aero/avionics and military programs, prime contractors usually define what tools and methodologies will be used or not used for government and military applications under contract. Since procurement practices are focused on upfront costs rather than on a total cost of ownership basis, there might be little incentive to upgrade tools and processes for long-term benefits. Based on our experience in working with and advising military users regarding technology utilization, designs mainly consist of frequent upgrades to existing design. Since code reuse and having the ability to easily re-deploy existing software to new hardware configurations are desirable capabilities, EMF believes that it is only a matter of time before MBD is widely adopted as a best practice. The mil-aero results are not surprising. EMF’s experience in surveying military developers with the same survey taken by the embedded industry at large has shown that these developers have not broadly experienced the advantages of MBD given that the military spends less on development tools than does industry.
© 2010 American Technology International 19 of 28 Comparing Embedded Design Outcomes
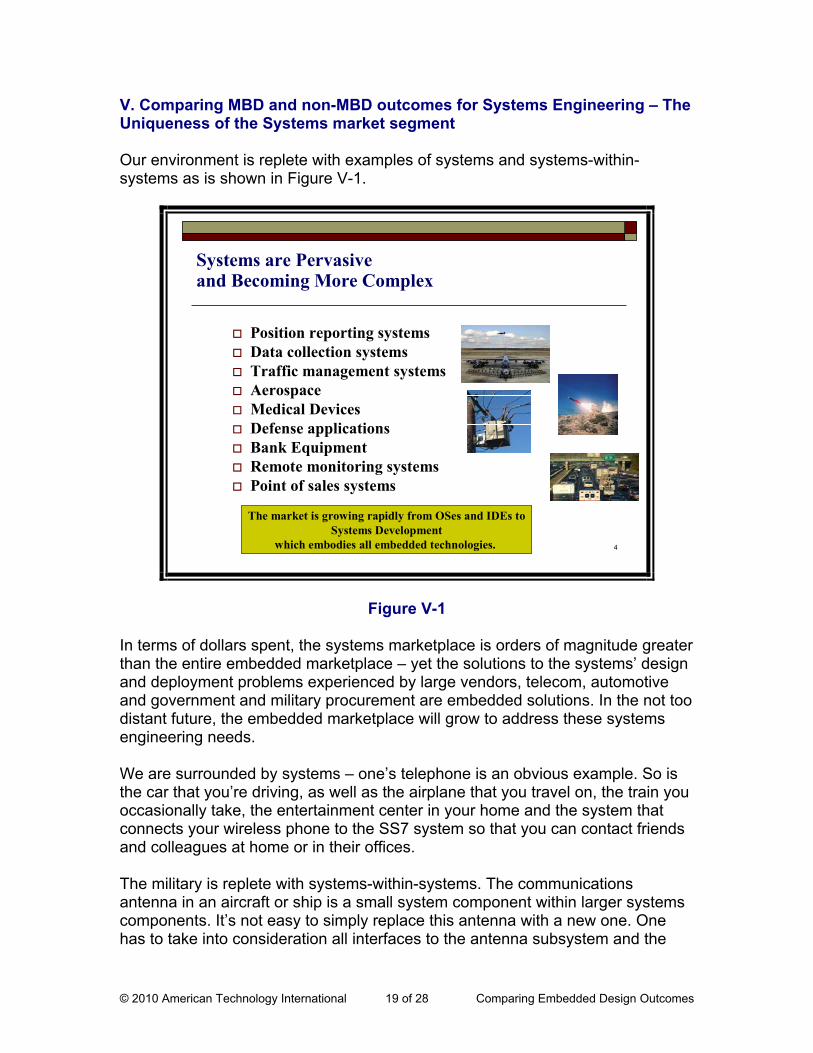
V. Comparing MBD and non-MBD outcomes for Systems Engineering – The Uniqueness of the Systems market segment Our environment is replete with examples of systems and systems-within-systems as is shown in Figure V-1.
4
Systems are Pervasiveand Becoming More Complex
Position reporting systemsData collection systemsTraffic management systemsAerospaceMedical DevicesDefense applicationsBank EquipmentRemote monitoring systemsPoint of sales systems
The market is growing rapidly from OSes and IDEs toSystems Development
which embodies all embedded technologies.
Figure V-1 In terms of dollars spent, the systems marketplace is orders of magnitude greater than the entire embedded marketplace – yet the solutions to the systems’ design and deployment problems experienced by large vendors, telecom, automotive and government and military procurement are embedded solutions. In the not too distant future, the embedded marketplace will grow to address these systems engineering needs. We are surrounded by systems – one’s telephone is an obvious example. So is the car that you’re driving, as well as the airplane that you travel on, the train you occasionally take, the entertainment center in your home and the system that connects your wireless phone to the SS7 system so that you can contact friends and colleagues at home or in their offices. The military is replete with systems-within-systems. The communications antenna in an aircraft or ship is a small system component within larger systems components. It’s not easy to simply replace this antenna with a new one. One has to take into consideration all interfaces to the antenna subsystem and the

© 2010 American Technology International 20 of 28 Comparing Embedded Design Outcomes
impact the replacement will have on the total systems operation. When an auto manufacturer wants to replace a component of, say, the powertrain controller, it would be desirable to have tools that could accommodate legacy software with the new changes – without having to rewrite the entire system (code reuse). What happens when a system’s underlying hardware needs replacement as busses and components are brought to end-of-life by suppliers? How can systems developers and architects redeploy tested and operational software in such cases and, perhaps, preserve intellectual property, and maintain backward compatibility? What if the original developers left the company decades ago and no one can locate – or understand – the documentation?
Software acquisition at the highest levels of the government represents the largest segment of the systems market. However government acquisition processes are fraught with waste. This represents a potentially significant opportunity for vendors who can deliver quality results on time. These concerns can be addressed by MBD today.
Witness the testimony of Michael J. Sullivan, Director Acquisition and Sourcing Management for the GAO to Congress (Committee on Oversight and Government Reform – House of Representatives) on April 29, 2008.
Investment in weapon acquisition programs is now at its highest level in two decades. The department expects to invest about $900 billion (fiscal year 2008 dollars) over the next 5 years on development and procurement with more than $335 billion invested specifically in major defense acquisition programs. Every dollar spent inefficiently in acquiring weapon systems is less money available for other budget priorities—such as the global war on terror and growing entitlement programs…
Our analysis shows that current programs are experiencing, on average, a 21-month delay in delivering initial capabilities to the warfighter, a 5-month increase over fiscal year 2000 programs...
At the program level, none of the weapon programs we assessed had proceeded through system development meeting the best practices standards for mature technologies, stable design, and mature production processes—all prerequisites for achieving planned cost, schedule, and performance outcomes. In addition, only a small percentage of programs used two key systems engineering tools—preliminary design reviews and prototypes to demonstrate the maturity of the product’s design by critical junctures…
In addition, we found four factors that have the potential to impact acquisition outcomes on individual programs: (1) unsettled requirements in acquisition programs can create significant turbulence including increased cost growth; (2) frequent program manager turnover during system development challenges continuity and accountability; (3) extensive reliance on contractors to perform roles that have in the past been performed by government employees raises questions about whether DOD has the appropriate mix of staff and capabilities within its workforce
© 2010 American Technology International 21 of 28 Comparing Embedded Design Outcomes
to effectively manage programs; and (4) difficulty managing software, as evidenced by changes to the amount of software that needs to be developed, indicates the potential for cost and schedule problems.”
It is interesting to note that systems engineering, requirements management and MBD tools provide an immediate solution to these four factors cited by Mr. Sullivan in the last paragraph.
1) Requirements management processes can effectively address this issue
2) MBD effectively addresses the lack of systems architects and provides traceability
3) MBD permits multiple participants (across the globe) to work on the same complex system while maintaining full management and responsibility assessments by senior managers
4) MBD is ideal for managing software development and deployment – and is essential when systems upgrades become necessary even decades after deployment
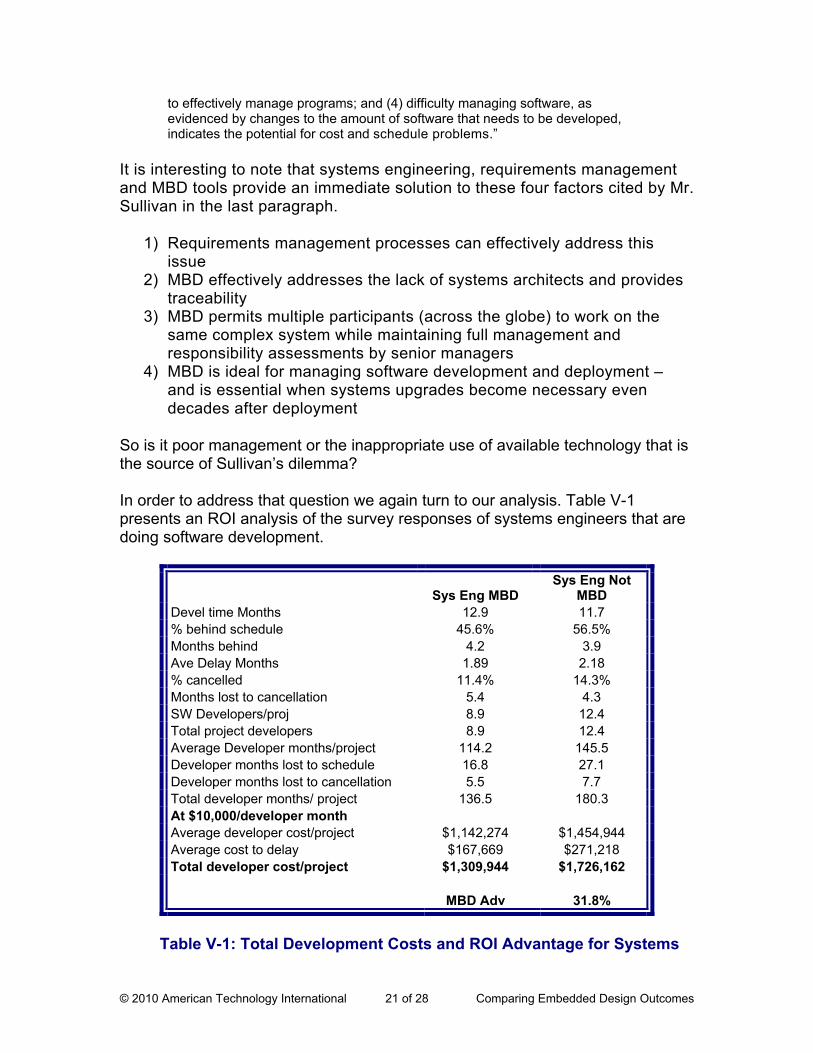
So is it poor management or the inappropriate use of available technology that is the source of Sullivan’s dilemma? In order to address that question we again turn to our analysis. Table V-1 presents an ROI analysis of the survey responses of systems engineers that are doing software development.
Sys Eng MBD Sys Eng Not
MBD Devel time Months 12.9 11.7 % behind schedule 45.6% 56.5% Months behind 4.2 3.9 Ave Delay Months 1.89 2.18 % cancelled 11.4% 14.3% Months lost to cancellation 5.4 4.3 SW Developers/proj 8.9 12.4 Total project developers 8.9 12.4 Average Developer months/project 114.2 145.5 Developer months lost to schedule 16.8 27.1 Developer months lost to cancellation 5.5 7.7 Total developer months/ project 136.5 180.3 At $10,000/developer month Average developer cost/project $1,142,274 $1,454,944 Average cost to delay $167,669 $271,218 Total developer cost/project $1,309,944 $1,726,162 MBD Adv 31.8%
Table V-1: Total Development Costs and ROI Advantage for Systems

© 2010 American Technology International 22 of 28 Comparing Embedded Design Outcomes
As the complexity and cost of systems has increased, the number of major new design starts has declined, as have the number of learning cycles available for critical staff. In addition, the social contract that created long tenured technical experts has expired, and professionals no longer expect to be with an employer for decades. As a result, the costs and risks associated with managing systems of systems over decades has become a major risk item in several verticals, and the impact of the risk is increasing. It is clear from Table V-1, that MBD provides systems developers a distinct advantage enabling fewer systems professionals to successfully address complex systems. The corporate response to this problem has been to push the risks downstream to customers. In the case of major telecom network operators, vendors have pushed this risk to the operators. In the case of aerospace systems, the prime contractors have pushed this risk to governments. To some extent, these customers have accepted these risks, and the related costs in part to enjoy the benefits of system-of-systems architecture, and in part because there has been no alternative. In addition, customers have recognized that the costs associated with these issues are real, and have (in some cases) accepted the costs and risks in order to avoid the financial ruin of the supplier base. However, these customers are vulnerable to being taken advantage of by their suppliers and prime contractors, who have significant leverage. The system-of-systems operator has a number of risks and dependencies. The legacy of prior selections of technology, interface standards, contractors, and other choices create a powerful incumbency. It can be very difficult to update a system of systems without the cooperation of the incumbent or legacy sources – unless, of course, the system, or system-within-systems, was designed using MBD.
© 2010 American Technology International 23 of 28 Comparing Embedded Design Outcomes
VI. Other Market Factors – Advantages of Adopting MBD as a Best Practice MBD has emerged as a preferred method for software design, deployment and maintenance. MBD enables the following advantages:
Code reuse Interoperability Easy code redeployment under frequent hardware changes necessitated
by processor end-of-life events Integrated documentation Enhanced design capabilities – better design outcomes The ability to integrate legacy code into a new format The ability to do systems level design – and systems within-systems
design and analysis In addition, MBD uniquely provides the following capabilities that non-MBD approaches do not:
Clear, traceable and testable Requirements Good Architectural Design Automatic code generation Rapid prototyping Effective Communications (worldwide) Automatic Documentation Graphical Design Reviews Evolving/Iterative Prototypes Executable Designs Effective Debugging Tools
Advances in MBD create an ability to import legacy code while at the same time generating documentation. Also, the unique ability of MBD level abstractions to be ported to Platform Independent Modules (PIMs) allows developed and tested software to be redeployed to new hardware configurations. This will provide solutions to some of the problems of systems complexity already addressed. Furthermore, MBD has the interesting ability to visually display critical interface information when a legacy system-within-system’s code is imported. Government and military programs will be able to use MBD to claim the intellectual property rights to interface parameters that otherwise would have accrued to the funded contractors that develop such systems. This will permit upgrades and component changes. We are at a unique time in the history of embedded developments wherein newer solutions to design complexity need to be addressed. Here are some of the challenges that MBD addresses.
© 2010 American Technology International 24 of 28 Comparing Embedded Design Outcomes
Developers are faced with increased design complexities, diminishing time-to-market requirements, familiar components being brought to end-of-life, and changing development processes and tool availability.
There is a need to deliver quality software on-time and within pre-design expectations - windows of opportunity are short and getting shorter. There is a major cost of being late to market.
COTS users (e.g., military, avionics, telecom, etc.) are learning that COTS availability is driven by a diminishing number of embedded vertical markets that continue to supply high performance components and boards as well as interconnect technologies. Chip and board manufacturers are moving to the high volume and lower quality processors used in consumer electronic devices that have very short life spans as compared to the long term needs of major systems deployment.
We are in a period of frequent hardware changes – components, processors and architectures – that necessitate either rewriting drivers or moving to an abstraction that supports target independence, then use automatic code generation to create the target code. With hardware changing every 18-36 months, the best solution is to either begin with MBD or use MBD to import legacy code that is abstracted for target independence.
EMF survey results show that the best design outcomes are those that have provided for code reuse – automotive, avionic and medical designs need to be upgradeable without the need for major re-coding.
With systems complexity increasing, the percent of project time and the percent of project costs consumed by testing are increasing. EMF has tracked and analyzed non-MBD developments with code based testing (Traditional), MBD developments with code based testing (Transitional), and MBD developments with model based testing (Enhanced). For Enhanced developments, EMF data shows a reduction in time-to-market, superior design outcomes, fewer behind schedule deliveries and reduced project time consumed by testing.
The largest segments of the embedded/enterprise marketplace are recognizing the importance of systems development and the required complexities of systems-within-systems that go far beyond current design and development processes. The latest advances in Eclipse-based OS agnostic IDEs, impressive as they are, cannot address the special considerations that systems and systems-within-systems programs demand.
There is a growing need for systems engineers to be able to work together on common designs within their most comfortable design environments. Hence C developers need to be able to work with OO developers without having to learn how to design within an OO environment, while continuing to maintain a cooperative design process.

© 2010 American Technology International 25 of 28 Comparing Embedded Design Outcomes
What is most important is that these challenges be met with a flexible solution that addresses each and all of these concerns. MBD provides long term ROI and significant design advantages. For example: More mastery – Developers can become skilled in one or two processes, but it is difficult to be fully proficient in more. MBD provides a comprehensive platform that is easy to learn and to use. Less downtime – Developers have fewer training classes to attend and fewer user manuals to consult More coherent vocabulary – Development teams that use MBD share a common language More skills portability – Developers who move from one project to another can participate more quickly when the new project’s processes are like the prior project; Using MBD increases the ability of a developer to transition smoothly Better focus – management focuses on product quality and staff quality, not on process management and churn

© 2010 American Technology International 26 of 28 Comparing Embedded Design Outcomes
Appendix ROI Calculations
Telecom/Datacom:
Tele-Datacom MBD Tele-Datacom Not MBDDevel time Months 12.8 13.7 % behind schedule 39.3% 47.0% Months behind 3.7 3.3 Ave Delay Months 1.46 1.56 % cancelled 9.8% 13.9% Months lost to cancellation 4.5 5.1 SW Developers/proj 13.7 25.2 HW Developers/proj 8.9 16.0 Total project developers 22.6 41.2 Average Developer months/project 289.4 563.6 Developer months lost to schedule 33.0 64.4 Developer months lost to cancellation 10.0 29.2 Total developer months/ project 332.4 657.2 At $10,000/developer month Average developer cost/project $2,894,006 $5,635,750 Average cost to delay $330,471 $644,111 Total developer cost/project $3,224,478 $6,279,861 MBD Adv 94.8%
© 2010 American Technology International 27 of 28 Comparing Embedded Design Outcomes
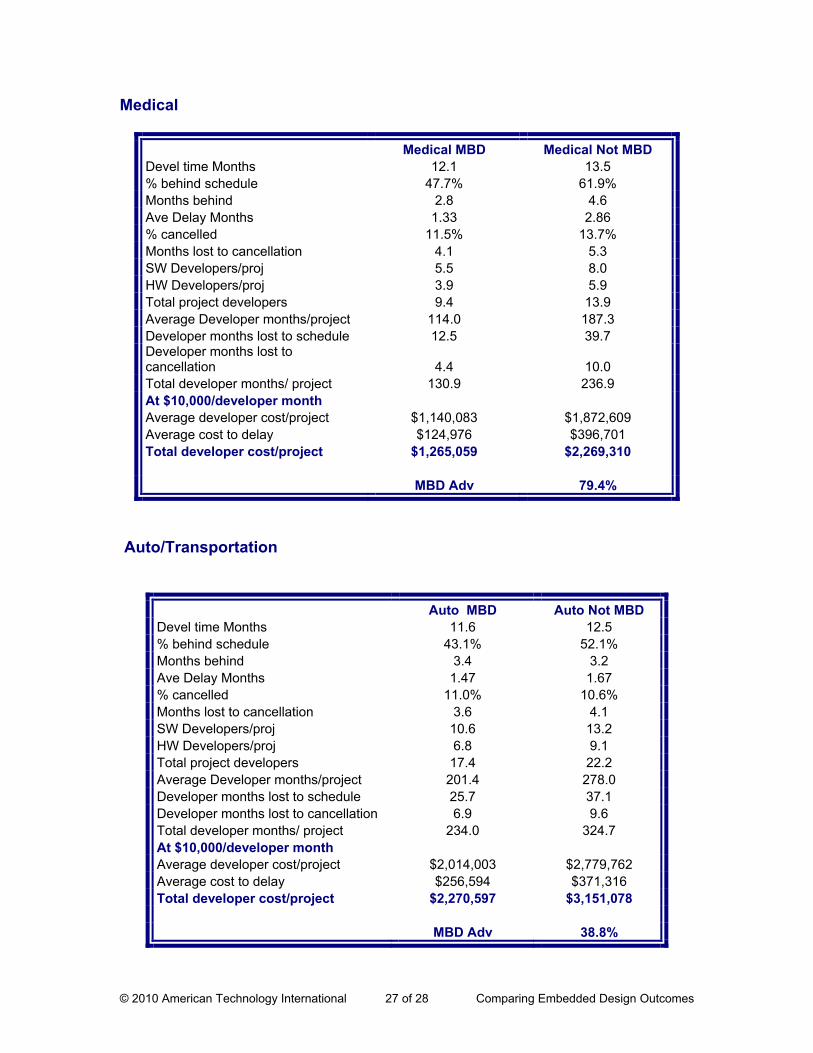
Medical
Medical MBD Medical Not MBD Devel time Months 12.1 13.5 % behind schedule 47.7% 61.9% Months behind 2.8 4.6 Ave Delay Months 1.33 2.86 % cancelled 11.5% 13.7% Months lost to cancellation 4.1 5.3 SW Developers/proj 5.5 8.0 HW Developers/proj 3.9 5.9 Total project developers 9.4 13.9 Average Developer months/project 114.0 187.3 Developer months lost to schedule 12.5 39.7 Developer months lost to cancellation 4.4 10.0 Total developer months/ project 130.9 236.9 At $10,000/developer month Average developer cost/project $1,140,083 $1,872,609 Average cost to delay $124,976 $396,701 Total developer cost/project $1,265,059 $2,269,310 MBD Adv 79.4%
Auto/Transportation
Auto MBD Auto Not MBD Devel time Months 11.6 12.5 % behind schedule 43.1% 52.1% Months behind 3.4 3.2 Ave Delay Months 1.47 1.67 % cancelled 11.0% 10.6% Months lost to cancellation 3.6 4.1 SW Developers/proj 10.6 13.2 HW Developers/proj 6.8 9.1 Total project developers 17.4 22.2 Average Developer months/project 201.4 278.0 Developer months lost to schedule 25.7 37.1 Developer months lost to cancellation 6.9 9.6 Total developer months/ project 234.0 324.7 At $10,000/developer month Average developer cost/project $2,014,003 $2,779,762 Average cost to delay $256,594 $371,316 Total developer cost/project $2,270,597 $3,151,078 MBD Adv 38.8%

© 2010 American Technology International 28 of 28 Comparing Embedded Design Outcomes
Industrial Automation
Industr Auto MBD Industr Auto Not
MBD Devel time Months 11.6 11.1 % behind schedule 41.5% 55.5% Months behind 3.8 3.1 Ave Delay Months 1.57 1.70 % cancelled 10.7% 9.3% Months lost to cancellation 4.4 4.0 SW Developers/proj 8.0 7.0 HW Developers/proj 4.2 5.5 Total project developers 12.2 12.5 Average Developer months/project 141.4 138.1 Developer months lost to schedule 19.2 21.2 Developer months lost to cancellation 5.7 4.7 Total developer months/ project 166.3 164.0 At $10,000/developer month Average developer cost/project $1,414,075 $1,380,662 Average cost to delay $191,707 $212,385 Total developer cost/project $1,605,783 $1,593,047 MBD Adv -0.8%