comparing national responses to climate change: networks...
TRANSCRIPT

Panel Report onComparing National Responses to
Climate Change: Networks of Debate and Contention
AAAS Annual Meeting
Friday, February 18, 2011: 1:30 PM-4:30 PM

Panelists Jeffrey P. Broadbent, University of Minnesota , USA
Comparing National Responses to Climate Change: Networks, Discourse, and Action
Dana R. Fisher, University of Maryland , USAUnderstanding Political Discourse on Climate Change in U.S. Congressional Hearings
Sony Pellissery, Institute of Rural Management , IndiaContestations on Climate Science in the Development Context: The Case of India
Sun-Jin Yun, Seoul National University, South Korea Climate Change Media Debates in Korea
Koichi Hasegawa, * Tohoku University, Japan Japan's Climate Change Media Coverage and Politics in 2007, 2008, and 2009
Jun Jin, ** Tsinghua University, China Role of Chinese Environmental Non-Governmental Organizations in International Talks
Levania Santoso, *** Center for International Forestry Research, IndonesiaREDD+ politics in the media: a case study from Indonesia
_____________________________________________________________________*Could not attend due to medical issue. Broadbent will present Japan case.** Could not attend due to visa problem. Presentation is cancelled.***New member of panel.
Comparing National Responses to Climate Change:
Networks, Discourse and Action
• Jeffrey P. Broadbent, University of Minnesota , USA
• And Project teams worldwide

Our Common Experiment• Climate change creates global experiment.
• Why are nations responding so differently?
• Mitigate (Reduce GHG emissions), ignore, (adapt)
• Due to differences in evaluation and action
Common
Stimulus:
Intensifying
Climate
Change
Variation in
Responses:
Policies.
GHG Trends
Causal Factors
Evaluation
And Action
@Title of book in preparation
@
Compon Project
• Comparing Climate Change Policy Networks
• Ultimate goal is to explain:
–What causal factors cause variation
– in national evaluation of and action on CC
– resulting in different national policies on CC and
–national greenhouse gas (GHG) emissions trends
Midway Goals
• National policy-making systems very complex:
• Analysis of policy-making processes
• require knowing details of:
–national debates (discourse) on CC
– in national political activity around CC
• Probe the body politic
• to trace and compare response processes

Probing the Body Politic• Climate Change impacts national cases• Case-specific national discourse evaluates issue• Case-specific political action empowers evaluations• These interact to produce different policies• Increasing, stable or decreasing emissions trends.• Impact emerging international agreementscycle
Climate
ChangeEmissions
TrendsPolitical Action
(Empowerment)
Discourse
(Evaluation)
Case & Conditions
Emerging
International
Regime
Policies
Phase One—Current Phase
Methods
• Research Design: Cross-National Comparison
–Quasi-experimental design
– Internal political processes (outside influence)
–17+ cases of national level politics on CC
–Background variablesprocess differences
–Outcome variance: policies, emissions trends.
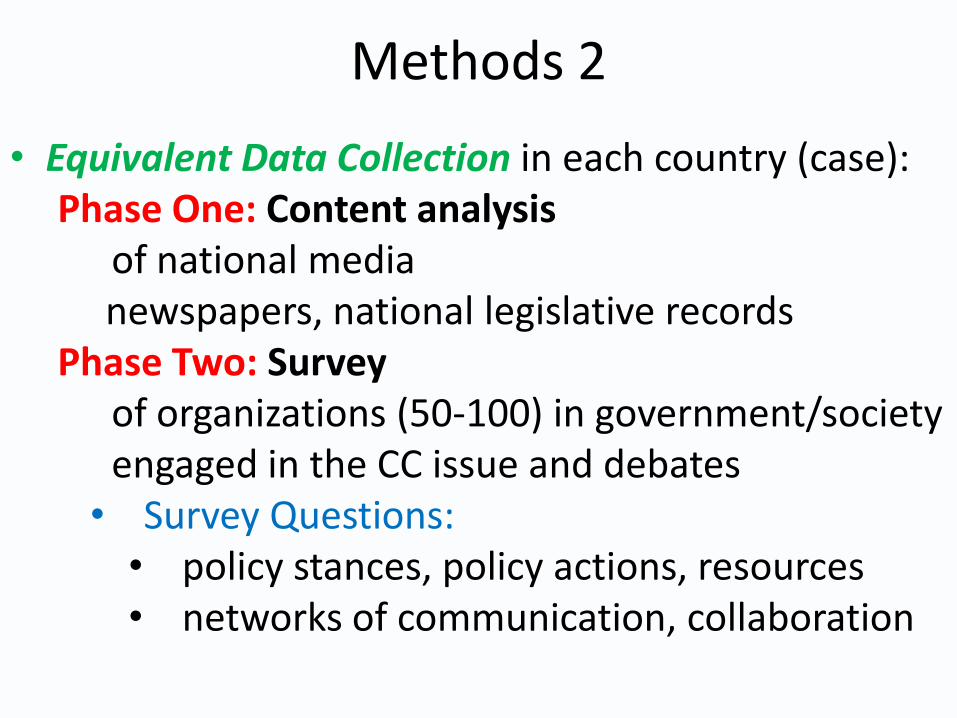
Methods 2
• Equivalent Data Collection in each country (case): Phase One: Content analysis
of national media newspapers, national legislative records
Phase Two: Survey of organizations (50-100) in government/society engaged in the CC issue and debates
• Survey Questions: • policy stances, policy actions, resources• networks of communication, collaboration
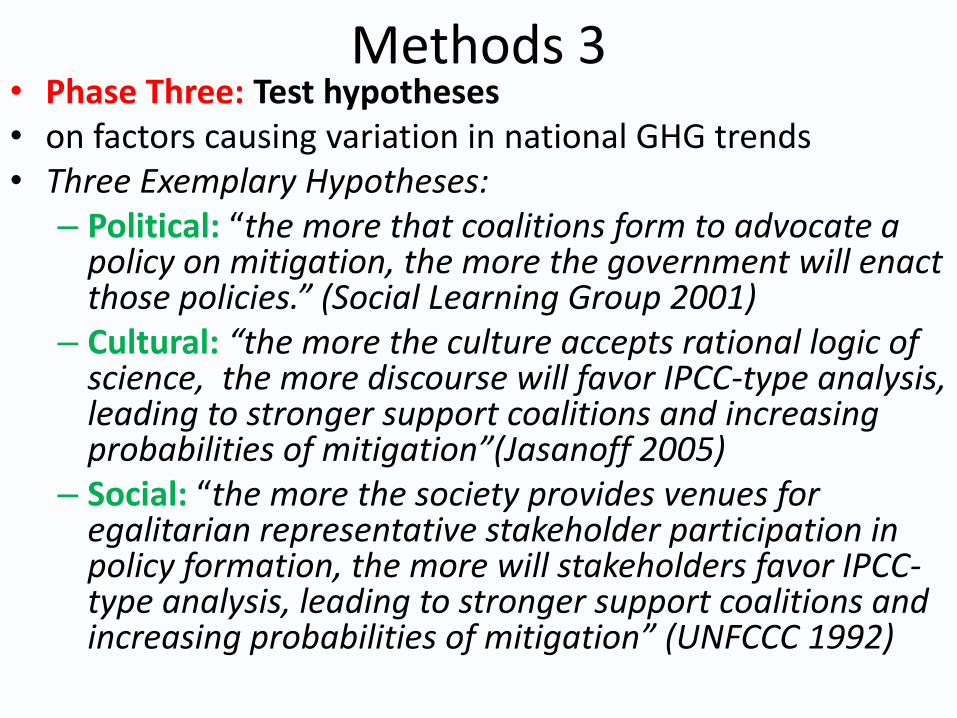
Methods 3• Phase Three: Test hypotheses • on factors causing variation in national GHG trends• Three Exemplary Hypotheses:
– Political: “the more that coalitions form to advocate a policy on mitigation, the more the government will enact those policies.” (Social Learning Group 2001)
– Cultural: “the more the culture accepts rational logic of science, the more discourse will favor IPCC-type analysis, leading to stronger support coalitions and increasing probabilities of mitigation”(Jasanoff 2005)
– Social: “the more the society provides venues for egalitarian representative stakeholder participation in policy formation, the more will stakeholders favor IPCC-type analysis, leading to stronger support coalitions and increasing probabilities of mitigation” (UNFCCC 1992)

This Panel
• Reports on interim results for
– for Phase One data only.
• Content analysis of national media
– newspapers, national legislative records
• To understand differences in national discourse
• And in persons and organizations being cited.
• Mainly descriptive analysis
– Not yet in hypothesis testing stage.

Outcomes
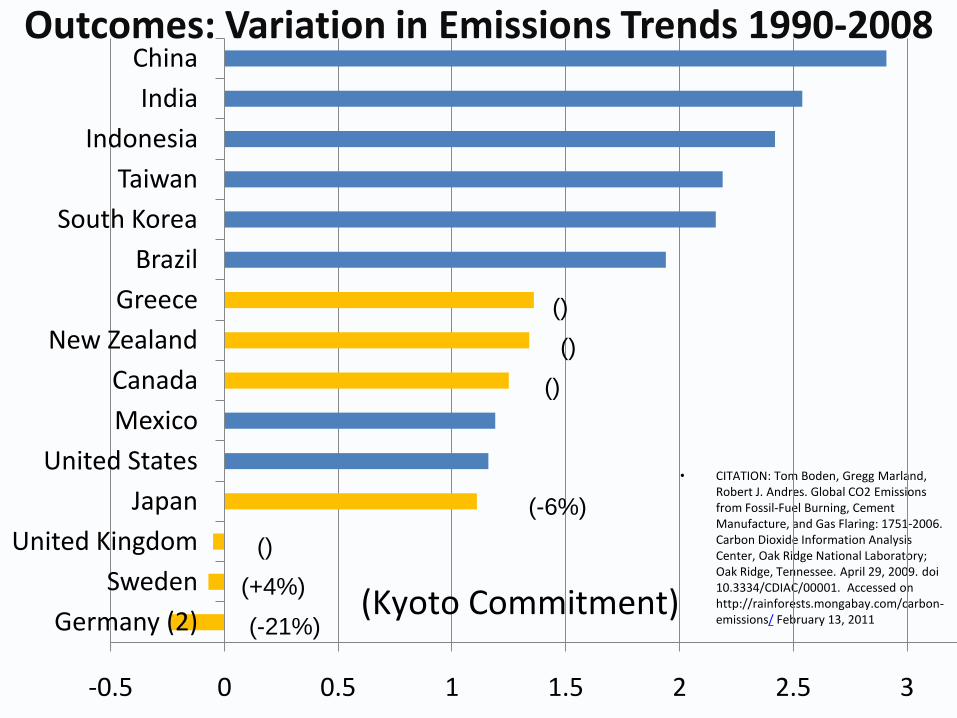
Outcomes: Variation in Emissions Trends 1990-2008
• CITATION: Tom Boden, Gregg Marland, Robert J. Andres. Global CO2 Emissions from Fossil-Fuel Burning, Cement Manufacture, and Gas Flaring: 1751-2006. Carbon Dioxide Information Analysis Center, Oak Ridge National Laboratory; Oak Ridge, Tennessee. April 29, 2009. doi10.3334/CDIAC/00001. Accessed on http://rainforests.mongabay.com/carbon-emissions/ February 13, 2011
-0.5 0 0.5 1 1.5 2 2.5 3
Germany (2)
Sweden
United Kingdom
Japan
United States
Mexico
Canada
New Zealand
Greece
Brazil
South Korea
Taiwan
Indonesia
India
China
(Kyoto Commitment)(-21%)
(+4%)
()
(-6%)
()
()
()
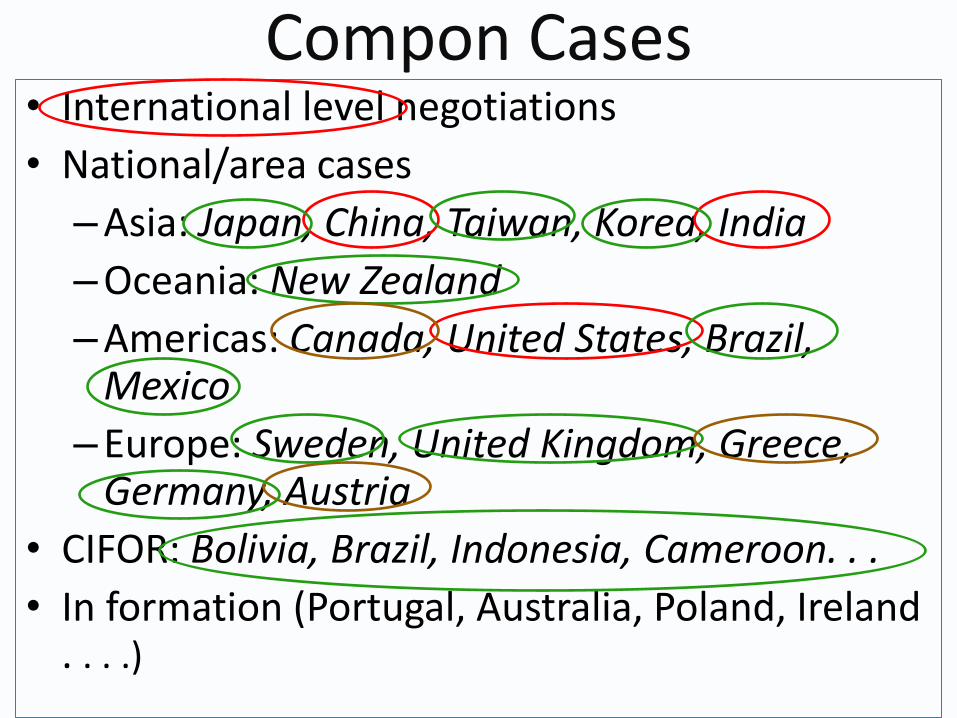
Compon Cases• International level negotiations
• National/area cases
–Asia: Japan, China, Taiwan, Korea, India
–Oceania: New Zealand
–Americas: Canada, United States, Brazil, Mexico
–Europe: Sweden, United Kingdom, Greece, Germany, Austria
• CIFOR: Bolivia, Brazil, Indonesia, Cameroon. . .
• In formation (Portugal, Australia, Poland, Ireland . . . .)
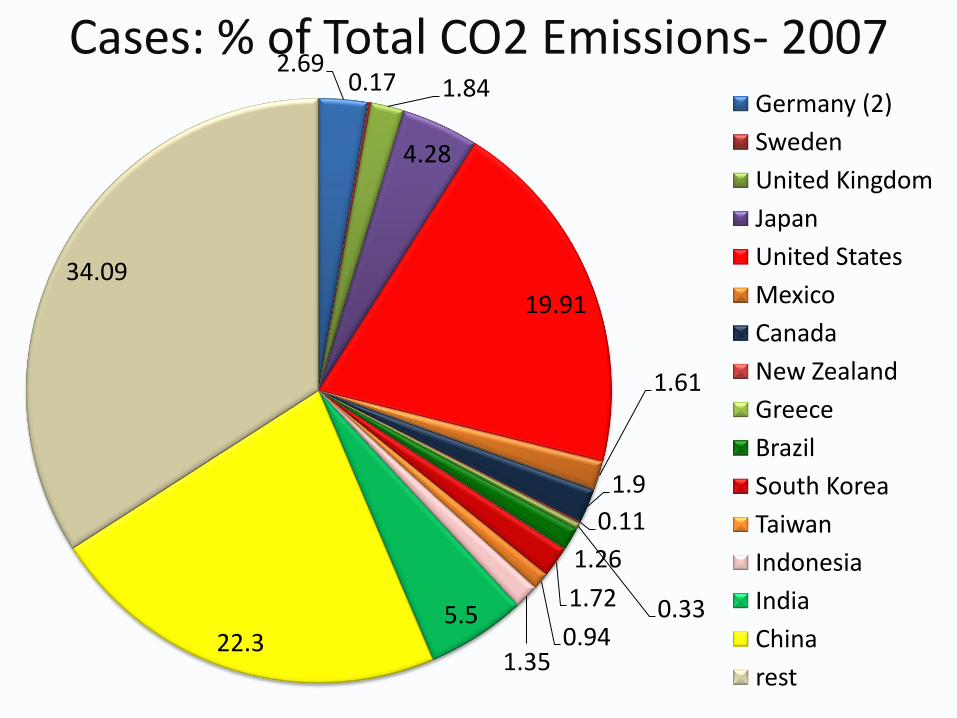
Cases: % of Total CO2 Emissions- 2007 2.69
0.17 1.84
4.28
19.91
1.61
1.9
0.11
0.33
1.26
1.72
0.941.35
5.522.3
34.09
Germany (2)
Sweden
United Kingdom
Japan
United States
Mexico
Canada
New Zealand
Greece
Brazil
South Korea
Taiwan
Indonesia
India
China
rest
Phase One: Media Discourse Analysis

Phase One: Media Discourse
• Current panel presents Phase One analysis• Content analysis of: • Newspapers, legislative records
–L1: Media attention to CC • (1997-2009)
–L2: Evaluation of CC in media • (2007-2008)
–L3: Actors and positions cited in media• (2007-2008)

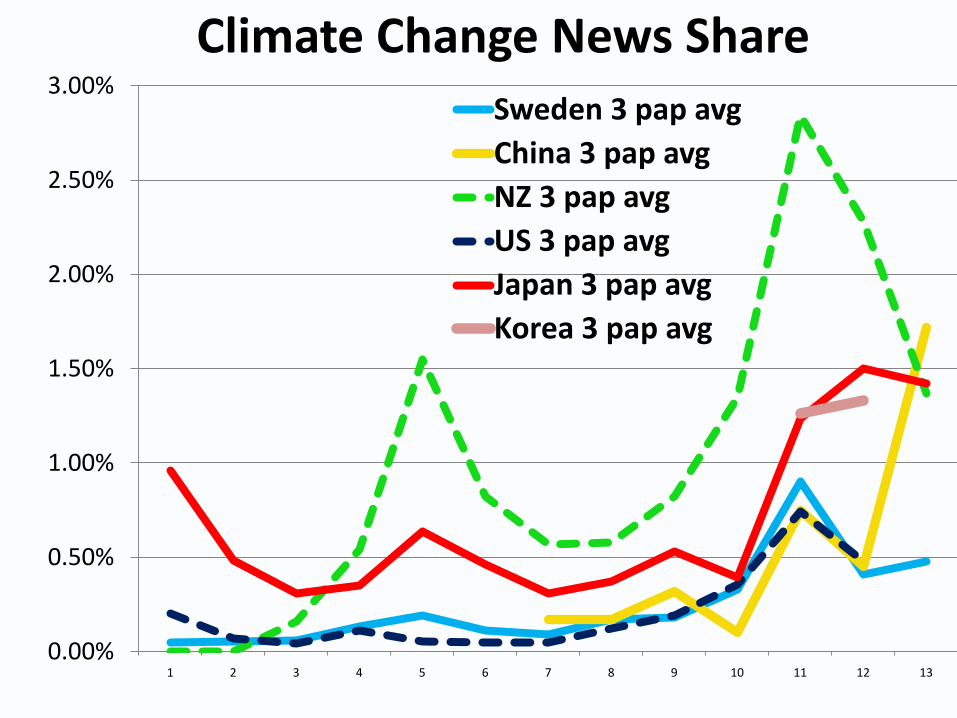
L1: Media attention to CC (1997-2009)
• Articles per Year mentioning the key words
–Climate Change/Global Warming
• Raw numbers per year
– These affected by size of newspapers.
• Better measure:
• News Share of articles per year=
–Number of CC/GW articles/total no. of articles

0
1000
2000
3000
4000
5000
6000
7000
19
97
19
98
19
99
20
00
20
01
20
02
20
03
20
04
20
05
20
06
20
07
20
08
20
09
Articles per Year on CC/GW by Country
Japan
UK
Greece
Taiwan
Korea
New Zea*
Germany*
Brazil*
Sweden
India
US
Russia
China*
2007:IPCC 4th Assessment Report
IPCC and Al Gore receive Nobel Peace Prize
1997: COP3 - Kyoto Protocol
Adopted
2001: IPCC 3rd Assessment
Report
0.00%
0.50%
1.00%
1.50%
2.00%
2.50%
3.00%
1 2 3 4 5 6 7 8 9 10 11 12 13
Climate Change News Share
Sweden 3 pap avg
China 3 pap avg
NZ 3 pap avg
US 3 pap avg
Japan 3 pap avg
Korea 3 pap avg
0.00%
0.20%
0.40%
0.60%
0.80%
1.00%
1.20%
1.40%
1.60%
1.80%
2.00%
1997 1998 1999 2000 2001 2002 2003 2004 2005 2006 2007 2008 2009
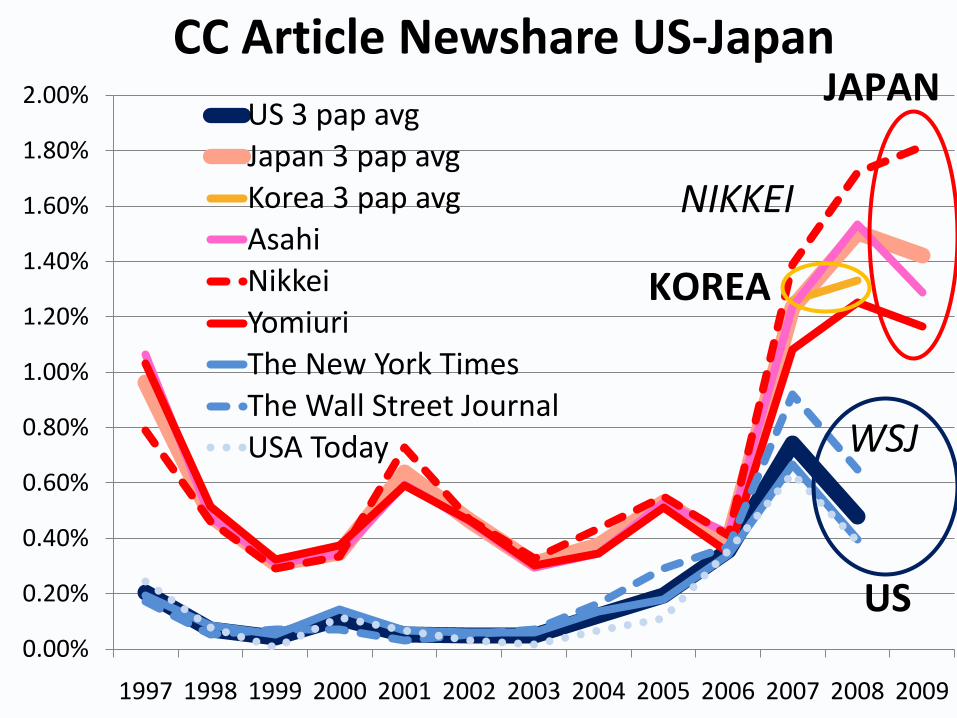
CC Article Newshare US-Japan
US 3 pap avg
Japan 3 pap avg
Korea 3 pap avg
Asahi
Nikkei
Yomiuri
The New York Times
The Wall Street Journal
USA Today
US
JAPAN
KOREA
NIKKEI
WSJ

L2: Evaluation of CC in Media (2007-2008)
• Readers code articles
• Assessment of inter-coder reliability
• Coding variables
• Major topic (6)
• Public Debates
• Policy Bills
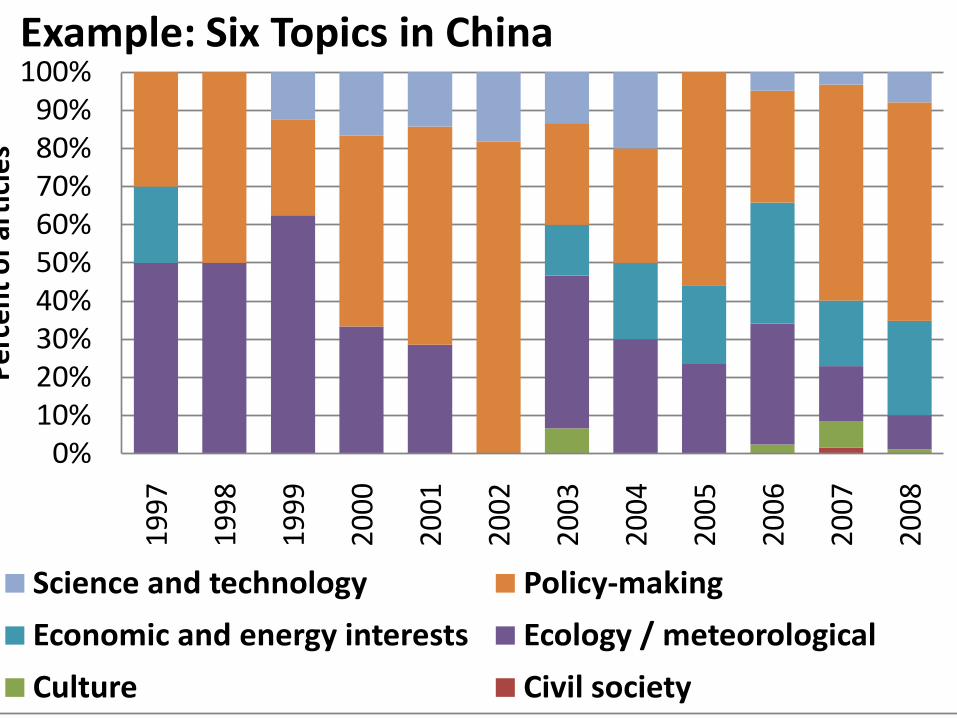
Example: Six Topics in China
0%10%20%30%40%50%60%70%80%90%
100%
1997
1998
1999
2000
2001
2002
2003
2004
2005
2006
2007
2008
Per
cen
t o
f ar
ticl
esExample: Six Topics in China
Science and technology Policy-making
Economic and energy interests Ecology / meteorological
Culture Civil society
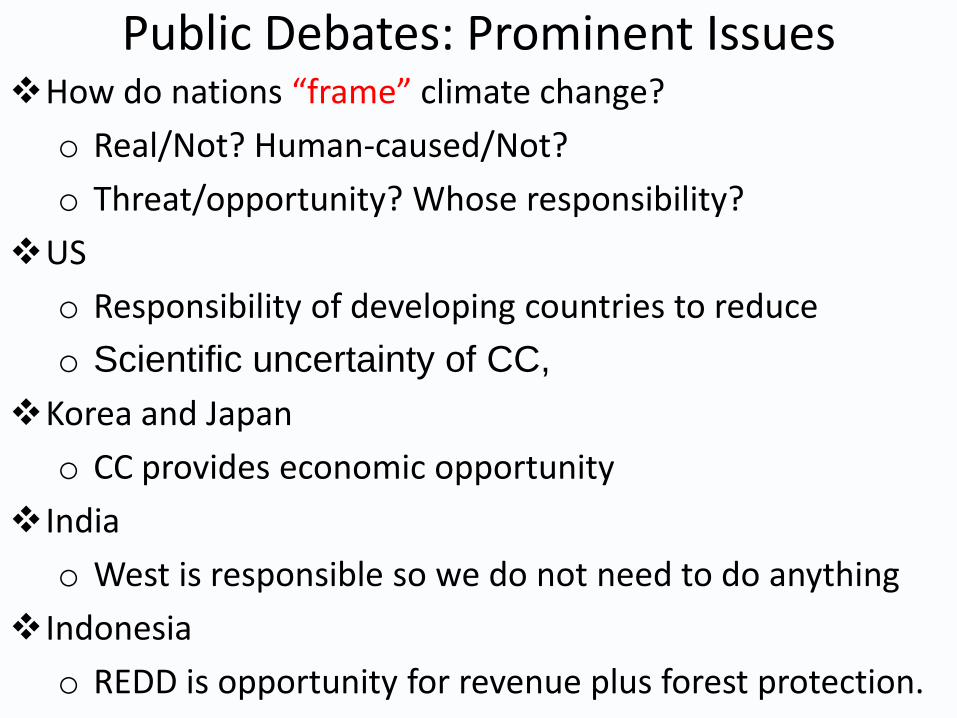
Public Debates: Prominent IssuesHow do nations “frame” climate change?
o Real/Not? Human-caused/Not?
o Threat/opportunity? Whose responsibility?
US
o Responsibility of developing countries to reduce
o Scientific uncertainty of CC,
Korea and Japan
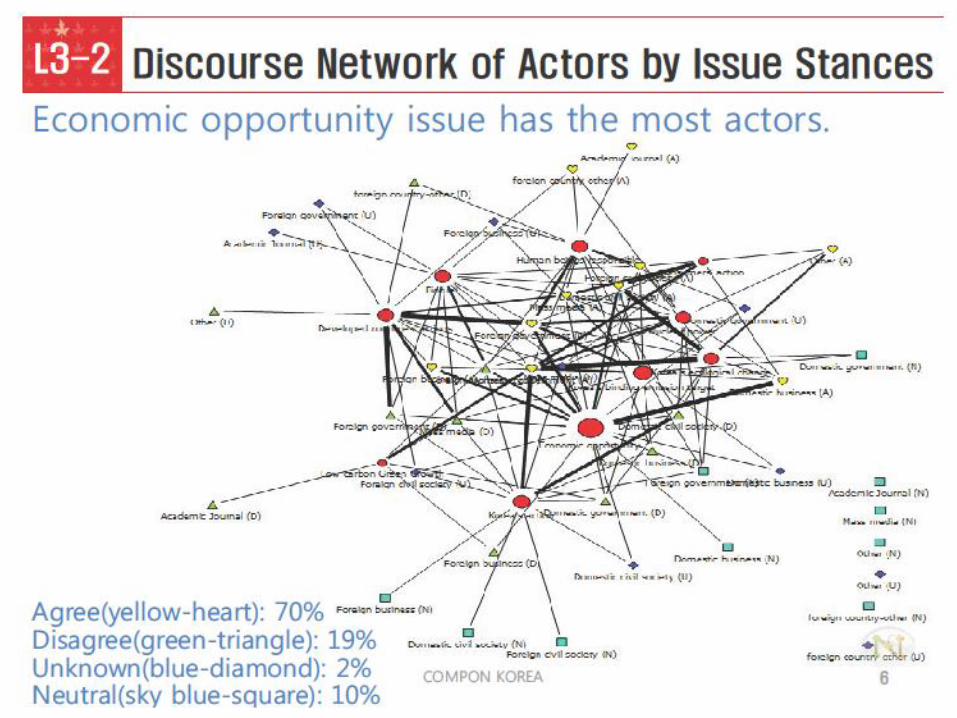
o CC provides economic opportunity
India
o West is responsible so we do not need to do anything
Indonesia
o REDD is opportunity for revenue plus forest protection.
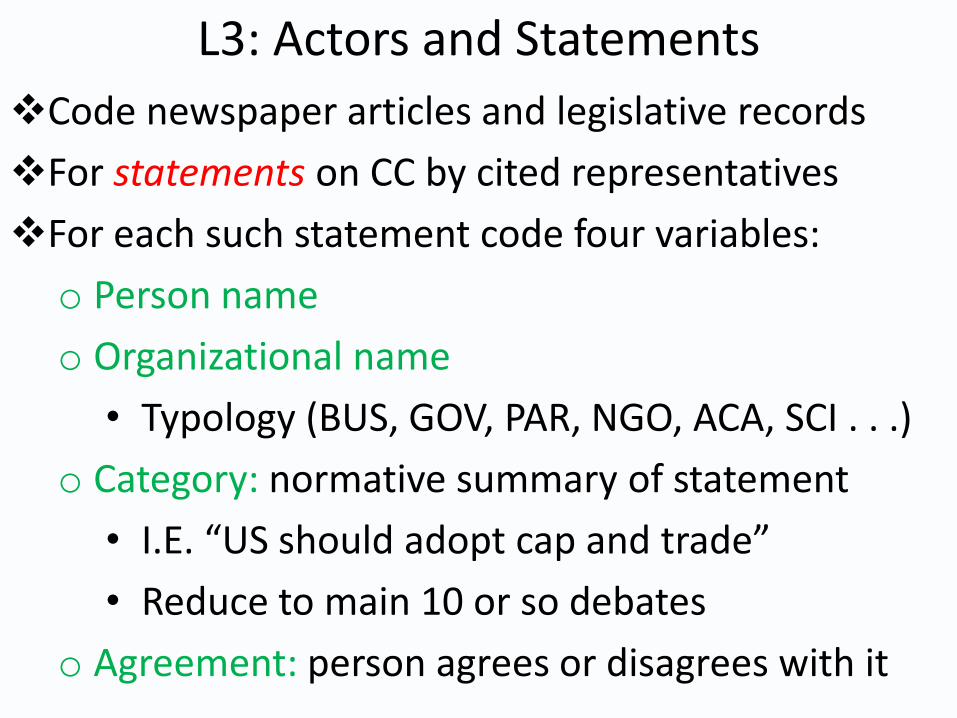
L3: Actors and Statements
Code newspaper articles and legislative records
For statements on CC by cited representatives
For each such statement code four variables:
o Person name
o Organizational name
• Typology (BUS, GOV, PAR, NGO, ACA, SCI . . .)
o Category: normative summary of statement
• I.E. “US should adopt cap and trade”
• Reduce to main 10 or so debates
o Agreement: person agrees or disagrees with it

Schematic: Network Representation
ACA
NGO
PAR
BUS
Category A: US should
adopt cap and trade
Category B: US should
use nuclear energy to
reduce GHG emissions
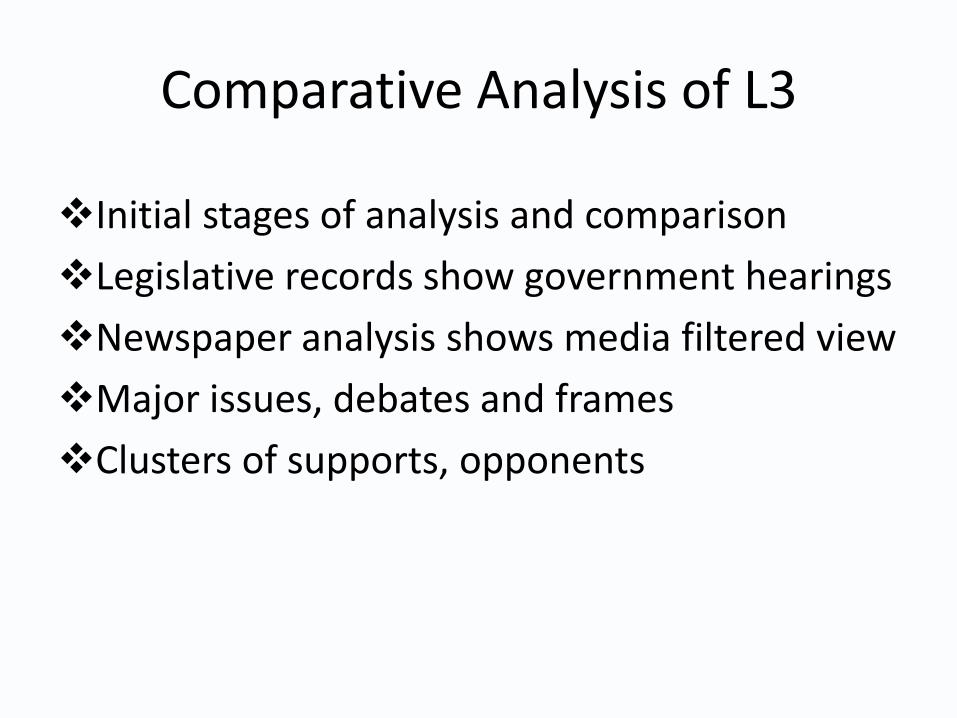
Comparative Analysis of L3
Initial stages of analysis and comparison
Legislative records show government hearings
Newspaper analysis shows media filtered view
Major issues, debates and frames
Clusters of supports, opponents
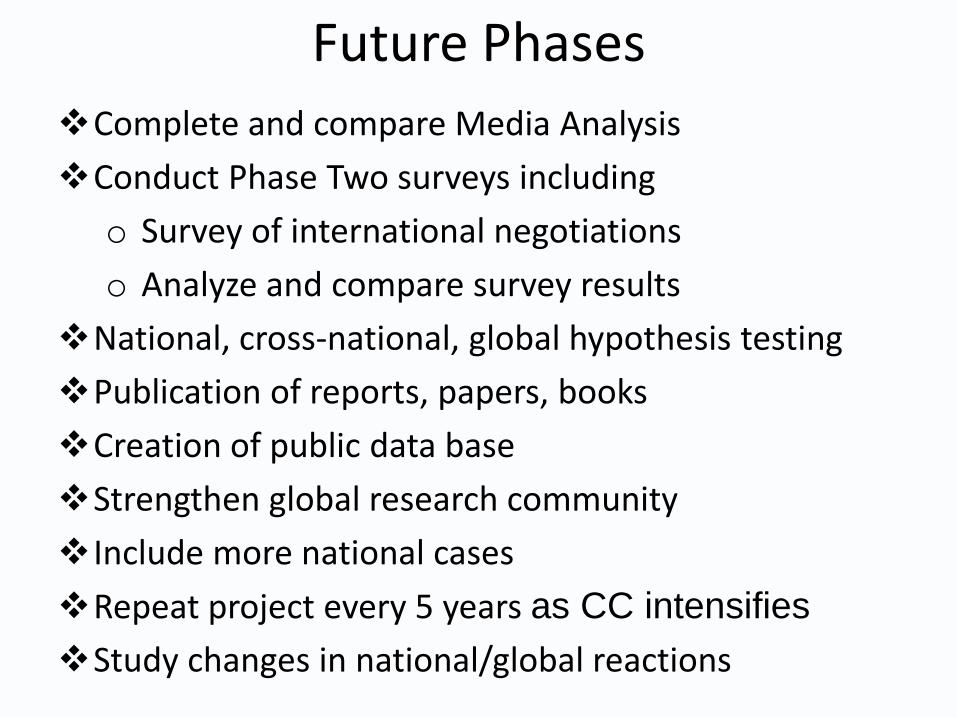
Future Phases
Complete and compare Media Analysis
Conduct Phase Two surveys including
o Survey of international negotiations
o Analyze and compare survey results
National, cross-national, global hypothesis testing
Publication of reports, papers, books
Creation of public data base
Strengthen global research community
Include more national cases
Repeat project every 5 years as CC intensifies
Study changes in national/global reactions

End