comparing reasenberg and gruenthal declustering methods ... · pdf filecomparing reasenberg...
TRANSCRIPT

1
COMPARING REASENBERG AND GRUENTHAL DECLUSTERING METHODS FOR NORTH OF IRAN
Hamideh Amini 1
ABSTRACT
There are different methods for declustering a catalog and uniform it. Reasenberg and Gruenthal were known as methods which generate a catalog with maximum and minimum number of events, respectively. In this article, two seismotectonic region Kopeh-Dagh and Alborz-Azarbayjan in north of Iran are selected to compare these two methods on them in period of 550 B.C. to 2006. Minimum magnitude in both methods is 4.0 but maximum magnitude is 7.8 and 7.6 for Alborz-Azarbayjan and Kopeh-Dogh, respectively. Despite of differences maximum magnitude, there are approximately same threshold of magnitude in using both algorithms. The total threshold of magnitude in north of Iran earthquakes for 5.5, 5.0, 4.5 and 4 (or less than 4) is around 1925, 1963, 1975 and 2000, respectively.
1. Introduction
According to GPS measurements, there are high seismic activities in the Middle East region; it is partially influenced by the continental convergence and active crustal shortening between the African, Arabian, and the Indian plate to the northward with respect to the Eurasian plate (Figure 1).
Using a complete catalog is the most important factor to determine seismic hazard analysis in each region. For preparing a uniform catalog, all earthquakes for a region which recorded by different centers should be collected. After uniform magnitudes and method for omitting duplicate, foreshock and aftershocks are the most effective factor in final conclusion for that region.
There are four basic methods, Gardner-Knopoff (1974), Gruenthal (pers. Comm.), Reasenberg (1985), and Uhrhamer (1986), for declustering a catalog. In each method, different range of distance and time is considered; Default standard parameter values of Reasenberg's algorithm (1985) is represented in table (1). An approximation of the windows sizes according to Gardner and Knopoff (1974), Gruenthal (pers.comm.) and Uhrhammer (1986) is shown in table (2).
After declustering with these methods, maximum and minimum number of remind events belong to Reasenberg and Gruenthal, respectively. In this article, both Reasenberg and Gruenthal are selected for checking declustering and result of it. Table 1. The standard input parameters for declustering algorithm by Reasenberg (1985), where τmin is the minimum value of the look-ahead time for building clusters when the first event is not clustered,
τmax is the maximum value of the look-ahead time for building clusters, P1 is the probability of detecting the next clustered event used to compute the look-ahead time, τ, xk is the increase of the lower cut-off magnitude during clusters: xmeff = xmeff + xkM, where M is the magnitude of the
1 PHD student, International Institute of Earthquake Engineering and Seismology (IIEES), Tehran, Iran, [email protected]

2
largest event in the cluster, xmeff is the effective lower magnitude cutoff for catalog, rfact is the number of crack radii surrounding each earthquake within new events considered to be part of the
cluster (Stiphout, 2012).
Parameter Standard Simulation range
Min Max
τmin [days] 1 0.5 2.5
τmax [days] 10 3 15
P 0.95 0.9 0.99
xmeff 4.0 0 1
xk 0.5 1.6 1.8
rfact 10 5 20
Table 2. An approximation of the windows sizes which is considered by Gardner and Knopoff (1974), Gruenthal (pers.comm.) and Uhrhammer (1986).
Method Distance (km) Time (days)
Gardner and Knopoff (1974)
983.01238.010 M
7389.2032.010 M, if M ≥ 6.5
547.05409.010 M, else
Gruenthal (pers.comm.)
2)02.1037.0(77.110 M
2)32.1762.0(95.3 Me
, if M ≥ 6.5 M024.08.210
, else Uhrhammer
(1986) Me 804.0024.1
Me 235.187.2
2. Dataset
In this investigation, Middle East catalog from GEM (Global Earth Model) and EMME (Earthquake Model of the Middle East) project which compiled all historical and instrumental events in Middle East is used (Zare et al., 2013). From this catalog, Alborz-Azerbaijan and Kopeh-Dagh, two seismotectonic zone of seismotectonic map of Iran prepared by Mirzaei et al. (1998) in north of Iran, including historical and instrumental recorded events from 1250 B.C. through 2006, were selected. By selecting these two subregions, result of declustering for them is comparing together. Both methods apply for these regions and moreover; the number of events after declustering, and result in range of magnitudes and magnitude completeness (Mc) of them will be presented in this article.

H. Amini 3
Figure 1. Horizontal velocity field for a major part of Alpine-Himalayan chain. The blue vectors are by McClusky et al. (2000) and the red vectors are by Wang et al. (2001). The black vectors are by Vernant et al. (2004). The white vectors are the Nuvel1-A plate velocity model by DeMets et al.
(1994) (According to Tavakoli, 2007).
3. Region Location
Iran is part of continental convergence between the African, Arabian, and the Indian plate to the northward with respect to the Eurasian plate; then there are high seismic activities in this region. From this region, north part of it consists of Alborz-Azerbaijan and Kopeh-Dagh seismotectonic zone, which have maximum and minimum number of events, respectively, were considered. The considered region in this article covers a quadrangle limited by 35˚N to 41˚N and 43˚E to 62˚E (figure 2). Before declustering, the number of events in Alborz-Azerbaijan (3946) is more than Kopeh-Dagh (311).
Figure 2. Boundaries of region.

4
4. Declustering Catalog
Each catalog needs to omit duplicate events, aftershocks and foreshocks. On the other hand, main shocks should be separated for using in final catalog. In this article, Stefan Wiemer's ZMAP package (Weimer, 2001) for MATLAB was used to decluster the catalog by Reasenberg and Gruenthal algorithm. Each algorithm considers different time and distance range for declustering, as is presented in table (1) and (2).
4.1. Number of events
The Middle East catalog, after declustering by Gruenthal (pers.comm.) and Reasenberg (1985) algorithms contain 7272 and 24530 events, respectively (table 3). The cumulative frequency of each algorithm is presented in figure (3). After declustering, Alborz-Azerbaijan and Kopeh-Dagh include 1251 and 195 events with using Gruenthal method and 3437 and 298 events with using Reasenberg method. Results of number of events show that by using Reasenberg we will have more number of events than Gruenthal method. Table 3. Number of events in different method in Zmap Software; by using each method, we can have
different number of events in final catalog.
Type of Method Number of events
Number of clusters
Number of event in final catalog
Number of event out of catalog
Reseanberg, 1985 28244
1041 24530 4575
Gruenthal, pers.comm. 2960 7272 20792
Figure 3. Cumulative frequency number distributions plots after declustering using each of the
methods; (a) Grunthal method, (b) Reseanberg method.
4.2. Magnitude of events
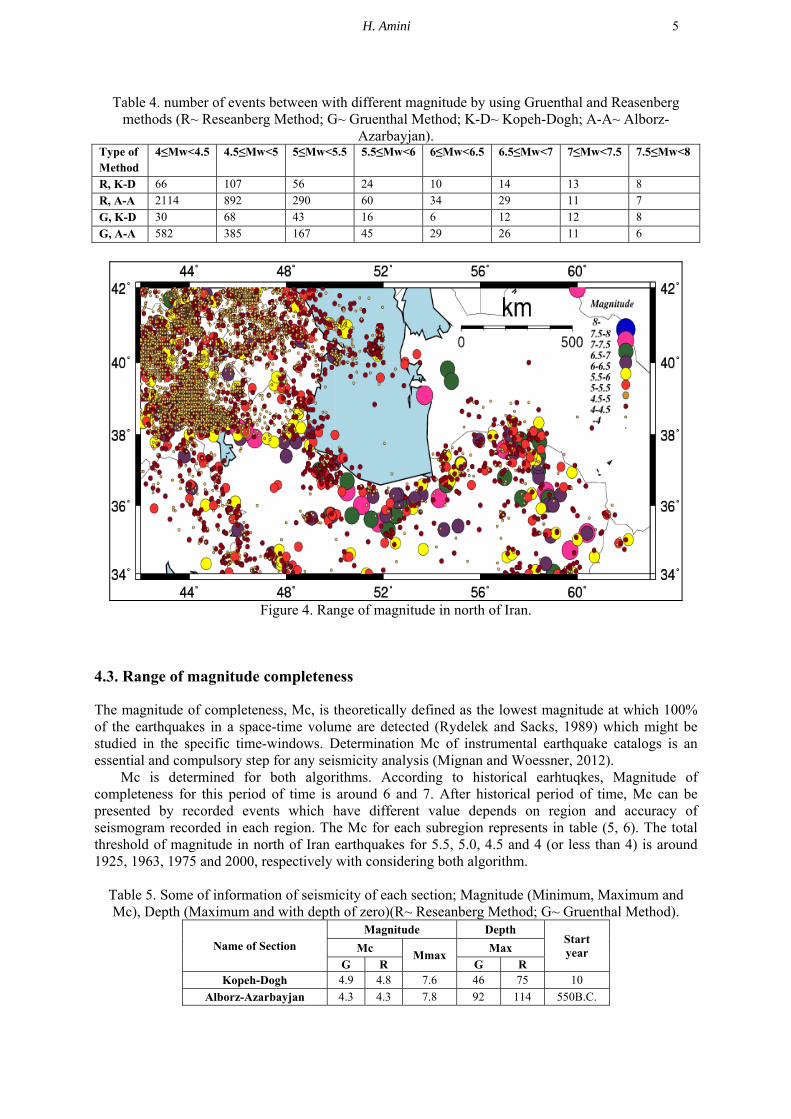
Magnitude determination is one of the affective parameters on the quality of final results. Number of each magnitude with different values, after dectlustering with both methods, presents in table (4) and figure (4). There are not any events with more than 8 magnitudes in these regions. Minimum magnitude in both methods is 4.0 but Maximum magnitude is 7.8 and 7.6 for Alborz-Azarbayjan and Kopeh-Dogh, respectively. Number of each magntidue is presented in table (4). Maximum value in Alborz-Azarbayjan is bigger than Kopeh-Dogh.
ba
H. Amini 5
Table 4. number of events between with different magnitude by using Gruenthal and Reasenberg methods (R~ Reseanberg Method; G~ Gruenthal Method; K-D~ Kopeh-Dogh; A-A~ Alborz-
Azarbayjan). Type of Method
4≤Mw<4.5 4.5≤Mw<5 5≤Mw<5.5 5.5≤Mw<6 6≤Mw<6.5 6.5≤Mw<7 7≤Mw<7.5 7.5≤Mw<8
R, K-D 66 107 56 24 10 14 13 8
R, A-A 2114 892 290 60 34 29 11 7
G, K-D 30 68 43 16 6 12 12 8
G, A-A 582 385 167 45 29 26 11 6
Figure 4. Range of magnitude in north of Iran.
4.3. Range of magnitude completeness
The magnitude of completeness, Mc, is theoretically defined as the lowest magnitude at which 100% of the earthquakes in a space-time volume are detected (Rydelek and Sacks, 1989) which might be studied in the specific time-windows. Determination Mc of instrumental earthquake catalogs is an essential and compulsory step for any seismicity analysis (Mignan and Woessner, 2012).
Mc is determined for both algorithms. According to historical earhtuqkes, Magnitude of completeness for this period of time is around 6 and 7. After historical period of time, Mc can be presented by recorded events which have different value depends on region and accuracy of seismogram recorded in each region. The Mc for each subregion represents in table (5, 6). The total threshold of magnitude in north of Iran earthquakes for 5.5, 5.0, 4.5 and 4 (or less than 4) is around 1925, 1963, 1975 and 2000, respectively with considering both algorithm.
Table 5. Some of information of seismicity of each section; Magnitude (Minimum, Maximum and Mc), Depth (Maximum and with depth of zero)(R~ Reseanberg Method; G~ Gruenthal Method).
Name of Section Magnitude Depth
Start year Mc
Mmax Max
G R G R Kopeh-Dogh 4.9 4.8 7.6 46 75 10
Alborz-Azarbayjan 4.3 4.3 7.8 92 114 550B.C.

6
Table 6. Beginning year of recordingearthquakes with different magnitude in each section of Iran region (R~ Reseanberg Method; G~ Gruenthal Method).
Sections Mw ≤4.0 4.0< Mw ≤4.5 4.5< Mw ≤5.0 5.0< Mw ≤5.5 G R G R G R G R
Kopeh-Dogh 2000 1997 1928 1928 1925 1925 1900 850 Alborz-Azarbayjan 1955 1955 1800 1800 1680 1680 1910 850
5. Conclusion
Alborz-Azerbaijan and Kopeh-Dagh subregions from Middle East catalog are used for comparing Gruenthal and Reasenberg algorithm. In this primary catalog summary of earthquake origin times, longitude, latitude, magnitudes and depth for each event presented. Wiemer's ZMAP package (2001) to apply Gruenthal and Reasenberg algorithm was used to omit duplicate events, aftershocks and foreshocks for Alborz-Azerbaijan and Kopeh-Dagh. Middle East catalog, before declustering have 28244 events and after declustering with Gruenthal and Reasenberg algorithm, final catalog include 7272 and 24530 main events for these two subregions from 550 B.C. through 2006.
Minimum magnitude in both methods is 4.0 but Maximum magnitude is 7.8 and 7.6 for Alborz-Azarbayjan and Kopeh-Dogh, respectively. Number of each magntidue is presented in table (4). Maximum value in Alborz-Azarbayjan is bigger than Kopeh-Dogh. The total threshold of magnitude in north of Iran earthquakes for 5.5, 5.0, 4.5 and 4 (or less than 4) is around 1925, 1963, 1975 and 2000, respectively with considering both algorithm.
6. References
DeMets C, Gordon R G, Argus D F, Stein S (1994) “Effects of recent revisions to the geomagnetic reversal time scale on estimates of current plate motions”, Geophys. Res. Lett., 21, 2191-2194.
Gardner J K, Knopoff L (1974) “Is the sequence of earthquakes in southern California, with aftershocks removed, Poissonian?” Bull. Seism. Soc. Amer 64:5, 1363-1367.
McClusky S, Balassanian S, Barka A, Demir C, Ergintav S, Georgiev I, Gurkan O, Hamburger M, Hurst K, Kahle H, Kasten K, Kekelidze G, King R W, Kotzev V, Lenk O, Mahmoud S, Mishin A, Nadariya M, Ouzoumis A, Paradissis D, Peter Y, Prilepin M, Reilinger R, Sanli I, Seeger H, Tealeb A, Toksöz M N, Veis G (2000) “GPS constraints on plate motions and deformations in eastern Mediterranean and Caucasus”, J. Geophys. Res., 105, 5695-5719.
Mirzaei N, Mengtan G, Yantai Ch (1998) “Seismic source regionalization for seismic zoning of Iran: major seismotectonic provinces”, Journal of earthquake prediction research 7, 465- 495.
Mignan A, Woessner J (2012) “Estimating the magnitude of completeness for earthquake catalogs, Estimating the magnitude of completeness for earthquake catalogs”, Community Online Resource for Statistical Seismicity Analysis, doi:10.5078/corssa-00180805. Available at http://www.corssa.org.
Reasenberg P (1985) “Second-order moment of central California seismicity”, 1969-82, J. Geophys. Res., 90, 5479-5495. 3-18.
Rydelek P A, Sacks I S (1989) “Testing the completeness of earthquake catalogs and the hypothesis of self-similarity”, Nature 337, 251–253.
Tavakoli F (2007) “Present-day deformation and kinematics of the active faults observed by GPS in the Zagros and east of Iran”, PHD Thesis.
Uhrhammer R (1986) “Characteristics of northern and southern California seismicity: Earthquake Notes”, v. 57, p. 21.
Van Stiphout T, Zhuang J, Marsan D (2012) “Seismicity declustering, Community Online Resource for Statistical Seismicity Analysis”, doi:10.5078/corssa- 52382934. Available at http://www.corssa.org.
Vernant Ph, Nilforoushan F, Hatzfeld D, Abbassi M R, Vigny C, Masson F, Nankali H, Martinod J, Ashtiani A, Bayer R, Tavakoli F, Ch´ery J (2004) “Present-day crustal deformation and plate kinematics in the Middle East constrained by GPS measurements in Iran and northern Oman”, Geophys. J. Int., 157, 381–398 doi: 10.1111/j.1365-246X.2004.02222.x.

H. Amini 7
Wang Q, Zhang P Z, Freymueller, Bilham J T R, Larson K M, Lai X, You X, Niu Z, Wu J, Li Y, Liu J, Yang Z, Chen Q (2001) “Present-day crustal deformation in China by Global Positioning System measurements”, Science, 294, 574-577.
Wiemer S (2001) “A software package to analyze seismicity: ZMAP”, Seism. Res. Lett., 72, 373-382. Zare M, Amini H, Yazdi P, Sesetyan K, Demircioglu M B, Kalafat D, Erdik M, Giardini D, Khan M A,
Tsereteli N (2013) “Recent developments of the Middle East catalog”, SUBMITTED.