comparing rgb-based vegetation indices with ndvi for …comparing rgb-based vegetation indices with...
TRANSCRIPT

RGB Vegetation Indices, Agribotix, LLC 2017 (Agribotix.com) 1
AGBX021-17, May 2017
Comparing RGB-Based Vegetation Indices With NDVI For Drone
Based Agricultural Sensing
Tom McKinnon ([email protected]) and Paul Hoff ([email protected]) Agribotix LLC, 3309 Airport Road, Boulder, CO 80301 USA
Abstract Agribotix conducted a post hoc test of two vegetation indices, VARI and TGI, that used only the three visible-band signals from an unmodified CMOS camera. The results were compared to NDVI, which is generally considered to be a reliable measure of field health and the underlying RGB image. While the results are somewhat encouraging in limited cases, neither VARI nor TGI are applicable as general-purposes measures of field health.
1. Introduction A vegetation index is used to combine or filter multiple spectral data sets into a single value for each point on an image. It can typically be expressed as a mathematical formula. Usually the output from the index is assigned a color from a color scale and used to generate a false-color image of a field. A quick glance at the resulting image can quickly show regions of the field where the index returned low values and those where high values were obtained. Normalized difference vegetation index (NDVI), the most widely used and best-known vegetation index, was developed in 1975 to leverage the spectral data from Landsat to assess global agriculture and forestry [1, 2]. Beyond NDVI there are dozens, if not hundreds, of less-well-known vegetation indices developed for specific purposes [3, 4]. For example, the soil-adjusted vegetation index (SAVI) is a variant on NDVI intended to handle the case where a significant fraction of soil is not covered with vegetation [5]. Most, but not all, of the indices require data from a sensor operating in the near infrared (NIR) wavelength. Since the advent of reliable and low-cost drones, hobbyists and professionals alike have been taking advantage of these devices to create rapid-turnaround vegetation index maps of farm fields. The usual first step is to purchase a purpose-built camera that
captures NIR or to modify the consumer-grade camera on the drone so that it senses in the NIR. For many cameras, this is a relatively simple step of replacing the factory IR-blocking filter with one that passes NIR light and blocks out one of the RGB channels. For example, Agribotix uses a filter that blocks red light while passing NIR so we obtain the NIR signal from the normal red channel. Almost universally, the vegetation index maps make it easy to find problem areas in a field, such as a lack of nutrients or poor soil. Often the same information can be seen in the RGB image – it’s just more subtle and difficult to clearly identify. If there existed a robust and reliable vegetation index that did not need NIR input and was based solely on the visible RGB channels then the camera hardware modification step would become unnecessary. This would allow several things; first, most high-end consumer drones could be used off the shelf for agricultural purposes, opening up the market to anyone with such a drone. Second, the same drone could be used to produce RGB (normal visible images) views and index map views of the same field using a single camera. Currently, once someone has modified their camera to collect NIR data, any pictures taken by this camera have a distorted hue and the camera is not usable for normal images. Finally, this would open up the use of some capable drones, such as the DJI Mavic, which have cameras that are difficult or impossible to modify to acquire NIR images.

RGB Vegetation Indices, Agribotix, LLC 2017 (Agribotix.com) 2
Two agricultural research teams have developed vegetation indices based solely on RGB signals: TGI and VARI. 2. Visible Atmospheric Resistant Index Visible Atmospheric Resistant Index (VARI), developed at the University of Nebraska uses the formula
VARI RGREEN RRED
RGREEN RRED RBLUE
where Rxxx is the reflectance of the canopy in that color [6]. The authors were seeking a method of predicting vegetation fraction (VF) and leaf area index (LAI) from remote sensing signals [7, 8]. NDVI correlates quite well with VF and LAI when the vegetation is not fully canopied (e.g. VF < 0.5). However, it is well known that the NIR signal, and thus the NDVI, asymptotically flattens later in the growing season so it doesn’t contain any information on VF or LAI. Gitelson et al noted that the red, green, and blue signals contain information throughout the growing season and, from that, proposed the VARI index, along with a closely related one where green is replaced with red edge (red edge is between red and NIR). The results showed a correlation with high statistical confidence between VARIGreen as well as VARIRedEdge and LAI and VF in wheat and corn. 3. Triangular Greenness Index (TGI). Hunt and co-workers at the USDA [4] created the TGI in order to estimate leaf chlorophyll and, indirectly plant nitrogen content, using visible-spectrum imagers. TGI is defined as the area of the triangle in the figure below.
Figure from [4]. TGI is defined as the area of the triangle defined by the reflectance signals for red, green, and blue. The wavelengths used by Hunt et al are from Bands 1, 2, and 3 of the Landsat Thematic Mapper instrument. We used the peak wavelength sensitivities of a typical CMOS sensor in our work: Red = 625 nm, Green = 525 nm, Blue = 460 nm. Using the wavelengths of a typical CMOS camera and normalizing by the green signal, the TGI equation is:
TGI RGREEN 0.39 * RRED 0.61* RBLUE
The authors studied various vegetation indices from corn test plots in Nebraska. Chlorophyll measurements were made with a handheld meter. Optical data were taken from the Landsat, aircraft, and infield instruments. Optical bandwidths were mathematically combined to simulate digital camera results. Hunt and coworkers correlated the results from over twenty different vegetation indices against in-field chlorophyll measurements and TGI was found to be one of the best. In addition, the TGI was relatively insensitive to the size of the plants’ leaves (leaf area index or LAI). 4. Field Testing Given the encouraging results the University of Nebraska and USDA, Agribotix set out to determine the effectiveness of VARI and TGI as general-purpose field health indicators. Neither of these indices was intended to be general purpose – each was developed for a specific reason. But, it should be noted, NDVI

RGB Vegetation Indices, Agribotix, LLC 2017 (Agribotix.com) 3
was never intended to be a “broad spectrum” field health indicator, but it has worked out in practice to be an excellent field health indicator. We did our tests using images collected from corn, wheat, tomatoes and rice. The tests were done from fields that were flown with both RGB cameras and NIR cameras on the same day. The sensors were either GoPro Hero 4 cameras (standard plus modified) or Phantom 3 Advanced cameras (standard plus modified). In most cases the flight altitude was 100 m. Light condition varied from full sun to full overcast.
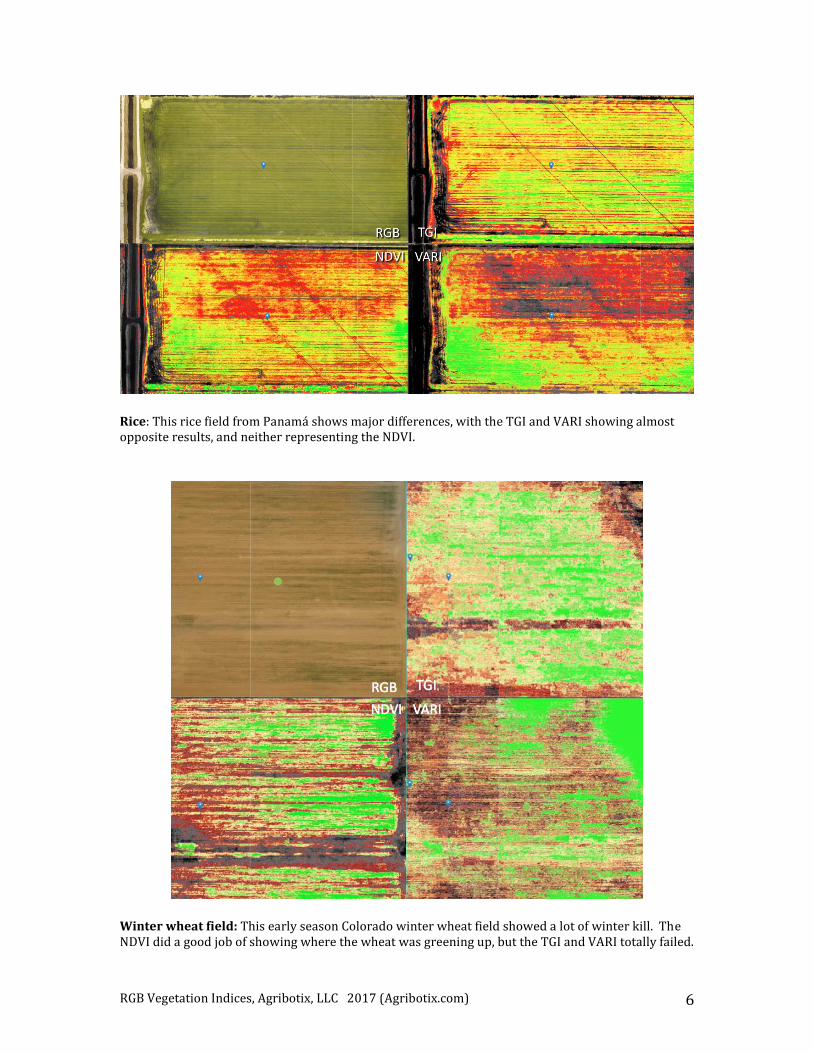
There were too many images in the study to include them all in this report, but a representative sample is below. In all cases, we show four images: RGB, TGI, VARI, NDVI (clockwise order, RGB in the upper left). The value of TGI and VARI data was generally assessed by comparison to the NDVI, which we consider the reference standard. For all of the index maps we have used the same color scale, which emulates a traffic light – high readings from the index are expressed as green, fading to yellow then red. The lowest readings are shown as black. The definitive test, of course, will be comparison of all indices to ground truthing data. This we plan during the 2017 growing season.
5. Results
Corn field A, region 1: This corn field (above) had a lot of variability, which shows up clearly in RGB. Both TGI and VARI did a good job of reproducing the general features of the NDVI as well as representing the RGB trends.

RGB Vegetation Indices, Agribotix, LLC 2017 (Agribotix.com) 4
Corn Field A, region 2: But in another section of the same field the VARI failed badly, indicating a poor area in the same place the NDVI shows a good region. The TGI and NDVI match up well.
Corn field A, region 3: In another section of the same field the VARI appears to do a better job of capturing the clearly identifiable features in RGB (note the diagonal grass strip in the middle) than either TGI or NDVI. The NDVI problem is unusual since this index typically captures the green growth quite reliably.

RGB Vegetation Indices, Agribotix, LLC 2017 (Agribotix.com) 5
Corn test plots: With these corn test plots, all three indices do a pretty good job. Arguably TGI is the best.
Tomato field: The tracks left by the harvesting trucks in this tomato field show up clearly in the NDVI image, but they are totally missed by the TGI and VARI (as well as the RGB).
RGB Vegetation Indices, Agribotix, LLC 2017 (Agribotix.com) 6
Rice: This rice field from Panamá shows major differences, with the TGI and VARI showing almost opposite results, and neither representing the NDVI.
Winter wheat field: This early season Colorado winter wheat field showed a lot of winter kill. The NDVI did a good job of showing where the wheat was greening up, but the TGI and VARI totally failed.

RGB Vegetation Indices, Agribotix, LLC 2017 (Agribotix.com) 7
Tomato field: These tomatoes from Mexico show a very uniform canopy in RGB. But the indices show some nuances. Arguably the VARI is the best, but we will need ground truthing to find out if any of distributions are real.
6. Summary and Conclusions VARI and TGI are two vegetation indices that only use the visible spectrum so they can be created with unmodified cameras and off-the-shelf consumer drones. VARI was developed specifically to monitor the leaf-area index (LAI) in later stage crops and TGI was developed to monitor chlorophyll (and indirectly nitrogen) content of leaves. Neither test was designed to be a general-purpose crop health indicator. From the examples above, and many more from the Agribotix study, we found encouraging cases where both TGI and VARI did an excellent job of representing the major features of NDVI. However, the results showed almost as many failures as successes. Even more troublesome, we couldn’t find any
trends in the data. In some cases TGI was excellent where VARI failed and in many cases just the opposite happened. 7. Specific Recommendations 1. Neither TGI nor VARI can be considered a reliable general-purpose crop health indicator and caution should be used when using them as a replacement for NDVI. 2. We would expect they would be reliable in parameter space for which they were designed: VARI for LAI and TGI for chlorophyll. 3. This is an ongoing study and we plan to update it as we gather ground truthing data in the upcoming growing season.
RGB Vegetation Indices, Agribotix, LLC 2017 (Agribotix.com) 8
8. Citations and Notes 1. Rouse, J.W., Haas, R.H, Schell, J.A., and Deering, D.W., “Monitoring Vegetation Systems in the Great Plains with ERTS”, Paper A-20, NASA. Goddard Space Flight Center 3d ERTS-1 Symposium, 1974. 2. Tucker, C., “Red and Photographic Infrared Linear Combinations for Monitoring Vegetation”, Remote Sensing of Environment, 8, 127-150, 1979. 3. Bannari, A., Morin, D., Bonn, F. and Huete, A.R., “A Review of Vegetation Indices”, Remote Sensing Reviews, 13, 95-120, 1995. 4. Hunt, E.R., Doraiswamy, P.C., McMurtrey, J.E., Daughtry, C.S.T., and Perry, E.M., “A Visible Band Index for Remote Sensing Leaf Chlorophyll Content at the Canopy Scale”, International Journal of Applied Earth Observation and Geoinformation, 21, 103-112, 2013. 5. Huete, A.R., “A Soil-Adjusted Vegetation Index (SAVI)”, Remote Sensing of Environment, 25, 295-309, 1988. 6. Satellite sensors, such as Landsat, have well defined filters. For example, the Landsat 5 red band (Band 5) is 600 to 700 nm. On the other hand, the bands of modified consumer-grade cameras are broad and overlapping. Furthermore, the manufacturers rarely publish them. Nonetheless, in practice we find that the vegetation indices from consumer-grade CMOS sensors stand up very well to ground truthing. 7. Gitelson, A.A., Kaufman, Y.J., Stark, R. and Rundquist, D., “Novel Algorithms for Remote Estimation of Vegetation Fraction”, Remote Sensing of the Environment, 80, 76-87, 2002. 8. Gitelson, A.A., Viña, A., Arkebauer, T.J., Rundquist, D.C., and Keydan, G.P., “Remote Estimation of Leaf Area Index and Green Leaf Biomass in Maize Canopies”, Geophysical Research Letters, 30, 1248, 2003.