comparing the investment cases for european and us ... · loan documentation for leveraged loan...
TRANSCRIPT

Comparing the investment cases for European and US leveraged loans

Executive summaryLeveraged loans, often referred to as bank loans, offer investors a broad and relatively liquid market of private, sub-investment grade loans that can deliver attractive returns with lower volatility when compared with similarly-rated, unsecured corporate bonds.
The investment opportunity set is global, but it is important that investors understand the differences between the two loan markets of the US and Europe, and what it takes to invest successfully in each. While the US loan market is public, larger and more liquid, being well-established over several decades with non-bank investors, institutional investors have steadily recognised the compelling benefits of allocating to European leveraged loans too, as part of a wider fixed income portfolio. Furthermore, there remains significant scope for increased institutional investment in European loans.
This paper looks at the investment benefits of the loan asset class as a whole, the key characteristics of the markets in Europe and the US, and why it may make sense for institutional investors to consider European loans as part of a diverse investment portfolio.

3
Contents
Introduction to European leveraged loans 4
The European and US leveraged loan markets compared 6
Further considerations for investors 10
Portfolio diversification benefits for loan investors 10
Conclusions 11

4
Rising demand from non-bank, institutional investorsOver the past two decades, non-bank, institutional investors have expanded their participation in corners of Europe’s corporate financing market traditionally dominated by banks. Attracted by the significantly higher returns on offer, institutional investors have taken advantage of the financing opportunities in Europe as banks have pulled back to meet stringent capital requirements imposed by regulators, following the global financial crisis. This has resulted in bumper issuance volumes in high yield bonds from 2011 onwards and a revival of the European leveraged loans market after a hiatus in the immediate aftermath of the crisis. In 2016, institutional investors accounted for near two-thirds of primary loan issuance in Europe, a share that has steadily increased over time, as illustrated in Figure 1.
Figure 1: European primary loan issuance by investor type (% of total), 2010 to 2016
Source: Standard & Poor’s (S&P) Capital IQ Leveraged Commentary and Data (LCD), as at 31 December 2016
In Europe, around 75% to 80% of leveraged loan issuance derives from private equity buyout activity, often following large mergers where companies divest non-core divisions, perhaps for regulatory reasons. Private equity houses step in to buy these divested entities and come to the leveraged loan market for debt funding. An arranging or lead bank will typically sell the loans, through a syndication process, to institutional investors alongside other banks.
The low interest rate environment has posed a number of challenges for institutional investors, such as pension funds and insurers who can, as a result, find themselves struggling to generate the investment returns needed to meet funding commitments or drive profitability.
The search for yield has undeniably been one of the main drivers of increased interest in the asset class, while institutional investors have recognised the benefits of making a strategic allocation to leveraged loans as part of a wider fixed income portfolio. This can be achieved through a shift of allocation from high yield bonds to loans (both are sources of sub-investment grade corporate debt), or from traditional investment-grade fixed income investments.
Key features of leveraged loans The term ‘leveraged loans’, or ‘bank loans’, describes floating-rate debt issued – on a secured basis – by sub-investment grade companies, typically to finance mergers and acquisitions (M&A) or leveraged buyouts (LBOs) by private equity sponsor companies.
Strong relative value
When looking at the relative value of loans compared to other asset classes, there appears to be a lot of opportunity at present. The spread premium of European leveraged loans versus corporate high yield bonds hit a three-year high at the end of 2016 – 190 basis points (bps) versus 70 bps at the end of 2015 – helping to underscore the case for an allocation to loans (see Figure 2).
The reason for the spread contraction of bonds in 2016 is largely owing to market interventions conducted by the European Central Bank (ECB) through its corporate sector purchase programme (CSPP). As investment grade bond spreads have tightened, as a result of the CSPP, high yield securities’ spreads have contracted in sympathy as investors look for yield. European loans are not within the repurchasing remit of the ECB and thus their spreads have remained relatively unaffected.
Figure 2: Spread premium of European loans to high yield corporate bonds
Source: Credit Suisse (CS WELLI 4-year discount margin), Bloomberg (Bank of America (BofA) Merrill Lynch European HPIC high yield index asset swap spread), as at 31 December 2016
Low duration and floating-rate returns
Investors may also view loans as a means of capturing high yields while reducing overall duration in a blended credit portfolio. This is owing to their floating-rate structure.
While loan markets are arguably not ones to ‘time’, it is important to understand how leveraged loans can behave in different interest rate regimes. Leveraged loans can offer a compelling investment opportunity in an environment of low and flat yields due to their high running income, low duration and less correlated, sustainable returns. Equally, as floating-rate investments offering a determinable spread over a short-term reference rate (e.g. Libor or Euribor, depending on the currency), leveraged loans can serve as a natural ‘hedge’ against rising interest rates. This is because loan coupons have the ability to adjust higher or lower based on underlying changes in Libor, typically every three months (90 days).
Introduction to European leveraged loans
Institutional investors Banks
2010 2012
100%
90%
80%
70%
60%
50%
40%
30%
20%
10%
0%2013 2014 2015 20162011
BofA Merrill Lynch non-financial constrained high yield asset swap spreadCredit Suisse Europe leveraged loan 4-year discount margin
800
600
400
200
Spre
ad p
rem
ium
(bps
)
Dec2010
Dec2012
Dec2013
Dec2014
Dec2015
Dec2016
Dec2011
Dec2009

5
Loans therefore pose minimal interest rate risk to a portfolio and are designed to benefit in a scenario of rising interest rates – particularly after Libor has increased beyond the level of the average floor1. High yield corporate bonds, in comparison, typically pay a fixed-rate cash coupon – so income and returns will be susceptible to interest rate changes.
Other defensive characteristics
As leveraged loans can play a number of different roles in a portfolio, there will be different structural and market features that appeal to long-term investors dependent on their investment objectives.
Importantly, leveraged loans benefit from security over assets and / or equity of the issuing companies, as well as seniority in the capital structure. This means that if an investment does not perform as expected, then the owners of these loans are first in line to be repaid, ahead of unsecured debt holders, thereby affording more downside protection compared to other similarly-rated fixed income instruments. This contributes to the relative stability of loan pricing in the secondary market.
Historically, senior secured leveraged loans have had much higher recoveries than unsecured high yield bonds in the event of default or restructuring, limiting their downside risk. According to data from Moody’s Investors Service2 (measured using post-default trading prices), annual recovery rates for senior secured (first lien) loans have been consistently above unsecured global corporate high yield bonds, and have averaged at 70% versus 42% over the period from 1990 to 2015.
Loan documentation for leveraged loan transactions includes contractually-agreed financial covenants, sometimes on an incurrence basis (to govern the addition of new debt) and sometimes on a maintenance basis (where pro-active demonstration of compliance is imposed on the borrower at regular intervals through the loan’s life). Together with seniority and security, loans tend to incorporate additional features that can provide comprehensive credit risk protection for an investor.
As things stand today, lenders do not need to take on undue risk, on behalf of underlying investors, to get well rewarded. European corporate default rates, for example, are low in absolute and relative terms, although careful lending practices, rigorous due diligence and ongoing investment monitoring can further reduce a portfolio’s default rate.
Explained: Prepayment featureUnlike high yield bonds, leveraged loans do not typically have the potential for significant capital appreciation as loans are repayable at par (or face value), so do not tend to trade significantly above this level. This feature gives the borrower the option of early repayment (or the obligation to repay should ownership of the company change), provided it can generate the cash to repay the principal. By contrast, while the majority of high yield bonds are callable, borrowers must observe a non-callable period of several years. Also, for investors particularly concerned about liquidity, there is considerable inherent cash generation in a loan portfolio from this prepayment feature in addition to the presence of a functioning secondary market.
In 2016, the prepayment rate for European loans stood at 27.4% (representing €31 billion of the ELLI3 – the same level as 2015 in volume terms) albeit down in percentage terms from the 33.1% seen in 2015. However, near half the turnover occurred in the last four months of the year as an exuberant market picked up pace.
Figure 3: European loan market repayment volume (€ billion) and repayment rate (% of total) per annum, 2008 to 2016
Source: S&P Capital IQ LCD European Leveraged Loan Index (ELLI), as at 31 December 2016
ELLI repayment vol. (€ billion) Repayment rate (% of total)
50
40
30
20
10
0
€ bi
llion
2010 2012 2013 2014 2015 2016201120092008
50%
30%
10%
-10%
1 When a loan has a floor, the loan’s coupon will reset to the higher of the floor or Libor / Euribor, typically every 30, 60 or 90 days2 Moody’s Investors Service ‘Corporate Default and Recovery Rates – 1920-2015’, February 20163 S&P Capital IQ LCD European Leveraged Loan Index
6
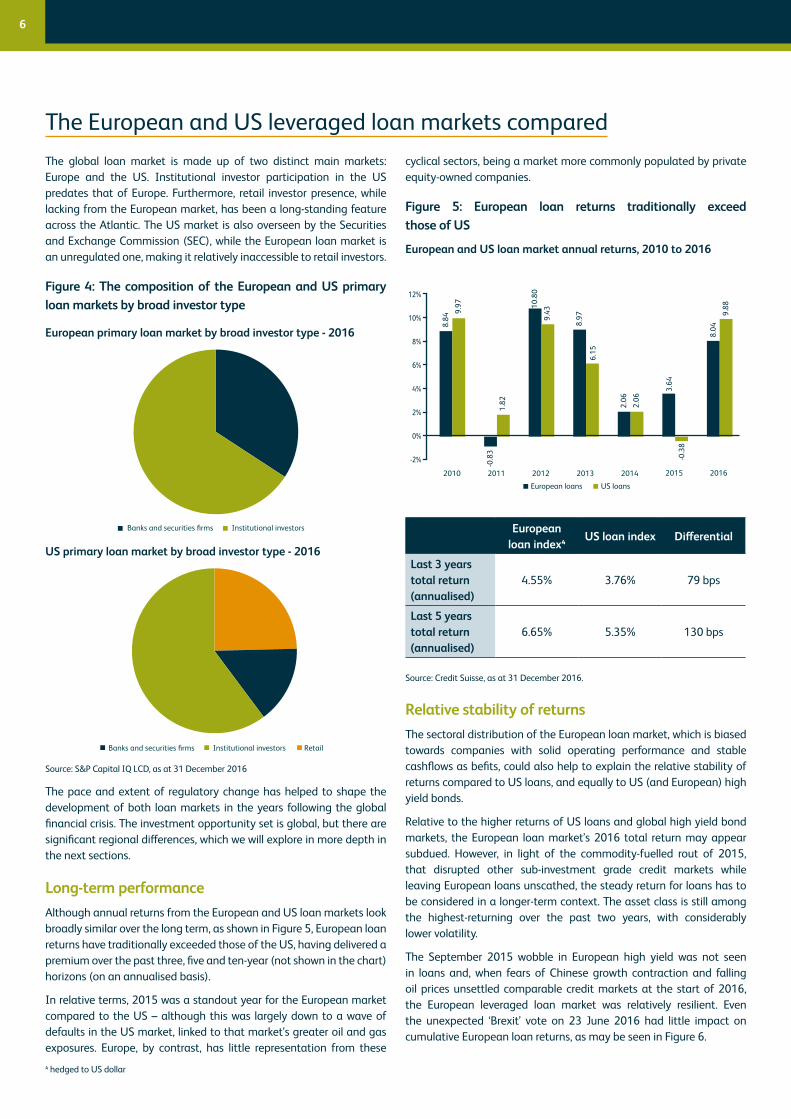
The global loan market is made up of two distinct main markets: Europe and the US. Institutional investor participation in the US predates that of Europe. Furthermore, retail investor presence, while lacking from the European market, has been a long-standing feature across the Atlantic. The US market is also overseen by the Securities and Exchange Commission (SEC), while the European loan market is an unregulated one, making it relatively inaccessible to retail investors.
Figure 4: The composition of the European and US primary loan markets by broad investor type
European primary loan market by broad investor type - 2016
US primary loan market by broad investor type - 2016
Source: S&P Capital IQ LCD, as at 31 December 2016
The pace and extent of regulatory change has helped to shape the development of both loan markets in the years following the global financial crisis. The investment opportunity set is global, but there are significant regional differences, which we will explore in more depth in the next sections.
Long-term performanceAlthough annual returns from the European and US loan markets look broadly similar over the long term, as shown in Figure 5, European loan returns have traditionally exceeded those of the US, having delivered a premium over the past three, five and ten-year (not shown in the chart) horizons (on an annualised basis).
In relative terms, 2015 was a standout year for the European market compared to the US – although this was largely down to a wave of defaults in the US market, linked to that market’s greater oil and gas exposures. Europe, by contrast, has little representation from these
cyclical sectors, being a market more commonly populated by private equity-owned companies.
Figure 5: European loan returns traditionally exceed those of US
European and US loan market annual returns, 2010 to 2016
European loan index4
US loan index Differential
Last 3 years total return (annualised)
4.55% 3.76% 79 bps
Last 5 years total return (annualised)
6.65% 5.35% 130 bps
Source: Credit Suisse, as at 31 December 2016.
Relative stability of returnsThe sectoral distribution of the European loan market, which is biased towards companies with solid operating performance and stable cashflows as befits, could also help to explain the relative stability of returns compared to US loans, and equally to US (and European) high yield bonds.
Relative to the higher returns of US loans and global high yield bond markets, the European loan market’s 2016 total return may appear subdued. However, in light of the commodity-fuelled rout of 2015, that disrupted other sub-investment grade credit markets while leaving European loans unscathed, the steady return for loans has to be considered in a longer-term context. The asset class is still among the highest-returning over the past two years, with considerably lower volatility.
The September 2015 wobble in European high yield was not seen in loans and, when fears of Chinese growth contraction and falling oil prices unsettled comparable credit markets at the start of 2016, the European leveraged loan market was relatively resilient. Even the unexpected ‘Brexit’ vote on 23 June 2016 had little impact on cumulative European loan returns, as may be seen in Figure 6.
The European and US leveraged loan markets compared
Banks and securities firms Institutional investors
-2%
0%
2%
4%
6%
8%
10%
12%
European loans US loans
8.84
9.97
-0.8
31.
82
10.8
09.
43
8.97
6.15
2.06
2.06
3.64
-0.3
8
8.04
9.88
2010 2012 2013 2014 2015 20162011
Banks and securities firms Institutional investors Retail
4 hedged to US dollar
7
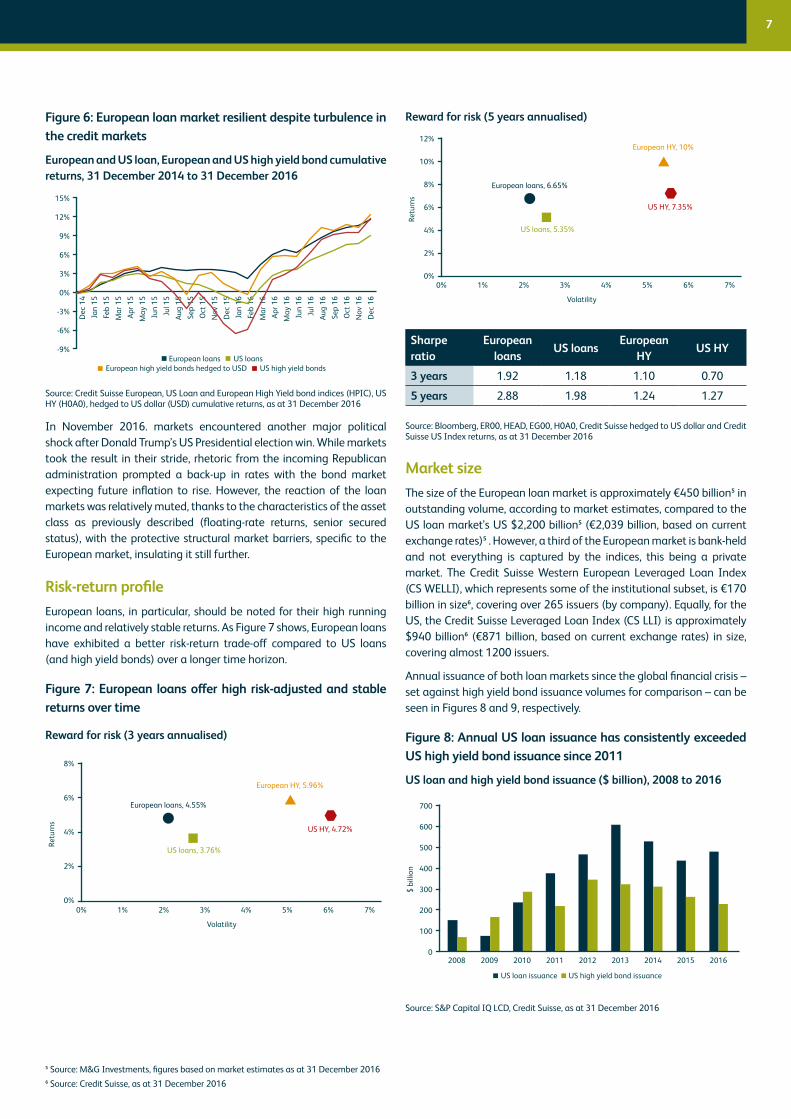
Figure 6: European loan market resilient despite turbulence in the credit markets
European and US loan, European and US high yield bond cumulative returns, 31 December 2014 to 31 December 2016
Source: Credit Suisse European, US Loan and European High Yield bond indices (HPIC), US HY (H0A0), hedged to US dollar (USD) cumulative returns, as at 31 December 2016
In November 2016. markets encountered another major political shock after Donald Trump’s US Presidential election win. While markets took the result in their stride, rhetoric from the incoming Republican administration prompted a back-up in rates with the bond market expecting future inflation to rise. However, the reaction of the loan markets was relatively muted, thanks to the characteristics of the asset class as previously described (floating-rate returns, senior secured status), with the protective structural market barriers, specific to the European market, insulating it still further.
Risk-return profileEuropean loans, in particular, should be noted for their high running income and relatively stable returns. As Figure 7 shows, European loans have exhibited a better risk-return trade-off compared to US loans (and high yield bonds) over a longer time horizon.
Figure 7: European loans offer high risk-adjusted and stable returns over time
Reward for risk (3 years annualised)
Reward for risk (5 years annualised)
Sharpe ratio
European loans
US loansEuropean
HY US HY
3 years 1.92 1.18 1.10 0.70
5 years 2.88 1.98 1.24 1.27
Source: Bloomberg, ER00, HEAD, EG00, H0A0, Credit Suisse hedged to US dollar and Credit Suisse US Index returns, as at 31 December 2016
Market size The size of the European loan market is approximately €450 billion5 in outstanding volume, according to market estimates, compared to the US loan market’s US $2,200 billion5 (€2,039 billion, based on current exchange rates)5 . However, a third of the European market is bank-held and not everything is captured by the indices, this being a private market. The Credit Suisse Western European Leveraged Loan Index (CS WELLI), which represents some of the institutional subset, is €170 billion in size6, covering over 265 issuers (by company). Equally, for the US, the Credit Suisse Leveraged Loan Index (CS LLI) is approximately $940 billion6 (€871 billion, based on current exchange rates) in size, covering almost 1200 issuers.
Annual issuance of both loan markets since the global financial crisis – set against high yield bond issuance volumes for comparison – can be seen in Figures 8 and 9, respectively.
Figure 8: Annual US loan issuance has consistently exceeded US high yield bond issuance since 2011
US loan and high yield bond issuance ($ billion), 2008 to 2016
Source: S&P Capital IQ LCD, Credit Suisse, as at 31 December 2016
European loans US loans European high yield bonds hedged to USD US high yield bonds
15%
12%
9%
6%
3%
0%
-3%
-6%
-9%
Dec
14
Jan
15Fe
b 15
Mar
15
Apr 1
5M
ay 1
5Ju
n 15
Jul 1
5Au
g 15
Sep
15O
ct 1
5N
ov 1
5D
ec 1
5Ja
n 16
Feb
16M
ar 1
6Ap
r 16
May
16
Jun
16Ju
l 16
Aug
16Se
p 16
Oct
16
Nov
16
Dec
16
Volatility
8%
6%
4%
2%
0%0% 1% 2% 3% 4% 5% 6% 7%
European loans, 4.55%
Retu
rns
US loans, 3.76%
European HY, 5.96%
US HY, 4.72%
Volatility
12%
10%
8%
6%
4%
2%
0%0% 1% 2% 3% 4% 5% 6% 7%
European loans, 6.65%
Retu
rns
US loans, 5.35%
European HY, 10%
US HY, 7.35%
5 Source: M&G Investments, figures based on market estimates as at 31 December 20166 Source: Credit Suisse, as at 31 December 2016
US loan issuance US high yield bond issuance
700
600
500
400
300
200
100
0
$ bi
llion
2008 2009 2010 2011 2012 2013 2014 2015 2016

8
Figure 9: Annual European loan issuance has been comparable to European high yield bond issuance post-crisis
European loan and high yield bond issuance (€ billion), 2008 to 2016
Source: S&P Capital IQ LCD, Credit Suisse, as at 31 December 2016
In M&G’s estimation, the addressable loan market in Europe for an established manager is approximately €250 billion, roughly the same size as the European corporate high yield bond market.
We have summarised the key data characteristics of the two loan markets in Table 1.
Table 1: European and US loan market comparison – key characteristics at a glance
European loan index*
US loan index
Market size (outstanding volume)
€450 billion $2,200 billion
New issue volume 2016
€71 billion $488 billion
Index size €170 billion (CS WELLI)
$940 billion (CS LLI)
Normal spread 401 bps 391 bps
4-year discount margin
506 bps 446 bps
Volatility (5 years) 2.18% 2.52%
Ratings c.75% 100%
Source: S&P Capital IQ LCD, Credit Suisse, as at 31 December 2016. Market size (outstanding volume): figures based on market estimates
Investor base and demand for loansAs Table 1 shows, the historical volatility of the two loan markets over the past five years has been broadly similar, although the notable (circa 25%) daily-dealing, retail investor presence in the US market could help to explain the slightly higher standard deviation of returns. In Europe, there is no retail fund community as loans are not classed as UCITS-eligible assets. This could put the European market in sharp contrast to the US, where fund inflows may pressurise spreads to a greater degree if not matched by issuance.
Open-ended funds are now relatively common in Europe albeit that dealing frequencies will typically be monthly, rather than daily, given their institutional nature and the uncertain- and sometimes lengthy- periods for loans to settle. Closed-ended, structured funds, primarily collateralised loan obligations (CLOs), account for a sizeable market share in Europe too. This indiscriminate, captive European loan investor has continued to support the market, with €17 billion in issuance raised in 2016.
Secondary market volumes We believe European loans offer decent liquidity to investors despite the lack of retail investor participation in the market, thanks to the number of active institutional investors and banks. However, the market is less liquid than that of the US, as shown in Figure 10. The turnover ratio in the European secondary market moderated to 35% in 2016, having fluctuated between 40-50% in the preceding three years.
European loans continue to offer steady liquidity nonetheless. Lower turnover typically translates into greater market stability, which can be attributed to the absence of daily-dealing retail funds in the market (that tend to have shorter investment horizons).
Figure 10: European and US secondary loan market liquidity
European leveraged loan trading volumes
US leveraged loan trading volumes
Source: LSTA Trade Data Study, Thomson Reuters LPC, S&P Capital IQ, as at 31 December 2016
Bid-ask spreads in Europe have tended to be slightly wider than the US, but spreads have narrowed over recent years and the most liquid loans have continued to trade at bid-ask spreads below 100 bps since the start of 2013, as shown in Figure 11.
European loan issuance European high yield bond issuance
100
80
60
40
20
0
€ bi
llion
2008 2009 2010 2011 2012 2013 2014 2015 2016
100%
80%
60%
40%
20%
0%
120
100
80
60
40
20
0
€ bi
llion
2012 2013 2014 2015 2016
European leveraged trading volume Avg. size of the ELLI Turnover ratio (%) (RHS)
2012 2013 2014 2015 2016
US leveraged trading volume Avg. size of the LLI Turnover ratio (%) (RHS)
100%
80%
60%
40%
20%
0%
120
100
80
60
40
20
0
$ bi
llion

9
Figure 11: European and US loan flow-name composite: bid-ask spreads
European loan flow-names composite: bid-ask spread (bps)
US loan flow-names composite: bid-ask spread (bps)
Source: Thomson Reuters, S&P Capital IQ LCD, as at 31 December 2016
Structural trends: the rise of ‘cov-lite’Investors’ search for yield has driven up demand, and this in turn, has given borrowers the upper hand to dictate loan terms, leading to the growth of so-called ‘cov-lite’ structures, i.e. loans that lack maintenance covenants. Europe has, to an extent, adopted this theme from the US to capitalise on borrower-friendly market conditions, and as a result of higher competition among European and US lenders. Supply and demand dynamics have helped to drive the cov-lite trend rather than changes in credit quality, as the post-crisis resurgence of the loan market saw companies pushing for similar terms they had been getting from issuing high yield bonds.
Covenant quality protection is not as weak in Europe as it is in the US, but there is anecdotal evidence of a greater incidence of loosening of permissions over dividend payments and flexibility to incur ad hoc additional debt. As Figure 12 shows, at the height of the credit expansion phase in 2007, institutional cov-lite loans accounted for just 5% of total loan issuance in Europe, disappearing again before steadily gaining in popularity over the past five years. In 2016, cov-lite loans made up around 53% of total loan issuance in Europe compared to 75% of total loan issuance in the US.
Figure 12: Covenant-lite loans as a percentage of total issuance in Europe and the US, 2007 to 2016
Convenant-lite issuance7 Europe
Convenant-lite issuance US
Source: S&P Capital IQ LCD, as at 31 December 2016.
Despite the dilution in investor protections, total new issue leverage was constrained in 2016 – at 5.2x – below that of the US, at 5.5x, though the incidence of greater all-senior structures grew. Moreover, equity contributions in the typical leveraged buyout increased, helping to mitigate the cov-lite rise in Europe (see Figure 13).
Figure 13: Average equity contribution to LBOs and new issue debt / EBITDA multiple at launch
Source: S&P Capital IQ LCD, as at 31 December 2016. Note: US statistics refer to large corporate LBO loans only
Like the US, 2016 saw the announcement of the ECB’s intention to introduce its own (similar) guidelines on leverage in Europe – recommending that banks should not underwrite transactions presenting a ratio of total debt to EBITDA (a measure of operating performance) exceeding 6.0x, with justification and approval required for any exceptions. Watch this space.
200
175
150
125
100
75
50
25
0
Bps
Aug 12 Aug 13Aug 11 Aug 15 Aug 16Aug 14
200
175
150
125
100
75
50
25
0
Bps
Aug 12 Aug 13Aug 11 Aug 15 Aug 16Aug 14
With convenants Convenan-lite
2010 2012
100%
90%
80%
70%
60%
50%
40%
30%
20%
10%
0%2013 2014 2015 201620112007 20092008
With convenants Convenan-lite
2010 2012
100%
90%
80%
70%
60%
50%
40%
30%
20%
10%
0%2013 2014 2015 201620112007 20092008
60%
50%
40%
30%
20%
10%
0%
7
6
5
4
3
2
1
0
New
issu
e de
bt-to
-EBI
TDA
mul
tiple
2004 2005 2006 2007 2008 2009 2010 2011 2012 2013 2014 2015 2016
Equity (LHS) Total US leverage (RHS) Total European leverage (RHS)
7 Institutional covenant-lite volume as a % of total issuance

10
There are a number of additional factors that investors should consider before investment, including access to assets, the need for dedicated analysts and restructuring expertise.
Access to assetsEurope is a relationship-driven market and therefore requires extensive, dedicated resources for successful long-term investing. It is not uncommon for a loan syndication to be closed early, at the request of the borrower, as a club deal, without general syndication being pursued – which is where having existing relationships can be beneficial. Furthermore, an investor may benefit from remaining ‘private-side’, assuming its resources can be walled off from its public credit department. The US market, on the other hand, is arguably more public and ‘bond-like’ in nature with a primary syndication process similar to that for new public bond issues – where the borrower issues an open invitation to lenders to bid for securities.
In the US, managers would tend to benefit from having a larger presence in size (i.e. total assets ) terms as the market comprises more large-cap issuers than Europe, and an ability to execute significant volumes of trades in the secondary market. As European loans involve a high degree of operational complexity, including multi-currency features, there are high barriers to entry to new participants. Managers that have established a firm foothold in the market are therefore at a distinct competitive advantage.
Need for dedicated analysts and restructuring expertiseHaving long-standing and stable relationships with key market stakeholders (such as private equity sponsors, issuers and banks) can give managers unrivalled access to assets and create an ability to be selective. The onus is on lenders to perform the necessary due diligence as part of a robust – often private-side - credit process to help insulate returns for investors and minimise the risk of default.
In Europe, the crossover between the loan and bond markets is limited. The European market is dominated by private equity-owned issuers, meaning companies that offer no other investment opportunities in any public forum (bonds, equity).
Figure 14: Limited crossover between the loans and high yield bond markets in Europe
Source: Credit Suisse, BofA Merrill Lynch European High Yield Index (HE00), as at 31 December 2016
Not only does this arguably mean scope for diversification, but Europe more commonly offers an investor the option to be ‘private’ rather than ‘public’, requiring lenders to undertake their own credit analysis. This private-side status affords a lender with valuable information that is not otherwise available in the public domain, permitting fuller credit monitoring.
The need for dedicated analysts and specialists is as integral to the management of distressed situations as it is for day-to-day investment in Europe. Restructurings are usually privately negotiated in Europe, unlike the Chapter 11 route in the US, and can often be complicated and lengthy albeit with similar (high) recovery rates.
Further considerations for investors
Loans265
issuers
High yield272
issuers
27issuers
While investment in European and US loans can offer compelling returns and greater downside protection to an investor, we believe diversification and stock (issuer) selection in a leveraged loan portfolio are essential attributes as leveraged loans present asymmetric risk-return characteristics. It is therefore important that each manager is selective in the investments made to protect a portfolio from default risk, enabled by significant scale and flexibility and having good access to assets.
M&G is a large European fund manager that employs a European loan strategy albeit incorporating US company investment when lending to global companies. At M&G, it is our aim to provide an investor with exposure to large, stable businesses, including those of truly global presence, while also bringing diversification and liquidity benefits.
Portfolio diversification benefits for loan investors

11
Structural shifts in the way companies obtain longer-term capital have created an attractive opportunity for large-scale institutional investment in the asset class. There remains significant scope for increased institutional investment in European loans and we believe that it is an attractive time to invest.
European leveraged loans offer relative value compared to US loans. The spread premium between the two markets stood at 60 bps at the end of 2016 (see Figure 15) – the highest since the fourth quarter of 2012 – so there is a value opportunity to be captured. As an aside, credit spreads in the US have tightened, owing to substantial retail fund inflows, with $24 billion flowing into the market in the period between July 2016 and the end of the year.
Figure 15: European and US loan discount margins, 2013 to 2016
Source: Credit Suisse (CS), as at 31 December 2016
In Europe, defaults are not expected to be a key factor in performance terms in 2017, as the loan market has limited exposure to troubled sectors. Based on historical data on default rates for the Credit Suisse Western European Leveraged Loan Index, the average default rate (by value) was 4.2% in the period from 2008 to end 2016, as shown in Figure 16.
Figure 16: S&P ELLI trailing 12-month nominal default rate (by value), 2008 to 2016
Source: S&P Capital IQ LCD European Leveraged Loan Index, as at 31 December 2016
Together with a low default outlook, European loans have low refinancing risk in the near term, as can be seen in Figure 17, following the wave of refinancing activity in the fourth quarter of 2016.
Figure 17: Europe faces minimal refinancing pressure in the near term
European loan market maturity profile, 2017 to 2026
Source: S&P Capital IQ LCD, as at 31 January 2017
Europe and the US are at differing stages of their economic cycles; have divergent attitudes to monetary stimulus and fiscal expansion; and both display potential vulnerability to populist politics. As credit markets are likely to continue to take their cue from global monetary policy, macroeconomic and political events, including Brexit negotiations and the actions of the ECB and the US Federal Reserve, investors will be looking for continued stability of returns in an uncertain climate.
While episodes of market volatility cannot be avoided completely, we expect loans to continue to exhibit far greater stability than wider debt markets. M&G’s view is that a conservative, senior-biased European leveraged loan strategy will outperform the market over a cycle.
Conclusions
CS US loan index CS Euro loan index
700
600
500
400
Bps
2015 20162014
506
446
S&P ELLI default rate
12%
10%
8%
6%
4%
2%
0%
Average default rate = 4.2%
Sep
08
Dec
08
Sep
09
Dec
09
Sep
10
Dec
10
Sep
11
Dec
11
Sep
12
Dec
12
Sep
13
Dec
13
Sep
14
Dec
14
Sep
15
Dec
15
Sep
16
Dec
16
40
30
20
10
0
€ bi
llion
2018 2020 2021 2022 2023 202420192017 2025 2026

For Investment Professionals only.
The distribution of this document does not constitute an offer or solicitation. Past performance is not a guide to future performance. The value of investments can fall as well as rise. There is no guarantee that these investment strategies will work under all market conditions or are suitable for all investors and you should ensure you understand the risk profile of the products or services you plan to purchase.
This document is issued by M&G Investment Management Limited. The services and products provided by M&G Investment Management Limited are available only to investors who come within the category of the Professional Client as defined in the Financial Conduct Authority’s Handbook. They are not available to individual investors, who should not rely on this communication. Information given in this document has been obtained from, or based upon, sources believed by us to be reliable and accurate although M&G does not accept liability for the accuracy of the contents. M&G does not offer investment advice or make recommendations regarding investments. Opinions are subject to change without notice. Reference in this document to individual companies is included solely for the purpose of illustration and should not be construed as a recommendation to buy or sell the same.
M&G Investments is a business name of M&G Investment Management Limited and is used by other companies within the Prudential Group. M&G Investment Management Limited is registered in England and Wales under number 936683 with its registered office at Laurence Pountney Hill, London EC4R 0HH. M&G Investment Management Limited is authorised and regulated by the Financial Conduct Authority. 56268 / APR2017 / IM147 UK
Source: M&G Investments, as at March 2017
M&G and European leveraged loansM&G was one of the first non-bank investors in European leveraged loans, in 1999, and is one of the largest loan managers in Europe today. Approximately €9.5 billion is managed on behalf of institutional investors across a range of funds in both segregated and pooled form, with the vast majority being for pension funds and insurance companies from Europe and Asia. M&G’s flagship all-senior loan strategy was launched in 2005 and is now €3.7 billion in size, with close to 200 institutional investors.
Contact
Andrew Swan +44 (0)20 7548 2375 [email protected]
John Atkin +44 (0)20 7548 3466 [email protected]
Henry Barstow +44 (0)20 7548 3469 [email protected]
Sunita Dey +44 (0)20 7548 3393 [email protected]
www.mandg.co.uk/institutions [email protected]