comparing the volumetric and mechanical properties of
TRANSCRIPT

Comparing the Volumetric and Mechanical Properties of Laboratory and Field Specimens of Asphalt Concrete
TRB Webinar April 20, 2017
2:00 PM to 3:30 PM ET
Louay N. MohammadSam Cooper, III
Department of Civil and Environmental EngineeringLA Transportation Research Center
Louisiana State University
Webinar Outline Objective / Scope Conduct of Experiment Data Analysis
– Impacts of process-based factors on differences specimen types:
» Design (LL), Production (PL) and Construction (PF)– Compare mechanistic properties of 3 specimen types
» LL, PL, PF» LWT, E* (Axial, Indirect)» Develop shift factors
– Compare volumetric properties of 3 specimen types» LL, PL, PF» Develop tolerance recommendation
Summary
Research Team
Acknowledgements NCHRP
– Dr. Ed Harrigan– Project Technical Review Panel
LADOTD and LTRC Research Staff Participating Contractors/DOTs
– Stark Asphalt Florida DOT– Mathy Const. Co. Iowa DOT– Prairie Const. Co. Michigan DOT– Barriere Const. Co. South Dakota DOT– Diamond B Const. Virginia DOT– Community Asphalt Wisconsin DOT
Texas Transportation Institute University of Wisconsin
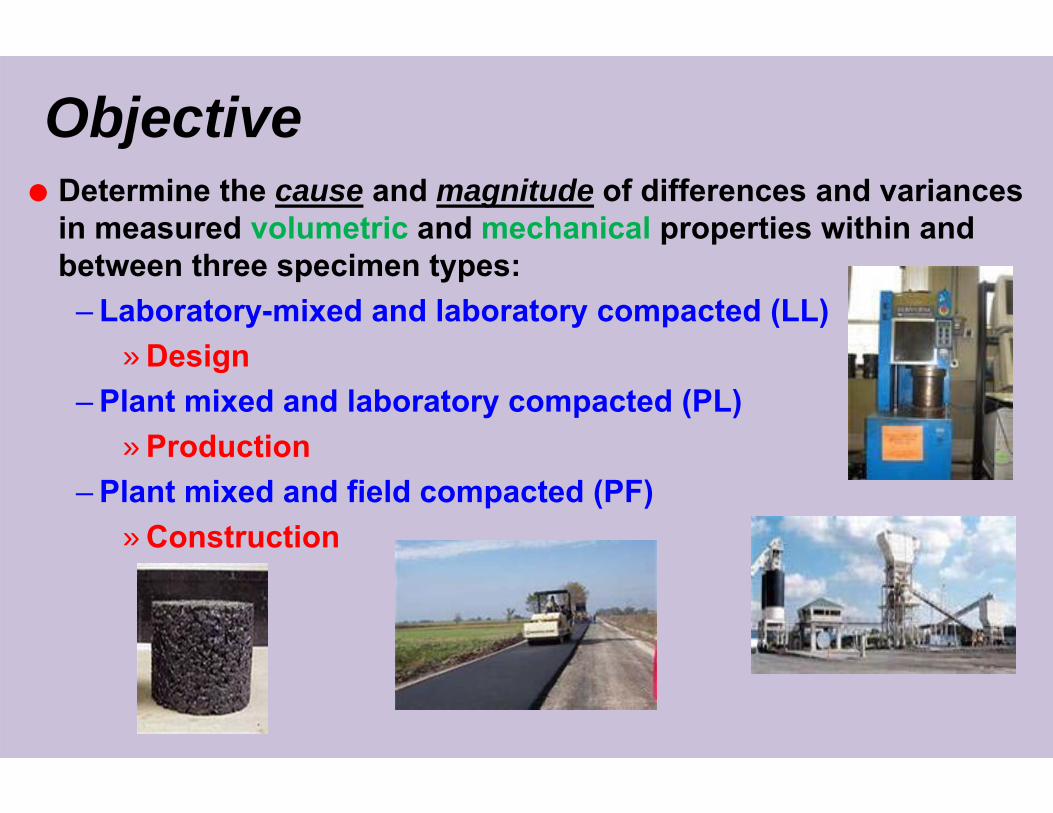
Objective Determine the cause and magnitude of differences and variances
in measured volumetric and mechanical properties within and between three specimen types:
– Laboratory-mixed and laboratory compacted (LL)» Design
– Plant mixed and laboratory compacted (PL)» Production
– Plant mixed and field compacted (PF)» Construction
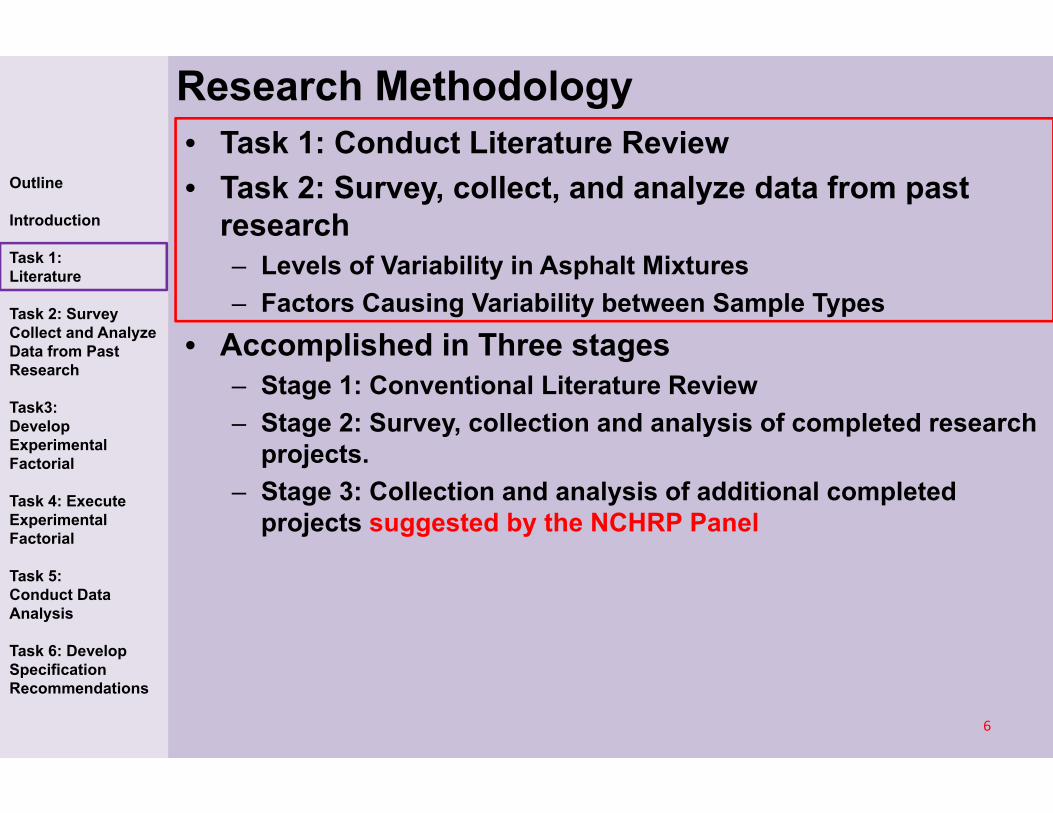
Research Methodology• Task 1: Conduct Literature Review• Task 2: Survey, collect, and analyze data from past
research– Levels of Variability in Asphalt Mixtures– Factors Causing Variability between Sample Types
• Accomplished in Three stages – Stage 1: Conventional Literature Review– Stage 2: Survey, collection and analysis of completed research
projects.– Stage 3: Collection and analysis of additional completed
projects suggested by the NCHRP Panel
6
Outline
Introduction
Task 1: Literature
Task 2: Survey Collect and Analyze Data from Past Research
Task3: Develop Experimental Factorial
Task 4: Execute Experimental Factorial
Task 5: Conduct Data Analysis
Task 6: Develop Specification Recommendations
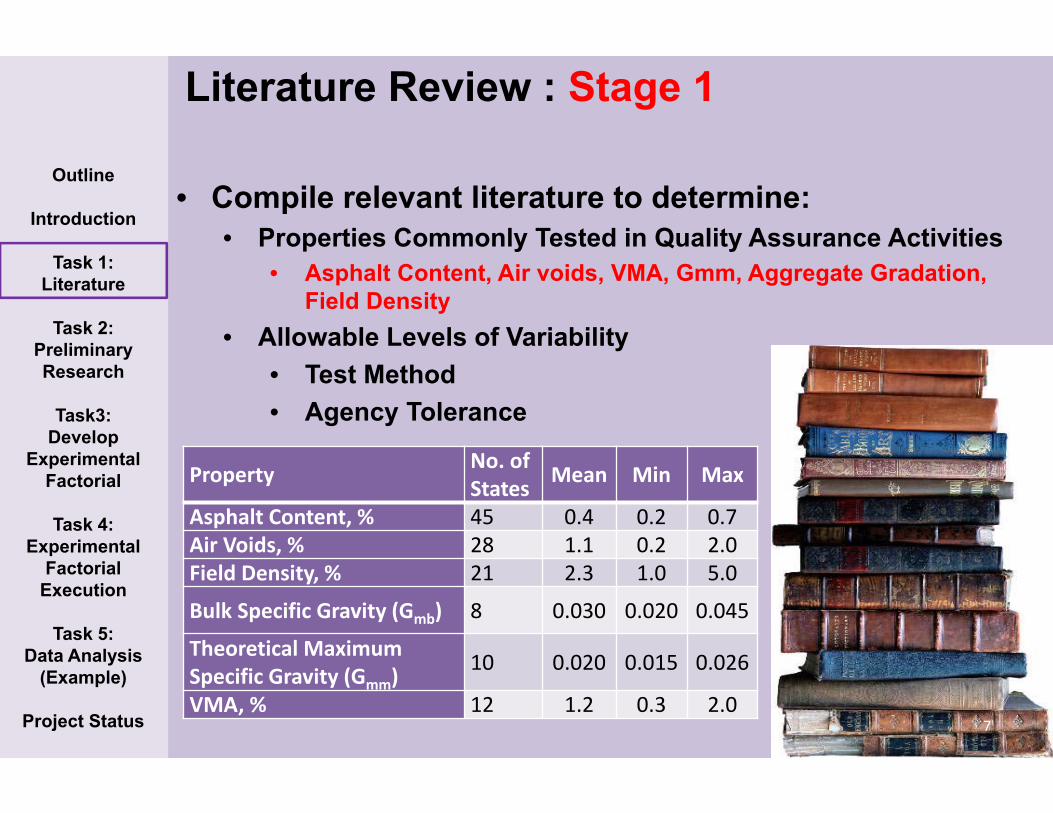
Literature Review : Stage 1
• Compile relevant literature to determine:• Properties Commonly Tested in Quality Assurance Activities
• Asphalt Content, Air voids, VMA, Gmm, Aggregate Gradation, Field Density
• Allowable Levels of Variability• Test Method• Agency Tolerance
7
Outline
Introduction
Task 1: Literature
Task 2: Preliminary Research
Task3: Develop
Experimental Factorial
Task 4: Experimental
Factorial Execution
Task 5: Data Analysis
(Example)
Project Status
Property No. of States Mean Min Max
Asphalt Content, % 45 0.4 0.2 0.7Air Voids, % 28 1.1 0.2 2.0Field Density, % 21 2.3 1.0 5.0
Bulk Specific Gravity (Gmb) 8 0.030 0.020 0.045
Theoretical Maximum Specific Gravity (Gmm)
10 0.020 0.015 0.026
VMA, % 12 1.2 0.3 2.0

Literature Review : Stage 1
• Compile relevant literature to determine:• 60 research publications were evaluated to determine the state
of the practice• Properties Commonly Tested in Quality Assurance Activities
• Asphalt Content, Air voids, VMA, Gmm, Aggregate Gradation, Field Density
• Allowable Levels of Variability• Test Method• Agency Tolerance
8
Outline
Introduction
Task 1: Literature
Task 2: Preliminary Research
Task3: Develop
Experimental Factorial
Task 4: Experimental
Factorial Execution
Task 5: Data Analysis
(Example)
Project Status
Property No. of States Mean Min Max
Asphalt Content, % 45 0.4 0.2 0.7Air Voids, % 28 1.1 0.2 2.0Field Density, % 21 2.3 1.0 5.0
Bulk Specific Gravity (Gmb) 8 0.030 0.020 0.045
Theoretical Maximum Specific Gravity (Gmm)
10 0.020 0.015 0.026
VMA, % 12 1.2 0.3 2.0

• Conduct a worldwide survey • 50 state DOTs, District of Columbia, Federal Highway Administration
(FHWA), Canada, Puerto Rico, England, and the Netherlands.• More favorable responses for volumetric data than the mechanistic
data.• In general, the data sets included PL and PF samples• Data analyzed from
• The Netherlands• 13 States• FHWA Mobile Laboratory
• Samples may be tested by different users• Contractor• State• Third Party
9
Literature Review : Stage 2Outline
Introduction
Task 1: Literature
Task 2: Preliminary Research
Task3: Develop
Experimental Factorial
Task 4: Experimental
Factorial Execution
Task 5: Data Analysis
(Example)
Project Status

• Additional search was conducted:• Lacking data to determine cause and magnitude of differences among
all three specimen types.
• Specific Sources of Data:• Universities
• UNR
• State Dots• LADOTD• AZDOT
• National Database• LTPP• NCHRP Reports
• Targeted identification of process–based factors causing variability
10
Literature Review: Stage 3
Outline
Introduction
Task 1: Literature
Task 2: Survey Collect and Analyze Data from Past Research
Task3: Develop Experimental Factorial
Task 4: Execute Experimental Factorial
Task 5: Conduct Data Analysis
Task 6: Develop Specification Recommendations

• Stage 2:• Could not identify projects with properties of multiple sample
types• Therefore, need to continue the search for projects with
multiple sample types• Stage 3:
• Data sets did not all include three sample types for a specific mixture.
• Process-based factors were not controlled.
11
Literature Review and Preliminary Research -- Limitations
Outline
Introduction
Task 1: Literature
Task 2: Survey Collect and Analyze Data from Past Research
Task3: Develop Experimental Factorial
Task 4: Execute Experimental Factorial
Task 5: Conduct Data Analysis
Task 6: Develop Specification Recommendations

• Candidate Factors available as Sources of Variability• Process-Based Factors
ID Factors Details
Process Ba
sed Factors
1 Compaction methods Difference between field and laboratory compaction methods
2 Silo storage Extended storage time at the plant may harden asphalt in the mix
3 Baghouse fines May affect mix gradation and other volumetric properties
4 Reheating May affect binder properties and thus compacted specimens
5 Aggregate absorption May differ between plant and lab and thus affect variability
6 Plant type and settings May affect mixture properties and thus variability
7 Sampling location Sampling location (plant, behind paver, …) may affect variability
Additio
nal Factors 8 Gradation density Sensitive mixes are more susceptible to mix proportions than non‐sensitive
mixtures
9 MTD Use of MTD and lack of MTD use may affect mix properties and variability
10 Aggregate degradation Mixture production may increase the fines fraction for soft aggregates
11 Aggregate moisture Moisture in the stockpile may affect mix properties
12
Literature Review: Stage 3 -- Methodology

• Process-Based Factors • Present during the production and testing of
a mixture.• Source of the delivery of reclaimed fine
material : baghouse fines, reclaimed asphalt pavement
• Time delay in specimen fabrication: reheating, silo storage, sampling location, plant type, use of material transfer device
• Aggregate properties: Absorption, Degradation, Angularity, Surface Texture
• Aggregate stockpile in situ properties: moisture content
13
Outline
Introduction
Task 1: Literature
Task 2: Survey Collect and Analyze Data from Past Research
Task3: Develop Experimental Factorial
Task 4: Execute Experimental Factorial
Task 5: Conduct Data Analysis
Task 6: Develop Specification Recommendations
Research Methodology
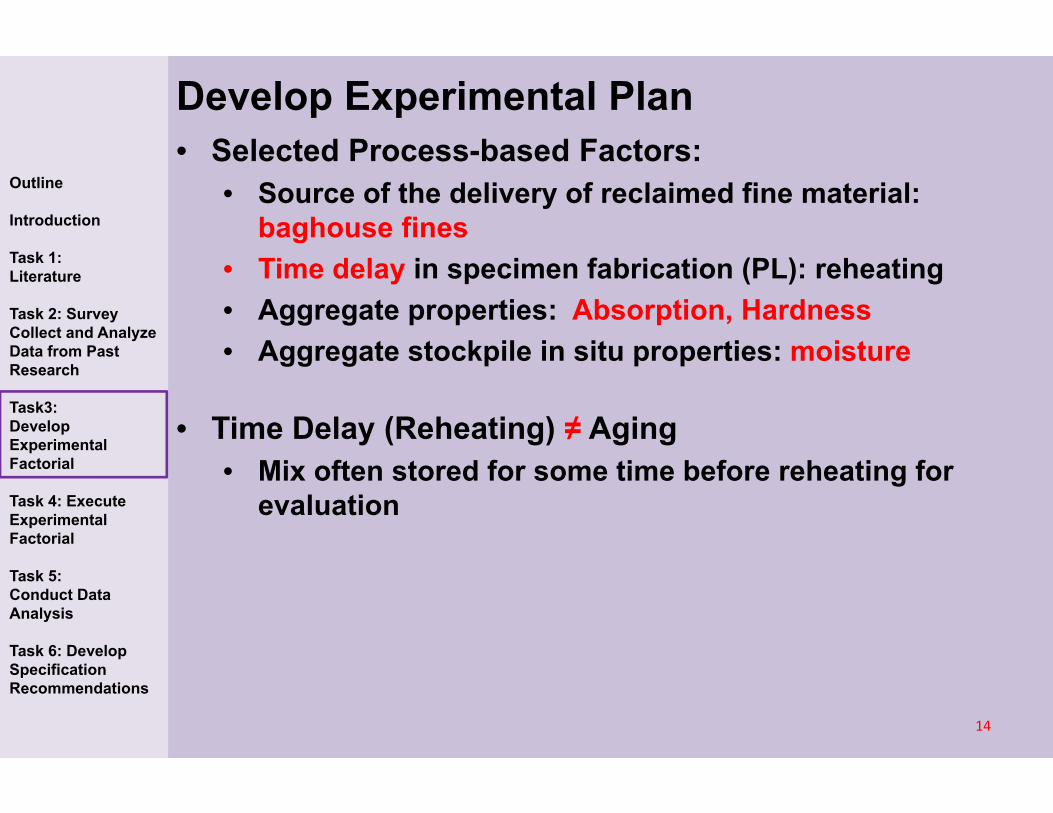
Develop Experimental Plan• Selected Process-based Factors:
• Source of the delivery of reclaimed fine material: baghouse fines
• Time delay in specimen fabrication (PL): reheating• Aggregate properties: Absorption, Hardness• Aggregate stockpile in situ properties: moisture
• Time Delay (Reheating) ≠ Aging• Mix often stored for some time before reheating for
evaluation
14
Outline
Introduction
Task 1: Literature
Task 2: Survey Collect and Analyze Data from Past Research
Task3: Develop Experimental Factorial
Task 4: Execute Experimental Factorial
Task 5: Conduct Data Analysis
Task 6: Develop Specification Recommendations

• Factorial• Each factor varied on two contrasting levels (high vs. low) • Factorial based on 2K design
• K = number of factors (5)• 25 = 32 mixtures• X 3 specimen types = 96 test combinations per property
• Volumetric properties and Mechanistic properties
Factor ID Factor Low Level (‐) High Level (+)1 Use of Baghouse Fines No Yes2 Time delay No Yes3 Aggregate Absorption Low High4 Aggregate Degradation Soft Hard5 Aggregate Stockpile Moisture Low High
15
Develop Experimental Plan
Outline
Introduction
Task 1: Literature
Task 2: Survey Collect and Analyze Data from Past Research
Task3: Develop Experimental Factorial
Task 4: Execute Experimental Factorial
Task 5: Conduct Data Analysis
Task 6: Develop Specification Recommendations

• Volumetric properties – AV, VMA, Gmm, AC (Solvent), gradation, Gsb
• (LL, PL, PF)
• Mechanistic properties– Hamburg LWT
• (LL, PL, PF) – IDT Dynamic modulus
• (LL, PL, PF) – Axial Dynamic Modulus
• (LL, PL)
16
Develop Experimental Plan
Outline
Introduction
Task 1: Literature
Task 2: Survey Collect and Analyze Data from Past Research
Task3: Develop Experimental Factorial
Task 4: Execute Experimental Factorial
Task 5: Conduct Data Analysis
Task 6: Develop Specification Recommendations
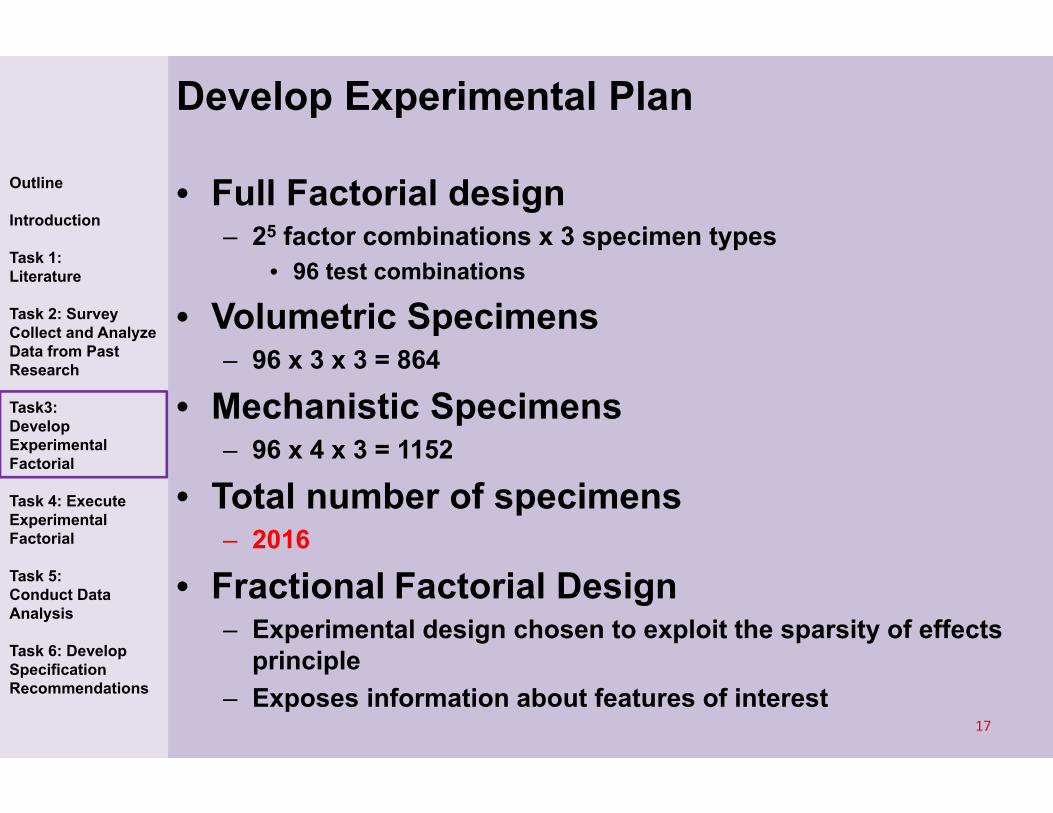
• Full Factorial design– 25 factor combinations x 3 specimen types
• 96 test combinations
• Volumetric Specimens– 96 x 3 x 3 = 864
• Mechanistic Specimens– 96 x 4 x 3 = 1152
• Total number of specimens– 2016
• Fractional Factorial Design– Experimental design chosen to exploit the sparsity of effects
principle– Exposes information about features of interest
17
Develop Experimental Plan
Outline
Introduction
Task 1: Literature
Task 2: Survey Collect and Analyze Data from Past Research
Task3: Develop Experimental Factorial
Task 4: Execute Experimental Factorial
Task 5: Conduct Data Analysis
Task 6: Develop Specification Recommendations

• Quarter fractional design– 25-2 factor combinations x 3 specimen types
• 24 test combinations
• Volumetric properties– 24 x 3 x 3 = 216
• Mechanistic properties– 24 x 4 x 3 = 288
• Total number of samples– 504
• Evaluate the main effects of the factors selected
18
Develop Experimental Plan
Outline
Introduction
Task 1: Literature
Task 2: Survey Collect and Analyze Data from Past Research
Task3: Develop Experimental Factorial
Task 4: Execute Experimental Factorial
Task 5: Conduct Data Analysis
Task 6: Develop Specification Recommendations
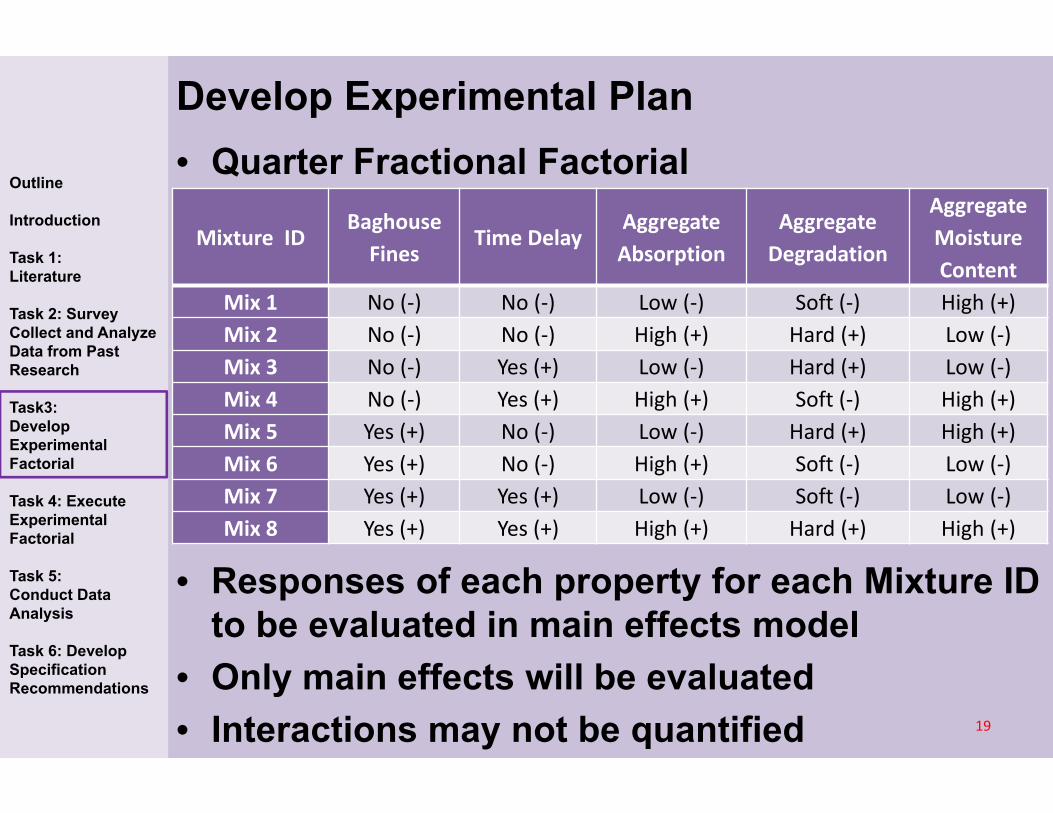
• Quarter Fractional Factorial
• Responses of each property for each Mixture ID to be evaluated in main effects model
• Only main effects will be evaluated• Interactions may not be quantified
Mixture IDBaghouse Fines
Time DelayAggregate Absorption
Aggregate Degradation
Aggregate Moisture Content
Mix 1 No (‐) No (‐) Low (‐) Soft (‐) High (+)Mix 2 No (‐) No (‐) High (+) Hard (+) Low (‐)Mix 3 No (‐) Yes (+) Low (‐) Hard (+) Low (‐)Mix 4 No (‐) Yes (+) High (+) Soft (‐) High (+)Mix 5 Yes (+) No (‐) Low (‐) Hard (+) High (+)Mix 6 Yes (+) No (‐) High (+) Soft (‐) Low (‐)Mix 7 Yes (+) Yes (+) Low (‐) Soft (‐) Low (‐)Mix 8 Yes (+) Yes (+) High (+) Hard (+) High (+)
19
Develop Experimental Plan
Outline
Introduction
Task 1: Literature
Task 2: Survey Collect and Analyze Data from Past Research
Task3: Develop Experimental Factorial
Task 4: Execute Experimental Factorial
Task 5: Conduct Data Analysis
Task 6: Develop Specification Recommendations

20
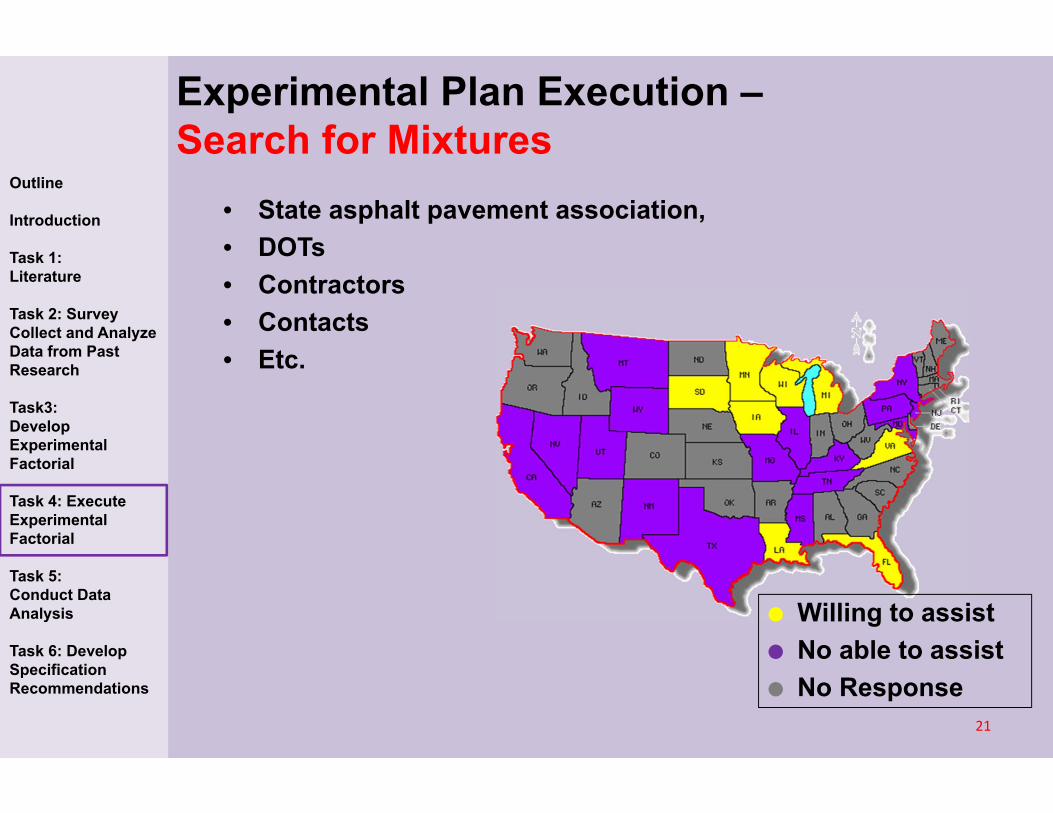
Experimental Plan Execution –Search for Mixtures
• State asphalt pavement association,• DOTs• Contractors• Contacts• Etc.
Outline
Introduction
Task 1: Literature
Task 2: Survey Collect and Analyze Data from Past Research
Task3: Develop Experimental Factorial
Task 4: Execute Experimental Factorial
Task 5: Conduct Data Analysis
Task 6: Develop Specification Recommendations
21
Experimental Plan Execution –Search for Mixtures
• State asphalt pavement association,• DOTs• Contractors• Contacts• Etc.
Outline
Introduction
Task 1: Literature
Task 2: Survey Collect and Analyze Data from Past Research
Task3: Develop Experimental Factorial
Task 4: Execute Experimental Factorial
Task 5: Conduct Data Analysis
Task 6: Develop Specification Recommendations
Willing to assist No able to assist No Response

• LL Specimen Fabrication– Approximately 120 kg of loose mixture required
22
Experimental Plan Execution
Outline
Introduction
Task 1: Literature
Task 2: Survey Collect and Analyze Data from Past Research
Task3: Develop Experimental Factorial
Task 4: Execute Experimental Factorial
Task 5: Conduct Data Analysis
Task 6: Develop Specification Recommendations
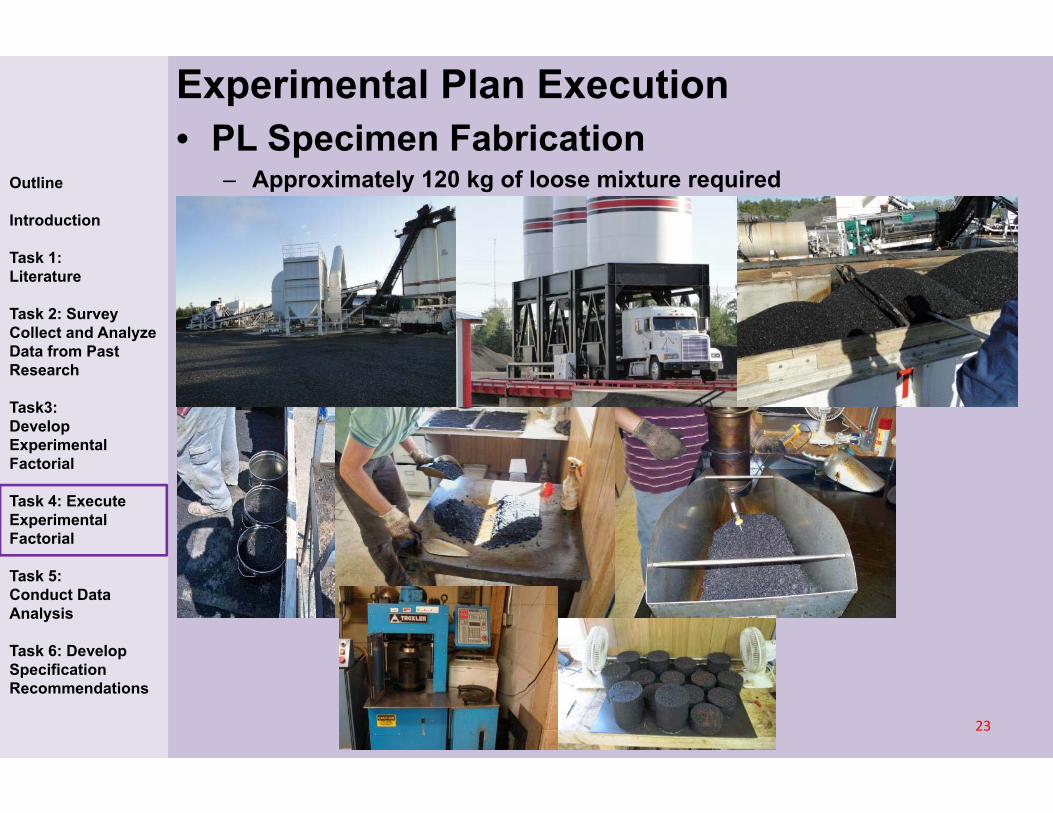
• PL Specimen Fabrication– Approximately 120 kg of loose mixture required
23
Experimental Plan Execution
Outline
Introduction
Task 1: Literature
Task 2: Survey Collect and Analyze Data from Past Research
Task3: Develop Experimental Factorial
Task 4: Execute Experimental Factorial
Task 5: Conduct Data Analysis
Task 6: Develop Specification Recommendations

• PF Specimen Collection
• Roadway cores collected prior to trafficking• Each core is trimmed to required specimen size
for testing 24
Experimental Plan Execution
Outline
Introduction
Task 1: Literature
Task 2: Survey Collect and Analyze Data from Past Research
Task3: Develop Experimental Factorial
Task 4: Execute Experimental Factorial
Task 5: Conduct Data Analysis
Task 6: Develop Specification Recommendations

• Perform laboratory evaluation
25
Experimental Plan Execution
Outline
Introduction
Task 1: Literature
Task 2: Survey Collect and Analyze Data from Past Research
Task3: Develop Experimental Factorial
Task 4: Execute Experimental Factorial
Task 5: Conduct Data Analysis
Task 6: Develop Specification Recommendations
=?
=?
Laboratory Design Plant Production Field Construction
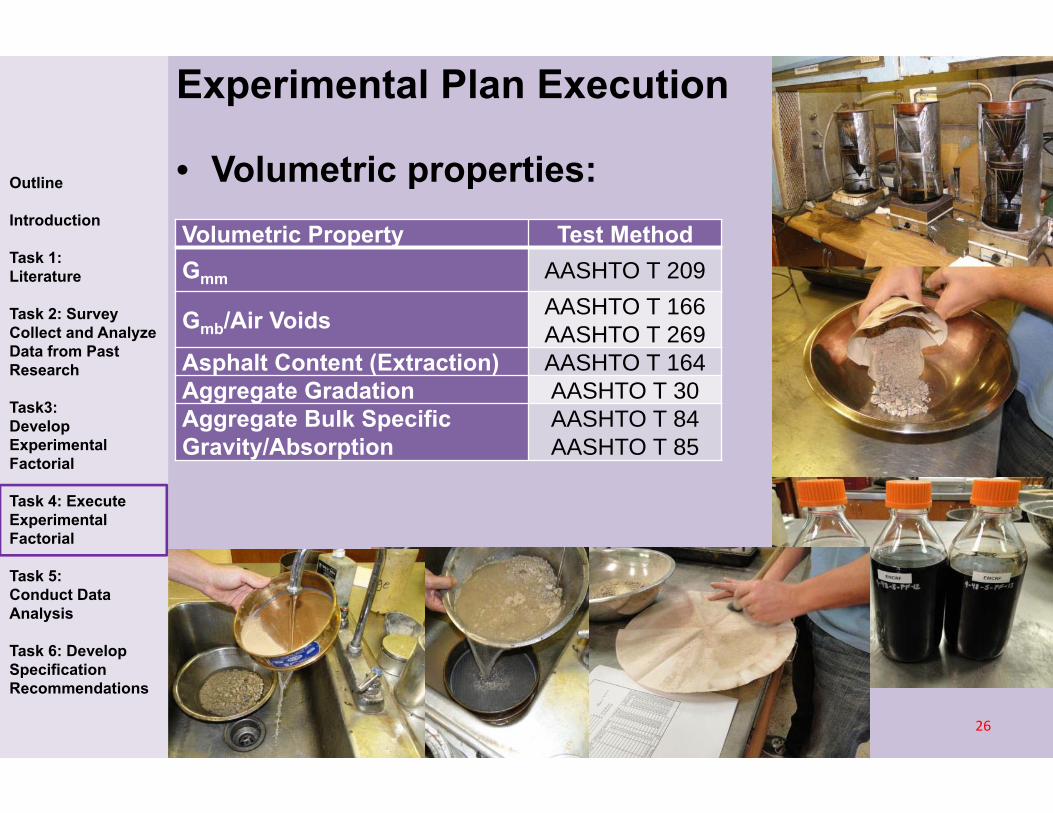
• Volumetric properties:Volumetric Property Test MethodGmm AASHTO T 209
Gmb/Air Voids AASHTO T 166AASHTO T 269
Asphalt Content (Extraction) AASHTO T 164Aggregate Gradation AASHTO T 30Aggregate Bulk Specific Gravity/Absorption
AASHTO T 84AASHTO T 85
26
Experimental Plan Execution
Outline
Introduction
Task 1: Literature
Task 2: Survey Collect and Analyze Data from Past Research
Task3: Develop Experimental Factorial
Task 4: Execute Experimental Factorial
Task 5: Conduct Data Analysis
Task 6: Develop Specification Recommendations
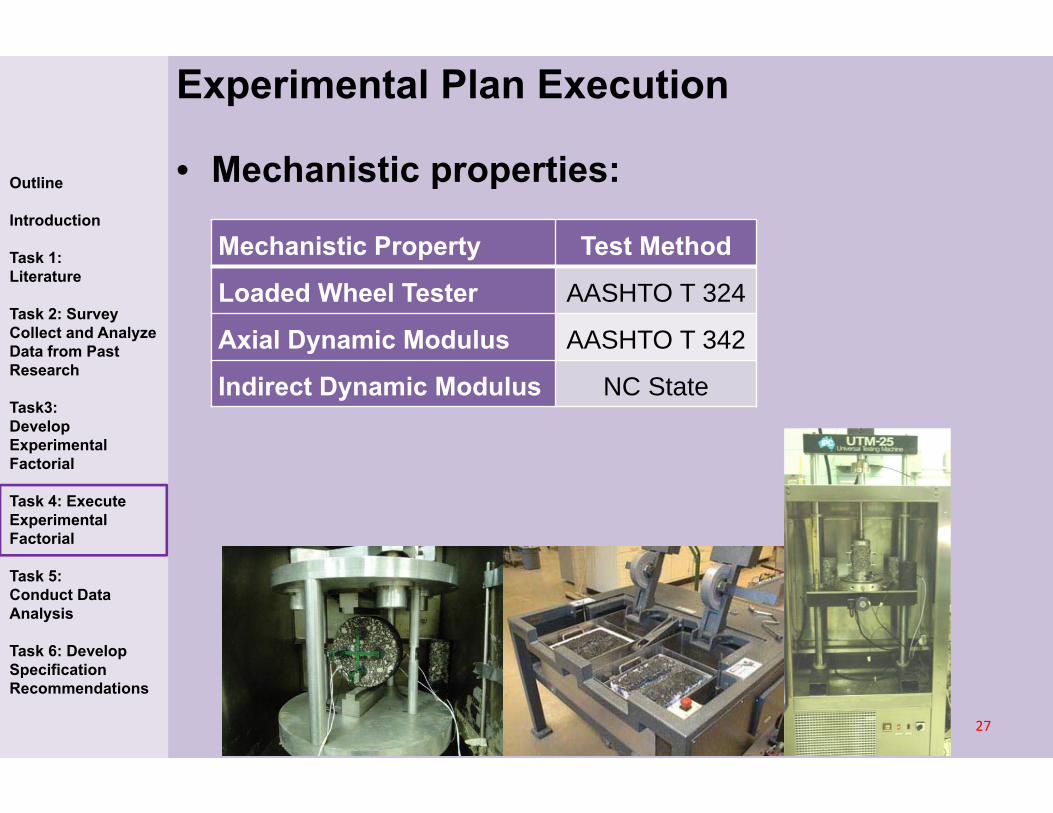
• Mechanistic properties:
Mechanistic Property Test Method
Loaded Wheel Tester AASHTO T 324
Axial Dynamic Modulus AASHTO T 342
Indirect Dynamic Modulus NC State
27
Experimental Plan Execution
Outline
Introduction
Task 1: Literature
Task 2: Survey Collect and Analyze Data from Past Research
Task3: Develop Experimental Factorial
Task 4: Execute Experimental Factorial
Task 5: Conduct Data Analysis
Task 6: Develop Specification Recommendations

Wheel Diameter: 203.5 mm (8 inch)Wheel Width: 47mm (1.85 inch)
Fixed Load: 703 N (158 lbs)Rolling Speed: 1.1 km/hr
Passing Rate: 52 passes/min
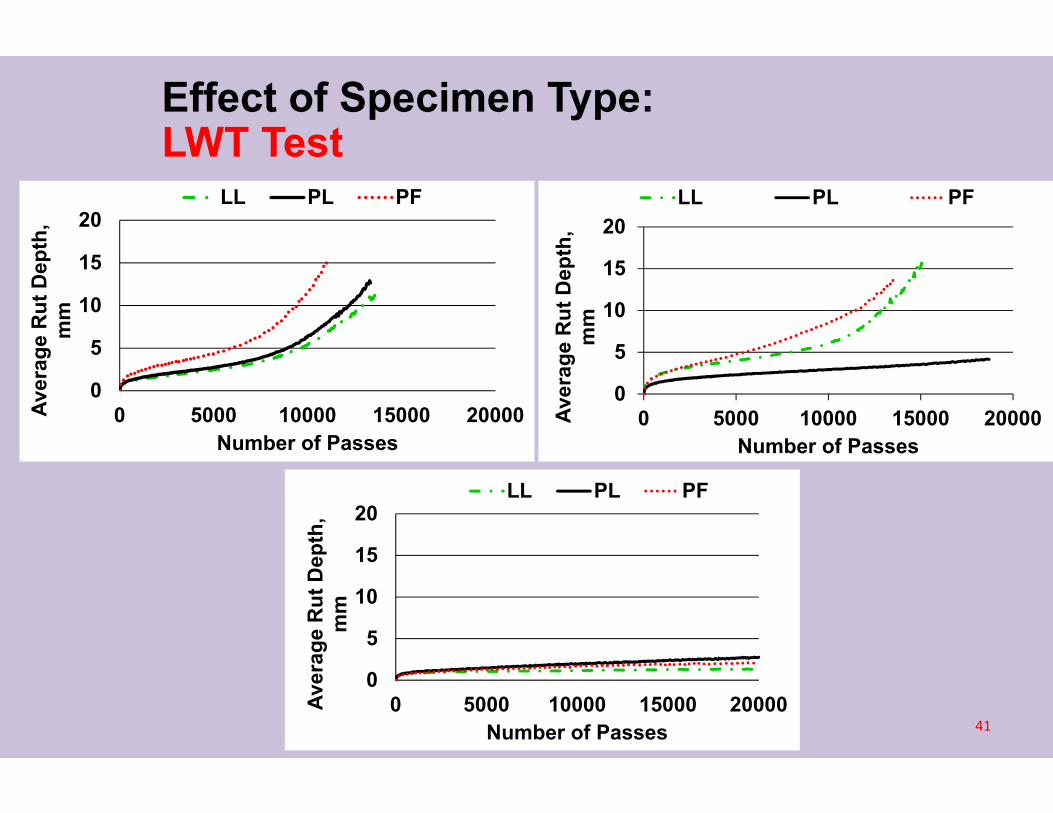
• AASHTO T 324-04• Damage by rolling a steel wheel across
the surface of a sample• Cylindrical, Slab
• 50oC, Wet or dry• Deformation at 20,000 passes is recorded
Mechanistic Test –Loaded Wheel Tracking Test (LWT)
28
Outline
Introduction
Task 1: Literature
Task 2: Survey Collect and Analyze Data from Past Research
Task3: Develop Experimental Factorial
Task 4: Execute Experimental Factorial
Task 5: Conduct Data Analysis
Task 6: Develop Specification Recommendations

• IPC UTM-25, AMPT• AASHTO T-342• Sinusoidal axial
compressive stress is applied to a specimen • temperature and frequency
• Dynamic modulus0
0|*|
E
Frequency (HZ) 25, 10, 5, 1, 0.5, 0.1Temp. (°C) -10, 4.4, 25, 38, 54.4
• Phase Angle 360p
i
TT
Mechanistic Test–Axial Dynamic Modulus |E*|
29
Outline
Introduction
Task 1: Literature
Task 2: Survey Collect and Analyze Data from Past Research
Task3: Develop Experimental Factorial
Task 4: Execute Experimental Factorial
Task 5: Conduct Data Analysis
Task 6: Develop Specification Recommendations
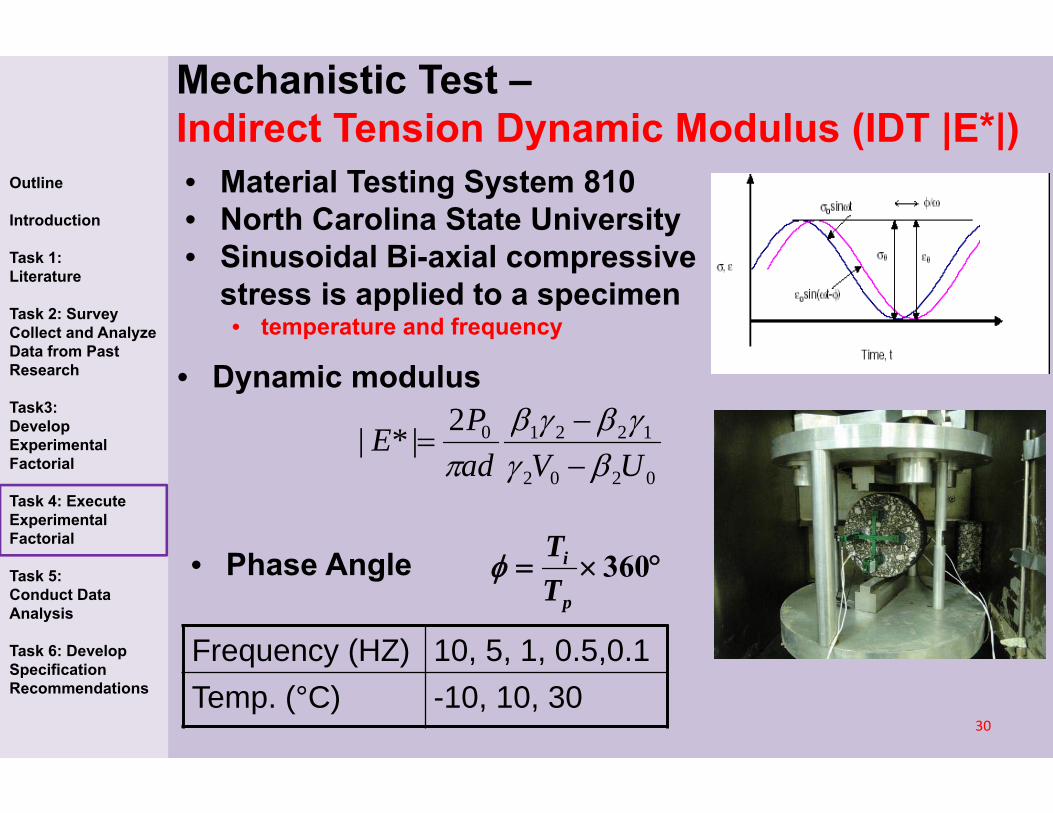
• Material Testing System 810• North Carolina State University• Sinusoidal Bi-axial compressive
stress is applied to a specimen • temperature and frequency
Frequency (HZ) 10, 5, 1, 0.5,0.1Temp. (°C) -10, 10, 30
• Dynamic modulus
0202
122102|*|UVad
PE
• Phase Angle 360p
i
TT
Mechanistic Test –Indirect Tension Dynamic Modulus (IDT |E*|)
30
Outline
Introduction
Task 1: Literature
Task 2: Survey Collect and Analyze Data from Past Research
Task3: Develop Experimental Factorial
Task 4: Execute Experimental Factorial
Task 5: Conduct Data Analysis
Task 6: Develop Specification Recommendations

31
Individual Mixture Statistics

32
Data Analysis Methodology• For Each Parameter (i.e. Air Voids)
• Each Sample Type (i.e. LL, PL, PF)• Descriptive Statistics
• Mean• Standard Deviation• Coefficient of Variation
Quality Control check with test method
Outline
Introduction
Task 1: Literature
Task 2: Survey Collect and Analyze Data from Past Research
Task3: Develop Experimental Factorial
Task 4: Execute Experimental Factorial
Task 5: Conduct Data Analysis
Task 6: Develop Specification Recommendations
33
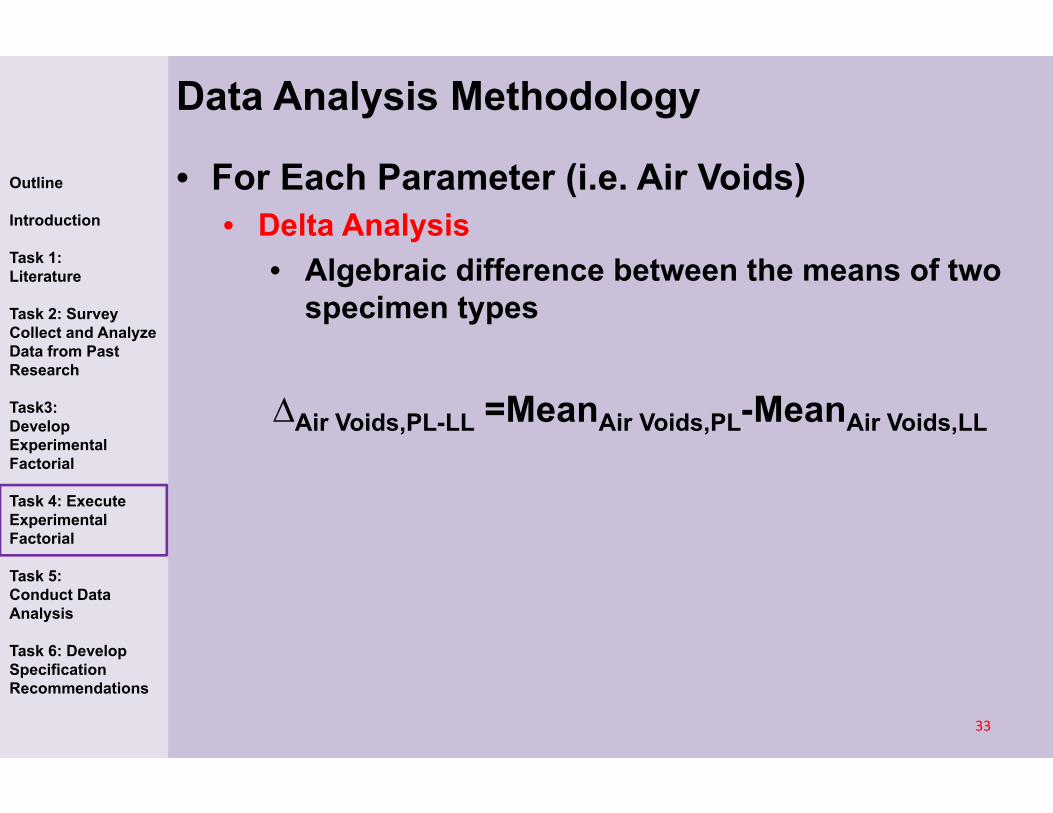
Data Analysis Methodology
• For Each Parameter (i.e. Air Voids)• Delta Analysis
• Algebraic difference between the means of two specimen types
∆Air Voids,PL-LL =MeanAir Voids,PL-MeanAir Voids,LL
Outline
Introduction
Task 1: Literature
Task 2: Survey Collect and Analyze Data from Past Research
Task3: Develop Experimental Factorial
Task 4: Execute Experimental Factorial
Task 5: Conduct Data Analysis
Task 6: Develop Specification Recommendations

• Each mix is to be evaluated individually to determine magnitude of variabilityand difference among sample types.
• Ttest/Ftest – Two groups
• Analysis of Variance – More than two groups
34
Data Analysis Methodology –Statistical Analysis
Tstat·
http://www.itl.nist.gov/div898/handbook/eda/section3/eda3672.htm
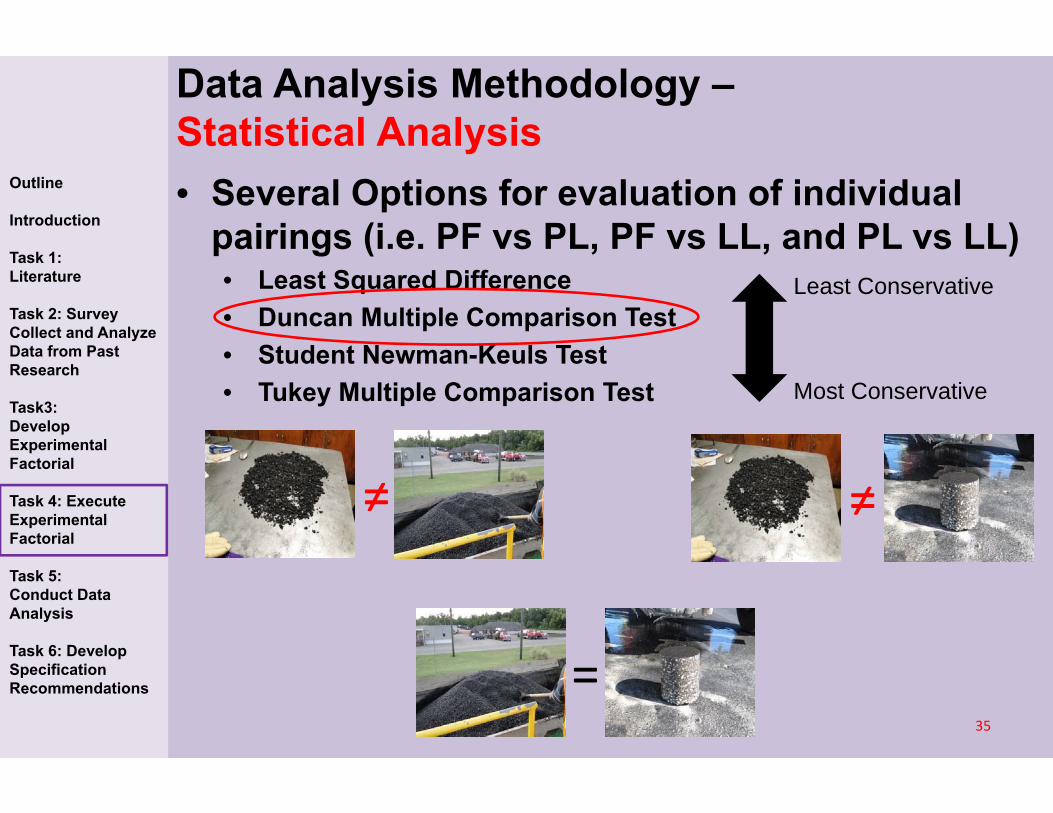
• Several Options for evaluation of individual pairings (i.e. PF vs PL, PF vs LL, and PL vs LL)• Least Squared Difference • Duncan Multiple Comparison Test• Student Newman-Keuls Test• Tukey Multiple Comparison Test
35
Least Conservative
Most Conservative
Data Analysis Methodology –Statistical Analysis
≠
=
≠
Outline
Introduction
Task 1: Literature
Task 2: Survey Collect and Analyze Data from Past Research
Task3: Develop Experimental Factorial
Task 4: Execute Experimental Factorial
Task 5: Conduct Data Analysis
Task 6: Develop Specification Recommendations
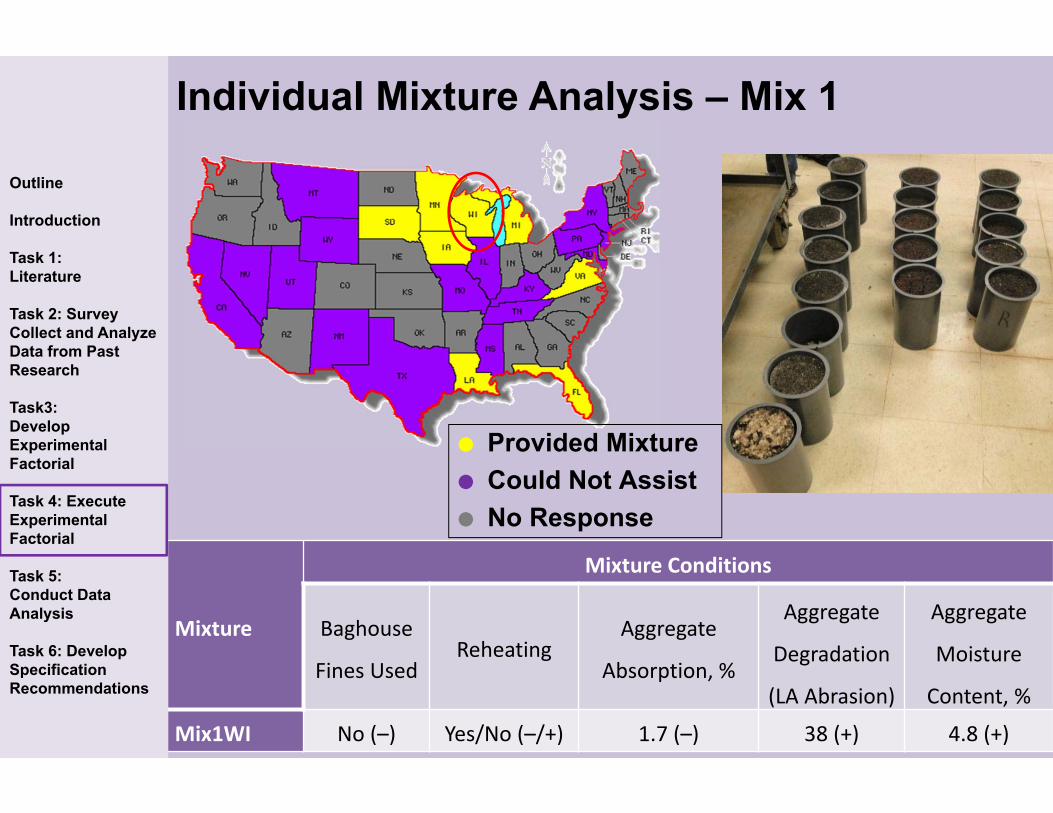
Individual Mixture Analysis – Mix 1
36
Mixture
Mixture Conditions
Baghouse
Fines UsedReheating
Aggregate
Absorption, %
Aggregate
Degradation
(LA Abrasion)
Aggregate
Moisture
Content, %
Mix1WI No (–) Yes/No (–/+) 1.7 (–) 38 (+) 4.8 (+)
Outline
Introduction
Task 1: Literature
Task 2: Survey Collect and Analyze Data from Past Research
Task3: Develop Experimental Factorial
Task 4: Execute Experimental Factorial
Task 5: Conduct Data Analysis
Task 6: Develop Specification Recommendations
Provided Mixture Could Not Assist No Response
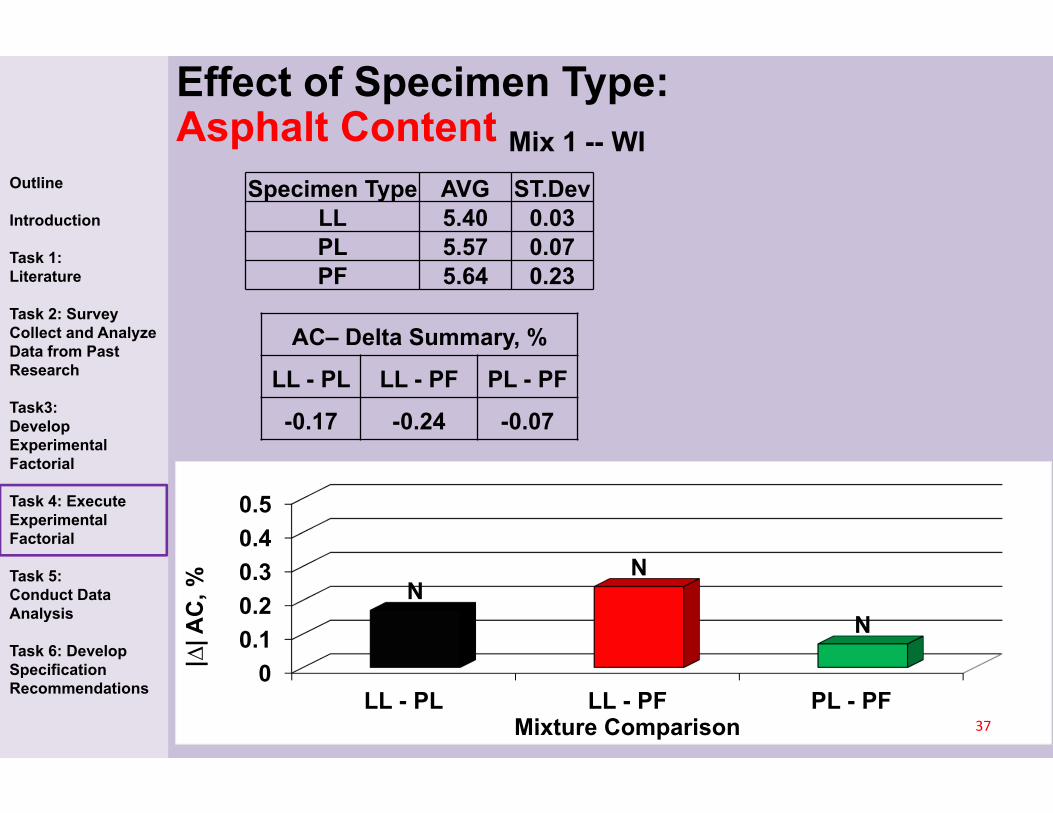
00.10.20.30.40.5
LL - PL LL - PF PL - PF
NN
N
|∆| A
C, %
Mixture Comparison
Specimen Type AVG ST.DevLL 5.40 0.03PL 5.57 0.07PF 5.64 0.23
AC– Delta Summary, %
LL - PL LL - PF PL - PF
-0.17 -0.24 -0.07
Effect of Specimen Type: Asphalt Content Mix 1 -- WI
37
Outline
Introduction
Task 1: Literature
Task 2: Survey Collect and Analyze Data from Past Research
Task3: Develop Experimental Factorial
Task 4: Execute Experimental Factorial
Task 5: Conduct Data Analysis
Task 6: Develop Specification Recommendations
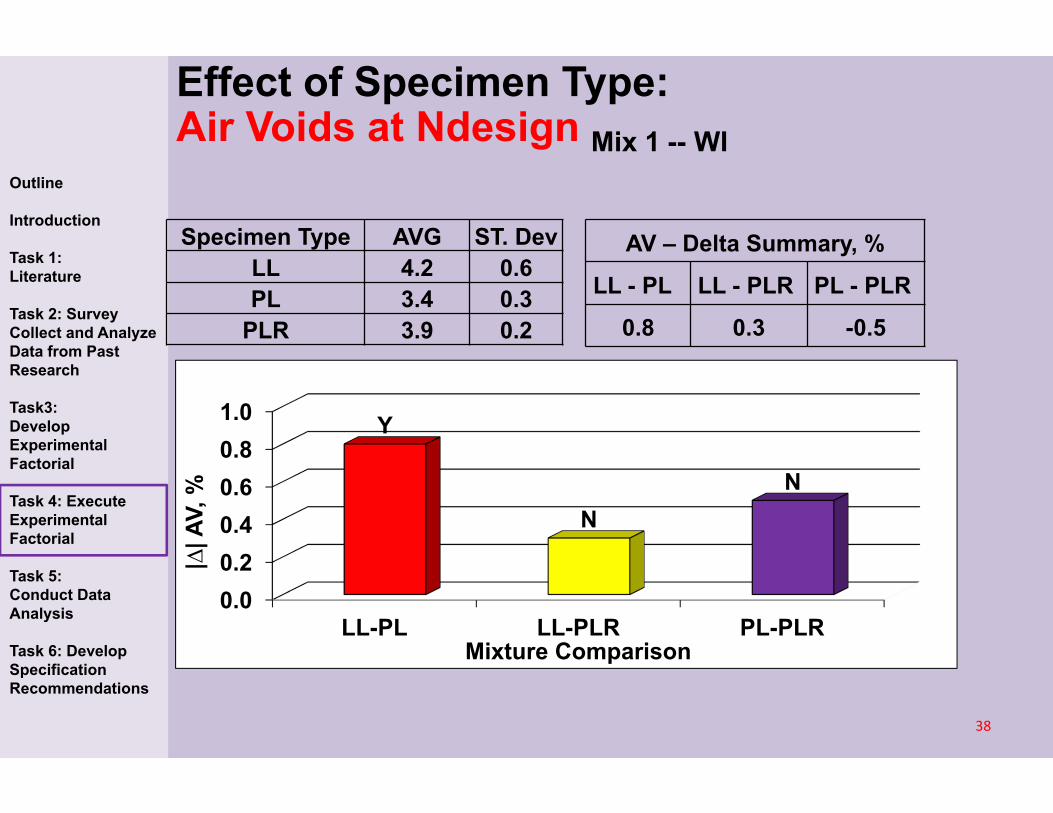
Effect of Specimen Type: Air Voids at Ndesign Mix 1 -- WI
38
Outline
Introduction
Task 1: Literature
Task 2: Survey Collect and Analyze Data from Past Research
Task3: Develop Experimental Factorial
Task 4: Execute Experimental Factorial
Task 5: Conduct Data Analysis
Task 6: Develop Specification Recommendations
0.00.20.40.60.81.0
LL-PL LL-PLR PL-PLR
Y
NN
|∆| A
V, %
Mixture Comparison
AV – Delta Summary, %
LL - PL LL - PLR PL - PLR
0.8 0.3 -0.5
Specimen Type AVG ST. DevLL 4.2 0.6PL 3.4 0.3
PLR 3.9 0.2
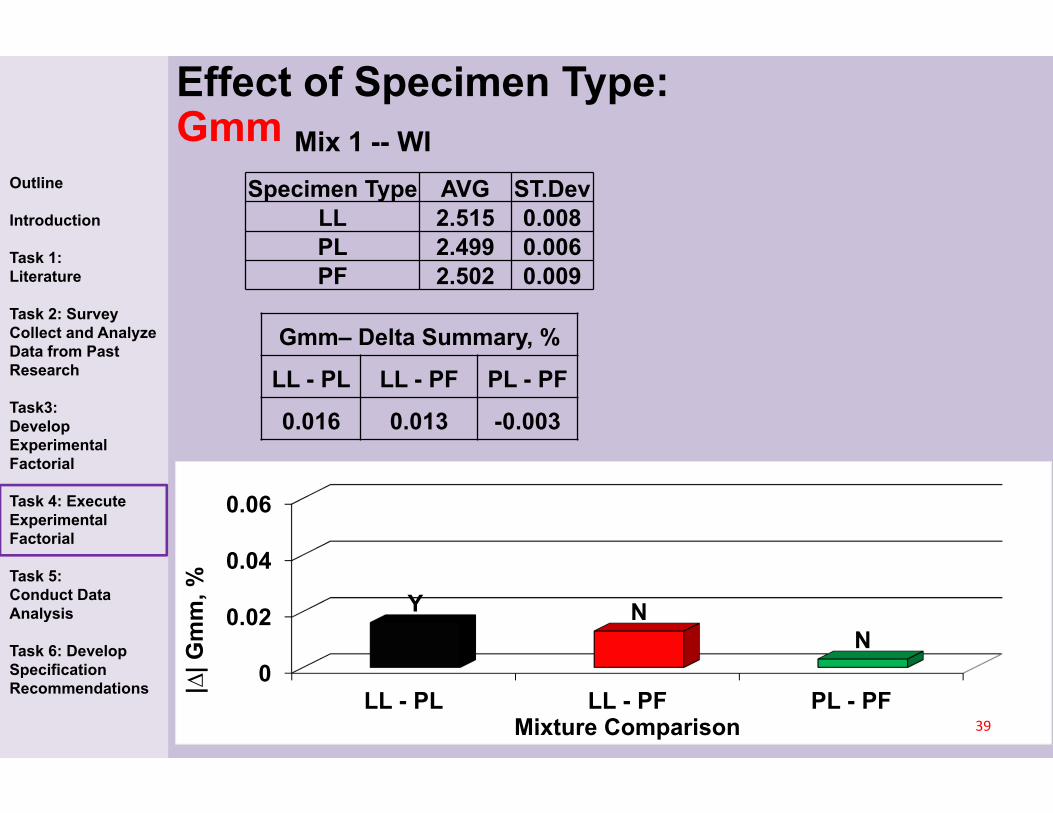
0
0.02
0.04
0.06
LL - PL LL - PF PL - PF
Y NN
|∆| G
mm
, %
Mixture Comparison
Specimen Type AVG ST.DevLL 2.515 0.008PL 2.499 0.006PF 2.502 0.009
Gmm– Delta Summary, %
LL - PL LL - PF PL - PF
0.016 0.013 -0.003
Effect of Specimen Type: Gmm Mix 1 -- WI
39
Outline
Introduction
Task 1: Literature
Task 2: Survey Collect and Analyze Data from Past Research
Task3: Develop Experimental Factorial
Task 4: Execute Experimental Factorial
Task 5: Conduct Data Analysis
Task 6: Develop Specification Recommendations

00.010.020.030.040.05
LL - PL LL - PF PL - PF
NN
N
|∆| G
sb, %
Mixture Comparison
Specimen Type AVG ST.DevLL 2.643 0.023PL 2.652 0.015PF 2.644 0.008
Gsb– Delta Summary, %
LL - PL LL - PF PL - PF
-0.009 -0.001 0.008
Effect of Specimen Type: Gsb Mix 1 -- WI
40
Outline
Introduction
Task 1: Literature
Task 2: Survey Collect and Analyze Data from Past Research
Task3: Develop Experimental Factorial
Task 4: Execute Experimental Factorial
Task 5: Conduct Data Analysis
Task 6: Develop Specification Recommendations
0
5
10
15
20
0 5000 10000 15000 20000Aver
age
Rut
Dep
th,
mm
Number of Passes
LL PL PF
0
5
10
15
20
0 5000 10000 15000 20000Aver
age
Rut
Dep
th,
mm
Number of Passes
LL PL PF
0
5
10
15
20
0 5000 10000 15000 20000Aver
age
Rut
Dep
th,
mm
Number of Passes
LL PL PF
Effect of Specimen Type: LWT Test
41

Mix 5 SD Mix 8 LA
1.5
15
150
1500
15000
150000
1.0E-05 1.0E-01 1.0E+03 1.0E+07
Com
plex
Mod
ulus
, (M
pa)
Reduced Frequency
PLR LL
1.5
15
150
1500
15000
150000
1.0E-05 1.0E-01 1.0E+03 1.0E+07
Com
plex
Mod
ulus
, Mpa
Reduced Frequency
PLR LL
Effect of Specimen Type:Axial Dynamic Modulus
42
Outline
Introduction
Task 1: Literature
Task 2: Survey Collect and Analyze Data from Past Research
Task3: Develop Experimental Factorial
Task 4: Execute Experimental Factorial
Task 5: Conduct Data Analysis
Task 6: Develop Specification Recommendations
0
5000
10000
15000
20000
25000
1.0E-03 1.0E+00 1.0E+03 1.0E+06
Com
plex
Mod
ulus
, Mpa
Reduced Frequency
LL PL PF
0
5000
10000
15000
20000
25000
1.0E-04 1.0E+00 1.0E+04 1.0E+08
Com
plex
Mod
ulus
, Mpa
Reduced Frequency
LL PL PF
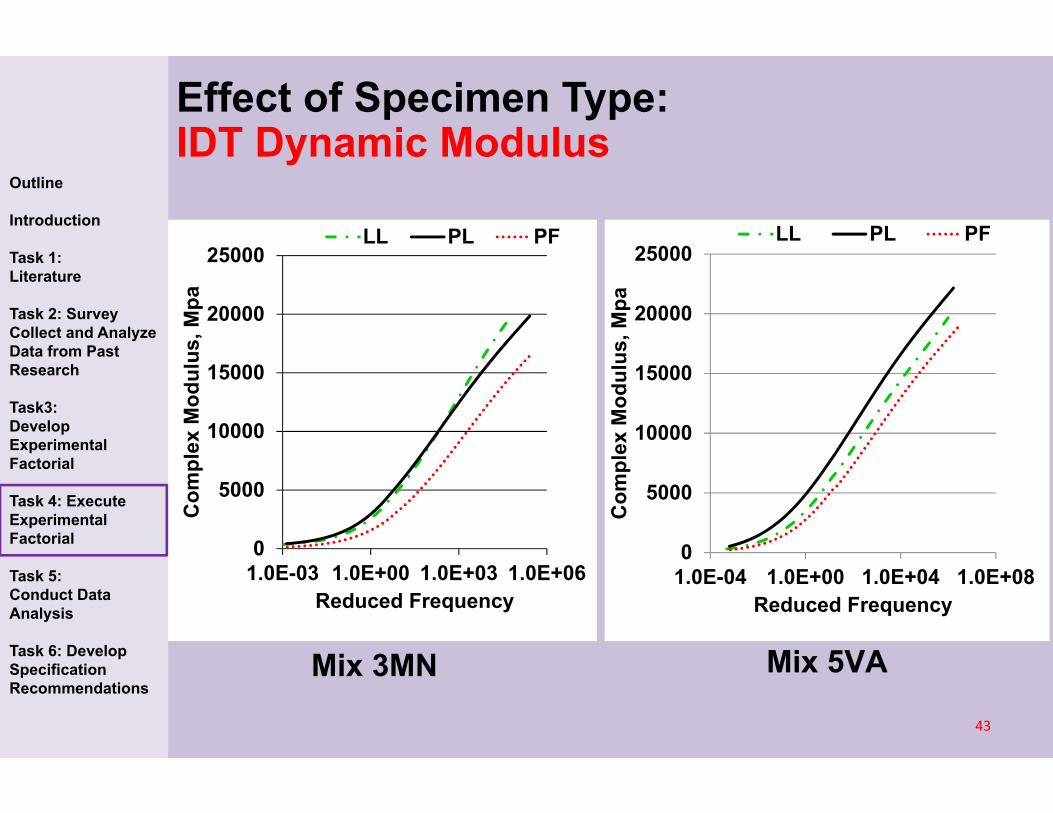
Mix 3MN Mix 5VA
Effect of Specimen Type:IDT Dynamic Modulus
43
Outline
Introduction
Task 1: Literature
Task 2: Survey Collect and Analyze Data from Past Research
Task3: Develop Experimental Factorial
Task 4: Execute Experimental Factorial
Task 5: Conduct Data Analysis
Task 6: Develop Specification Recommendations

44
Combined Mixture Analysis
• Meta-Analysis:• A statistical technique used to combine various data
sets into one meta-data set
• Objective: to determine the magnitude and cause of variability between specimen types
• Combine delta analyses of individual mixtures.
45
Outline
Introduction
Task 1: Literature
Task 2: Survey Collect and Analyze Data from Past Research
Task3: Develop Experimental Factorial
Task 4: Execute Experimental Factorial
Task 5: Conduct Data Analysis
Task 6: Develop Specification Recommendations
Data Analysis Methodology –Combined Analysis
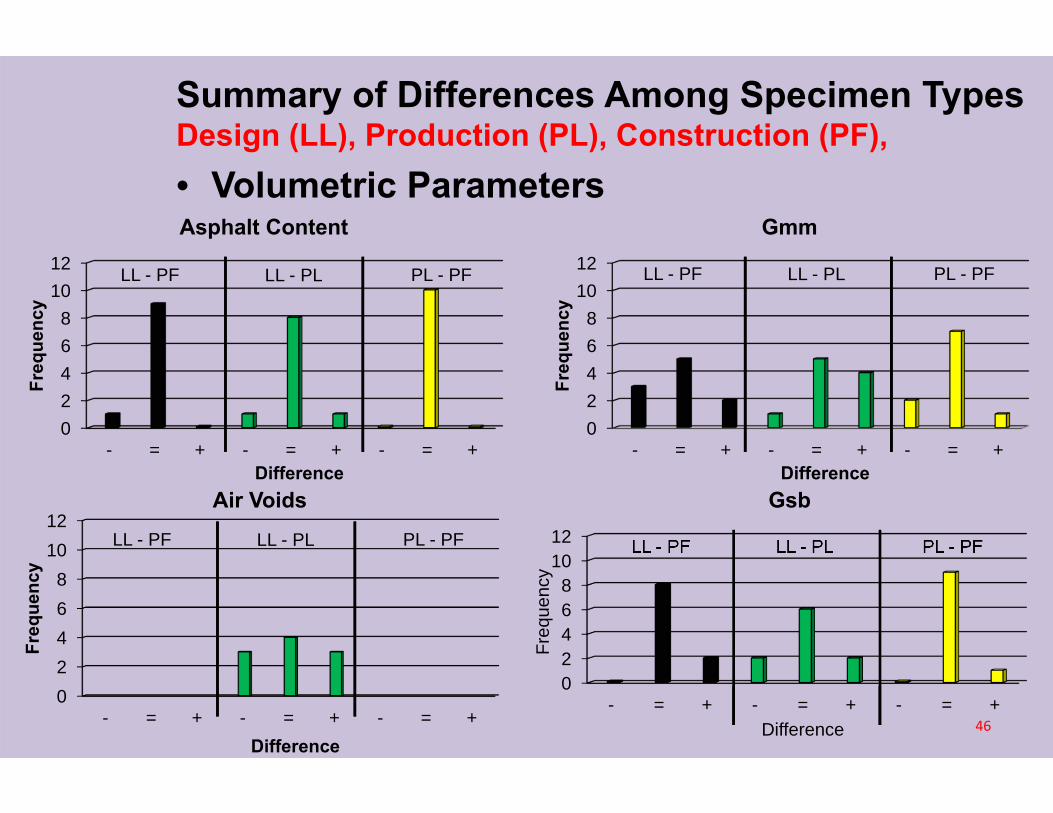
Summary of Differences Among Specimen TypesDesign (LL), Production (PL), Construction (PF), • Volumetric Parameters
46
02468
1012
- = + - = + - = +
Freq
uenc
y
Difference
Asphalt Content
LL - PF LL - PL PL - PF
02468
1012
- = + - = + - = +
Freq
uenc
y
Difference
Gmm
LL - PF LL - PL PL - PF
02468
1012
- = + - = + - = +
Freq
uenc
y
Difference
Air VoidsLL - PF LL - PL PL - PF LL - PF LL - PL PL - PF
02468
1012
- = + - = + - = +
Freq
uenc
y
Difference
Gsb
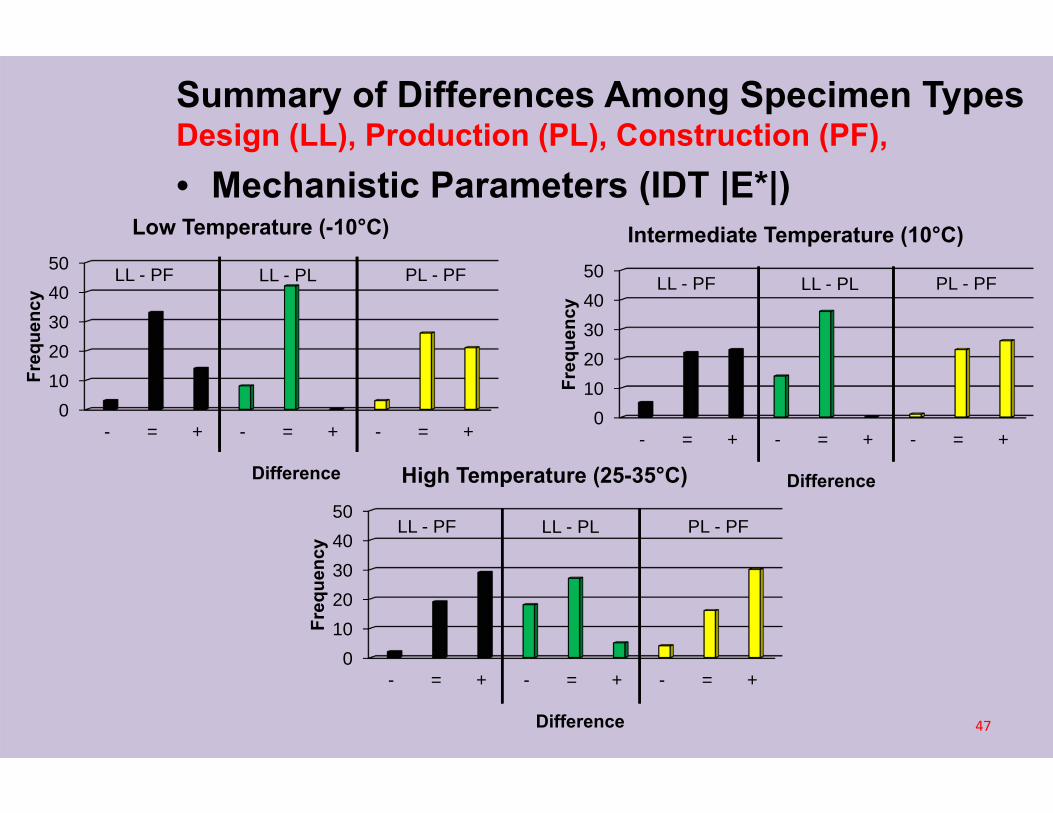
• Mechanistic Parameters (IDT |E*|)
01020304050
- = + - = + - = +
Freq
uenc
y
Difference
Low Temperature (-10°C)
Summary of Differences Among Specimen TypesDesign (LL), Production (PL), Construction (PF),
47
01020304050
- = + - = + - = +
Freq
uenc
y
Difference
High Temperature (25-35°C)
LL - PF LL - PL
01020304050
- = + - = + - = +
Freq
uenc
y
Difference
Intermediate Temperature (10°C)
PL - PF LL - PF LL - PL PL - PF
LL - PF LL - PL PL - PF
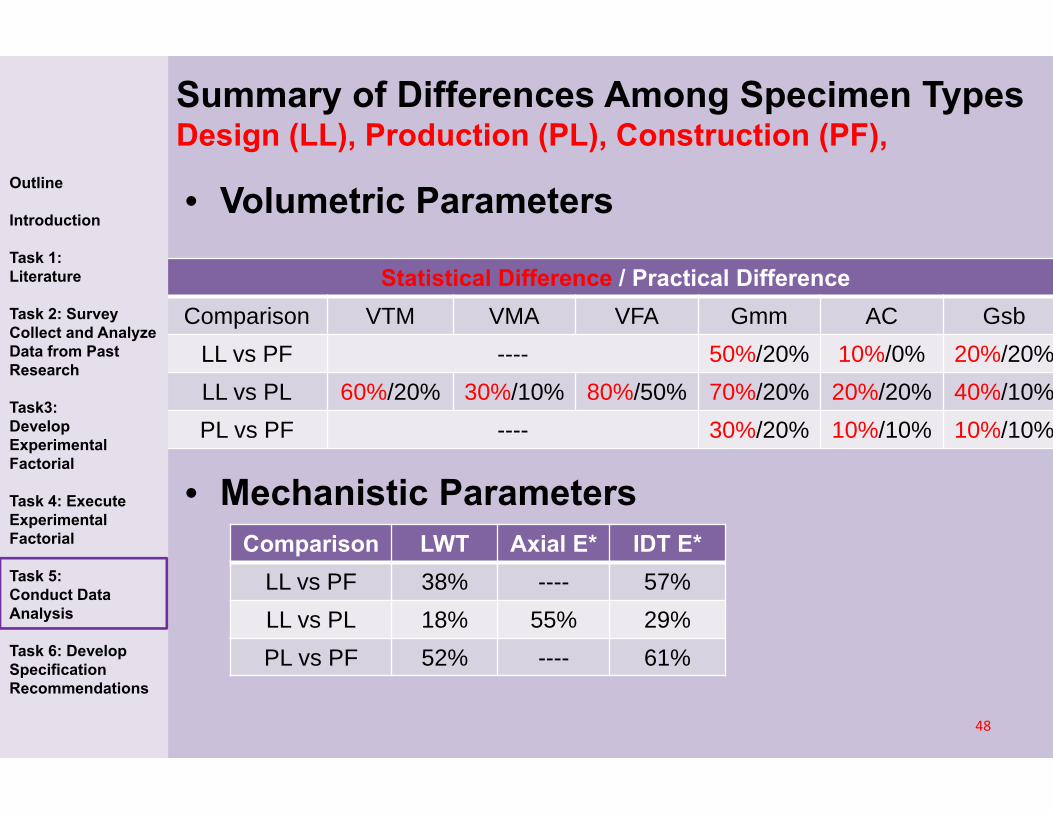
Summary of Differences Among Specimen TypesDesign (LL), Production (PL), Construction (PF),
• Volumetric Parameters
• Mechanistic Parameters
Statistical Difference / Practical DifferenceComparison VTM VMA VFA Gmm AC Gsb
LL vs PF ---- 50%/20% 10%/0% 20%/20%LL vs PL 60%/20% 30%/10% 80%/50% 70%/20% 20%/20% 40%/10%PL vs PF ---- 30%/20% 10%/10% 10%/10%
Comparison LWT Axial E* IDT E*LL vs PF 38% ---- 57%LL vs PL 18% 55% 29%PL vs PF 52% ---- 61%
48
Outline
Introduction
Task 1: Literature
Task 2: Survey Collect and Analyze Data from Past Research
Task3: Develop Experimental Factorial
Task 4: Execute Experimental Factorial
Task 5: Conduct Data Analysis
Task 6: Develop Specification Recommendations

51
Effect of Process-Based Factors

• Analysis of Co-Variance• Blend of ANOVA and Regression• GLM regression model to evaluate factor with the
most significant effect. – Classification Variables: Baghouse (BH), Time Delay (TD)– Independent Variables: Aggregate Absorption (AA), Aggregate
Hardness (AH), Stockpile moisture (SM).
52
Outline
Introduction
Task 1: Literature
Task 2: Survey Collect and Analyze Data from Past Research
Task3: Develop Experimental Factorial
Task 4: Execute Experimental Factorial
Task 5: Conduct Data Analysis
Task 6: Develop Specification Recommendations
Data Analysis Methodology –Combined Analysis
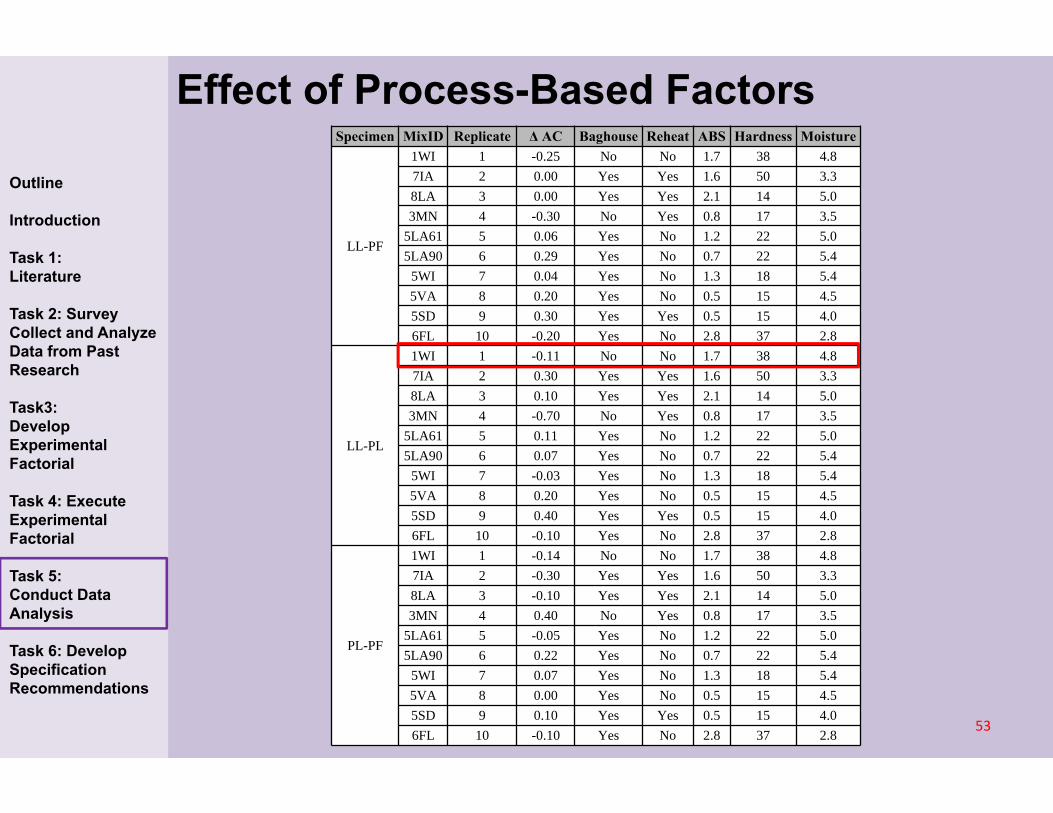
Specimen MixID Replicate Δ AC Baghouse Reheat ABS Hardness Moisture
LL-PF
1WI 1 -0.25 No No 1.7 38 4.87IA 2 0.00 Yes Yes 1.6 50 3.38LA 3 0.00 Yes Yes 2.1 14 5.03MN 4 -0.30 No Yes 0.8 17 3.5
5LA61 5 0.06 Yes No 1.2 22 5.05LA90 6 0.29 Yes No 0.7 22 5.45WI 7 0.04 Yes No 1.3 18 5.45VA 8 0.20 Yes No 0.5 15 4.55SD 9 0.30 Yes Yes 0.5 15 4.06FL 10 -0.20 Yes No 2.8 37 2.8
LL-PL
1WI 1 -0.11 No No 1.7 38 4.87IA 2 0.30 Yes Yes 1.6 50 3.38LA 3 0.10 Yes Yes 2.1 14 5.03MN 4 -0.70 No Yes 0.8 17 3.5
5LA61 5 0.11 Yes No 1.2 22 5.05LA90 6 0.07 Yes No 0.7 22 5.45WI 7 -0.03 Yes No 1.3 18 5.45VA 8 0.20 Yes No 0.5 15 4.55SD 9 0.40 Yes Yes 0.5 15 4.06FL 10 -0.10 Yes No 2.8 37 2.8
PL-PF
1WI 1 -0.14 No No 1.7 38 4.87IA 2 -0.30 Yes Yes 1.6 50 3.38LA 3 -0.10 Yes Yes 2.1 14 5.03MN 4 0.40 No Yes 0.8 17 3.5
5LA61 5 -0.05 Yes No 1.2 22 5.05LA90 6 0.22 Yes No 0.7 22 5.45WI 7 0.07 Yes No 1.3 18 5.45VA 8 0.00 Yes No 0.5 15 4.55SD 9 0.10 Yes Yes 0.5 15 4.06FL 10 -0.10 Yes No 2.8 37 2.8
53
Effect of Process-Based Factors
Outline
Introduction
Task 1: Literature
Task 2: Survey Collect and Analyze Data from Past Research
Task3: Develop Experimental Factorial
Task 4: Execute Experimental Factorial
Task 5: Conduct Data Analysis
Task 6: Develop Specification Recommendations
• General Linear Model (GLM) Procedure, Asphalt Content– Compare all factors’ main effects
simultaneously
– Repeat Process for all variables evaluated
Source DF MS Treatment MS Error F Value Pr > F
Baghouse 1 0.2003 0.0127 15.77 0.01
Time Delay 1 0.0008 0.0127 0.07 0.81
Agg. Abs. 1 0.0947 0.0127 7.46 0.05
Agg. Hardness 1 0.0052 0.0127 0.42 0.55
Stockpile Moisture 1 0.0357 0.0127 2.81 0.16
54
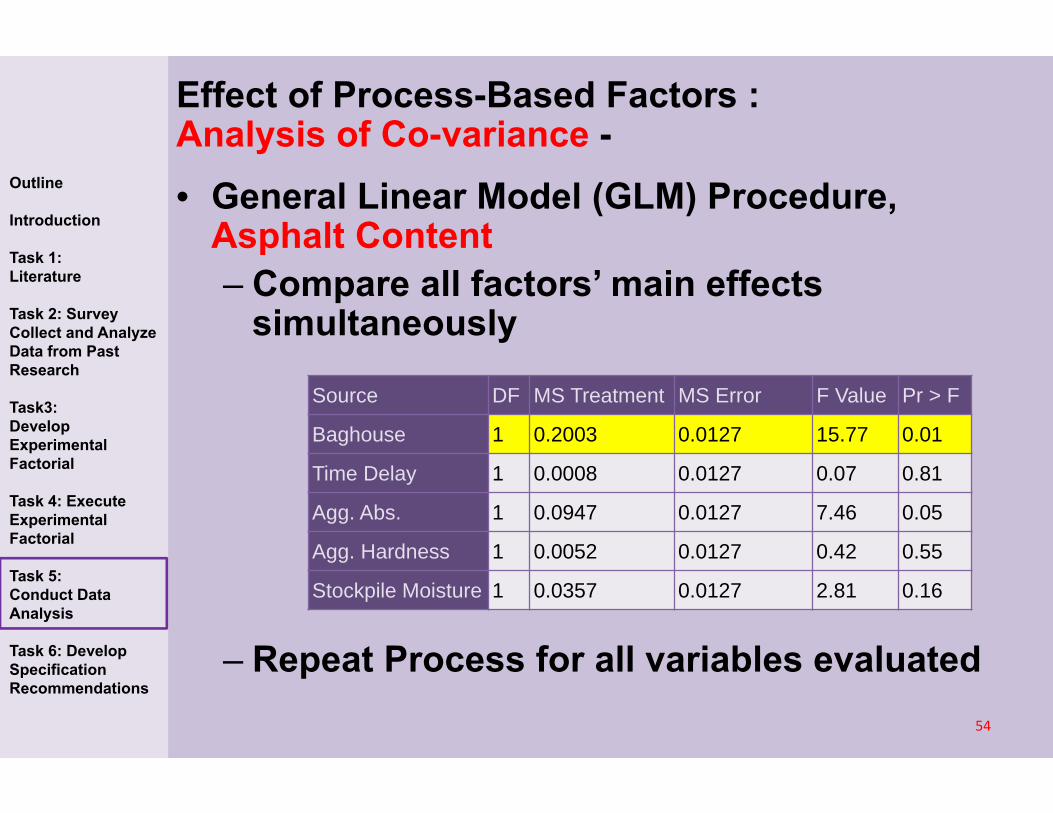
Effect of Process-Based Factors : Analysis of Co-variance -
Outline
Introduction
Task 1: Literature
Task 2: Survey Collect and Analyze Data from Past Research
Task3: Develop Experimental Factorial
Task 4: Execute Experimental Factorial
Task 5: Conduct Data Analysis
Task 6: Develop Specification Recommendations

• General Linear Model (GLM) Procedure, Asphalt Content– Compare all factors’ main effects
simultaneously Source DF MS Treatment MS Error F Value Pr > F
Baghouse 1 0.2003 0.0127 15.77 0.01
Time Delay 1 0.0008 0.0127 0.07 0.81
Agg. Abs. 1 0.0947 0.0127 7.46 0.05
Agg. Hardness 1 0.0052 0.0127 0.42 0.55
Stockpile Moisture 1 0.0357 0.0127 2.81 0.16
55
Effect of Process-Based Factors : Analysis of Co-variance -
Outline
Introduction
Task 1: Literature
Task 2: Survey Collect and Analyze Data from Past Research
Task3: Develop Experimental Factorial
Task 4: Execute Experimental Factorial
Task 5: Conduct Data Analysis
Task 6: Develop Specification Recommendations
P-value < 0.05 = Significant
http://www.itl.nist.gov/div898/handbook/eda/section3/eda3672.htm
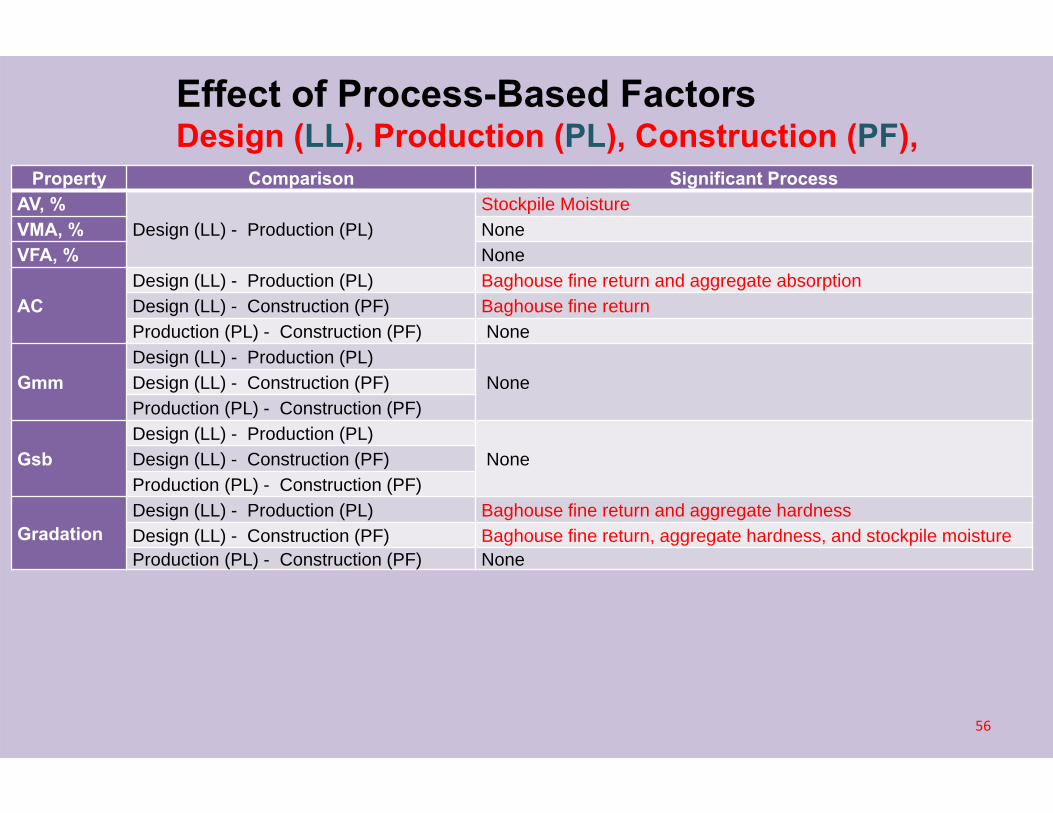
Effect of Process-Based FactorsDesign (LL), Production (PL), Construction (PF),
56
Property Comparison Significant ProcessAV, %
Design (LL) - Production (PL)Stockpile Moisture
VMA, % NoneVFA, % None
ACDesign (LL) - Production (PL) Baghouse fine return and aggregate absorptionDesign (LL) - Construction (PF) Baghouse fine returnProduction (PL) - Construction (PF) None
GmmDesign (LL) - Production (PL)
NoneDesign (LL) - Construction (PF)Production (PL) - Construction (PF)
GsbDesign (LL) - Production (PL)
NoneDesign (LL) - Construction (PF)Production (PL) - Construction (PF)
GradationDesign (LL) - Production (PL) Baghouse fine return and aggregate hardnessDesign (LL) - Construction (PF) Baghouse fine return, aggregate hardness, and stockpile moistureProduction (PL) - Construction (PF) None
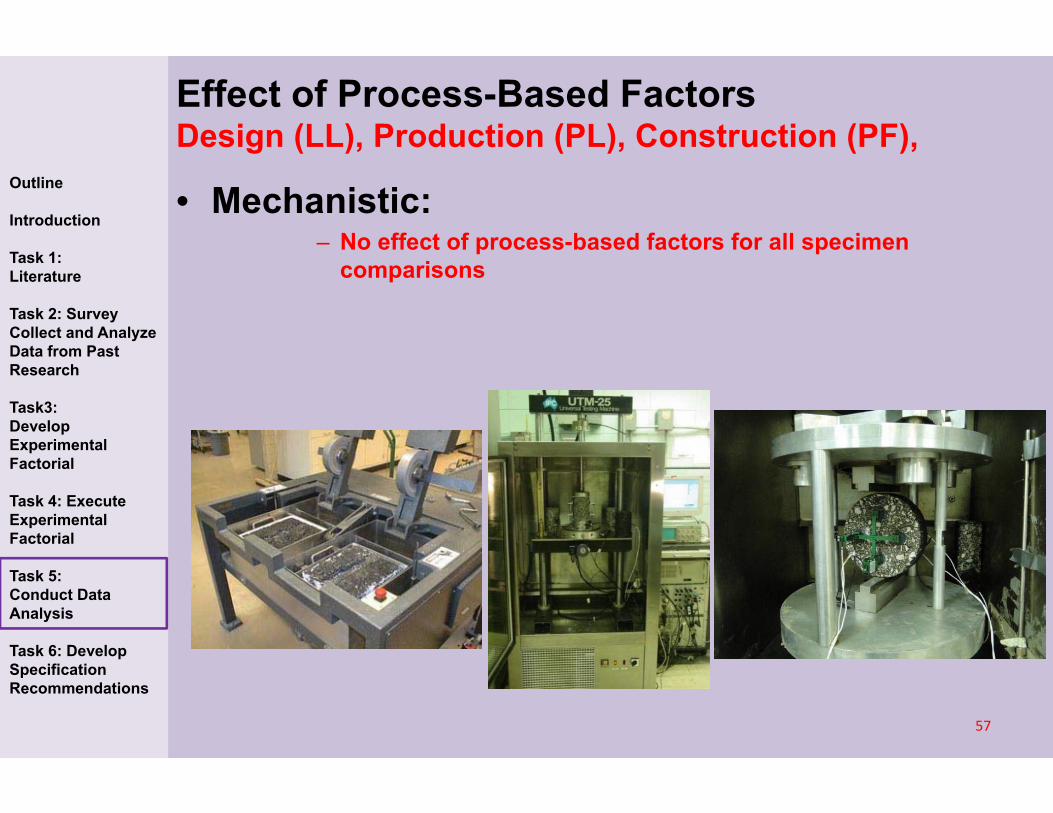
• Mechanistic:– No effect of process-based factors for all specimen
comparisons
Effect of Process-Based FactorsDesign (LL), Production (PL), Construction (PF),
57
Outline
Introduction
Task 1: Literature
Task 2: Survey Collect and Analyze Data from Past Research
Task3: Develop Experimental Factorial
Task 4: Execute Experimental Factorial
Task 5: Conduct Data Analysis
Task 6: Develop Specification Recommendations

Why are factors not effecting mixture properties? –Survey
• Industry Contacts• Agency Contacts• Contractors
58
Outline
Introduction
Task 1: Literature
Task 2: Survey Collect and Analyze Data from Past Research
Task3: Develop Experimental Factorial
Task 4: Execute Experimental Factorial
Task 5: Conduct Data Analysis
Task 6: Develop Specification Recommendations
Response No Response
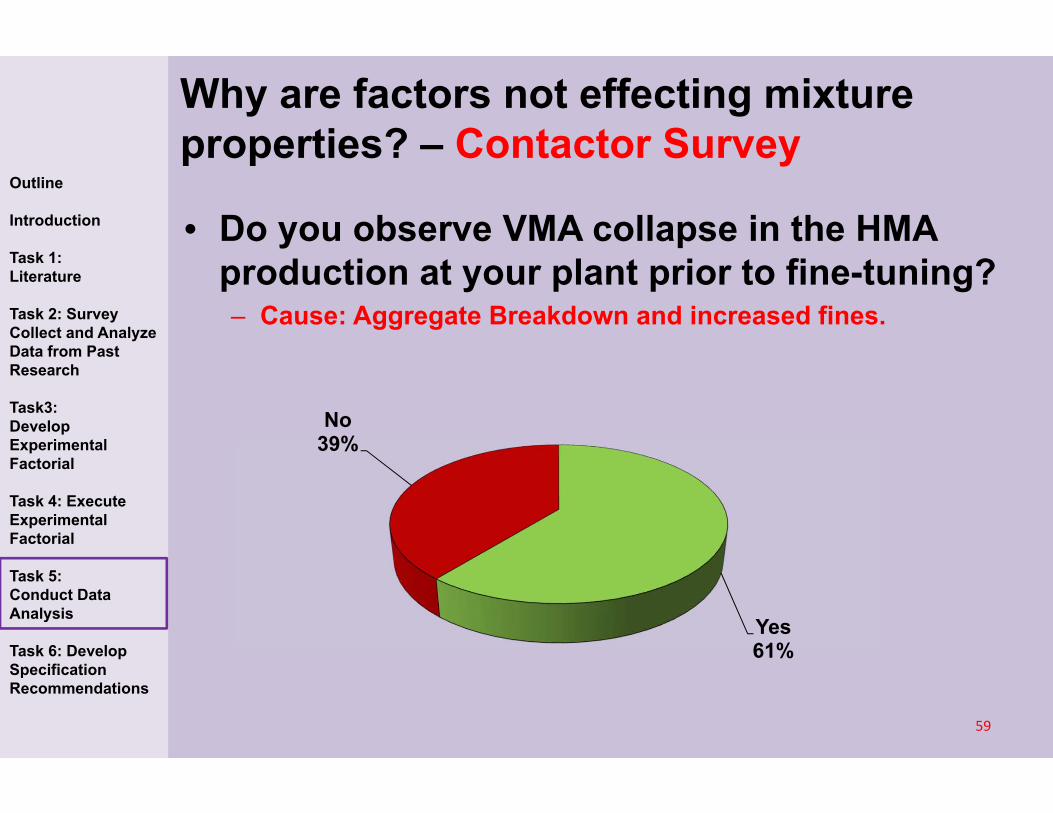
Why are factors not effecting mixture properties? – Contactor Survey
• Do you observe VMA collapse in the HMA production at your plant prior to fine-tuning?– Cause: Aggregate Breakdown and increased fines.
Yes61%
No39%
59
Outline
Introduction
Task 1: Literature
Task 2: Survey Collect and Analyze Data from Past Research
Task3: Develop Experimental Factorial
Task 4: Execute Experimental Factorial
Task 5: Conduct Data Analysis
Task 6: Develop Specification Recommendations

Yes22%
No78%
• Do you observe VMA collapse in the HMA production at your plant after fine-tuning?
60
Outline
Introduction
Task 1: Literature
Task 2: Survey Collect and Analyze Data from Past Research
Task3: Develop Experimental Factorial
Task 4: Execute Experimental Factorial
Task 5: Conduct Data Analysis
Task 6: Develop Specification Recommendations
Why are factors not effecting mixture properties? – Contactor Survey
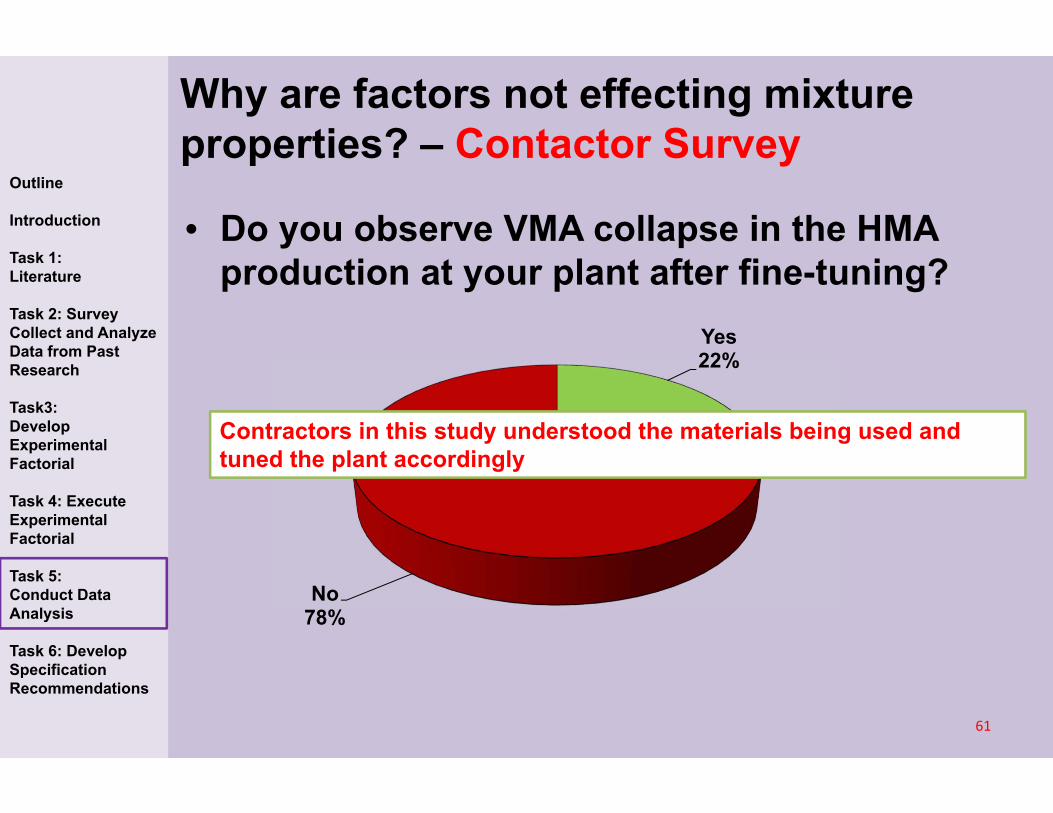
Yes22%
No78%
• Do you observe VMA collapse in the HMA production at your plant after fine-tuning?
61
Outline
Introduction
Task 1: Literature
Task 2: Survey Collect and Analyze Data from Past Research
Task3: Develop Experimental Factorial
Task 4: Execute Experimental Factorial
Task 5: Conduct Data Analysis
Task 6: Develop Specification Recommendations
Why are factors not effecting mixture properties? – Contactor Survey
Contractors in this study understood the materials being used and tuned the plant accordingly

62
Magnitude of Volumetric Differences
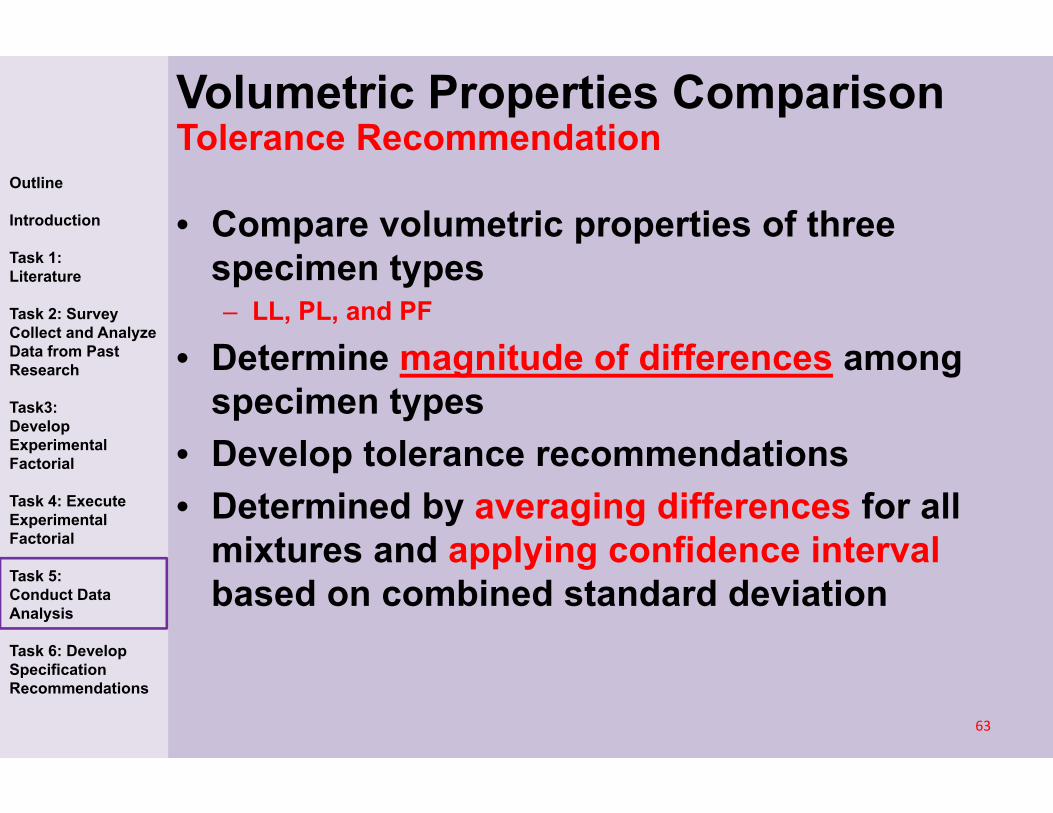
• Compare volumetric properties of three specimen types– LL, PL, and PF
• Determine magnitude of differences among specimen types
• Develop tolerance recommendations• Determined by averaging differences for all
mixtures and applying confidence interval based on combined standard deviation
Volumetric Properties ComparisonTolerance Recommendation
63
Outline
Introduction
Task 1: Literature
Task 2: Survey Collect and Analyze Data from Past Research
Task3: Develop Experimental Factorial
Task 4: Execute Experimental Factorial
Task 5: Conduct Data Analysis
Task 6: Develop Specification Recommendations

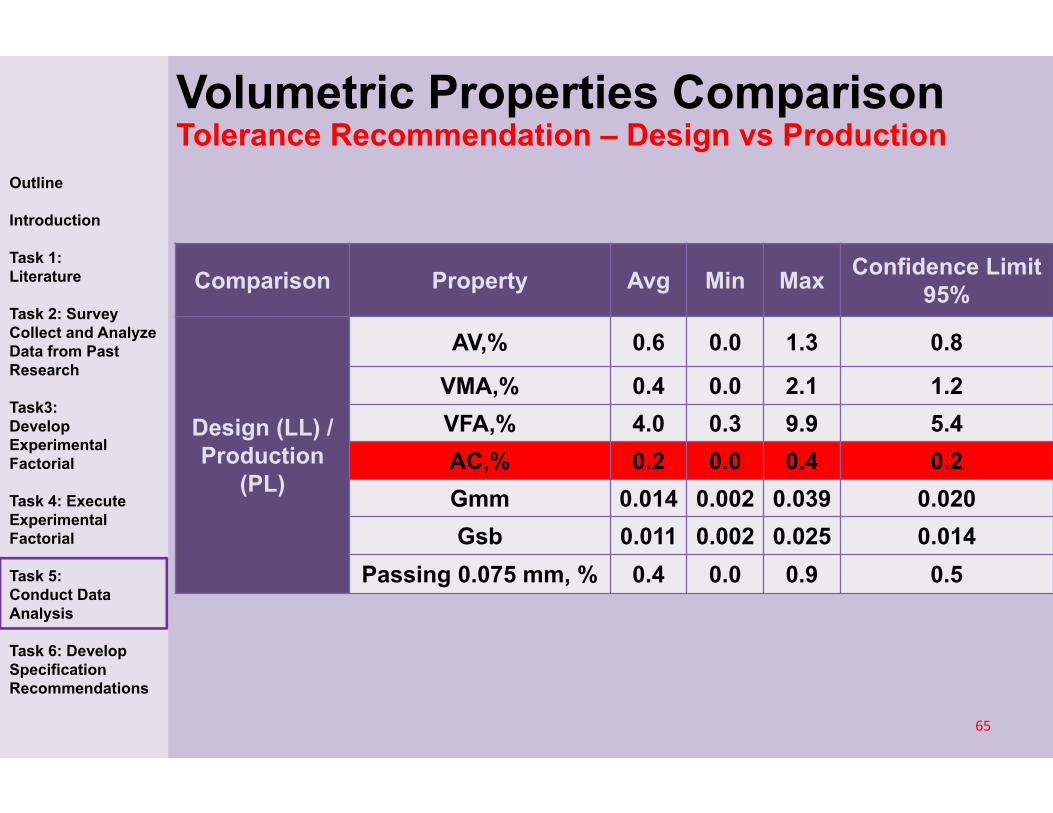
Comparison Property Avg Min Max Confidence Limit95%
Design (LL) / Production
(PL)
AV,% 0.6 0.0 1.3 0.8
VMA,% 0.4 0.0 2.1 1.2VFA,% 4.0 0.3 9.9 5.4AC,% 0.2 0.0 0.4 0.2Gmm 0.014 0.002 0.039 0.020Gsb 0.011 0.002 0.025 0.014
Passing 0.075 mm, % 0.4 0.0 0.9 0.5
Volumetric Properties ComparisonTolerance Recommendation – Design vs Production
64
Outline
Introduction
Task 1: Literature
Task 2: Survey Collect and Analyze Data from Past Research
Task3: Develop Experimental Factorial
Task 4: Execute Experimental Factorial
Task 5: Conduct Data Analysis
Task 6: Develop Specification Recommendations
Comparison Property Avg Min Max Confidence Limit95%
Design (LL) / Production
(PL)
AV,% 0.6 0.0 1.3 0.8
VMA,% 0.4 0.0 2.1 1.2VFA,% 4.0 0.3 9.9 5.4AC,% 0.2 0.0 0.4 0.2Gmm 0.014 0.002 0.039 0.020Gsb 0.011 0.002 0.025 0.014
Passing 0.075 mm, % 0.4 0.0 0.9 0.5
Volumetric Properties ComparisonTolerance Recommendation – Design vs Production
65
Outline
Introduction
Task 1: Literature
Task 2: Survey Collect and Analyze Data from Past Research
Task3: Develop Experimental Factorial
Task 4: Execute Experimental Factorial
Task 5: Conduct Data Analysis
Task 6: Develop Specification Recommendations

Comparison Property Avg Min Max Confidence Limit95%
Design (LL) / Construction (PF)
AC,% 0.2 0.0 0.3 0.2Gmm 0.011 0.000 0.020 0.013Gsb 0.010 0.001 0.033 0.019
Passing 0.075 mm, % 0.7 0.1 1.3 0.7
Volumetric Properties ComparisonTolerance Recommendation – Design vs Construction
66
Outline
Introduction
Task 1: Literature
Task 2: Survey Collect and Analyze Data from Past Research
Task3: Develop Experimental Factorial
Task 4: Execute Experimental Factorial
Task 5: Conduct Data Analysis
Task 6: Develop Specification Recommendations

Comparison Property Avg Min Max Confidence Limit95%
Production (PL) / Construction (PF)
AC,% 0.1 0.0 0.4 0.2Gmm 0.009 0.001 0.027 0.018Gsb 0.008 0.000 0.031 0.017
Passing 0.075 mm, % 0.5 0.1 0.8 0.5
Volumetric Properties ComparisonTolerance Recommendation – Production vs Construction
67
Outline
Introduction
Task 1: Literature
Task 2: Survey Collect and Analyze Data from Past Research
Task3: Develop Experimental Factorial
Task 4: Execute Experimental Factorial
Task 5: Conduct Data Analysis
Task 6: Develop Specification Recommendations

• Design (LL) vs Production (PL): ± 0.2%• Design (LL) vs Construction (PF): ± 0.2%• Production (PL) vs Construction (PF): ± 0.2%
Above Tolerance At Tolerance Below Tolerance Not Specified
Volumetric Properties ComparisonTolerance Recommendation – Asphalt Content
68
Outline
Introduction
Task 1: Literature
Task 2: Survey Collect and Analyze Data from Past Research
Task3: Develop Experimental Factorial
Task 4: Execute Experimental Factorial
Task 5: Conduct Data Analysis
Task 6: Develop Specification Recommendations

69
Magnitude of Mechanistic Differences

• Compare mechanistic properties of three specimen types– LL, PL, and PF
• Develop Shift Factors– Loaded Wheel Tracking Test– Axial Dynamic Modulus– IDT Dynamic Modulus
• Developed by comparing average values to each specimen type.– For example:
• LL avg / PL avg (for each parameter)• Repeat for other specimen comparisons
70
Outline
Introduction
Task 1: Literature
Task 2: Survey Collect and Analyze Data from Past Research
Task3: Develop Experimental Factorial
Task 4: Execute Experimental Factorial
Task 5: Conduct Data Analysis
Task 6: Develop Specification Recommendations
Mechanistic Properties ComparisonShift Factors

• Recommended Shift–Design (LL) to Production (PL): 1.0–Design (LL) to Construction (PF) : 0.75–Production (PL) to Construction (PF): 0.75
– Specification Requirement: 12 mm – Lab Design ≤ 9 mm
Mechanistic Properties ComparisonShift Factors – LWT
71
Outline
Introduction
Task 1: Literature
Task 2: Survey Collect and Analyze Data from Past Research
Task3: Develop Experimental Factorial
Task 4: Execute Experimental Factorial
Task 5: Conduct Data Analysis
Task 6: Develop Specification Recommendations

• Recommended Shift– Shift may need to be utilized at higher temperatures
» May relate to binder oxidation in plant produced mixtures
Comparison Temperature, °C Average ShiftShift Range
Minimum Maximum
Design (LL) / Production
(PL)
-10.0 1.0 0.7 1.1
4.4 1.0 0.7 1.1
25.0 0.9 0.6 1.1
37.8 0.8 0.5 1.1
54.4 0.8 0.5 1.2
Mechanistic Properties ComparisonShift Factors – Axial Dynamic Modulus
72
Outline
Introduction
Task 1: Literature
Task 2: Survey Collect and Analyze Data from Past Research
Task3: Develop Experimental Factorial
Task 4: Execute Experimental Factorial
Task 5: Conduct Data Analysis
Task 6: Develop Specification Recommendations
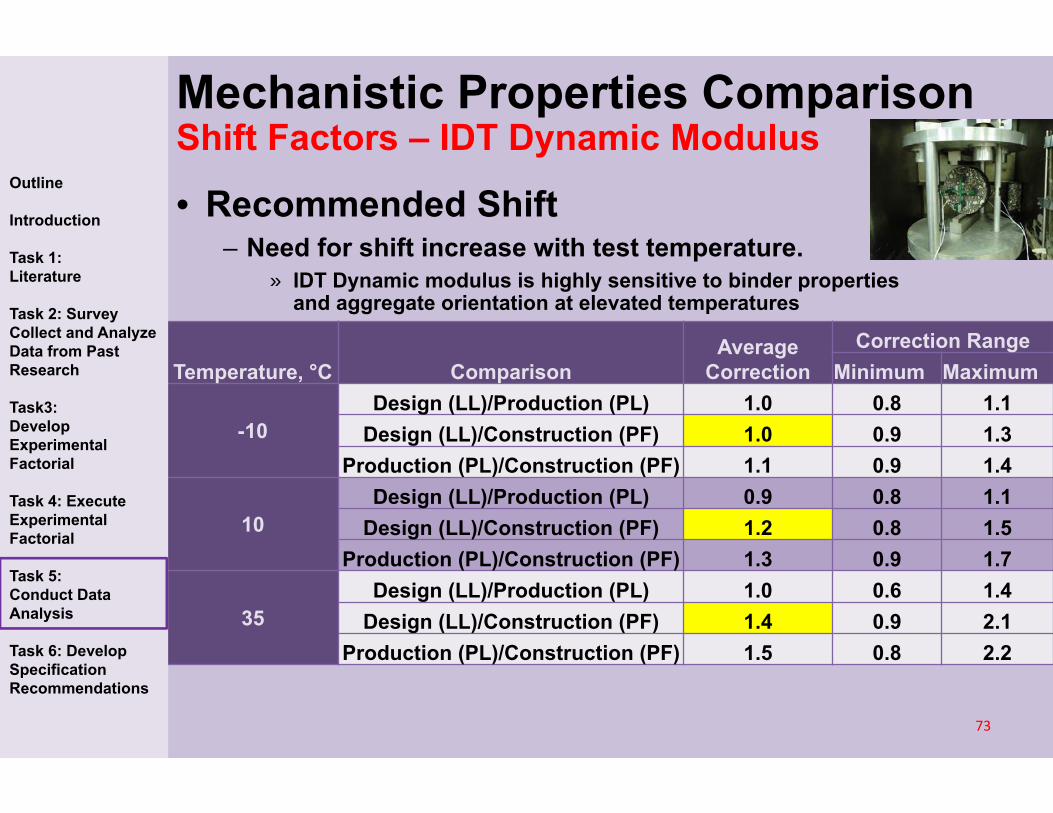
• Recommended Shift– Need for shift increase with test temperature.
» IDT Dynamic modulus is highly sensitive to binder properties and aggregate orientation at elevated temperatures
Temperature, °C ComparisonAverage
CorrectionCorrection Range
Minimum Maximum
-10Design (LL)/Production (PL) 1.0 0.8 1.1
Design (LL)/Construction (PF) 1.0 0.9 1.3Production (PL)/Construction (PF) 1.1 0.9 1.4
10Design (LL)/Production (PL) 0.9 0.8 1.1
Design (LL)/Construction (PF) 1.2 0.8 1.5Production (PL)/Construction (PF) 1.3 0.9 1.7
35Design (LL)/Production (PL) 1.0 0.6 1.4
Design (LL)/Construction (PF) 1.4 0.9 2.1Production (PL)/Construction (PF) 1.5 0.8 2.2
Mechanistic Properties ComparisonShift Factors – IDT Dynamic Modulus
73
Outline
Introduction
Task 1: Literature
Task 2: Survey Collect and Analyze Data from Past Research
Task3: Develop Experimental Factorial
Task 4: Execute Experimental Factorial
Task 5: Conduct Data Analysis
Task 6: Develop Specification Recommendations

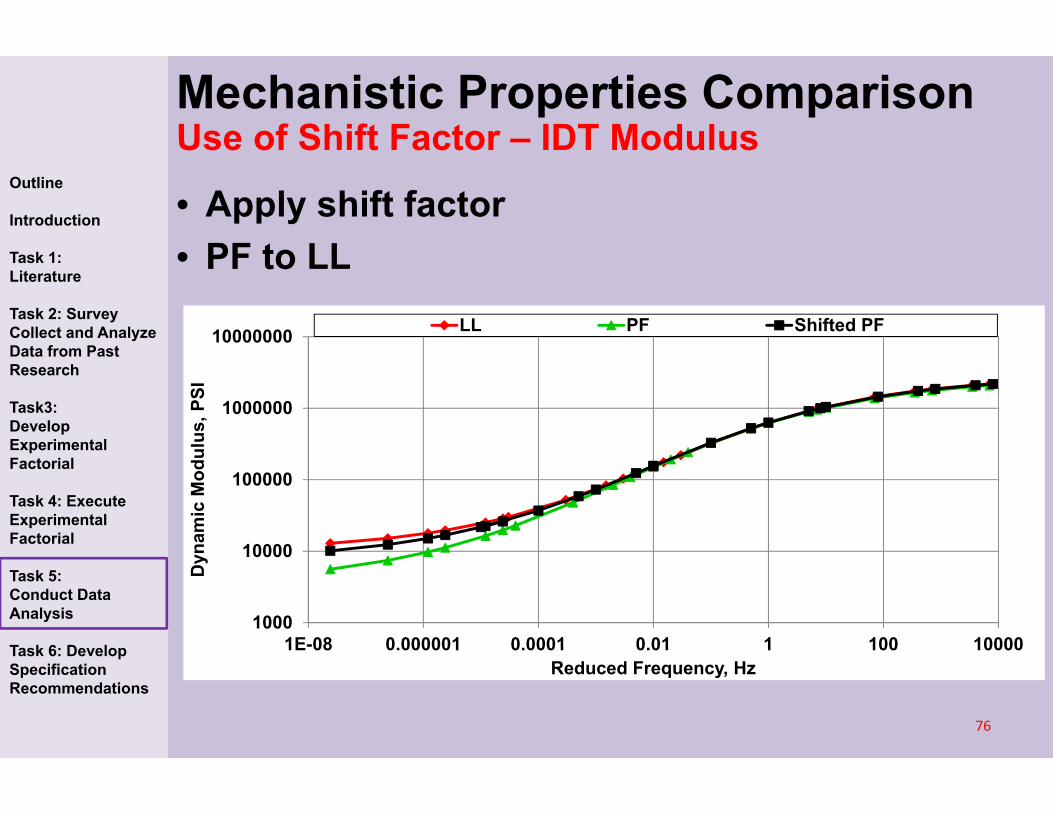
• Apply shift factor• PF to LL
1000
10000
100000
1000000
10000000
1E-08 0.000001 0.0001 0.01 1 100 10000
Dyn
amic
Mod
ulus
, PSI
Reduced Frequency, Hz
LL PF
Mechanistic Properties ComparisonUse of Shift Factor – IDT Modulus
74
Outline
Introduction
Task 1: Literature
Task 2: Survey Collect and Analyze Data from Past Research
Task3: Develop Experimental Factorial
Task 4: Execute Experimental Factorial
Task 5: Conduct Data Analysis
Task 6: Develop Specification Recommendations
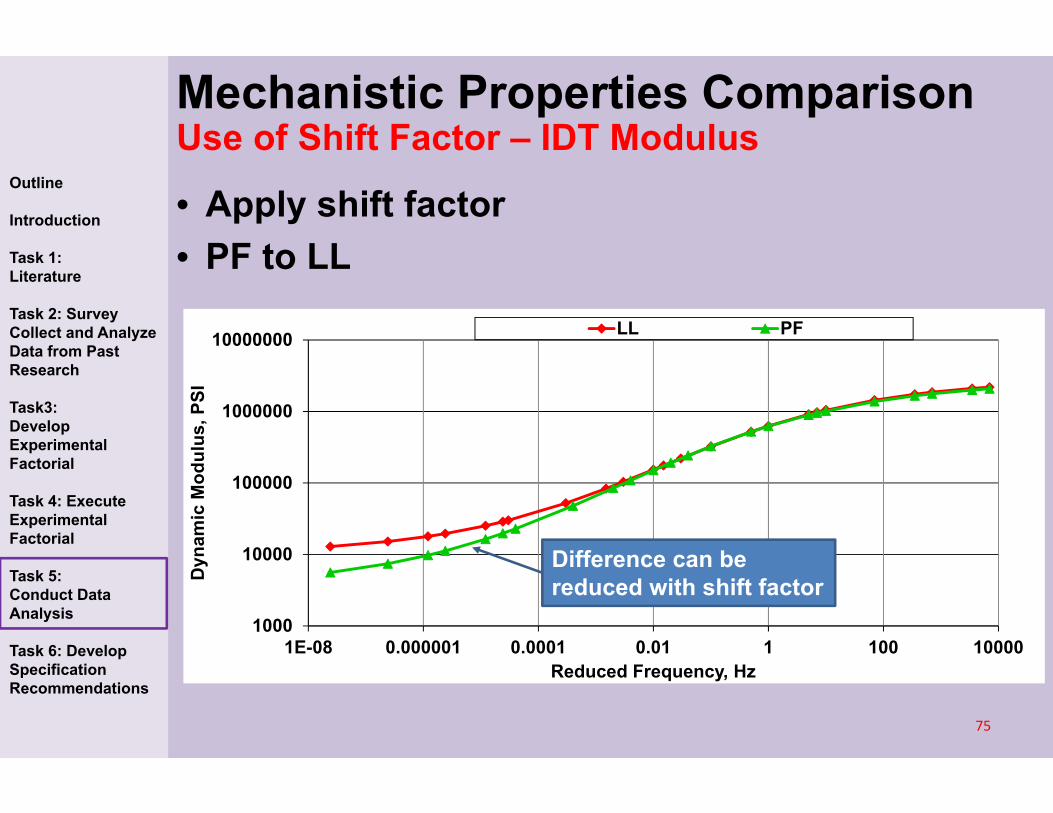
• Apply shift factor• PF to LL
1000
10000
100000
1000000
10000000
1E-08 0.000001 0.0001 0.01 1 100 10000
Dyn
amic
Mod
ulus
, PSI
Reduced Frequency, Hz
LL PF
Mechanistic Properties ComparisonUse of Shift Factor – IDT Modulus
75
Outline
Introduction
Task 1: Literature
Task 2: Survey Collect and Analyze Data from Past Research
Task3: Develop Experimental Factorial
Task 4: Execute Experimental Factorial
Task 5: Conduct Data Analysis
Task 6: Develop Specification Recommendations
Difference can be reduced with shift factor
1000
10000
100000
1000000
10000000
1E-08 0.000001 0.0001 0.01 1 100 10000
Dyn
amic
Mod
ulus
, PSI
Reduced Frequency, Hz
LL PF Shifted PF
• Apply shift factor• PF to LL
76
Outline
Introduction
Task 1: Literature
Task 2: Survey Collect and Analyze Data from Past Research
Task3: Develop Experimental Factorial
Task 4: Execute Experimental Factorial
Task 5: Conduct Data Analysis
Task 6: Develop Specification Recommendations
Mechanistic Properties ComparisonUse of Shift Factor – IDT Modulus
0
5
10
15
20
PF Shifted PF LL
Alligator Cracking (%)
0
1
2
3
PF Shifted PF LL
Total Rutting (in)
0
0.5
1
1.5
2
PF Shifted PF LL
AC Rutting (in)
100
120
140
160
180
200
PF Shifted PF LL
IRI (in/mi)
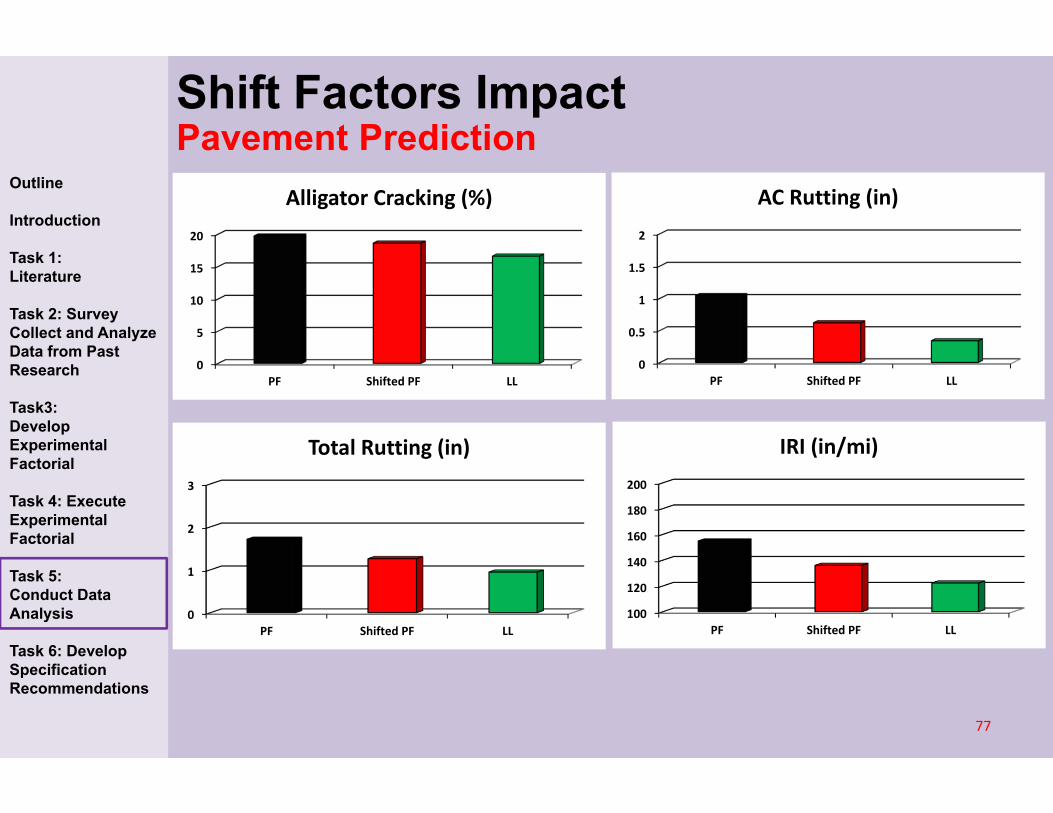
Shift Factors ImpactPavement Prediction
77
Outline
Introduction
Task 1: Literature
Task 2: Survey Collect and Analyze Data from Past Research
Task3: Develop Experimental Factorial
Task 4: Execute Experimental Factorial
Task 5: Conduct Data Analysis
Task 6: Develop Specification Recommendations
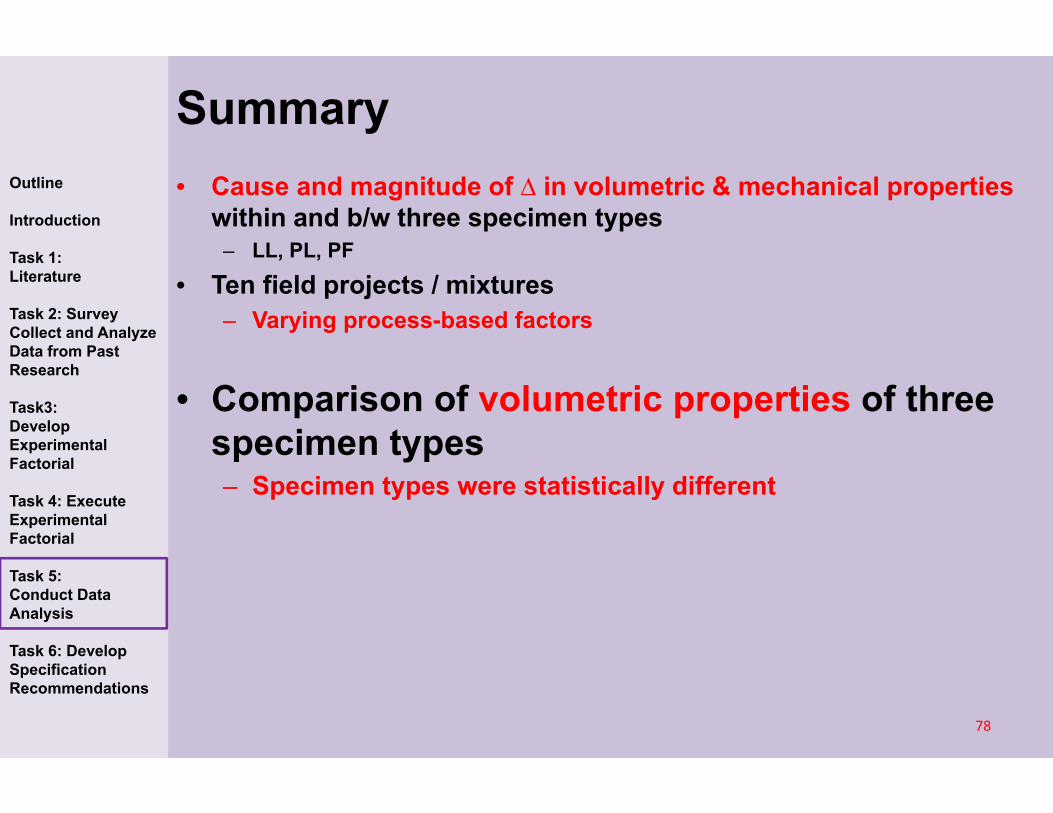
Summary• Cause and magnitude of ∆ in volumetric & mechanical properties
within and b/w three specimen types– LL, PL, PF
• Ten field projects / mixtures– Varying process-based factors
• Comparison of volumetric properties of three specimen types– Specimen types were statistically different
78
Outline
Introduction
Task 1: Literature
Task 2: Survey Collect and Analyze Data from Past Research
Task3: Develop Experimental Factorial
Task 4: Execute Experimental Factorial
Task 5: Conduct Data Analysis
Task 6: Develop Specification Recommendations
Summary• Cause and magnitude of ∆ in volumetric & mechanical properties
within and b/w three specimen types– LL, PL, PF
• Ten field projects / mixtures– Varying process-based factors
• Comparison of volumetric properties of three specimen types– Specimen types were statistically different
79
Outline
Introduction
Task 1: Literature
Task 2: Survey Collect and Analyze Data from Past Research
Task3: Develop Experimental Factorial
Task 4: Execute Experimental Factorial
Task 5: Conduct Data Analysis
Task 6: Develop Specification Recommendations
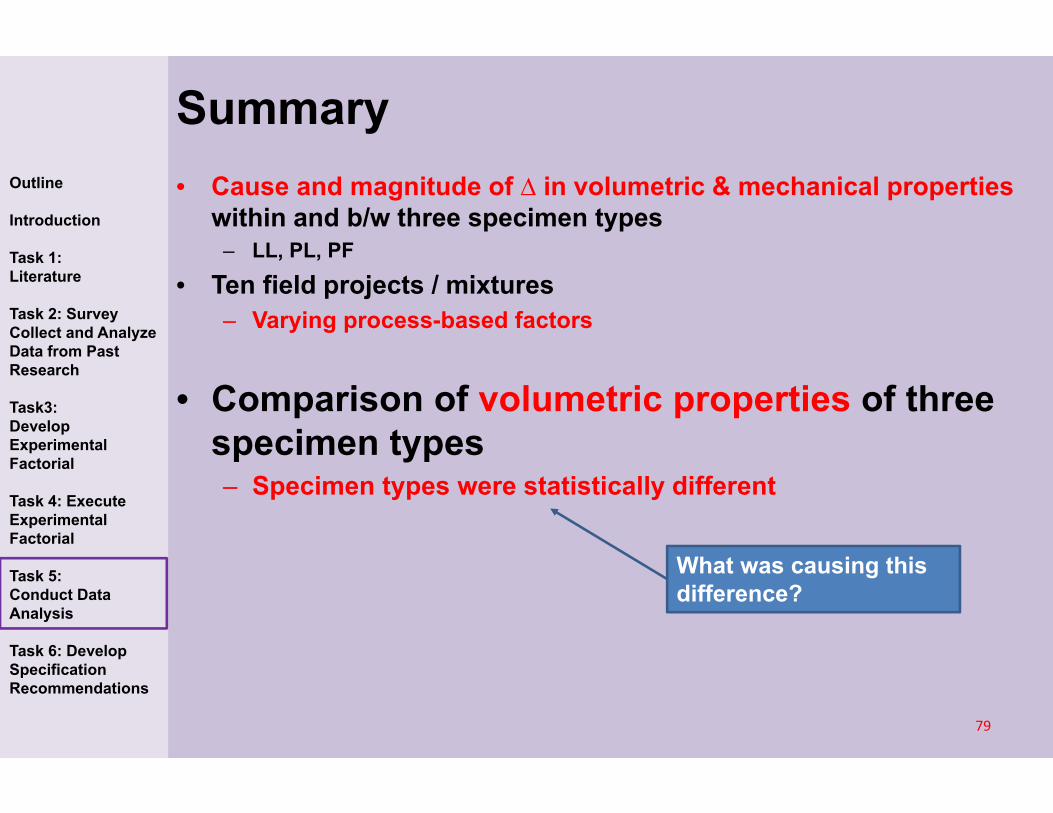
What was causing this difference?

Summary• Cause and magnitude of ∆ in volumetric & mechanical properties
within and b/w three specimen types– LL, PL, PF
• Ten field projects / mixtures– Varying process-based factors
• Impacts of process-based factors– Volumetric and Mechanistic
• None: PL vs PF– Volumetric
• LL vs PL, and LL vs PF– Contractor Survey
• Adjustment to account for the process-based factors
80
Outline
Introduction
Task 1: Literature
Task 2: Survey Collect and Analyze Data from Past Research
Task3: Develop Experimental Factorial
Task 4: Execute Experimental Factorial
Task 5: Conduct Data Analysis
Task 6: Develop Specification Recommendations
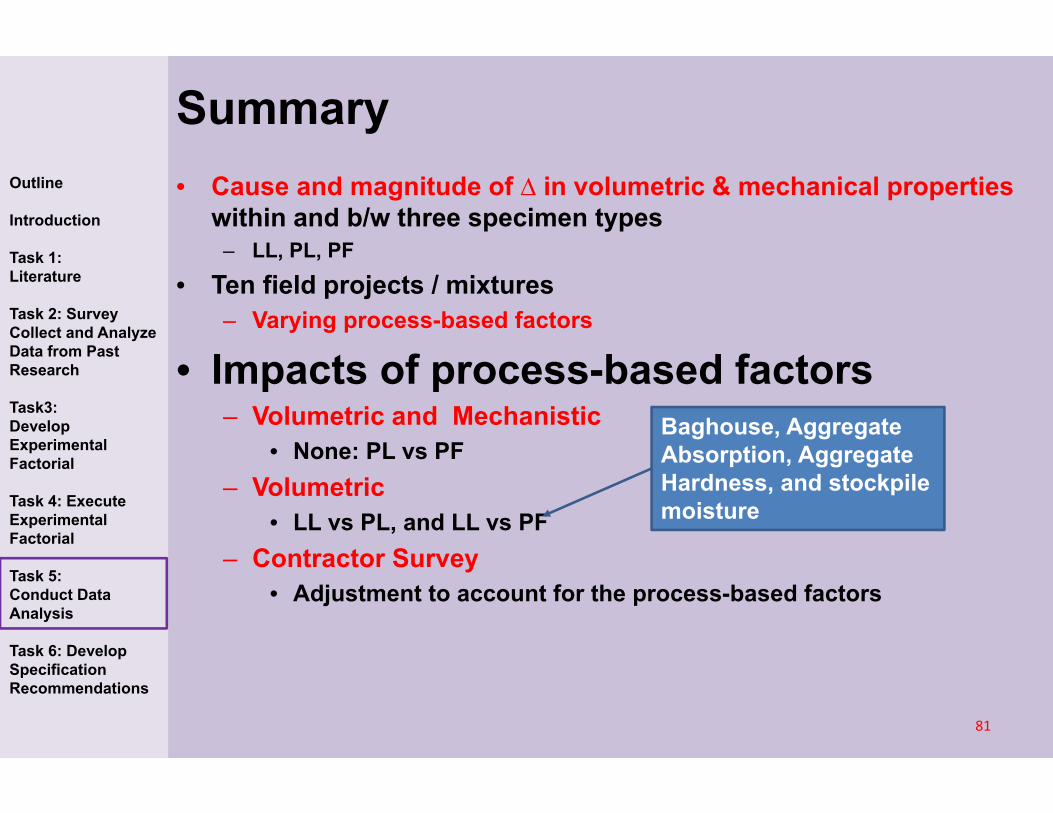
Summary• Cause and magnitude of ∆ in volumetric & mechanical properties
within and b/w three specimen types– LL, PL, PF
• Ten field projects / mixtures– Varying process-based factors
• Impacts of process-based factors– Volumetric and Mechanistic
• None: PL vs PF– Volumetric
• LL vs PL, and LL vs PF– Contractor Survey
• Adjustment to account for the process-based factors
81
Outline
Introduction
Task 1: Literature
Task 2: Survey Collect and Analyze Data from Past Research
Task3: Develop Experimental Factorial
Task 4: Execute Experimental Factorial
Task 5: Conduct Data Analysis
Task 6: Develop Specification Recommendations
Baghouse, Aggregate Absorption, Aggregate Hardness, and stockpile moisture
Summary• Cause and magnitude of ∆ in volumetric & mechanical properties
within and b/w three specimen types– LL, PL, PF
• Ten field projects / mixtures– Varying process-based factors
• Comparison of mechanistic properties of three specimen types– LWT (LL vs PF and PL to PF)– Axial E* (LL vs PL ) -- >25C– IDT E* (LL vs PF) -- > >10C
82
Outline
Introduction
Task 1: Literature
Task 2: Survey Collect and Analyze Data from Past Research
Task3: Develop Experimental Factorial
Task 4: Execute Experimental Factorial
Task 5: Conduct Data Analysis
Task 6: Develop Specification Recommendations
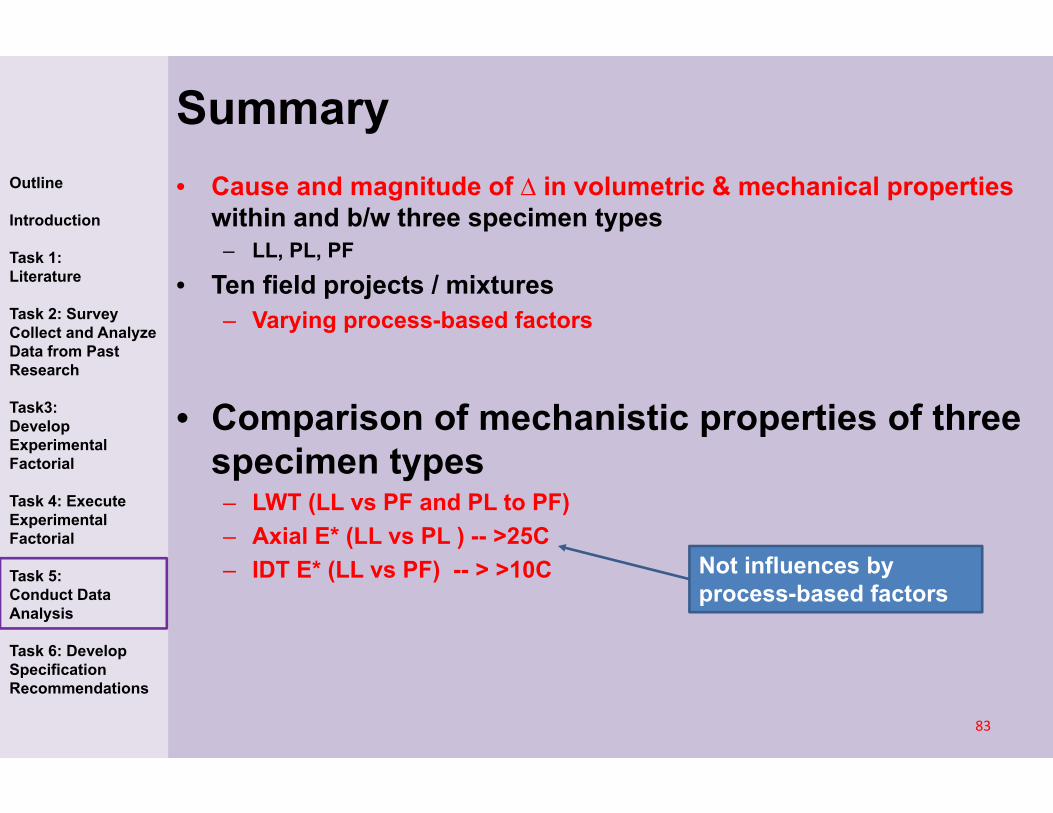
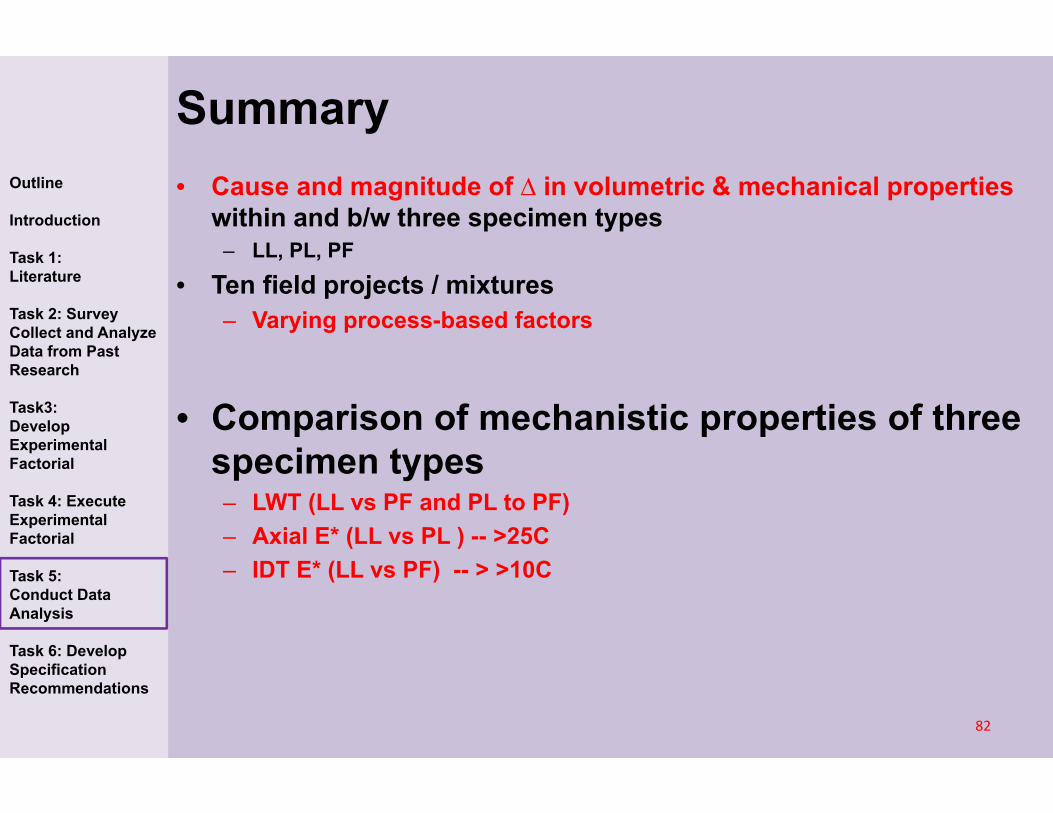
Summary• Cause and magnitude of ∆ in volumetric & mechanical properties
within and b/w three specimen types– LL, PL, PF
• Ten field projects / mixtures– Varying process-based factors
• Comparison of mechanistic properties of three specimen types– LWT (LL vs PF and PL to PF)– Axial E* (LL vs PL ) -- >25C– IDT E* (LL vs PF) -- > >10C
83
Outline
Introduction
Task 1: Literature
Task 2: Survey Collect and Analyze Data from Past Research
Task3: Develop Experimental Factorial
Task 4: Execute Experimental Factorial
Task 5: Conduct Data Analysis
Task 6: Develop Specification Recommendations
Not influences by process-based factors
84
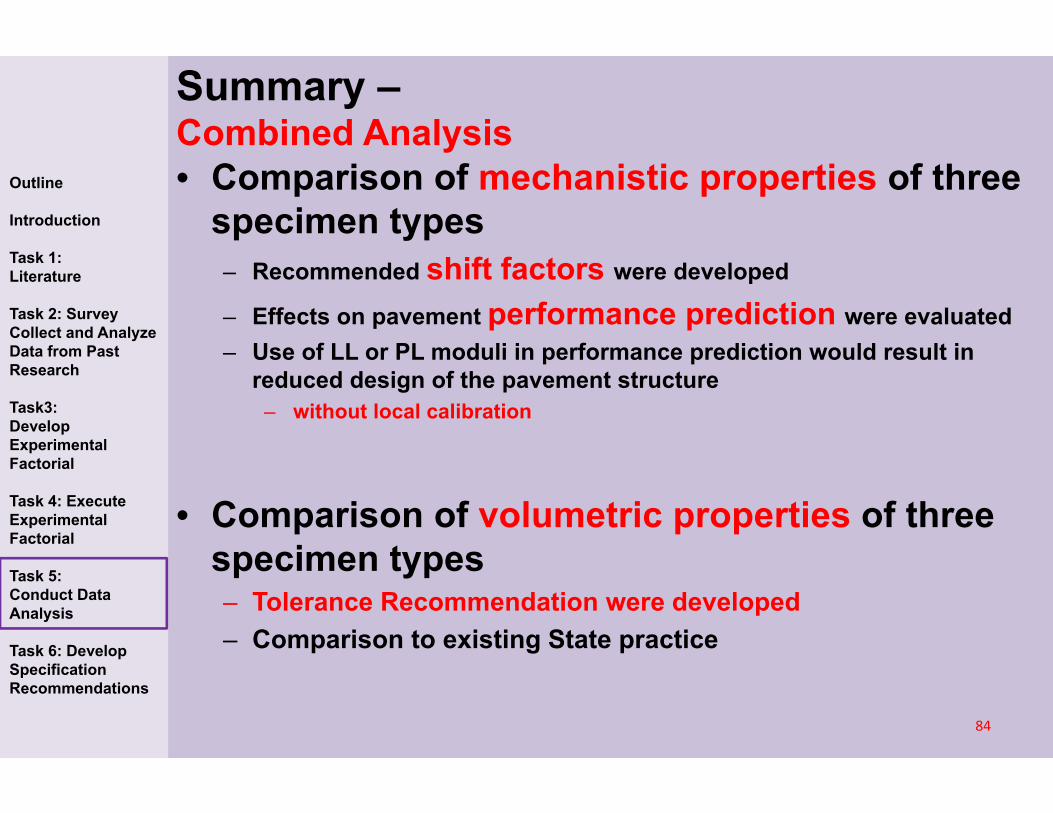
• Comparison of mechanistic properties of three specimen types– Recommended shift factors were developed
– Effects on pavement performance prediction were evaluated– Use of LL or PL moduli in performance prediction would result in
reduced design of the pavement structure– without local calibration
• Comparison of volumetric properties of three specimen types– Tolerance Recommendation were developed– Comparison to existing State practice
Summary –Combined Analysis
Outline
Introduction
Task 1: Literature
Task 2: Survey Collect and Analyze Data from Past Research
Task3: Develop Experimental Factorial
Task 4: Execute Experimental Factorial
Task 5: Conduct Data Analysis
Task 6: Develop Specification Recommendations

85
Implementation Recommendations

86
• Design Recommendations - Volumetrics• Introduce baghouse fines into laboratory produced
mixtures
Implementation RecommendationsOutline
Introduction
Task 1: Literature
Task 2: Survey Collect and Analyze Data from Past Research
Task3: Develop Experimental Factorial
Task 4: Execute Experimental Factorial
Task 5: Conduct Data Analysis
Task 6: Develop Specification Recommendations
Baghouse fines returned during production?
Yes
Determine quantity returned
0.5 -3%
“Pepper” Laboratory Mixture with appropriate baghouse material

87
• Performance Based Specification• LWT – Consider shift factors when evaluating
expected rut depth of field compacted specimens
Implementation RecommendationsOutline
Introduction
Task 1: Literature
Task 2: Survey Collect and Analyze Data from Past Research
Task3: Develop Experimental Factorial
Task 4: Execute Experimental Factorial
Task 5: Conduct Data Analysis
Task 6: Develop Specification Recommendations
Comparison Conversion
Design (LL) / Production (PL) 1.0
Design (LL) / Construction (PF) 0.75
Production (PL) / Construction (PF) 0.75
88
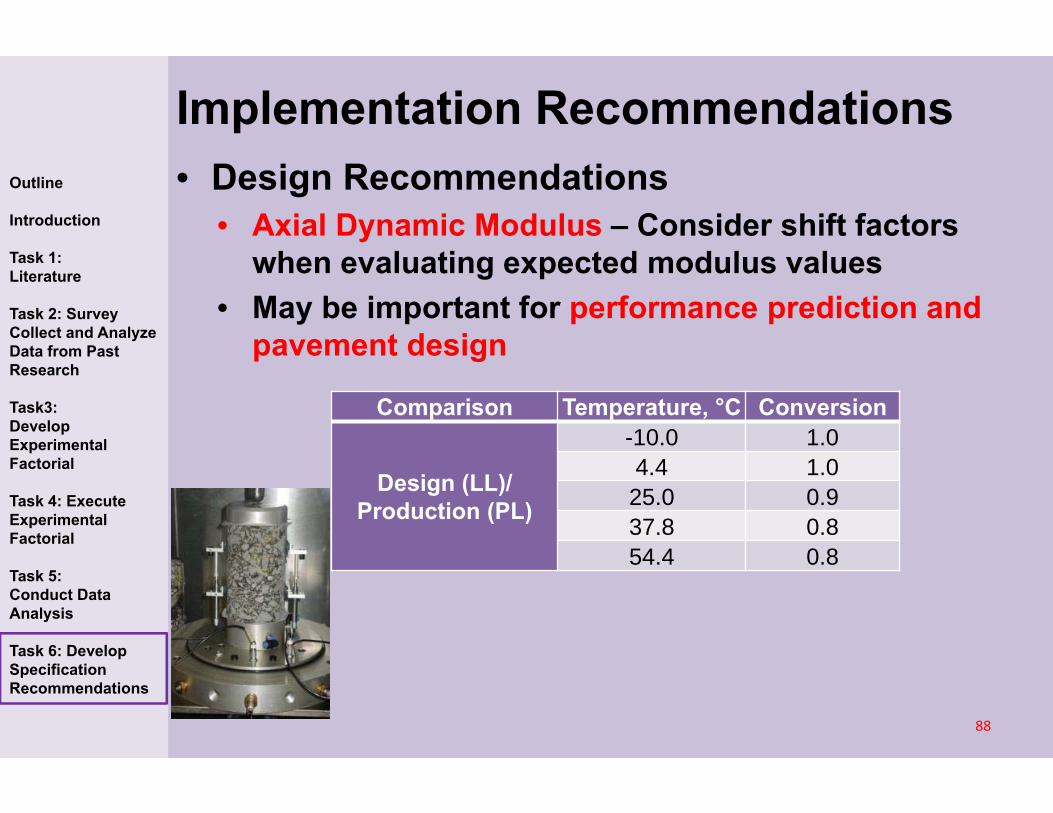
• Design Recommendations• Axial Dynamic Modulus – Consider shift factors
when evaluating expected modulus values• May be important for performance prediction and
pavement design
Implementation RecommendationsOutline
Introduction
Task 1: Literature
Task 2: Survey Collect and Analyze Data from Past Research
Task3: Develop Experimental Factorial
Task 4: Execute Experimental Factorial
Task 5: Conduct Data Analysis
Task 6: Develop Specification Recommendations
Comparison Temperature, °C Conversion
Design (LL)/ Production (PL)
-10.0 1.04.4 1.025.0 0.937.8 0.854.4 0.8
90
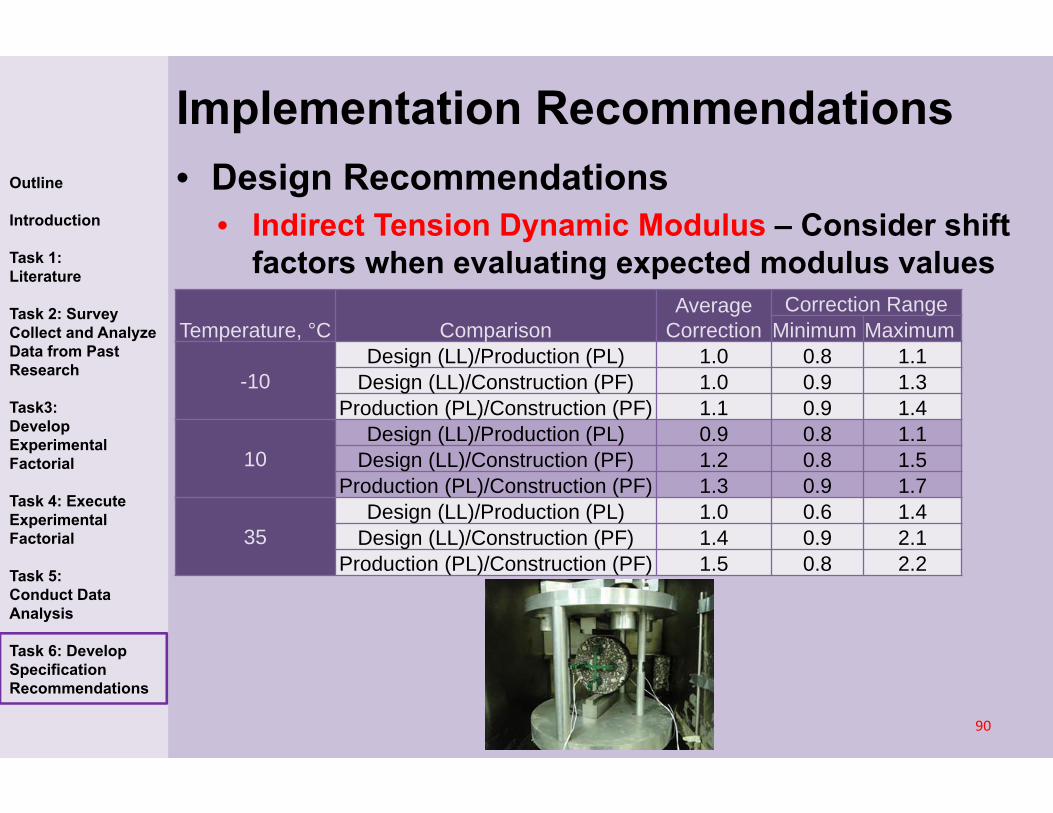
• Design Recommendations• Indirect Tension Dynamic Modulus – Consider shift
factors when evaluating expected modulus values
Implementation RecommendationsOutline
Introduction
Task 1: Literature
Task 2: Survey Collect and Analyze Data from Past Research
Task3: Develop Experimental Factorial
Task 4: Execute Experimental Factorial
Task 5: Conduct Data Analysis
Task 6: Develop Specification Recommendations
Temperature, °C ComparisonAverage
CorrectionCorrection Range
Minimum Maximum
-10Design (LL)/Production (PL) 1.0 0.8 1.1
Design (LL)/Construction (PF) 1.0 0.9 1.3Production (PL)/Construction (PF) 1.1 0.9 1.4
10Design (LL)/Production (PL) 0.9 0.8 1.1
Design (LL)/Construction (PF) 1.2 0.8 1.5Production (PL)/Construction (PF) 1.3 0.9 1.7
35Design (LL)/Production (PL) 1.0 0.6 1.4
Design (LL)/Construction (PF) 1.4 0.9 2.1Production (PL)/Construction (PF) 1.5 0.8 2.2
91
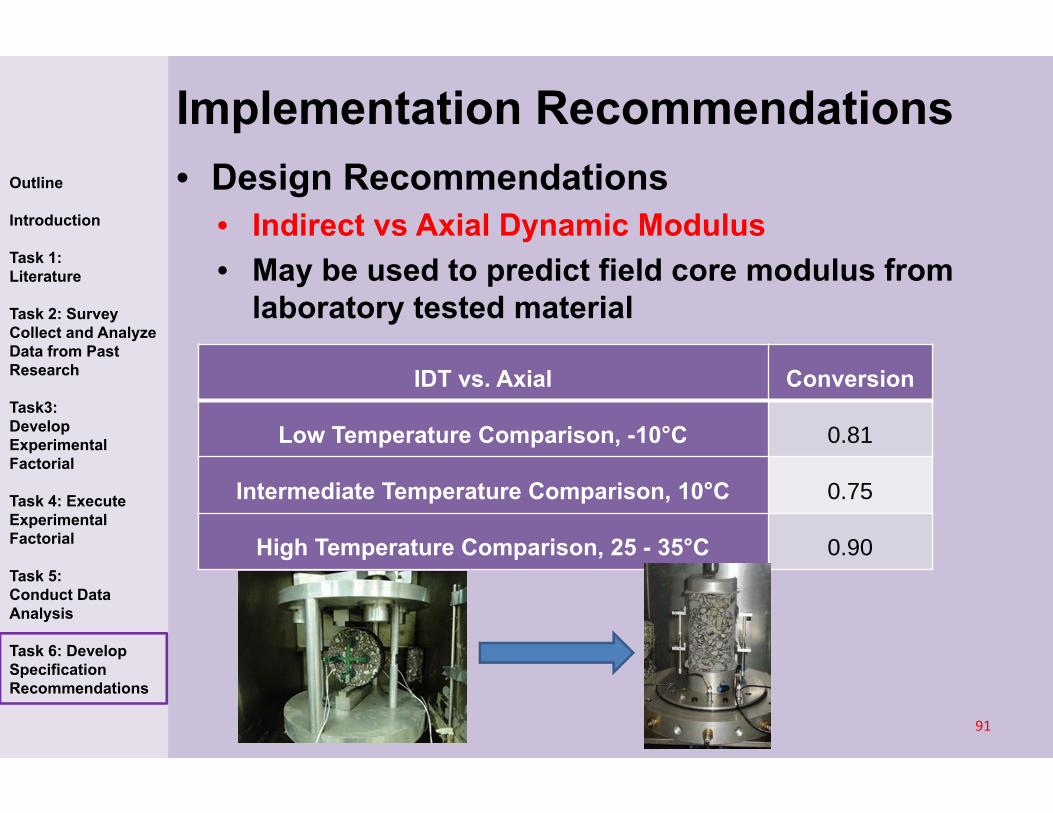
• Design Recommendations• Indirect vs Axial Dynamic Modulus• May be used to predict field core modulus from
laboratory tested material
Implementation RecommendationsOutline
Introduction
Task 1: Literature
Task 2: Survey Collect and Analyze Data from Past Research
Task3: Develop Experimental Factorial
Task 4: Execute Experimental Factorial
Task 5: Conduct Data Analysis
Task 6: Develop Specification Recommendations
IDT vs. Axial Conversion
Low Temperature Comparison, -10°C 0.81
Intermediate Temperature Comparison, 10°C 0.75
High Temperature Comparison, 25 - 35°C 0.90