comparing trmm 3b42, cfsr and ground-based … 12, 2081–2112, 2015 comparing trmm 3b42, cfsr and...
TRANSCRIPT

HESSD12, 2081–2112, 2015
Comparing TRMM3B42, CFSR and
ground-based rainfall
A. W. Worqlul et al.
Title Page
Abstract Introduction
Conclusions References
Tables Figures
J I
J I
Back Close
Full Screen / Esc
Printer-friendly Version
Interactive Discussion
Discussion
Paper
|D
iscussionP
aper|
Discussion
Paper
|D
iscussionP
aper|
Hydrol. Earth Syst. Sci. Discuss., 12, 2081–2112, 2015www.hydrol-earth-syst-sci-discuss.net/12/2081/2015/doi:10.5194/hessd-12-2081-2015© Author(s) 2015. CC Attribution 3.0 License.
This discussion paper is/has been under review for the journal Hydrology and Earth SystemSciences (HESS). Please refer to the corresponding final paper in HESS if available.
Comparing TRMM 3B42, CFSR andground-based rainfall estimates as inputfor hydrological models, in data scarceregions: the Upper Blue Nile Basin,EthiopiaA. W. Worqlul1,2,3, A. S. Collick4, S. A. Tilahun3, S. Langan2, T. H. M. Rientjes5,and T. S. Steenhuis1,3
1Department of Biological and Environmental Engineering, Cornell University,Ithaca, New York, USA2International Water Management Institute, Addis Ababa, Ethiopia3School of Civil and Water Resource Engineering, Bahir Dar University, Bahir Dar, Ethiopia4USDA-ARS, University Park, Pennsylvania, USA5Department of Water Resources, Faculty of Geo-information Science and Earth Observation(ITC), University of Twente, Enschede, the Netherlands
2081

HESSD12, 2081–2112, 2015
Comparing TRMM3B42, CFSR and
ground-based rainfall
A. W. Worqlul et al.
Title Page
Abstract Introduction
Conclusions References
Tables Figures
J I
J I
Back Close
Full Screen / Esc
Printer-friendly Version
Interactive Discussion
Discussion
Paper
|D
iscussionP
aper|
Discussion
Paper
|D
iscussionP
aper|
Received: 27 December 2014 – Accepted: 1 February 2015 – Published: 18 February 2015
Correspondence to: T. S. Steenhuis ([email protected])
Published by Copernicus Publications on behalf of the European Geosciences Union.
2082
HESSD12, 2081–2112, 2015
Comparing TRMM3B42, CFSR and
ground-based rainfall
A. W. Worqlul et al.
Title Page
Abstract Introduction
Conclusions References
Tables Figures
J I
J I
Back Close
Full Screen / Esc
Printer-friendly Version
Interactive Discussion
Discussion
Paper
|D
iscussionP
aper|
Discussion
Paper
|D
iscussionP
aper|
Abstract
Accurate prediction of hydrological models requires accurate spatial and temporal dis-tribution of rainfall observation network. In developing countries rainfall observationstation network are sparse and unevenly distributed. Satellite-based products have thepotential to overcome these shortcomings. The objective of this study is to compare the5
advantages and the limitation of commonly used high-resolution satellite rainfall prod-ucts as input to hydrological models as compared to sparsely populated network of raingauges. For this comparison we use two semi-distributed hydrological models Hydrolo-giska Byråns Vattenbalansavdelning (HBV) and Parameter Efficient Distributed (PED)that performed well in Ethiopian highlands in two watersheds: the Gilgel Abay with rel-10
atively dense network and Main Beles with relatively scarce rain gauge stations. Bothare located in the Upper Blue Nile Basin. The two models are calibrated with the ob-served discharge from 1994 to 2003 and validated from 2004 to 2006. Satellite rainfallestimates used includes Climate Forecast System Reanalysis (CFSR), Tropical Rain-fall Measuring Mission (TRMM) 3B42 version 7 and ground rainfall measurements. The15
results indicated that both the gauged and the CFSR precipitation estimates were ableto reproduce the stream flow well for both models and both watershed. TRMM 3B42performed poorly with Nash Sutcliffe values less than 0.1. As expected the HBV modelperformed slightly better than the PED model, because HBV divides the watershedinto sub-basins resulting in a greater number of calibration parameters. The simulated20
discharge for the Gilgel Abay was better than for the less well endowed (rain gaugewise) Main Beles. Finally surprisingly, the ground based gauge performed better forboth watersheds (with the exception of extreme events) than TRMM and CFSR satel-lite rainfall estimates. Undoubtedly in the future, when improved satellite products willbecome available, this will change.25
2083
HESSD12, 2081–2112, 2015
Comparing TRMM3B42, CFSR and
ground-based rainfall
A. W. Worqlul et al.
Title Page
Abstract Introduction
Conclusions References
Tables Figures
J I
J I
Back Close
Full Screen / Esc
Printer-friendly Version
Interactive Discussion
Discussion
Paper
|D
iscussionP
aper|
Discussion
Paper
|D
iscussionP
aper|
1 Introduction
Sound predictions of hydrological models need accurate spatial and temporal distri-bution of precipitation (Sharma et al., 2012). However, in developing countries groundrainfall observation stations are often unevenly and sparsely distributed and unlikely toimprove soon (Worqlul et al., 2014). According to the World Meteorological Organiza-5
tion (WMO, 1994) the minimum rainfall station network density for tropical regions is600 to 900 km2 per station for flat areas and 100 to 250 km2 per station for mountainousregions. But, in developing countries such a dense network is not available (Taye andWillems, 2012; Conway, 2000). Recently, the availability of satellite rainfall estimationwhere there is limited or no conventional ground rainfall observation stations has at-10
tracted the interest of hydrologists (Collischonn et al., 2008; Yilmaz et al., 2005; Honget al., 2007). Satellite rainfall estimates have the advantage of high temporal resolutionand spatial coverage, even over mountainous regions and sparsely populated areas.
Rainfall products, the Climate Forecast System Reanalysis (CFSR) and TropicalRainfall Measuring Mission (TRMM) 3B42 version 7 (hereafter, simply “TRMM”), be-15
sides being widely used and freely available in Africa, have a relatively high spatialresolution, global coverage and high temporal resolution. The product TRMM 3B42has been available since 1998 in a spatial resolution of 0.25◦ ×0.25◦ grid (≈ 27 km atthe equator) at a 3 hourly temporal resolution in a global belt extending from 50◦N to50◦ S. The CFSR global atmosphere data has a spatial resolution of approximately20
38 km and the data is available since 1979 (Saha et al., 2010). Detail information onTRMM and CFSR data can be found in (Worqlul et al., 2014; Wang et al., 2011; Sahaet al., 2010). The validation of satellite rainfall products can be achieved by direct com-parison with the ground observation station network (Dinku et al., 2008; Bitew et al.,2012; Worqlul et al., 2014) or by their ability to predict stream flow using hydrological25
models (Bitew et al., 2012; Fuka et al., 2014). A variety of hydrology models applied inthe Ethiopian highlands, such as the Agricultural Non-Point Source Pollution (AGNPS)(Haregeweyn and Yohannes, 2003; Mohammed et al., 2004), Water Erosion Predic-
2084

HESSD12, 2081–2112, 2015
Comparing TRMM3B42, CFSR and
ground-based rainfall
A. W. Worqlul et al.
Title Page
Abstract Introduction
Conclusions References
Tables Figures
J I
J I
Back Close
Full Screen / Esc
Printer-friendly Version
Interactive Discussion
Discussion
Paper
|D
iscussionP
aper|
Discussion
Paper
|D
iscussionP
aper|
tion Project (WEPP) (Zeleke, 2000) and the Soil and Water Assessment Tool (SWAT)(Setegn et al., 2008, 2009, 2010; Betrie et al., 2011), had limitations in capturing thedaily runoff dynamics because the underlying runoff mechanism in these models isbased on infiltration excess although experimentally it has been shown that satura-tion excess is the dominant mechanism of generating overland flow (Bayabil et al.,5
2010; Tilahun et al., 2013a, b). Water balance models, in particular the ParameterEfficient Distributed (PED) (Steenhuis et al., 2009) and the Hydrologiska Byråns Vat-tenbalansavdelning (HBV) (Lindström et al., 1997), which include saturation excessprocessing and are not input data intensive, could represent the runoff better in mon-soon climates than infiltration excess runoff models for scales ranging from 100 ha10
basin to the whole Blue Nile basin (Tilahun et al., 2013a, b, c; 2014; Steenhuis et al.,2015; Abdo et al., 2009; Wale et al., 2009).
Therefore, using the PED and HBV models to simulate stream flow, we assessed thesuitability (performance) and the limitations of state-of-the-art high-resolution satelliterainfall products readily available in Africa in two watersheds, Gilgel Abay and Main15
Beles, located in the upper Blue Nile Basin, Ethiopia. Gilgel Abay basin has high qualitydischarge data and a relatively well distributed network of ground rainfall observationstation, and Main Beles basin also has good quality discharge data, but a less wellendowed network of ground rainfall stations with a long period daily record data.
2 Methodology20
2.1 Study area description
The study watersheds, Gilgel Abay and Main Beles, are located in the Blue Nile Basin,in the western part of the Ethiopian highland. The Gilgel Abay watershed is located inthe Tana basin, between 10◦56′ and 11◦58′N latitude and 36◦44′ and 37◦34′ E longi-tudes. Gilgel Abay River is the source of Lake Tana; it originates from a small spring25
located near Gish Abay Mountain at elevation of 3000 ma.m.s.l. The Main Beles wa-
2085

HESSD12, 2081–2112, 2015
Comparing TRMM3B42, CFSR and
ground-based rainfall
A. W. Worqlul et al.
Title Page
Abstract Introduction
Conclusions References
Tables Figures
J I
J I
Back Close
Full Screen / Esc
Printer-friendly Version
Interactive Discussion
Discussion
Paper
|D
iscussionP
aper|
Discussion
Paper
|D
iscussionP
aper|
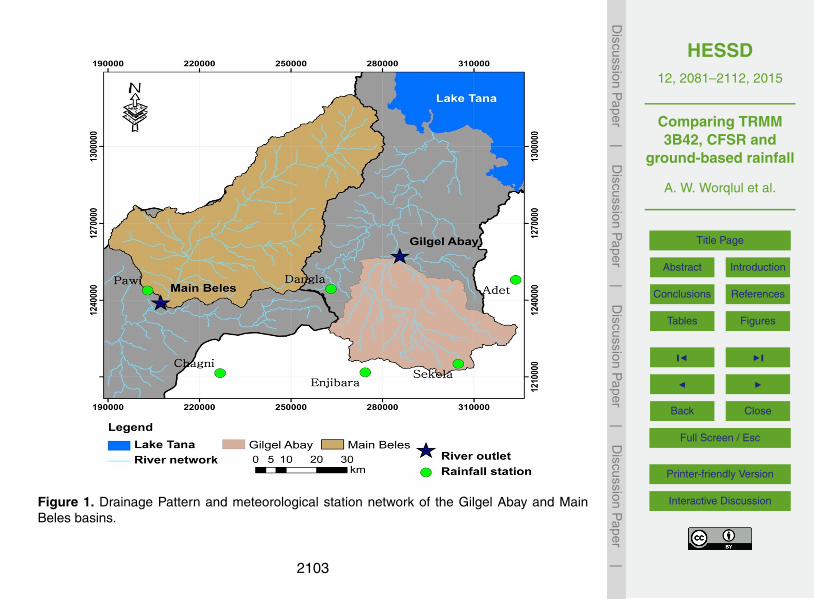
tershed is located in the Beles basin, geographically it extends from 10◦56′ to 12◦Nlatitude and 35◦12′ to 37◦ E longitude. The watershed areas of the Gilgel Abay andMain Beles at their gauging sites are approximately 1650 km2 and 3212 km2, respec-tively, extracted from the 90 m resolution Shuttle Radar Topographic Mission (SRTM)Digital Elevation Model (DEM). In Fig. 1, the location of meteorological stations and5
drainage pattern of the Gilgel Abay and Main Beles sub-basins are depicted.Gilgel Abay and Main Beles basins have a complex topography with a significant
elevation variation ranging from 1890 to 3530 and 990 to 2725 m, respectively. Theslope of the watersheds varies from zero to 140 %, with an average slope of 12 %for Gilgel Abay and 14 % for Main Beles basins. Approximately 50 % of the watersheds10
have a slope less than 8 %. Gilgel Abay and Main Beles basins have an average annualrainfall of 1860 and 1550 mm, respectively. The main rainfall season is from June toSeptember and accounts for 70 to 90 % of the annual rainfall (Kebede et al., 2006;Tarekegn and Tadege, 2006).
2.2 Climatological and discharge data15
Daily precipitation is collected from Ethiopian Meteorological Agency (EMA) for multiplestations. Daily data from 1994 to 2006 is obtained from Dangila, Adet, Sekela and En-jibara stations and the data collected from Chagni and Pawi was from 1998 to 2006. Inaddition, the only data needed to estimate potential evaporation such as maximum andminimum temperature, daily sunshine hour, maximum and minimum humidity and wind20
speed was available at the Dangila station. Daily discharge data for Gilgel Abay andMain Beles at the outlet stations from 1994 to 2006 was obtained from Ethiopian Min-istry of Water, Irrigation and Energy. The daily gridded satellite rainfall estimation dataTRMM product (3B42) Version 7 was downloaded from the ftp server at http://gdata1.sci.gsfc.nasa.gov/daac-bin/G3/gui.cgi?instance_id=TRMM_3B42_Daily and CFSR at25
http://rda.ucar.edu/datasets/ds094.1/.
2086

HESSD12, 2081–2112, 2015
Comparing TRMM3B42, CFSR and
ground-based rainfall
A. W. Worqlul et al.
Title Page
Abstract Introduction
Conclusions References
Tables Figures
J I
J I
Back Close
Full Screen / Esc
Printer-friendly Version
Interactive Discussion
Discussion
Paper
|D
iscussionP
aper|
Discussion
Paper
|D
iscussionP
aper|
2.3 Methods
The study is comprised of two parts, in the first part, after estimating the areal long-termmonthly rainfall estimates of gauged rainfall, CFSR and TRMM data from 1994–2006for Gilgel Abay and Main Beles basins a comparison is done by using simple standardstatistics (i.e., coefficient of determination). The gauged rainfall data is interpolated by5
Thiessen Polygon method. Next, the high-resolution satellite rainfall products (CFSRand TRMM) and gauged rainfall daily data are used as an input to two watershed mod-els HBV-IHMS and PED for daily stream flow simulation in the Gilgel Abay and MainBeles basins. The model parameters are used to fit the observed flow through modelcalibration. The model calibration period ranges from 1994 to 2003 and the model is10
validated from 2004 to 2006 for gauged rainfall, CFSR and TRMM data. The perfor-mance of the calibrated model is evaluated by the Nash–Sutcliffe Coefficient (NSE),percent bias (PBIAS), and coefficient of determination (R2). The hydrological modelsHBV and PED are described below:
HBV-IHMS model15
The HBV (Hydrologiska Byråns Vattenbalansavdelning) model (Lindström et al., 1997)is a conceptual rainfall–runoff model for continuous daily simulation of catchment runoff.In HBV, the watershed is divided into sub-watersheds and further divided into elevationand land use zones. The model simulates daily runoff using daily rainfall, tempera-ture, long-term average monthly potential evaporation, geographical information of the20
catchment which is sliced elevation crossed with land use and observed runoff data forcalibration. The general water balance is described in Eq. (1):
P −E −Q =ddt
[SP+SM+UZ+LZ+L] , (1)
2087

HESSD12, 2081–2112, 2015
Comparing TRMM3B42, CFSR and
ground-based rainfall
A. W. Worqlul et al.
Title Page
Abstract Introduction
Conclusions References
Tables Figures
J I
J I
Back Close
Full Screen / Esc
Printer-friendly Version
Interactive Discussion
Discussion
Paper
|D
iscussionP
aper|
Discussion
Paper
|D
iscussionP
aper|
where P is the precipitation, E is evapotranspiration, Q is runoff, SP is snow pack, SMis soil moisture, UZ is upper ground zone, LZ is lower ground zone, and L is the lakevolume.
The model consists of subroutines for precipitation, soil moisture accounting, re-sponse routine, transformation function and simple routing procedure. The soil mois-5
ture accounting routine is based on three parameters, Beta (β), FC and LP. β controlsthe contribution to the response function from each millimetres of rainfall. FC is themaximum soil moisture storage. As the soil moisture exceeds the limit for potentialevaporation (LP), water will evaporate at a potential rate. The response routine is de-scribed by upper non-linear reservoir and a linear lower response routine connected10
with the upper box with Percolation (PERC). K and K4 are recession coefficient pa-rameters for the upper and lower response parameters. The non-linearity of the upperreservoir is controlled by the parameter Alpha (α). The higher α the higher the peaksand the quicker the recession (SHMI, 2006). A complete description of the HBV modelcan be found in Lindström et al. (1997), SMHI (2006) and Wale et al. (2009) among oth-15
ers. Input for HBV includes: long-term monthly potential evaporation is estimated by thePenman-combination equation using Dangila meteorological station. A digital elevationmodel (DEM) from SRTM DEM (Jarvis et al., 2008) is used to extract the drainage areaof the watersheds and to divide each watershed into three different sub-basins and el-evations zones. Land use data is collected from Ethiopia Ministry of Water, Irrigation20
and Energy.
PED model
The PED (Parameter Efficient Distributed) model (Steenhuis et al., 2009) is a con-ceptual semi-distributed rainfall–runoff model for continuous daily simulation of catch-ment runoff. In PED the watershed is subdivided into three sub-regions distinguished25
as the bottom lands that potentially saturate in the rainy monsoon phase, degradedhillslope/exposed rock with little or no soil cover and permeable hillslopes (infiltrationzones). In the PED model various portions of the watershed become hydrologically ac-
2088
HESSD12, 2081–2112, 2015
Comparing TRMM3B42, CFSR and
ground-based rainfall
A. W. Worqlul et al.
Title Page
Abstract Introduction
Conclusions References
Tables Figures
J I
J I
Back Close
Full Screen / Esc
Printer-friendly Version
Interactive Discussion
Discussion
Paper
|D
iscussionP
aper|
Discussion
Paper
|D
iscussionP
aper|
tive when threshold moisture content is exceeded (Steenhuis et al., 2013). The perme-able hillslopes/infiltration zones contribute to the rapid subsurface flow (called interflow)characterised by flow decreasing as a linear function of time, and baseflow is charac-terised by an exponentially decreasing flow in time Steenhuis et al. (2013). Overlandflow is generated from saturated areas in the relatively flatter areas in the landscape5
and areas where bed rock is exposed Steenhuis et al. (2009). For each of the threeregions, the water balance calculation is based on Thornthwaite and Mather (1955)procedure. The general water balance equation for the sub-regions is described underEq. (2):
St = St−∆t + (P −AET−R −Perc)∆t, (2)10
where St is water stored in the topmost layer, St−∆t is the previous time step storage(mm), P is precipitation (mm day−1), AET is the actual evapotranspiration, R is thesaturation excess runoff (mm day−1), Perc is the percolation to the subsoil (mm day−1),and ∆t is the time step (day).
The model simulates the daily runoff using daily rainfall, potential evaporation and15
daily runoff data for calibration. Input for PED: potential evaporation is estimated bythe Penman-combination equation. Landscape parameter for the model, the relativearea of three regions are used as a model calibration parameter with their respectivemaximum soil moisture storage capacity. Subsurface flow is simulated using a linearreservoir with a half-life (t1/2) and interflow employing a zero order reservoir calibration20
parameter τ* is the duration of the period after a single rainstorm until interflow ceases.A complete description of the PED model can be found in Steenhuis et al. (2009),Tesemma et al. (2010), and Tilahun et al. (2013b).
2.4 Model calibration and validation
The two simulation models were calibrated manually, first by fitting the runoff volumes25
followed by calibrating the shape of the hydrograph from 1994 to 2003 for gauged
2089
HESSD12, 2081–2112, 2015
Comparing TRMM3B42, CFSR and
ground-based rainfall
A. W. Worqlul et al.
Title Page
Abstract Introduction
Conclusions References
Tables Figures
J I
J I
Back Close
Full Screen / Esc
Printer-friendly Version
Interactive Discussion
Discussion
Paper
|D
iscussionP
aper|
Discussion
Paper
|D
iscussionP
aper|
rainfall and CFSR data. The TRMM data is calibrated from 1998 to 2003. The calibratedmodel is validated from 2004 to 2006 in all cases.
The model performance is evaluated by three objective functions consisting of theNash–Sutcliffe Efficiency (NSE) (Nash and Sutcliffe, 1970), percent bias (PBIAS), andcoefficient of determination (R2). NSE is a normalized statistic that determines the5
relative magnitude of the residual variance compared to the measured observed flowvariance. NSE ranges from negative infinite to 1. Generally, NSE value between 0.6 and0.8 indicates fair to good performance and a model is said to be very good when NSE isabove 0.8 (Moriasi et al., 2007). PBIAS is the relative difference between the observedand simulated flows. PBIAS measures the tendency of the average simulated flow to be10
larger or smaller than the observed flow (Gupta et al., 1999). R2 is used to evaluate thegoodness of fit of the relations. R2 examines the degree of linear association betweenthe observed and simulated flows.
3 Results and discussion
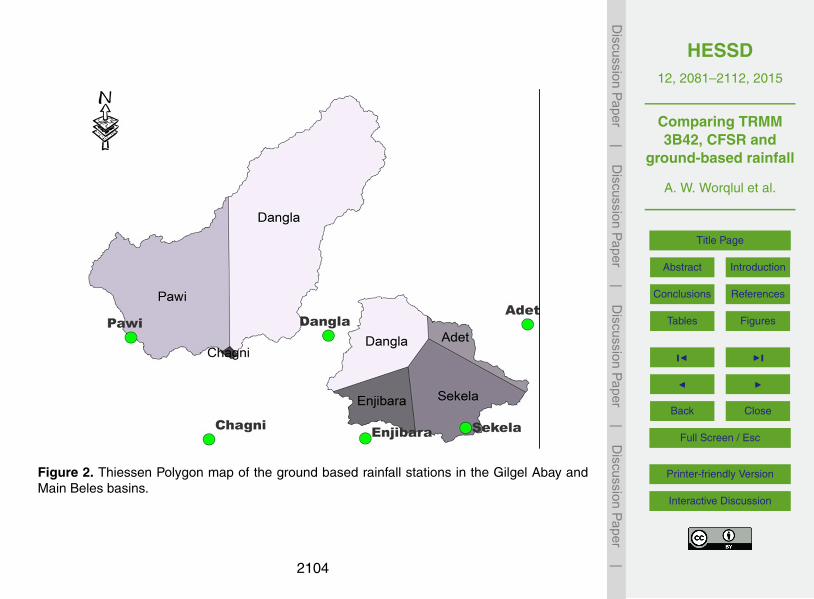
3.1 Comparsion of areal gauged rainfall with TRMM and CFSR rainfall estimates15
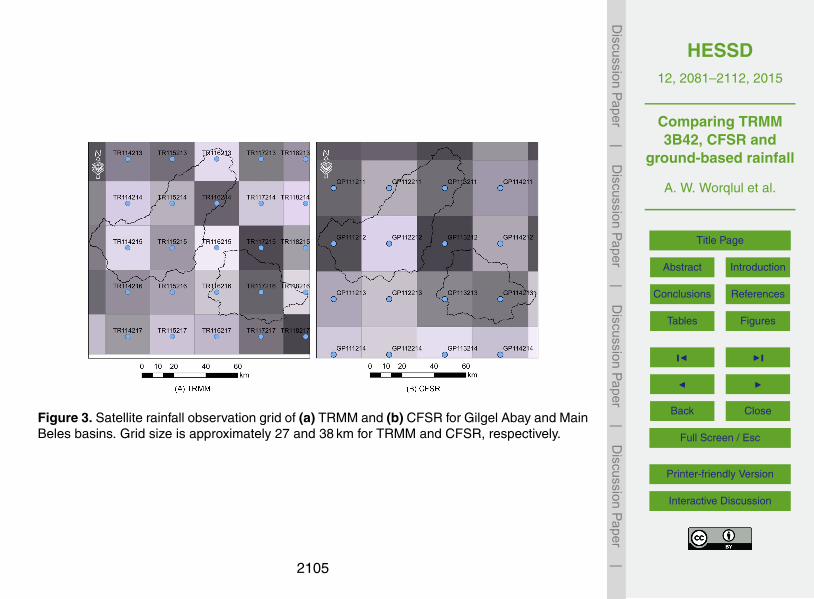
The areal rainfall of the gauged rainfall is estimated by Thiessen Polygon method withrelative areas for each of the six rain gauges as shown in Fig. 2. Figure 3 indicates thesatellite rainfall observation grid generated from TRMM and CFSR data for Gilgel Abayand Main Beles basins. The long-term monthly areal average ground observed rainfall,TRMM and CFSR for the Gilgel Abay and Main Beles basins are depicted in Fig. 4.20
The CFSR satellite rainfall and gauged data are averaged over the period from 1994 to2006 and TRMM over the period from 1998 to 2006 for the Gilgel Abay and Main Belesbasins.
Gilgel Abay and Main Beles watersheds have similar rainfall patterns according toboth gauged and CFSR rainfall data with a goodness of fit, R2, of 0.98 for each (Ta-25
ble 1). Areal TRMM rainfall estimates for Gilgel Abay and Main Beles have a similar
2090
HESSD12, 2081–2112, 2015
Comparing TRMM3B42, CFSR and
ground-based rainfall
A. W. Worqlul et al.
Title Page
Abstract Introduction
Conclusions References
Tables Figures
J I
J I
Back Close
Full Screen / Esc
Printer-friendly Version
Interactive Discussion
Discussion
Paper
|D
iscussionP
aper|
Discussion
Paper
|D
iscussionP
aper|
pattern indicated by R2, of 0.90. CFSR also has captured the gauged rainfall for GilgelAbay and Main Beles with R2 values of 0.92 and 0.90, respectively. The fit betweenTRMM and gauged data is poor, 0.35 and 0.12 for Gilgel Abay and Main Beles, re-spectively. TRMM average annual rainfall volume estimates underpredict by 13 and2 % for Gilgel Abay and Main Beles, respectively, while CFSR data overpredicts by 205
and 36 %, respectively. Seventy five percent of the gauged areal rainfall occurs duringthe rainy season from June through September compared to eighty percent for CFSRand only 40 % for TRMM.
Thus the TRMM 3B42 satellite rainfall data does not capture the temporal variation ofrainfall well for the two basins. The poor seasonal rainfall predictions will cause the mis-10
representation of watershed discharge, with nearly 82 and 83 % of annual dischargeoccurring between June through September for Gilgel Abay and Main Beles, respec-tively. Apparently, the TRMM 3B42 bias is adjusted with monthly gauged rainfall data,and as a result, has performed well in many parts of the world (Ouma et al., 2012; Ja-vanmard et al., 2010). Dinku et al. (2008) and Haile et al. (2013), also in the Ethiopian15
highlands, have indicated a consistent result with our study. Haile et al. (2013) afterpersonal communication with TMPA research team indicated that gauged rainfall dataof the Upper Blue Nile Basin was not made available to them when the bias adjustmentwas conducted; therefore, further adjustment has to be done to use TRMM 3B42 rain-fall products in the Blue Nile Basin. Likely, the additional adjustments will correct the20
seasonal distribution of rainfall in the Gilgel and Main Beles watersheds.
3.2 Simulated runoff using PED and HBV models
3.2.1 Simulation of stream discharge with PED model
The calibrated PED models using gauged rainfall or CFSR rainfall could representthe observed daily stream flow reasonable well for both the calibration and vali-25
dation periods for the Gilgel Abay basin (0.81>NSE>0.60) and the Main Beles(0.81>NSE>0.60), see Fig. 5 and Table 2. For both basins, as demonstrated in Fig. 6
2091
HESSD12, 2081–2112, 2015
Comparing TRMM3B42, CFSR and
ground-based rainfall
A. W. Worqlul et al.
Title Page
Abstract Introduction
Conclusions References
Tables Figures
J I
J I
Back Close
Full Screen / Esc
Printer-friendly Version
Interactive Discussion
Discussion
Paper
|D
iscussionP
aper|
Discussion
Paper
|D
iscussionP
aper|
in which the average monthly values are depicted, the gauged rainfall gave slightly bet-ter results than the CFSR data (Fig. 7a and b). For the daily values the same trend isobserved in which the regression coefficient indicated that during the validation periodof the Gilgel Abay basin, the gauged rainfall could explain 82 % of the observed runoffvariation and CFSR data could capture 73 % of the flow variation (Table 2). TRMM rain-5
fall data could not characterize the observed discharge pattern (Figs. 5 and 7c) evenwith optimum model calibration mean observed flow is better representative than thesimulated flow as indicated by NSE values close to zero (Table 2).
We found that the PED model parameters of the fractional areas, the half-life ofthe baseflow and the duration of the interflow after a rainstorm are sensitive for the10
prediction of stream discharge using either of the three rainfall records similar to Tilahunet al. (2013b). The model is insensitive to the maximum soil moisture storage for eitherof three regions (periodically saturated bottom lands, degraded soils, and permeablehillside). The reason is that, for a monsoon climate during the rainy phase, the soildoes not dry out once wet, only during the first rains the discharge is affected by the15
amount of the water that can be stored in the soils. Therefore we kept, maximum waterstorages remained the same for all simulation.
Table 2 lists the optimised sensitive PED model parameter sets for the gauged,CFSR and TRMM rainfall estimate for Gilgel Abay and Main Beles basins. The cali-brated model parameters for the subsurface flow represented by the half-life (t1/2) and20
interflow calibration parameter τ* for the different rainfall input data are almost the samefor all simulations as expected and consistent with values used in simulation of Anjeniand Blue Nile Basins (Tilahun et al., 2013a). The fractional regions contributing to rapidsubsurface and overland flow have different values for the gauged rainfall and CFSRrainfall data simulation. The total contributing area for the gauged rainfall adds up to25
97 % for Gilgel Abay and 90 % for Main Beles. It is also consistent with earlier studiesof PED simulation for a wide scale of watersheds study areas Tilahun et al. (2013b)indicated that the fractional area’s for a 180 000 km2 Blue Nile Basin adds up to 100 %while the smaller watershed of less than 5 km2 are in the order of 60 %. So, for a mid-
2092
HESSD12, 2081–2112, 2015
Comparing TRMM3B42, CFSR and
ground-based rainfall
A. W. Worqlul et al.
Title Page
Abstract Introduction
Conclusions References
Tables Figures
J I
J I
Back Close
Full Screen / Esc
Printer-friendly Version
Interactive Discussion
Discussion
Paper
|D
iscussionP
aper|
Discussion
Paper
|D
iscussionP
aper|
range watershed area in a range of 1000 km2 the fraction area up to 90 to 97 % wouldbe realistic. Using the CFSR the fractional area adds up to 60 % for the Gilgel Abayand 42 % for the Main Beles. A fractional area of 1 would mean that all rainwater minusevaporation over the long-term becomes discharge at the outlet.
3.2.2 Simulation of stream discharge with HBV model5
The semi-distributed HBV model has seven parameters controlling the total volumeand shape of the hydrograph; there level of model parameter sensitivity is documentedin Wale et al. (2009). The model is calibrated manually first by volume controlling pa-rameters (FC, LP and Beta) followed by calibrating the shape controlling parameters(Alpha, PERC, K4 and K). The optimized model parameter sets of both watersheds and10
simulated discharge vs. observed runoff for gauged rainfall, TRMM and CFSR data ofGilgel Abay is shown in Table 3 and Fig. 8 respectively.
The simulated data for the calibration period using the gauged rainfall and CFSRindicated a fair to good performance with a daily NSE performance indicator equals to0.81 and 0.72 for Gilgel Abay and 0.64 and 0.61 for Main Beles, respectively, and with15
a reasonable R2 and PBIAS (Table 3, Fig. 10a and b). The simulation for both gaugedrainfall and CFSR data captured well the base flow, the rising and recession limb ofthe hydrograph. Figure 9 depicts the long-term monthly average observed flow andsimulated flow for gauged rainfall, TRMM and CFSR rainfall estimate of Gilgel Abayand Main Beles basins.20
The peak flow is better captured by the CFSR data than the gauged rainfall althoughboth simulation by gauged and CFSR rainfall underestimate very high single peaksthat are commonly caused by extreme high rainfall events. For the study period, in theGilgel Abay watershed there are 505 days with observed flow above 200 m3 s−1, thesimulation by the CFSR rainfall estimate has captured 340 events and the gauged rain-25
fall has captured 235 events. The optimized model parameters of the gauged rainfalland CFSR data have similar values except for FC and PERC in both watersheds (see
2093
HESSD12, 2081–2112, 2015
Comparing TRMM3B42, CFSR and
ground-based rainfall
A. W. Worqlul et al.
Title Page
Abstract Introduction
Conclusions References
Tables Figures
J I
J I
Back Close
Full Screen / Esc
Printer-friendly Version
Interactive Discussion
Discussion
Paper
|D
iscussionP
aper|
Discussion
Paper
|D
iscussionP
aper|
Table 3). Field capacity (FC) of the calibrated model using CFSR data is larger thanthe FC value of model calibrated by gauged rainfall (1480 and 245 mm for Gilgel Abayand 1400 and 800 mm for Main Beles). The FC value for the CFSR model simulationindicated that the soil retained greater quantities of water and released it afterwardsby evapotranspiration and base flow compared to the gauged flow simulation, and it5
is the models way to deal with the greater amounts of rainfall in the CFSR data com-pared to the gauged. The increase FC will cause an increase in baseflow, and this hasa counter effect on the percolation parameter (PERC). The optimised model parameterset is tested for independent data from 2004 to 2006 and the result is acceptable forboth gauged rainfall and CFSR data for the study watersheds.10
For this specific area and study period the TRMM 3B42 rainfall estimate did notperform well in capturing the observed flow of Gilgel Abay and Main Beles throughmodel calibration as indicated statistically by the NSE values (Table 3) and visually inFig. 10c and 7c.
3.2.3 Evaluation of rainfall products using HBV and PED models15
The semi-distributed hydrological models HBV and PED are considered parsimoniousmodels because they have a limited number of model parameters, making the calibra-tion procedure less complicated and avoiding the problem of overparamterization. Mostof the time calibration with a large number parameters leads to over parameterization(Whittaker et al., 2010) leading to a poor prediction accuracy. Parsimonious models20
are favourable compared to more complex models since they often perform as well assophisticated ones (Duan et al., 1992).
Both models have reasonably captured the observed runoff for gauged rainfall andCFSR rainfall estimate as a model input for calibration and validation period for GilgelAbay and Main Beles. The performance of both models on Main Beles watershed by25
gauged rainfall and CFSR data is close compared to the case of Gilgel Abay. Thisis because, ground rainfall gauging stations in the Main Beles are scares comparedto Gilgel Abay (Fig. 1), and there is no rainfall observation station inside the water-
2094
HESSD12, 2081–2112, 2015
Comparing TRMM3B42, CFSR and
ground-based rainfall
A. W. Worqlul et al.
Title Page
Abstract Introduction
Conclusions References
Tables Figures
J I
J I
Back Close
Full Screen / Esc
Printer-friendly Version
Interactive Discussion
Discussion
Paper
|D
iscussionP
aper|
Discussion
Paper
|D
iscussionP
aper|
shed. So, it was difficult to capture the observed flow through model calibration usinggauged rainfall in the Main Beles. This indicates that CFSR data can be an alternativeto gauged rainfall as input to hydrological modelling when the rainfall station network isless dense. The peak flow for both models is better captured by the CFSR rainfall datathan the gauged rainfall for obvious reason of 20 and 36 % additional rainfall for Gilgel5
Abay and Main Beles respectively. The simulation by the gauged rainfall underestimatevery high single peaks that are commonly caused by extreme high rainfall events. TheTRMM rainfall predictions has failed to perform within the objective function for bothmodels.
4 Conclusions10
This study has assessed the performance of commonly used high-resolution satel-lite rainfall products Climate Forecast System Reanalysis (CFSR) and Tropical RainfallMeasuring Mission (TRMM) 3B42 version 7 as input to a semi-distributed hydrologicalmodel HBV and PED for daily stream flow simulation in the Gilgel Abay and Main Be-les basins, Ethiopia. The simulation is also done for the gauged rainfall to capture the15
observed flow through model parameter calibration. The gauged rainfall has performedwell for both calibration and validation period with a fair to good NSE and on averagethe simulation has explained approximately 80 % of the observed flow variation throughmodel calibration for both models. Rainfall estimate from the CFSR has also capturedthe observed flow though model calibration with a fair to good NSE and on average20
the CFSR runoff simulation has captured approximately 75 % of the variation of the ob-served flow for both models through model calibration. PED and HBV models throughmodel calibration have responded for the extra rainfall of CFSR satellite rainfall esti-mate it has compared to the gauged rainfall. In HBV model, the maximum soil moisturestorage parameter (FC) was too large indicating a deeper hydraulically active soil in-25
creasing the storage capacity of the soil. In PED model the fractional contributing areafor CFSR rainfall estimate adds up to 60 % for Gilgel Abay and 42 % for Main Beles
2095

HESSD12, 2081–2112, 2015
Comparing TRMM3B42, CFSR and
ground-based rainfall
A. W. Worqlul et al.
Title Page
Abstract Introduction
Conclusions References
Tables Figures
J I
J I
Back Close
Full Screen / Esc
Printer-friendly Version
Interactive Discussion
Discussion
Paper
|D
iscussionP
aper|
Discussion
Paper
|D
iscussionP
aper|
respectively, while the fractional contribution area for the gauged rainfall is 97 and 90 %for Gilgel Abay and Main Beles. The TRMM data was not able to capture the observedflow through model calibration for both HBV and PED models. Therefore, we suggestfurther calibration of TRMM 3B42 rainfall product using the gauged rainfall for the BlueNile area before the data is used for any application in the area.5
Although only one station is available in the Gilgel Abay watershed and no rainfallstation in the Main Beles basin, the performance of the gauged rainfall in capturingthe observed runoff is better than both TRMM and CFSR estimates for calibration aswell as validation periods. This indicates that gauged rainfall has its merit, but for re-mote regions with few or no observation stations in the Blue Nile area, CFSR rainfall10
estimate can be used to complement gauged rainfall data scarcity. The fractional satu-rated and degraded area of the PED model can be validated through satellite imageryby supervised land use classification. The simulation by the CFSR data for both HBVand PED models was able to capture the peak flows better than the runoff simulationby the gauged rainfall. So, the CFSR data might be more suitable to predict extreme15
events when using either PED or HBV models.
Acknowledgements. This research was supported by a graduate student fellowship for thesenior author by the Norman E. Borlaug Leadership Enhancement in Agriculture Programfunded by USAID and the International Water Management Institute. We are very grateful tothe Ethiopian Ministry of Water, Irrigation and Energy and National Meteorological Agency of20
Ethiopia for providing daily river flow and metrological data for multiple stations free of charge.The data providers of Tropical Rainfall Measuring Mission (TRMM) product (3B42) and ClimateForecast System Reanalysis (CFSR) are also acknowledged.
References
Bayabil, H. K., Tilahun, S. A., Collick, A. S., Yitaferu, B., and Steenhuis, T. S.: Are runoff pro-25
cesses ecologically or topographically driven in the (sub) humid Ethiopian highlands? Thecase of the Maybar watershed, Ecohydrology, 3, 457–466, 2010.
2096

HESSD12, 2081–2112, 2015
Comparing TRMM3B42, CFSR and
ground-based rainfall
A. W. Worqlul et al.
Title Page
Abstract Introduction
Conclusions References
Tables Figures
J I
J I
Back Close
Full Screen / Esc
Printer-friendly Version
Interactive Discussion
Discussion
Paper
|D
iscussionP
aper|
Discussion
Paper
|D
iscussionP
aper|
Bitew, M. M., Gebremichael, M., Ghebremichael, L. T., and Bayissa, Y. A.: Evaluation of high-resolution satellite rainfall products through streamflow simulation in a hydrological modelingof a small mountainous watershed in Ethiopia, J. Hydrometeorol., 13, 338–350, 2012.
Collischonn, B., Collischonn, W., and Tucci, C. E. M.: Daily hydrological modeling in the Amazonbasin using TRMM rainfall estimates, J. Hydrol., 360, 207–216, 2008.5
Conway, D.: The climate and hydrology of the Upper Blue Nile River, Geogr. J., 166, 49–62,2000.
Dinku, T., Chidzambwa, S., Ceccato, P., Connor, S., and Ropelewski, C.: Validation of high-resolution satellite rainfall products over complex terrain, Int. J. Remote Sens., 29, 4097–4110, 2008.10
Douglas-Mankin, K., Srinivasan, R., and Arnold, J.: Soil and Water Assessment Tool (SWAT)model: current developments and applications, T. ASABE, 53, 1423–1431, 2010.
Duan, Q., Sorooshian, S., and Gupta, V.: Effective and efficient global optimization for concep-tual rainfall–runoff models, Water Resour. Res., 28, 1015–1031, 1992.
Fuka, D. R., Walter, M. T., MacAlister, C., Degaetano, A. T., Steenhuis, T. S., and Easton, Z. M.:15
Using the Climate Forecast System Reanalysis as weather input data for watershed models,Hydrol. Process., 28, 5613–5623, doi:10.1002/hyp.10073, 2014
Gupta, H. V., Sorooshian, S., and Yapo, P. O.: Status of automatic calibration for hydrologicmodels: comparison with multilevel expert calibration, J. Hydrol. Eng., 4, 135–143, 1999.
Haile, A. T., Habib, E., Elsaadani, M., and Rientjes, T.: Inter-comparison of satellite rainfall20
products for representing rainfall diurnal cycle over the Nile basin, Int. J. Appl. Earth Obs.,21, 230–240, 2013.
Hong, Y., Adler, R. F., Negri, A., and Huffman, G. J.: Flood and landslide applications of nearreal-time satellite rainfall products, Nat. Hazards, 43, 285–294, 2007.
Jarvis, A., Reuter, H. I., Nelson, A., and Guevara, E.: Hole-Filled Seamless SRTM Data V4, In-25
ternational Centre for Tropical Agriculture (CIAT), available at: http://srtm.csi.cgiar.org, 2008.Javanmard, S., Yatagai, A., Nodzu, M. I., BodaghJamali, J., and Kawamoto, H.: Comparing
high-resolution gridded precipitation data with satellite rainfall estimates of TRMM_3B42 overIran, Adv. Geosci., 25, 119–125, doi:10.5194/adgeo-25-119-2010, 2010.
Kebede, S., Travi, Y., Alemayehu, T., and Marc, V.: Water balance of Lake Tana and its sensitivity30
to fluctuations in rainfall, Blue Nile basin, Ethiopia, J. Hydrol., 316, 233–247, 2006.Lindström, G., Johansson, B., Persson, M., Gardelin, M., and Bergström, S.: Development and
test of the distributed HBV-96 hydrological model, J. Hydrol., 201, 272–288, 1997.
2097

HESSD12, 2081–2112, 2015
Comparing TRMM3B42, CFSR and
ground-based rainfall
A. W. Worqlul et al.
Title Page
Abstract Introduction
Conclusions References
Tables Figures
J I
J I
Back Close
Full Screen / Esc
Printer-friendly Version
Interactive Discussion
Discussion
Paper
|D
iscussionP
aper|
Discussion
Paper
|D
iscussionP
aper|
Moriasi, D., Arnold, J., Van Liew, M., Bingner, R., Harmel, R., and Veith, T.: Model evaluationguidelines for systematic quantification of accuracy in watershed simulations, T. ASABE, 50,885–900, 2007.
Nash, J. and Sutcliffe, J.: River flow forecasting through conceptual models: Part I – a discussionof principles, J. Hydrol., 10, 282–290, 1970.5
Ouma, Y. O., Owiti, T., Kipkorir, E., Kibiiy, J., and Tateishi, R.: Multitemporal comparative analy-sis of TRMM-3B42 satellite-estimated rainfall with surface gauge data at basin scales: daily,decadal and monthly evaluations, Int. J. Remote Sens., 33, 7662–7684, 2012.
Saha, S., Moorthi, S., Pan, H.-L., Wu, X., Wang, J., Nadiga, S., Tripp, P., Kistler, R., Woollen, J.,and Behringer, D.: The NCEP climate forecast system reanalysis, B. Am. Meteorol. Soc., 91,10
1015–1057, 2010.Sharma, S., Isik, S., Srivastava, P., and Kalin, L.: Deriving spatially distributed precipitation
data using the artificial neural network and multilinear regression models, J. Hydrol. Eng.,18, 194–205, 2012.
SMHI: Integrated Hydrological Modelling System (IHMS), Manual Version 5.10, Swedish Mete-15
orological and Hydrological Institute, Norrkoping, Sweden, 2006.Steenhuis, T. S., Collick, A. S., Easton, Z. M., Leggesse, E. S., Bayabil, H. K., White, E. D.,
Awulachew, S. B., Adgo, E., and Ahmed, A. A.: Predicting discharge and sediment for theAbay (Blue Nile) with a simple model, Hydrol. Process., 23, 3728–3737, 2009.
Steenhuis, T. S., Tilahun, S. A., Elkamil, M., Atanaw, F., Worqlul, A., Ayana, E. K., Abiy, A. Z.,20
Mulukken, M., Tesemma, Z. K., and Mohamad, Y. A.: Simulating discharge and sedimentconcentrations in the increasingly degrading Blue Nile Basin, in: Proceedings conferenceon science and technology towards the Development of East Africa, Bahir Dar UniversityInstitute of Technology, 17 and 18 May 2013, 291–299, 2013.
Tarekegn, D. and Tadege, A.: Assessing the Impact of Climate Change on the Water Resources25
of the Lake Tana Sub-Basin Using the WATBAL Model, CEEPA, University of Pretoria, Pre-toria, 2006.
Taye, M. T. and Willems, P.: Temporal variability of hydroclimatic extremes in the Blue Nile basin,Water Resour. Res., 48, W03513, doi:10.1029/2011WR011466, 2012.
Tesemma, Z. K., Mohamed, Y. A., and Steenhuis, T. S.: Trends in rainfall and runoff in the Blue30
Nile Basin: 1964–2003, Hydrol. Process., 24, 3747–3758, 2010.Thornthwaite, C. and Mather, J.: The water balance, in: Publications in Climatology, Drexel
Institute of Technology, Centerton, 104 pp., Vol. 8, No. 1, 1955.
2098

HESSD12, 2081–2112, 2015
Comparing TRMM3B42, CFSR and
ground-based rainfall
A. W. Worqlul et al.
Title Page
Abstract Introduction
Conclusions References
Tables Figures
J I
J I
Back Close
Full Screen / Esc
Printer-friendly Version
Interactive Discussion
Discussion
Paper
|D
iscussionP
aper|
Discussion
Paper
|D
iscussionP
aper|
Tilahun, S. A., Guzman, C. D., Zegeye, A. D., Engda, T. A., Collick, A. S., Rimmer, A., andSteenhuis, T. S.: An efficient semi-distributed hillslope erosion model for the subhumidEthiopian Highlands, Hydrol. Earth Syst. Sci., 17, 1051–1063, doi:10.5194/hess-17-1051-2013, 2013a.
Tilahun, S., Mukundan, R., Demisse, B., Engda, T., Guzman, C., Tarakegn, B., Easton, Z.,5
Collick, A., Zegeye, A., and Schneiderman, E.: Asaturation excess erosion model, Trans.Am. Soc. Agr. Biol. Eng., 56, 681–695, doi:10.13031/2013.42675, 2013b.
Wale, A., Rientjes, T., Gieske, A., and Getachew, H.: Ungauged catchment contributions toLake Tana’s water balance, Hydrol. Process., 23, 3682–3693, 2009.
Wang, W., Xie, P., Yoo, S.-H., Xue, Y., Kumar, A., and Wu, X.: An assessment of the surface cli-10
mate in the NCEP climate forecast system reanalysis, Clim. Dynam., 37, 1601–1620, 2011.Whittaker, G., Confesor, R., Di Luzio, M., and Arnold, J.: Detection of overparameterization and
overfitting in an automatic calibration of SWAT, T. ASABE, 53, 1487–1499, 2010.Worqlul, A. W., Maathuis, B., Adem, A. A., Demissie, S. S., Langan, S., and Steenhuis, T. S.:
Comparison of rainfall estimations by TRMM 3B42, MPEG and CFSR with ground-observed15
data for the Lake Tana basin in Ethiopia, Hydrol. Earth Syst. Sci., 18, 4871–4881,doi:10.5194/hess-18-4871-2014, 2014.
Yilmaz, K. K., Hogue, T. S., Hsu, K.-l., Sorooshian, S., Gupta, H. V., and Wagener, T.: Inter-comparison of rain gauge, radar, and satellite-based precipitation estimates with emphasison hydrologic forecasting, J. Hydrometeorol., 6, 497–517, 2005.20
2099

HESSD12, 2081–2112, 2015
Comparing TRMM3B42, CFSR and
ground-based rainfall
A. W. Worqlul et al.
Title Page
Abstract Introduction
Conclusions References
Tables Figures
J I
J I
Back Close
Full Screen / Esc
Printer-friendly Version
Interactive Discussion
Discussion
Paper
|D
iscussionP
aper|
Discussion
Paper
|D
iscussionP
aper|
Table 1. Coefficient of Determination (R2) areal gauged and satellite rainfall estimates for GilgelAbay and Main Beles basins.
Main Beles Gilgel Abay
Basin TRMM CFSR Gauged Basin TRMM CFSR Gauged
Main Beles TRMM 1.00 Gilgel Abay TRMM 1.00CFSR 0.09 1.00 CFSR 0.24 1.00Gauged 0.12 0.90 1.00 Gauged 0.35 0.92 1.00
Gilgel Abay TRMM 0.90 Main Beles TRMM 0.90CFSR 0.98 CFSR 0.98Gauged 0.98 Gauged 0.98
2100
HESSD12, 2081–2112, 2015
Comparing TRMM3B42, CFSR and
ground-based rainfall
A. W. Worqlul et al.
Title Page
Abstract Introduction
Conclusions References
Tables Figures
J I
J I
Back Close
Full Screen / Esc
Printer-friendly Version
Interactive Discussion
Discussion
Paper
|D
iscussionP
aper|
Discussion
Paper
|D
iscussionP
aper|
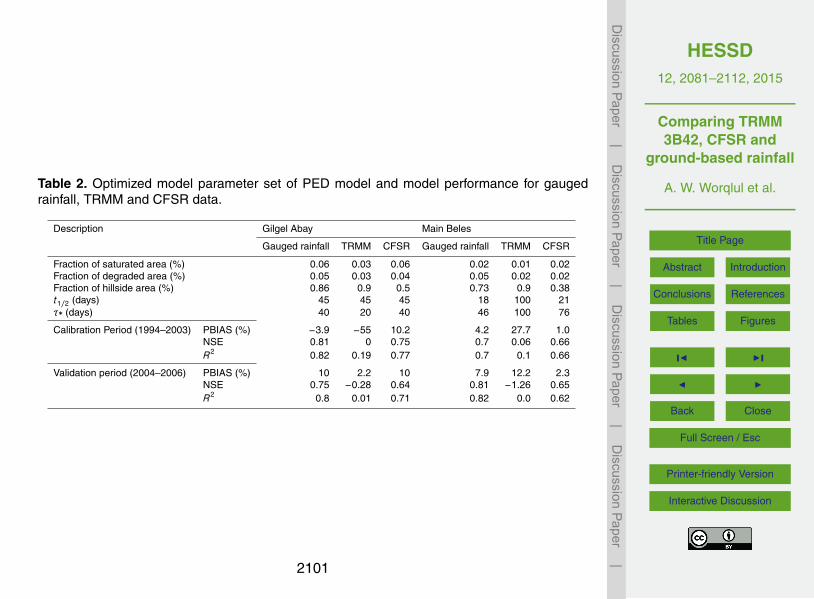
Table 2. Optimized model parameter set of PED model and model performance for gaugedrainfall, TRMM and CFSR data.
Description Gilgel Abay Main Beles
Gauged rainfall TRMM CFSR Gauged rainfall TRMM CFSR
Fraction of saturated area (%) 0.06 0.03 0.06 0.02 0.01 0.02Fraction of degraded area (%) 0.05 0.03 0.04 0.05 0.02 0.02Fraction of hillside area (%) 0.86 0.9 0.5 0.73 0.9 0.38t1/2 (days) 45 45 45 18 100 21τ∗ (days) 40 20 40 46 100 76
Calibration Period (1994–2003) PBIAS (%) −3.9 −55 10.2 4.2 27.7 1.0NSE 0.81 0 0.75 0.7 0.06 0.66R2 0.82 0.19 0.77 0.7 0.1 0.66
Validation period (2004–2006) PBIAS (%) 10 2.2 10 7.9 12.2 2.3NSE 0.75 −0.28 0.64 0.81 −1.26 0.65R2 0.8 0.01 0.71 0.82 0.0 0.62
2101

HESSD12, 2081–2112, 2015
Comparing TRMM3B42, CFSR and
ground-based rainfall
A. W. Worqlul et al.
Title Page
Abstract Introduction
Conclusions References
Tables Figures
J I
J I
Back Close
Full Screen / Esc
Printer-friendly Version
Interactive Discussion
Discussion
Paper
|D
iscussionP
aper|
Discussion
Paper
|D
iscussionP
aper|
Table 3. Optimized model parameter set of HBV model and its performance for gauged rainfall,TRMM and CFSR data.
Description Gilgel Abay Main Beles
Gauged rainfall TRMM CFSR Gauged rainfall TRMM CFSR
Alpha 0.4 1 0.5 0.8 0.6 0.6Beta 0.8 1.0 1.0 1.0 2.0 1.0FC 245 100 1480 800 300 1400LP 0.99 0.99 0.99 0.7 0.82 0.95PERC 1.3 0.54 0.08 0.4 0.4 0.4K4 0.04 0.02 0.05 0.002 0.002 0.03Khq 0.13 0.05 0.11 0.09 0.2 0.07
Calibration Period (1994–2003) PBIAS (%) 4.24 46 2.81 2.6 37 0.41NSE 0.81 −0.16 0.72 0.65 0.00 0.63R2 0.82 0.25 0.73 0.63 0.06 0.61
Validation period (2004–2006) PBIAS (%) −6.2 6.8 −4.8 1.64 44.2 5.0NSE 0.79 0.06 0.62 0.64 −0.11 0.63R2 0.83 0.07 0.68 0.67 0.00 0.66
2102
HESSD12, 2081–2112, 2015
Comparing TRMM3B42, CFSR and
ground-based rainfall
A. W. Worqlul et al.
Title Page
Abstract Introduction
Conclusions References
Tables Figures
J I
J I
Back Close
Full Screen / Esc
Printer-friendly Version
Interactive Discussion
Discussion
Paper
|D
iscussionP
aper|
Discussion
Paper
|D
iscussionP
aper|
Figure 1. Drainage Pattern and meteorological station network of the Gilgel Abay and MainBeles basins.
2103
HESSD12, 2081–2112, 2015
Comparing TRMM3B42, CFSR and
ground-based rainfall
A. W. Worqlul et al.
Title Page
Abstract Introduction
Conclusions References
Tables Figures
J I
J I
Back Close
Full Screen / Esc
Printer-friendly Version
Interactive Discussion
Discussion
Paper
|D
iscussionP
aper|
Discussion
Paper
|D
iscussionP
aper|
Figure 2. Thiessen Polygon map of the ground based rainfall stations in the Gilgel Abay andMain Beles basins.
2104
HESSD12, 2081–2112, 2015
Comparing TRMM3B42, CFSR and
ground-based rainfall
A. W. Worqlul et al.
Title Page
Abstract Introduction
Conclusions References
Tables Figures
J I
J I
Back Close
Full Screen / Esc
Printer-friendly Version
Interactive Discussion
Discussion
Paper
|D
iscussionP
aper|
Discussion
Paper
|D
iscussionP
aper|
Figure 3. Satellite rainfall observation grid of (a) TRMM and (b) CFSR for Gilgel Abay and MainBeles basins. Grid size is approximately 27 and 38 km for TRMM and CFSR, respectively.
2105

HESSD12, 2081–2112, 2015
Comparing TRMM3B42, CFSR and
ground-based rainfall
A. W. Worqlul et al.
Title Page
Abstract Introduction
Conclusions References
Tables Figures
J I
J I
Back Close
Full Screen / Esc
Printer-friendly Version
Interactive Discussion
Discussion
Paper
|D
iscussionP
aper|
Discussion
Paper
|D
iscussionP
aper|
Figure 4. Long-term monthly average areal rainfall of gauged rainfall, CFSR data (1994–2003)and TRMM (1998–2003) for Gilgel Abay and Main Beles basins.
2106

HESSD12, 2081–2112, 2015
Comparing TRMM3B42, CFSR and
ground-based rainfall
A. W. Worqlul et al.
Title Page
Abstract Introduction
Conclusions References
Tables Figures
J I
J I
Back Close
Full Screen / Esc
Printer-friendly Version
Interactive Discussion
Discussion
Paper
|D
iscussionP
aper|
Discussion
Paper
|D
iscussionP
aper|
Figure 5. Simulated flow of PED model by gauged rainfall, TRMM and CFSR data plotted withobserved flow for Gilgel Abay basin.
2107

HESSD12, 2081–2112, 2015
Comparing TRMM3B42, CFSR and
ground-based rainfall
A. W. Worqlul et al.
Title Page
Abstract Introduction
Conclusions References
Tables Figures
J I
J I
Back Close
Full Screen / Esc
Printer-friendly Version
Interactive Discussion
Discussion
Paper
|D
iscussionP
aper|
Discussion
Paper
|D
iscussionP
aper|
Figure 6. Comparison of long-term average monthly Gilgel Abay observed flow and PED sim-ulation for gauged rainfall, CFSR (1994–2003) and TRMM rainfall estimate (1998–2003).
2108

HESSD12, 2081–2112, 2015
Comparing TRMM3B42, CFSR and
ground-based rainfall
A. W. Worqlul et al.
Title Page
Abstract Introduction
Conclusions References
Tables Figures
J I
J I
Back Close
Full Screen / Esc
Printer-friendly Version
Interactive Discussion
Discussion
Paper
|D
iscussionP
aper|
Discussion
Paper
|D
iscussionP
aper|
Figure 7. Correlation between observed flow and simulated flow for the calibration period using(a) gauged rainfall, (b) CFSR data and (c) TRMM data for the Gilgel Abay Basin using PEDmodel.
2109

HESSD12, 2081–2112, 2015
Comparing TRMM3B42, CFSR and
ground-based rainfall
A. W. Worqlul et al.
Title Page
Abstract Introduction
Conclusions References
Tables Figures
J I
J I
Back Close
Full Screen / Esc
Printer-friendly Version
Interactive Discussion
Discussion
Paper
|D
iscussionP
aper|
Discussion
Paper
|D
iscussionP
aper|
Figure 8. Simulated flow of HBV model by gauged rainfall, TRMM and CFSR data plotted withobserved flow for Gilgel Abay basin (1994–2003).
2110

HESSD12, 2081–2112, 2015
Comparing TRMM3B42, CFSR and
ground-based rainfall
A. W. Worqlul et al.
Title Page
Abstract Introduction
Conclusions References
Tables Figures
J I
J I
Back Close
Full Screen / Esc
Printer-friendly Version
Interactive Discussion
Discussion
Paper
|D
iscussionP
aper|
Discussion
Paper
|D
iscussionP
aper|
Figure 9. Comparison of long-term average monthly observed flow and HBV simulation forgauged rainfall, TRMM and CFSR rainfall estimate of (a) Gilgel Abay and (b) Main Beles basins.
2111

HESSD12, 2081–2112, 2015
Comparing TRMM3B42, CFSR and
ground-based rainfall
A. W. Worqlul et al.
Title Page
Abstract Introduction
Conclusions References
Tables Figures
J I
J I
Back Close
Full Screen / Esc
Printer-friendly Version
Interactive Discussion
Discussion
Paper
|D
iscussionP
aper|
Discussion
Paper
|D
iscussionP
aper|
Figure 10. Correlation between observed flow and simulated flow for the calibration periodusing (a) gauged rainfall, (b) CFSR data and (c) TRMM data for the Gilgel Abay Basin usingHBV model.
2112