comparing working memory in deaf and hearing children · anna jones, chloe marshall, nicola...
TRANSCRIPT
Executive Function and Language in Deaf and Hearing Children
Anna Jones, Chloe Marshall, Nicola Botting, Gary Morgan
BPS Developmental Section Conference, Amsterdam, Sep 2014
1

Executive Functioning
Executive functioning (EF) refers to high-level goal-directed behaviour, which encompasses skills in strategic planning, flexibility of thought and action (switching), inhibition of inappropriate responses, generation of new responses (fluency), and concurrent remembering and processing (working memory)
2

EF and Language
• Use of “self- talk” to guide and plan behaviour
• Vocabulary predicts preschoolers' EF
• Children with SLI and ASD have EF difficulties
3

EF in deaf children
• Greater impulsiveness, distractibility and memory problems
• Language delay or auditory deprivation?
• Hintermair (2013): parental ratings on the BRIEF
• Correlations between deaf children’s EF and vocabulary (Figureas, Edwards & Langdon, 2008)
4
Aims
• Test large sample deaf children (BSL, SSE, oral) (N = 108)
• Non-verbal EF tasks
• Language measures suitable deaf and hearing populations
• Follow up after two years
5

Non-verbal EF tasks
6 Working memory
Planning Inhibition
Switching

Executive loaded working-memory
• Which shape is the odd-one-out?
Odd one out task (Henry, 2001)

8
• Now point to where that shape appeared on the grid
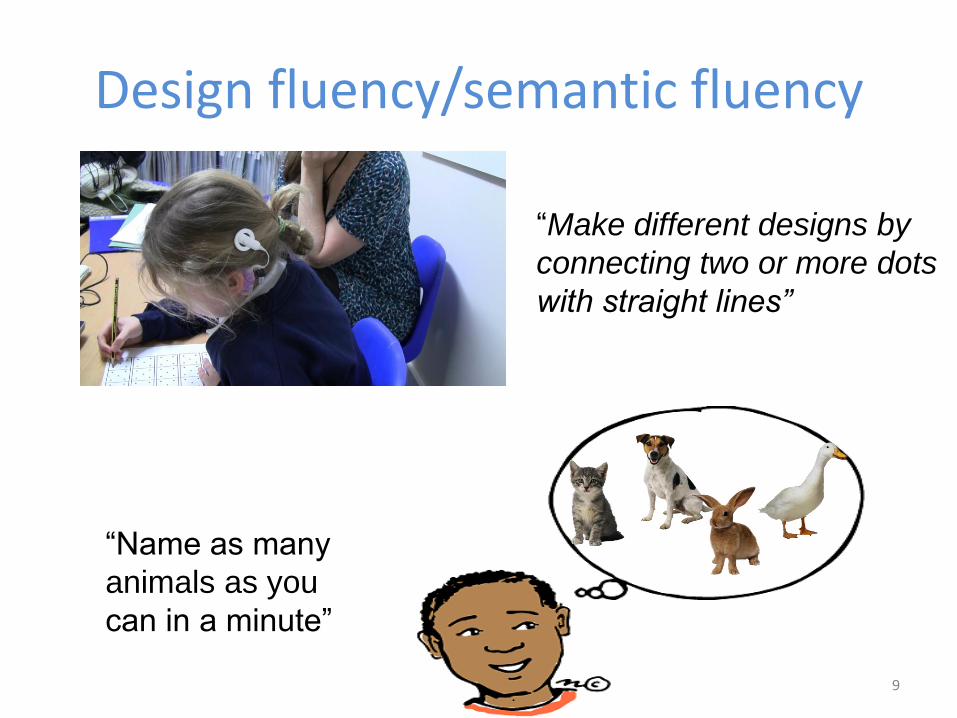
Design fluency/semantic fluency
9
“Name as many
animals as you
can in a minute”
“Make different designs by
connecting two or more dots
with straight lines”

Children with poor EF
• Poor organizational strategies and planning strategies (tower)
• Rule violations (tower, colour trails, pictures tests)
• Poor word list generation (semantic fluency)
10

Other measures
Language
• Vocabulary measure- expressive one word picture vocabulary test
• Narrative BSL test of production (Herman et al., 2004): spider story
Non language measures
• Symbol search- processing speed
• Non verbal ability-Matrix reasoning
11
Research hypotheses
• Hypothesis one: Deaf children will have difficulties on at least some of the EF tasks in comparison to hearing children
• Hypothesis two: There will be a relationship between language and deaf children’s performance on some of the EF tasks
12
EF and language in deaf children
• Preliminary findings at Time 1
13
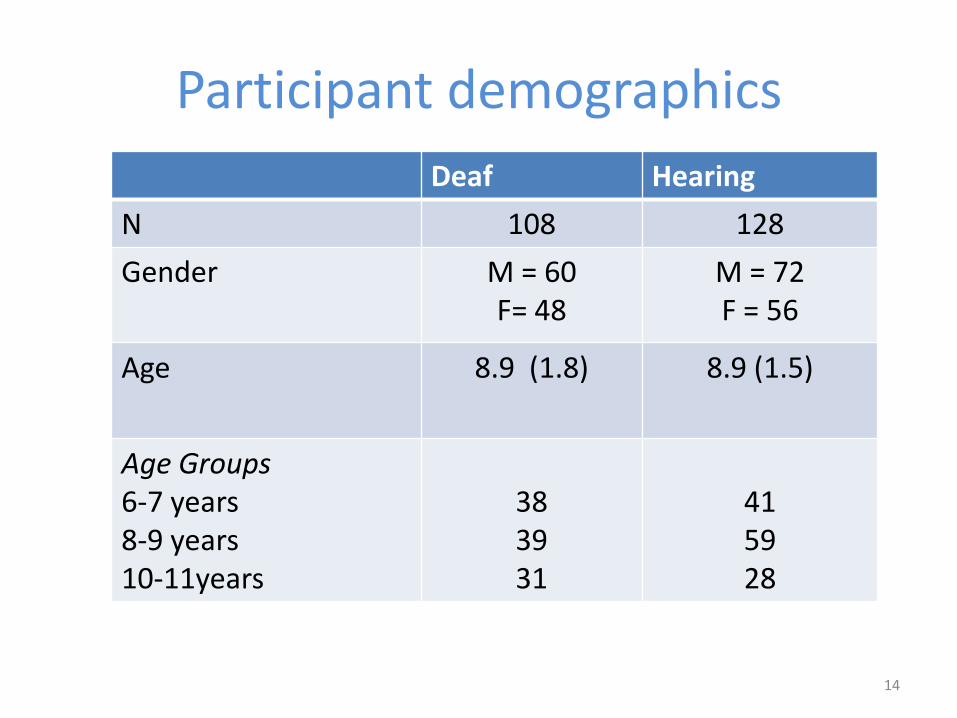
Participant demographics
14
Deaf Hearing
N 108 128
Gender M = 60 F= 48
M = 72 F = 56
Age 8.9 (1.8) 8.9 (1.5)
Age Groups 6-7 years 8-9 years 10-11years
38 39 31
41 59 28
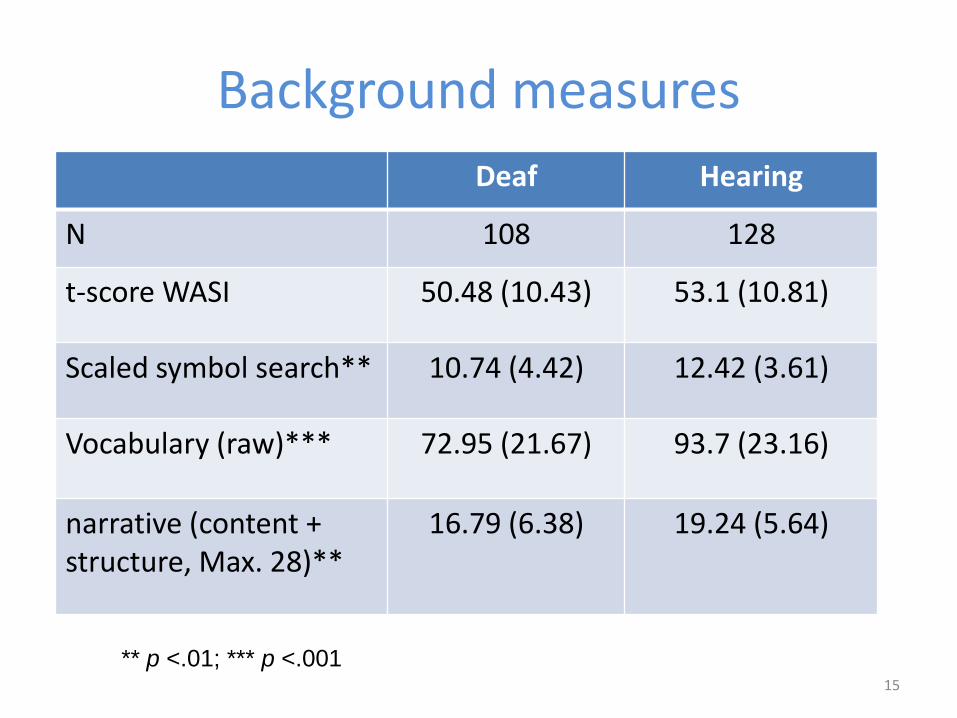
Background measures
15
Deaf Hearing
N 108 128
t-score WASI 50.48 (10.43) 53.1 (10.81)
Scaled symbol search** 10.74 (4.42) 12.42 (3.61)
Vocabulary (raw)*** 72.95 (21.67) 93.7 (23.16)
narrative (content + structure, Max. 28)**
16.79 (6.38) 19.24 (5.64)
** p <.01; *** p <.001

BRIEF
16
20
25
30
35
40
45
50
55
60
65
Behavioural regulation
Metacognition Global
Deaf
Hearing
** ** **
**p <.01
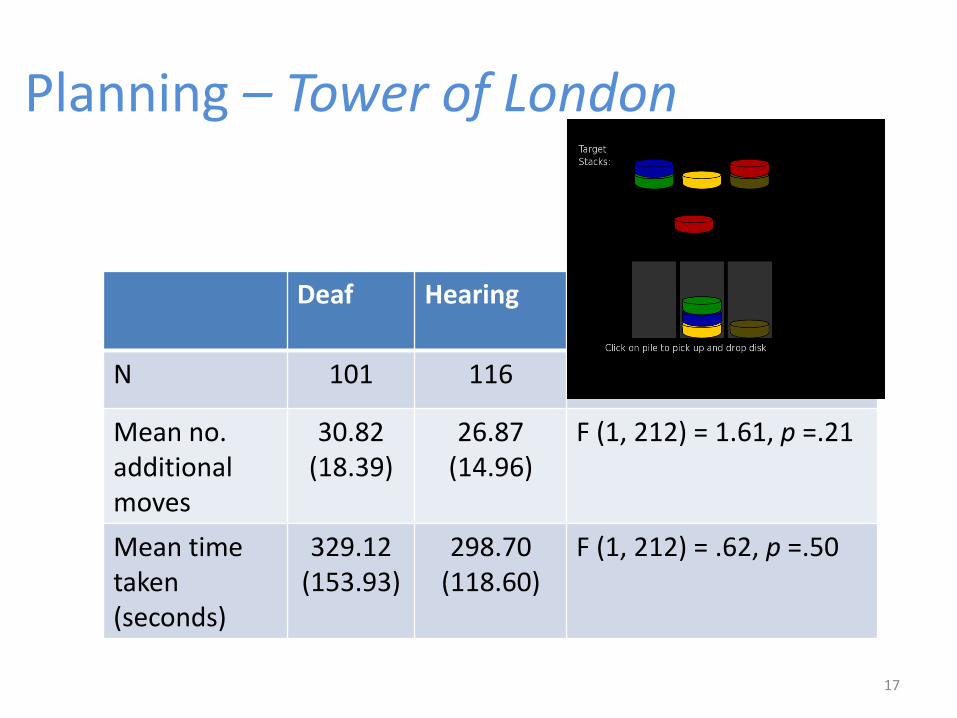
Planning – Tower of London
17
Deaf
Hearing
N 101 116
Mean no. additional moves
30.82 (18.39)
26.87 (14.96)
F (1, 212) = 1.61, p =.21
Mean time taken (seconds)
329.12 (153.93)
298.70 (118.60)
F (1, 212) = .62, p =.50

Inhibition - sun apple
**p <.01 30
40
50
60
70
80
90
100
congruent incongruent
Pe
rce
nta
ge a
ccu
racy
deaf
hearing
**
**
F ( 1,198) = 6.58, MSE = 241.71, p = .01
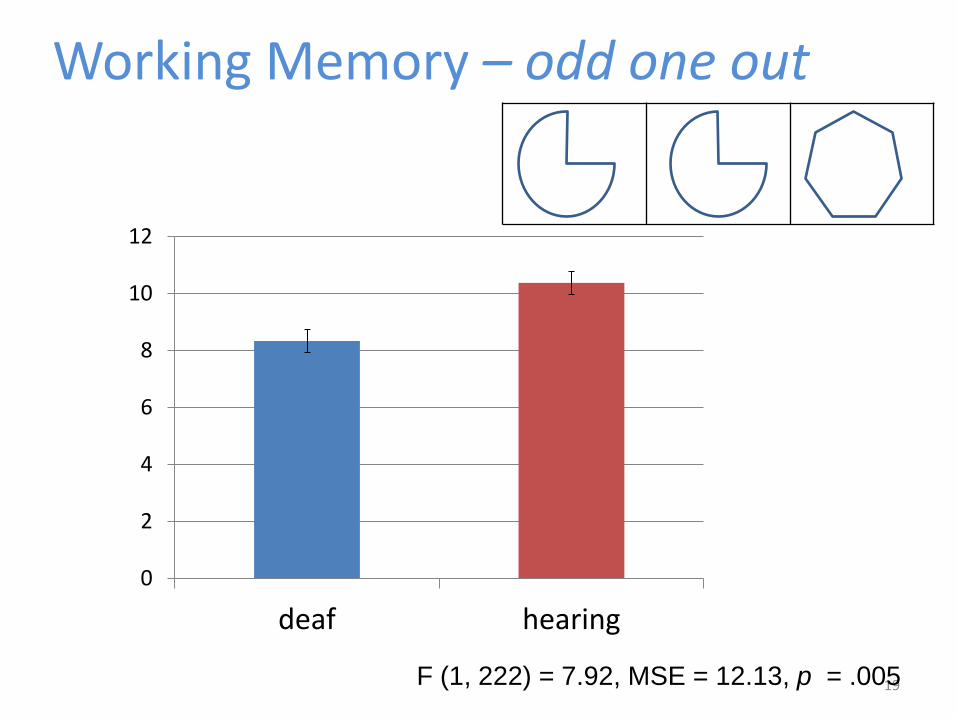
Working Memory – odd one out
19
0
2
4
6
8
10
12
deaf hearing
F (1, 222) = 7.92, MSE = 12.13, p = .005

Working Memory – Corsi block
20
0
1
2
3
4
5
6
7
Deaf Hearing
F (1,222) = 8.74, MSE = 2.75, p = .003
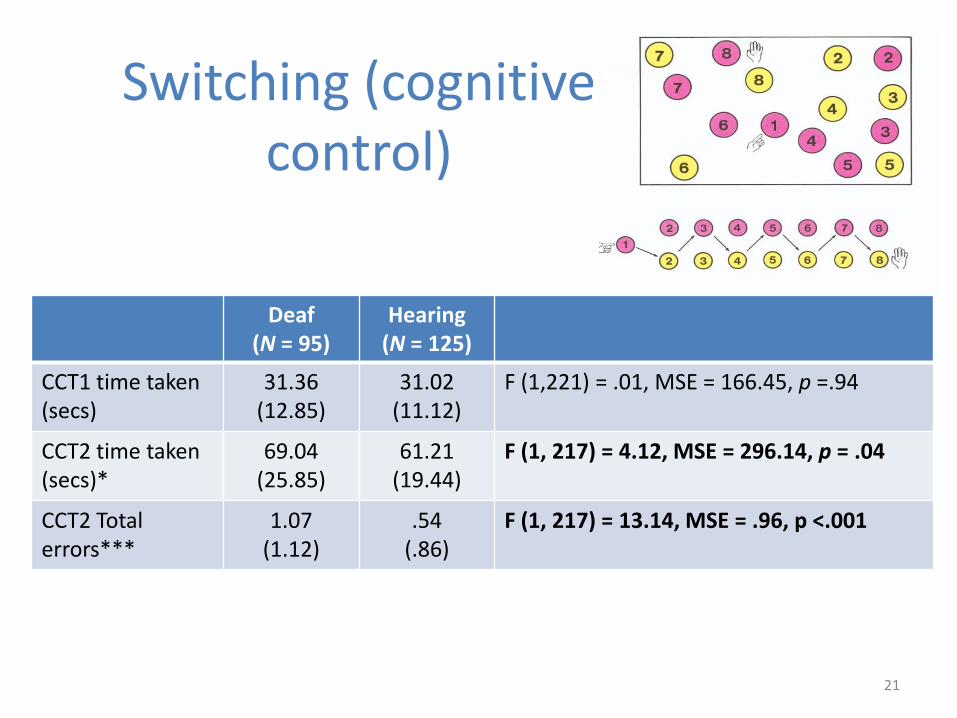
Switching (cognitive control)
21
Deaf (N = 95)
Hearing (N = 125)
CCT1 time taken (secs)
31.36 (12.85)
31.02 (11.12)
F (1,221) = .01, MSE = 166.45, p =.94
CCT2 time taken (secs)*
69.04 (25.85)
61.21 (19.44)
F (1, 217) = 4.12, MSE = 296.14, p = .04
CCT2 Total errors***
1.07 (1.12)
.54 (.86)
F (1, 217) = 13.14, MSE = .96, p <.001

Design fluency
22
Deaf (N = 103)
Hearing (N = 125)
Total designs (scaled score)
8.93 (3.1) 9.49 (3.4) F (1,224) = .01, MSE = 8.98, p =.92
Design repetitions*
2.41 (3.21) 1.49 (2.22) F (1, 222) = 4.98, MSE = 7.08, p = .03

Semantic fluency
23
Deaf (N = 102)
Hearing (N = 125)
Total*** 14.06 (5.16) 17.66 (6.07) F (1, 222) = 15.33, MSE = 22.41, p <.001
Repetitions .56 (1.14) .34 (.65) F (1. 222) = 2.82, MSE = .83, p = .10
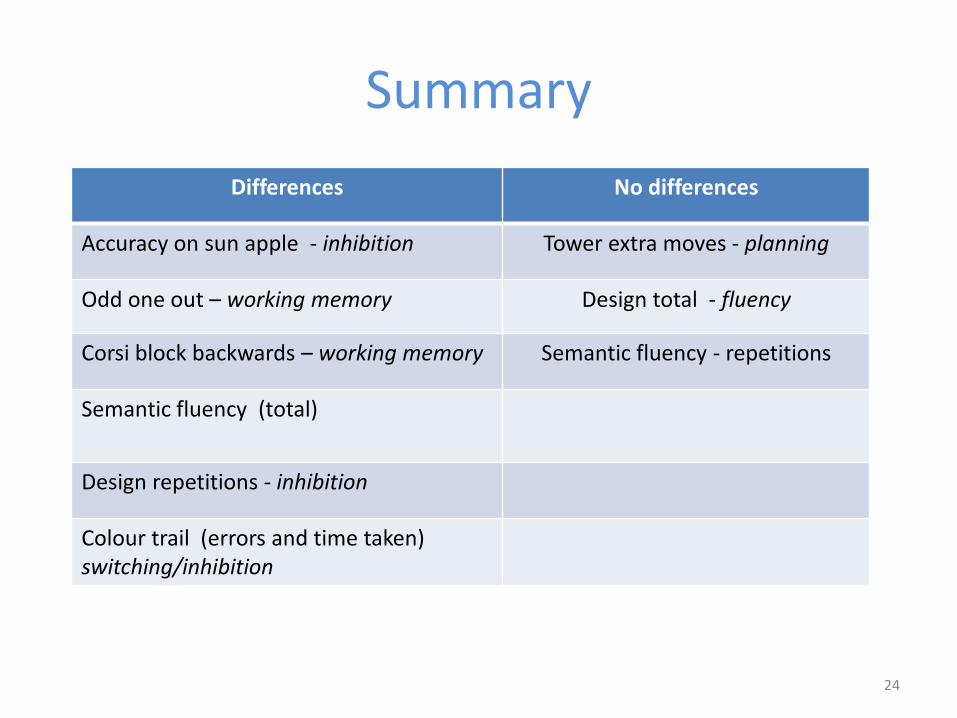
Summary
Differences No differences
Accuracy on sun apple - inhibition Tower extra moves - planning
Odd one out – working memory Design total - fluency
Corsi block backwards – working memory Semantic fluency - repetitions
Semantic fluency (total)
Design repetitions - inhibition
Colour trail (errors and time taken) switching/inhibition
24

EFs and Language
• Multiple linear regressions
• Vocabulary predicted:
WM odd-one-out (β = .22 , p =.2 )
corsi bkwds (β = .28, p =.005)
Semantic fluency (β = .47, p <.001)
• Narrative predicted:
Design repetitions (β = -.26, p=.04) 25

Summary
• Differences between deaf and hearing for some but not all EF tasks
• Vocabulary predicts working memory and semantic fluency in deaf children
• Further analysis communication, hearing amplification etc. background needed
• Language measures still being developed
• TIME 2: Executive Function Language
26

• Thanks to the research team at DCAL:
Gary Morgan
Chloe Marshall
Nicola Botting
Jo Atkinson
Kathryn Mason
27