comparison and integration of meg and fmri
TRANSCRIPT

Helsinki Medical Imaging Center and BioMag Laboratory Helsinki University Central Hospital
Finland
Comparison and integration of MEG and fMRI in the study of somatosensory and motor systems
Antti Korvenoja
Academic Dissertation
To be publicly discussed with permission of the Faculty of Medicine of the University of Helsinki
in Lecture Hall 2 of the Helsinki University Central Hospital, Haartmaninkatu 4, on January 26, 2007, at noon.
Helsinki 2007

Supervised by:
Professor Hannu J. Aronen University of Turku, Department of Radiology and Functional Brain Imaging Unit, Helsinki Medical Imaging Center, Helsinki University Central Hospital and Centre of Military Medicine, Finnish Defence Forces, Finland
Docent Juha Huttunen BioMag Laboratory, Helsinki University Central Hospital, Finland
Professor Risto J. Ilmoniemi Laboratory of Biomedical Engineering, Helsinki University of Technology, Finland
Reviewed by:
Professor Iiro Jääskeläinen Laboratory of Computational Engineering, Helsinki University of Technology, Finland
Professor Risto A. Kauppinen School of Sport and Exercise Sciences, University of Birmingham, United Kingdom
Official opponent:
Professor Paolo M. Rossini Departments of Clinical Neuroscience & Neurology, Ospedale Fatebenefratelli, Isola Tiberina, University Campus Bio-Medico, Rome, Italy
ISBN 952-92-1471-5 (paperback) ISBN 952-10-3621-4 (PDF)
Printed in Helsinki University Printing House, Helsinki 2007
Contents
Abstract .............................................................................................................................................................. i
Abbreviations .................................................................................................................................................. iii
List of original publications........................................................................................................................... iv
1. Introduction................................................................................................................................................1
2. Review of the literature...........................................................................................................................3 2.1. Somatosensory and motor systems .......................................................................................3 2.1.1. Somatosensory system .....................................................................................................3 2.1.2. Motor system..................................................................................................................10 2.2. Magnetoencephalography ...................................................................................................13 2.2.1. Generation of neuromagnetic activity ............................................................................13 2.2.2. Measurement of MEG....................................................................................................15 2.2.3. Source estimation ...........................................................................................................16 2.3. Functional magnetic resonance imaging.............................................................................18 2.3.1. Principles of magnetic resonance imaging .....................................................................18 2.3.2. Neurovascular coupling..................................................................................................20 2.3.3. MRI contrast mechanisms for detection of brain activation...........................................26 2.3.4. Data analysis ..................................................................................................................27 2.4. Comparison and integration of MEG and fMRI .................................................................29 2.4.1. Spatial and temporal resolution......................................................................................29 2.4.2. Spatial correspondence...................................................................................................31 2.4.3. Approaches to combine information from MEG and fMRI ...........................................31 2.5. fMRI and MEG in surgical planning for operations near SMI ..........................................33
3. Aims............................................................................................................................................................36
4. Methods.....................................................................................................................................................37 4.1. Subjects ...............................................................................................................................37 4.2. MEG acquisition and analysis.............................................................................................37 4.2.1. Data acquisition and experimental setup........................................................................37 4.2.2. MEG data analysis..........................................................................................................38 4.3. MRI acquisition and analysis..............................................................................................38 4.3.1. Image acquisition and experimental setup .....................................................................38 4.3.2. Functional MRI data analysis.........................................................................................39 4.4. Intraoperative cortical mapping ..........................................................................................43 4.5. Comparison and integration of MEG and MRI data...........................................................44

4.5.1. Co-registration of the functional imaging results to structural MRIs.............................44 4.5.2. Comparison of the spatial agreement between fMRI and MEG ....................................45 4.5.3. Construction of spatiotemporal model of somatosensory evoked responses .................46
5. Results and discussion............................................................................................................................47 5.1. Neuronal generators of median nerve SEFs (Studies I, II) ................................................47 5.1.1. Results ............................................................................................................................47 5.1.2. Discussion ......................................................................................................................48 5.2. Somatosensory evoked activation localization with fMRI and MEG (Study II) ...............49 5.2.1. Results ............................................................................................................................49 5.2.2. Discussion ......................................................................................................................49 5.3. Sequence of activation during somatosensory stimulus processing (Studies I, II) ............50 5.3.1. Results ............................................................................................................................50 5.3.2. Discussion ......................................................................................................................51 5.4. The effect of the use of neighbourhood information on reproducibility in fMRI
(Study III)............................................................................................................................52 5.4.1. Results ............................................................................................................................52 5.4.2. Discussion ......................................................................................................................54 5.5. Localization of SMI for neurosurgical planning with MEG and fMRI (Study IV) ...........55 5.5.1. Results ............................................................................................................................55 5.5.2. Discussion ......................................................................................................................55
6. Conclusions ..............................................................................................................................................59
7. Acknowledgements.................................................................................................................................62
8. References.................................................................................................................................................65

i
Abstract
We aimed to compare the spatial convergence of brain activation patterns obtained with two non-invasive functional brain imaging methods, magnetoencephalography (MEG) and functional magnetic resonance imaging (fMRI). MEG measures the electrical activity of the neurons while fMRI measures local hemodynamic changes indirectly reflecting the brain activation. Since MEG directly measures the neuronal events it has greater temporal resolution than fMRI, which has limited temporal resolution mainly due to the larger timescale of the hemodynamic response. On the other hand fMRI has advantages in spatial resolution, while the localization results with MEG can be ambiguous due to the non-uniqueness of the electromagnetic inverse problem. Thus, these methods could provide complementary information and could be used to create both spatially and temporally accurate models of brain function.
We investigated the degree of overlap, revealed by the two imaging methods, in areas involved in sensory or motor processing. Furthermore, we used the spatial information from fMRI to construct a spatiotemporal model of the MEG data in order to investigate the sensorimotor system and to create a spatiotemporal model of its function. We also studied the differences between MEG and fMRI in a clinical setting in order to assess the reliability of these methods in the localization of functionally important areas for neurosurgical planning and risk assessment. We compared the localization results from the MEG and fMRI with invasive cortical mapping by electrical stimulation and cortical evoked somatosensory potential recording performed during operation. We used a recently introduced method for hypothesis testing of fMRI data, contextual clustering, was used instead of simpler methods applied in most of the previous studies assessing the reliability of fMRI in presurgical planning. We also wanted to assess the effect of neighbourhood information use on the reproducibility of fMRI results.
Using MEG, we identified the ipsilateral primary sensorimotor cortex (SMI) as a novel source area contributing to the somatosensory evoked fields (SEF) to median nerve stimulation. Suppression of the responses from the ipsilateral SMI by contralateral hand movements suggests that ipsilateral SMI might be involved in coordination of bimanual movements. Using combined MEG and fMRI measurements we found that two separate areas in the lateral fissure may be the generators for the SEF responses from the secondary somatosensory cortex region. The two imaging methods indicated activation in corresponding locations. Although, in some cases activation was not detected in all areas with either method. By using complementary information from MEG and fMRI

ii
we established a spatiotemporal model of somatosensory cortical processing. This spatiotemporal model of cerebral activity was in good agreement with results from several studies using invasive electrophysiological measurements and with anatomical studies in monkey and man concerning the connections between somatosensory areas. In neurosurgical patients, the MEG dipole model turned out to be more reliable than fMRI in the identification of the central sulcus. This was due to prominent activation in non-primary areas in fMRI, which in some cases led to erroneous or ambiguous localization of the central sulcus.
iii
Abbreviations
AO Anterior operculum BOLD Blood oxygenation level dependent CBF Cerebral blood flow CBV Cerebral blood volume CMRO2 Cerebral metabolic rate of oxygen ECD Equivalent current dipole ECoG Electrocorticography EEG Electroencephalography fMRI Functional magnetic resonance imaging LFP Local field potential MEG Magnetoencephalography MI Primary motor cortex MRI Magnetic resonance imaging MRS Magnetic resonance spectroscopy MUA Multiunit activity NIRS Near infrared spectroscopy OEF Oxygen extraction fraction PO Posterior operculum PoCS Postcentral sulcus PPC Posterior parietal cortex RF Radiofrequency SEF Somatosensory evoked field SEP Somatosensory evoked potential SI Primary somatosensory cortex SII Secondary somatosensory cortex SMA Supplementary motor area SMI Primary sensorimotor cortex SQUID Superconducting quantum interference device TE Echo time TI Inversion time TR Repetition time VPL Ventro-postero-lateral nucleus

iv
List of original publications
This Thesis is based on the following publications. In the text they are referred to by their roman numerals.
I Korvenoja A, Wikström H, Huttunen J, Virtanen J, Laine P, Aronen HJ, Seppäläinen AM, Ilmoniemi RJ. Activation of ipsilateral primary sensorimotor cortex by median nerve stimulation. Neuroreport 1995; 6: 2589–2593.
II Korvenoja A, Huttunen J, Salli E, Pohjonen H, Martinkauppi S, Palva JM, Lauronen L, Virtanen J, Ilmoniemi RJ, Aronen HJ. Activation of multiple cortical areas in response to somatosensory stimulation: combined magnetoencephalographic and functional magnetic resonance imaging. Human Brain Mapping 1999; 8: 13–27.
III Salli E, Korvenoja A, Visa A, Katila T, Aronen HJ. Reproducibility of fMRI: effect of the use of contextual information. Neuroimage 2001; 13: 459–471.
IV Korvenoja A, Kirveskari E, Aronen HJ, Avikainen S, Brander A, Huttunen J, Ilmoniemi RJ, Jääskeläinen JE, Kovala T, Mäkelä JP, Salli E, Seppä M. Sensorimotor cortex localization: comparison of magnetoencephalography, functional MR imaging, and intraoperative cortical mapping. Radiology, 2006; 241: 213–222.
Publications II and III were also included in the Thesis entitled “Contextual detection of fMRI activations and multimodal aspects of brain imaging” by Eero Salli at the Helsinki University of Technology.

1
1. Introduction
During the past two decades advances in imaging technology have provided the opportunity to look into the working human brain non-invasively. The development of multichannel magnetometers, for the measurement of the magnetic fields associated with the electrical activity of neurons, has allowed the observation of brain activity with a great temporal resolution while providing relatively good localization precision (Hämäläinen et al. 1993). Methodological advances in the modelling of the conductor geometry of the head and source estimation algorithms have also made electroencephalography (EEG), a technique published by Hans Berger in 1929 (Millett 2001), a relatively precise tool for functional localization (Michel et al. 2004). The change in activity level of the neurons is reflected in local changes of metabolic rate, as well as in blood flow, volume and oxygenation. Several imaging techniques can be used to measure these changes. The first tomographic images of human brain activation during sensorimotor and cognitive tasks were obtained using single photon emission tomography (Stokely et al. 1980) and positron emission tomography (Petersen et al. 1988). The advent of functional magnetic resonance imaging (fMRI) in the beginning of the 1990’s (Bandettini et al. 1992; Belliveau et al. 1991; Frahm et al. 1992; Kwong et al. 1992; Ogawa et al. 1992) has enabled localization of brain functions with unprecedented spatial resolution without the use of radioactive markers. Recently, a rapidly increasing field of research has been optical imaging of cerebral hemodynamics with near-infrared light (Hoshi and Tamura 1993; Kato et al. 1993; Villringer et al. 1993). Transcranial magnetic stimulation is also an alternative to spatiotemporal mapping of brain function (Barker and Jalinous 1985).
None of the currently available non-invasive neuroimaging tools is, however, able to provide information of brain activity at a high resolution in both the spatial and temporal domain. Electrophysiological techniques, such as magnetoencephalography (MEG), that provide a millisecond temporal resolution, suffer from the inherent properties of the electromagnetic inverse problem rendering the localization result in some situations ambiguous and uncertain. On the other hand, imaging techniques relying on hemodynamic changes indirectly reflecting underlying neuronal activity, such as fMRI, have limitations in their temporal resolution. While providing at best a millimetre scale spatial resolution, their ability to resolve brain activity in time is limited by the sluggishness of the hemodynamic changes compared to the underlying neuronal activity. Consequently, it has been proposed that in order to acquire a more complete picture of brain function, it is necessary to combine information from different

2
imaging modalities that complement each other (George et al. 1995; Hämäläinen et al. 1993).
Our work combines MEG and fMRI in studies of spatiotemporal properties of the cortical networks involved in the processing of somatosensory stimuli and execution of a motor task. The differences in temporal and spatial resolution of MEG and fMRI could have implications on the clinical use of these techniques. We assess the degree of convergence and reliability of MEG and fMRI in localizing the primary sensorimotor cortex in healthy humans and in neurosurgical patients for the purpose of preoperative planning.
3
2. Review of the literature
2.1. Somatosensory and motor systems
Somatosensory and motor systems are tightly coupled. Sensory feedback is essential for accurate execution of motor tasks. Proprioceptive information of joint positions and muscle contraction as well as tactile information of forces applied on the skin are required for accurate adjustment of movement and object exploration. Any type of motor activity heavily depends on sensory feedback.
2.1.1. Somatosensory system
2.1.1.1. Peripheral receptors
At least four somatic sensory submodalities can be distinguished: touch, proprioception, pain and thermal sensations. They all have specialized classes of receptors, which mediate the information of each modality.
Touch is mediated by cutaneous mechanoreceptors. Of these, Meissner’s corpuscles and Pacinian corpuscles adapt rapidly, while Merkel’s and Ruffini’s corpuscles adapt slowly and respond throughout the stimulus duration (Johnson 2001). In addition, hair follicles have specialized receptors. Proprioception is mediated by muscle spindle receptors and by receptors in the joints. Pain is mediated by nociceptors, which can be selectively sensitive to mechanical stimuli or temperature. Polymodal receptors that respond to multiple types of noxious stimuli are a third type of nociceptors. Temperature is sensed through specialized receptors that respond to cold or warmth.
2.1.1.2. Pathways from the periphery
Somatic sensory information, except in the areas innervated by the cranial nerves, is transmitted from the periphery through the dorsal root ganglion cells. The afferent fibres of these cells terminating at the receptors have different conduction velocities dependent on their diameter and if myelination is present. Large myelinated fibres have the highest conduction velocities. Peripheral nerves contain mixtures of different classes of sensory fibres. Additionally, many of them, such as the median nerve stimulated in our studies (I, II and IV), also contain efferent fibres as well. When such a mixed nerve is electrically stimulated above the motor threshold, both motor and large diameter sensory fibres are activated.

4
From the dorsal root ganglion cells the efferent branch conveys information to the dorsal horn of the spinal cord. From there the two main pathways (Figure 1) mediate different somatic sensory modalities. Touch and proprioception are primarily conveyed through the dorsal column to the dorsal column nuclei of the caudal medulla. There the tract decussates to the contralateral side. In the brain stem, the information is relayed via the medial lemniscus, which projects on the thalamus.
The other pathway, which conveys information mainly about temperature and pain, crosses the midline at the spinal cord level and the axons travel along the anterolateral portion of the lateral column of the spinal cord. They terminate at the reticular formation, midbrain, and the thalamus. (Kandel et al. 2000)
Figure 1. The medial lemniscal and and anterolateral pathways. Adapted fromKandel et al. (2000).
SI
SII
Medial lemniscus
Gracile nucleus
Medial lemniscalpathway Anterolateral pathway
Thalamus
VPL
Dorsal horn
Spinomesenchephalic tract
Spinoreticular tract
Spinothalamic tract
Midbrain
Pons
Medulla
Spinal cord

5
2.1.1.3. Thalamic nuclei and their connections
Somatic sensations are relayed to the cortex through the ventral posterior nuclear complex of the thalamus. This nucleus is somatotopically organized so that input from the limbs and trunk terminate at the lateral portion (ventro-postero-lateral nucleus, VPL) and input from the face to the medial portion. The neurons in the ventral posterior nucleus mainly project to the primary somatic sensory cortex and to the motor cortex (collectively called primary sensorimotor cortex, SMI) through the posterior limb of the internal capsule. The secondary somatosensory cortex (SII) receives input mainly from the inferior nucleus of the ventral posterior nucleus of the thalamus. (Pons et al. 1987) suggested that SII is activated in a serial manner from SI. This view has been, however, contested by recent findings in monkeys (Zhang et al. 2001) and humans (Karhu and Tesche 1999). Deep within the lateral sulcus, in the insula, there are regions also receiving thalamic input.
2.1.1.4. Cortical processing areas and cortico-cortical connections
The neurons in the thalamus project to SMI so that a somatotopic organization is maintained. The primary somatosensory cortex (SI) lying on the postcentral gyrus contains four cytoarchitectonic areas (Brodmann areas 3a, 3b, 1 and 2). They contain independent map-like representations of body surface, as has been demonstrated in studies on non-human primates (Kaas et al. 1979) and supported by neuroimaging data on humans (Young et al. 2004). Lower limbs and genitals are represented medially, while the most lateral SI receives visceral input. Between them are the SI regions receiving input from the face (laterally) and upper limb (medially) taking up the largest portions of the postcentral gyrus. The somatotopical organization in SI is not sharply delineated. An overlap between representation areas of neighbouring parts of the body exists. The secondary somatosensory cortex, likewise, contains a somatotopic map. This map is less fine-grained than the SI maps (Ruben et al. 2001; Young et al. 2004). In non-human primates the opercular cortex contains two symmetric mirrored maps, termed as SII and parietal ventral area (Krubitzer et al. 1995) or anterior and posterior SII (Burton et al. 1995) Evidence suggests a similar organization also exists in humans (Disbrow et al. 2001).
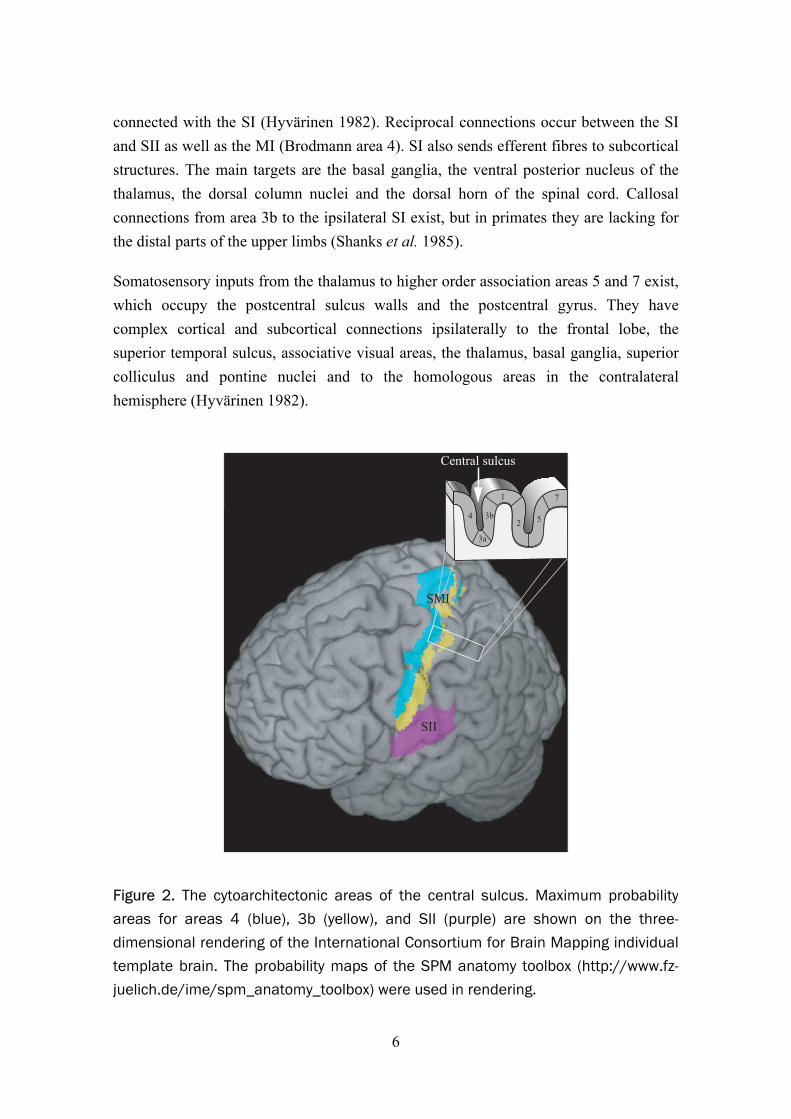
At SMI, most of the thalamic fibres terminate at areas 3a and 3b (Figure 2). Areas 3a and 2 primarily receive proprioceptive input, while 3b and 1 receive mostly tactile sensory information. Each of the four parts of the SI has associative connections with each other. The posterior parietal cortex (Brodmann areas 5 and 7) are reciprocally
6
connected with the SI (Hyvärinen 1982). Reciprocal connections occur between the SI and SII as well as the MI (Brodmann area 4). SI also sends efferent fibres to subcortical structures. The main targets are the basal ganglia, the ventral posterior nucleus of the thalamus, the dorsal column nuclei and the dorsal horn of the spinal cord. Callosal connections from area 3b to the ipsilateral SI exist, but in primates they are lacking for the distal parts of the upper limbs (Shanks et al. 1985).
Somatosensory inputs from the thalamus to higher order association areas 5 and 7 exist, which occupy the postcentral sulcus walls and the postcentral gyrus. They have complex cortical and subcortical connections ipsilaterally to the frontal lobe, the superior temporal sulcus, associative visual areas, the thalamus, basal ganglia, superior colliculus and pontine nuclei and to the homologous areas in the contralateral hemisphere (Hyvärinen 1982).
Figure 2. The cytoarchitectonic areas of the central sulcus. Maximum probability areas for areas 4 (blue), 3b (yellow), and SII (purple) are shown on the three-dimensional rendering of the International Consortium for Brain Mapping individualtemplate brain. The probability maps of the SPM anatomy toolbox (http://www.fz-juelich.de/ime/spm_anatomy_toolbox) were used in rendering.
SII
523b
3a
4
1 7
SMI
Central sulcus

7
2.1.1.5. Neuronal generators of median nerve SEFs
The first neuromagnetic evoked response recordings in humans to the stimulation of median nerve (Brenner et al. 1978) showed that a magnetic counterpart of the N20 evoked potential, N20m, arising at around 20 milliseconds (ms) post stimulus, can be best modelled with a current dipole oriented perpendicular to the posterior bank of the central sulcus which would correspond to the cytoarchitectonic area 3b of Brodmann. The orientation suggests that the source current is directed from the deep cortical layers towards the superficial ones. A current with that orientation would generate a frontally positive and parietally negative surface potential as is observed in somatosensory evoked potential (SEP) measurements. In invasive recordings directly from the cortex a polarity reversal of the N20 component is observed across the central sulcus (Allison et al. 1989a).
The N20m deflection is followed at 30–35 ms by a deflection with an approximately reversed polarity and source current orientation. The exact neural origin of this evoked response component called either P30m or P35m, is likely within the SI (Allison et al. 1989a; 1991). Although contribution of the precentral cortex has also been suggested since its source is located anterior and medial to the N20m source (Kawamura et al. 1996). This remains disputed, and it has been suggested that the curved shape of the hand area might in some circumstances lead to errors in localization if the activated area is wider during P35m than during N20m (Huttunen 1997).
At longer latencies, dipolar field patterns arise bilaterally near the lateral sulci. These evoked response components, peaking at around 100 ms, have generators in the contra- and ipsilateral SII (Allison et al. 1989b; Hari et al. 1983). Forss et al. (1999) found that ipsilateral SII was activated even without activation of contralateral SI and SII due to a lesion by a stroke, suggesting that SII may be activated without relayed input from SI at least in the ipsilateral hemisphere. Indeed, some evidence exists from invasive electrophysiological recordings (Barba et al. 2002; Lüders et al. 1985; Woolsey et al. 1979) and MEG (Karhu and Tesche 1999) that SII is already activated at latencies around 20 ms paralleling SI.
Forss et al. (1994) observed that areas in contralateral postcentral sulcus are activated at latencies around 70–110 ms. Source modelling indicated a source within the postcentral sulcus. Cortical and transcortical recordings in humans have not, however, provided conclusive evidence for the role of areas 2, 5, and 7 in the postcentral sulcus in the generation of SEPs of SEFs (Allison et al. 1989b).
8
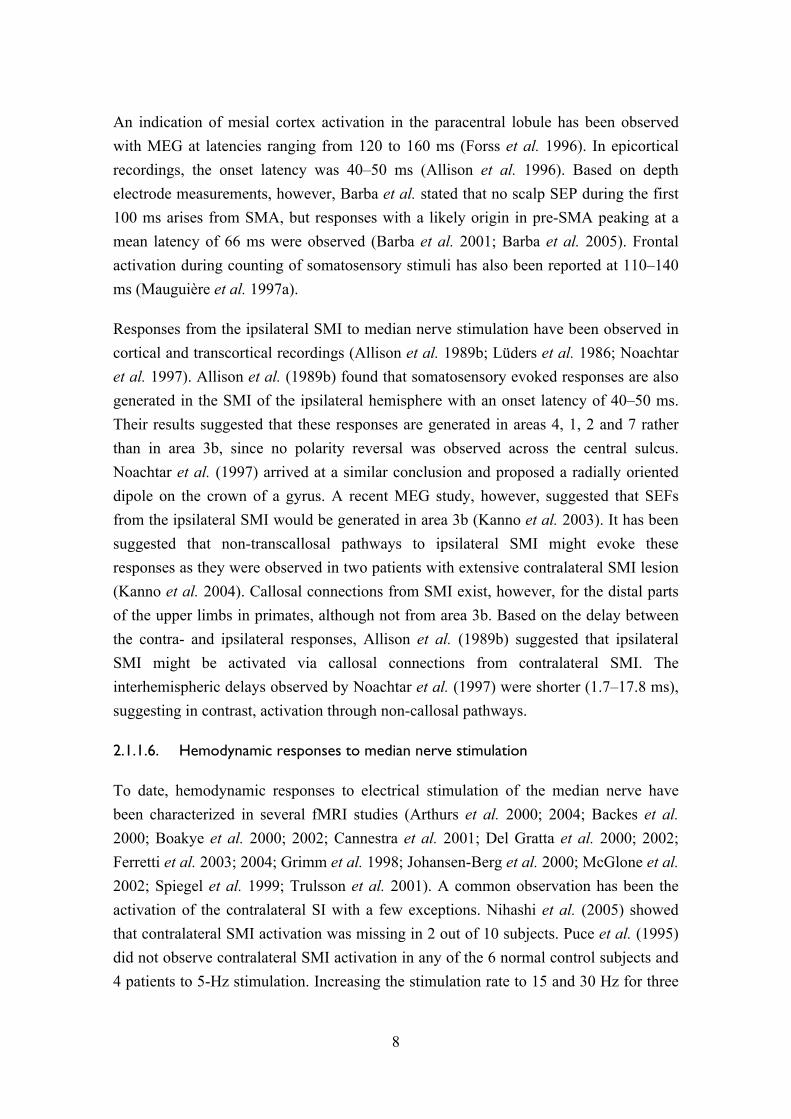
An indication of mesial cortex activation in the paracentral lobule has been observed with MEG at latencies ranging from 120 to 160 ms (Forss et al. 1996). In epicortical recordings, the onset latency was 40–50 ms (Allison et al. 1996). Based on depth electrode measurements, however, Barba et al. stated that no scalp SEP during the first 100 ms arises from SMA, but responses with a likely origin in pre-SMA peaking at a mean latency of 66 ms were observed (Barba et al. 2001; Barba et al. 2005). Frontal activation during counting of somatosensory stimuli has also been reported at 110–140 ms (Mauguière et al. 1997a).
Responses from the ipsilateral SMI to median nerve stimulation have been observed in cortical and transcortical recordings (Allison et al. 1989b; Lüders et al. 1986; Noachtar et al. 1997). Allison et al. (1989b) found that somatosensory evoked responses are also generated in the SMI of the ipsilateral hemisphere with an onset latency of 40–50 ms. Their results suggested that these responses are generated in areas 4, 1, 2 and 7 rather than in area 3b, since no polarity reversal was observed across the central sulcus. Noachtar et al. (1997) arrived at a similar conclusion and proposed a radially oriented dipole on the crown of a gyrus. A recent MEG study, however, suggested that SEFs from the ipsilateral SMI would be generated in area 3b (Kanno et al. 2003). It has been suggested that non-transcallosal pathways to ipsilateral SMI might evoke these responses as they were observed in two patients with extensive contralateral SMI lesion (Kanno et al. 2004). Callosal connections from SMI exist, however, for the distal parts of the upper limbs in primates, although not from area 3b. Based on the delay between the contra- and ipsilateral responses, Allison et al. (1989b) suggested that ipsilateral SMI might be activated via callosal connections from contralateral SMI. The interhemispheric delays observed by Noachtar et al. (1997) were shorter (1.7–17.8 ms), suggesting in contrast, activation through non-callosal pathways.
2.1.1.6. Hemodynamic responses to median nerve stimulation
To date, hemodynamic responses to electrical stimulation of the median nerve have been characterized in several fMRI studies (Arthurs et al. 2000; 2004; Backes et al. 2000; Boakye et al. 2000; 2002; Cannestra et al. 2001; Del Gratta et al. 2000; 2002; Ferretti et al. 2003; 2004; Grimm et al. 1998; Johansen-Berg et al. 2000; McGlone et al. 2002; Spiegel et al. 1999; Trulsson et al. 2001). A common observation has been the activation of the contralateral SI with a few exceptions. Nihashi et al. (2005) showed that contralateral SMI activation was missing in 2 out of 10 subjects. Puce et al. (1995) did not observe contralateral SMI activation in any of the 6 normal control subjects and 4 patients to 5-Hz stimulation. Increasing the stimulation rate to 15 and 30 Hz for three
9
subjects revealed activation in the left but not in the right SMI. These two studies, however, used an alternating left and right hand stimulation paradigm.
Activated regions in the lateral sulci have been observed bilaterally during median nerve stimulation, likely corresponding to SII and insula (Arthurs and Boniface 2003; Arthurs et al. 2004; Del Gratta et al. 2000; 2002; Ferretti et al. 2004; McGlone et al. 2002). Activation has also been observed in the posterior parietal areas bilaterally (Boakye et al. 2000), supplementary motor area (Boakye et al. 2000), cingulate cortex (Arthurs et al. 2004) and inferior frontal cortex (Arthurs et al. 2004; Boakye et al. 2000). The dependence of the amplitude of the SMI hemodynamic response on the frequency of electrical stimulation has been investigated using PET and fMRI. Ibanez et al. (1995) found that the hemodynamic response, as measured with PET, increased linearly up to 3-Hz rate and then reached a plateau. In contrast to this observation, an fMRI study indicated that increasing the stimulation rate even up to 100 Hz results in a linear increase of the hemodynamic response (Kampe et al. 2000). Also the stimulus strength has been demonstrated to affect the BOLD response amplitude in SMI. (Backes et al. 2000). SII seems to show responses even at stimulus intensities that do not elicit SMI responses (Backes et al. 2000).
The cognitive context modulates somatosensory hemodynamic responses. In SMI, attending the stimuli increases the response amplitude on the contralateral side (Backes et al. 2000; Johansen-Berg et al. 2000; Staines et al. 2002). It has been observed that in ipsilateral SMI, task relevance suppressed the responses, however, while enhancement of responses was observed on the contralateral side (Staines et al. 2002). In SII it has been observed that attention enhances the responses (Backes et al. 2000; Johansen-Berg et al. 2000; Staines et al. 2002). On the other hand, expectancy decreases blood flow in SMI, SII and insula (Drevets et al. 1995). In SMI the decreases occur in body representation areas adjacent to the representation area of the anticipated stimulation and were strongest in the ipsilateral hemisphere (Drevets et al. 1995). Interestingly, measuring with oxyhemoglobin/deoxy-hemolobin concentration changes using near infrared spectroscopy (NIRS), Francheschini et al. (2003) found decreases/increases in the ipsilateral SMI response to electrical stimulation median nerve. These hemodynamic responses were reversed compared to the contralateral SMI responses and not observed with tactile stimulation.

10
2.1.2. Motor system
2.1.2.1. Cortical processing
The generation of motor responses guided by external or internal cues involves several sequential processes. A correct response has to be selected and a motor program for the coordination of movement has to be generated, and the response has to be initiated or inhibited. Finally the motor response is executed and provisionally modified during execution. A hierarchical network of brain areas is suggested to be responsible for a motor response (Kollias et al. 2001; Rizzolatti and Luppino 2001).
The primary motor area (MI) is considered to be the area 4 in the caudal part of the precentral gyrus mostly confined to the anterior sulcal wall of the central sulcus (Rademacher et al. 2001). In the MI an orderly organization according to parts of the body exists as observed in the early cortical stimulation studies. Along with this macroscopic somatotopy a finer level of organization to distributed processing areas within the primary motor cortex may exist (Geyer et al. 1996; Sanes et al. 1995). It seems that, for example fingers have multiple partly overlapping representations within M1. At the same time these areas are, however, organized spatially so that a somatotopic arrangement for fingers exists within the hand representation area in the M1 (Alkadhi et al. 2002; Beisteiner et al. 2001; Beisteiner et al. 2004; Dechent and Frahm 2003; Hluštík et al. 2001; Sanes and Schieber 2001; Schieber 2001).
The lateral premotor area usually refers to the Brodmann area 6 in the precentral gyrus, while area 6 in the medial wall on the superior parietal gyrus contains pre-SMA, a possible human homologue for monkey area F6, and SMA (Picard and Strick 2001). The SMA is interconnected with the MI and spinal cord, unlike pre-SMA, which is interconnected with the prefrontal cortex (Picard and Strick 2001). SMA is located caudal, and pre-SMA rostral to the anterior commissural line on the medial surface of the superior frontal gyrus (Humberstone et al. 1997). Cingulate cortex has been proposed to contain a motor area with a caudal and a rostral subdivision, which is further subdivided into anterior and posterior parts (Picard and Strick 2001).
Areas involved in the generation of a motor response have been explored with modern neuroimaging methods and multiple areas beyond MI appear to be involved (Fink et al. 1997; Kollias et al. 2001). The caudal part of cingulate motor area is activated primarily in association with movement execution, while the rostral part, is associated with response selection. In monkeys the area F6 is implicated to be important in response choice and initiation (Picard and Strick 2001; Rizzolatti and Luppino 2001). Area F3,

11
corresponding to human SMA, is considered a part of the network responsible for the motor execution (Picard and Strick 2001; Rizzolatti and Luppino 2001). The human neuroimaging data seems to indicate that pre-SMA is involved in the transformation of the sensory cues to actions and is functionally part of the prefrontal cortex. It seems to be less related to actual motor execution, but involved in the cognitive aspects of a motor task. SMA, on the other hand is activated primarily during motor task execution (Picard and Strick 2001). Picard and Strick (2001) proposed that the lateral premotor areas are similarly subdivided into rostral and caudal parts, with functional roles resembling those of pre-SMA and SMA.
Introduction of event-related fMRI techniques (Buckner et al. 1996; Humberstone et al. 1997) have allowed experimental designs, which enable separate detection of responses related to the preparatory and execution phase. Giving insight into the sequence of activation of the cortical network involved in motor response selection and execution Lee et al. (1999) reported sequential activation of pre-SMA and SMA from preparatory to execution phase. Richter et al. (1997) examined, using time-resolved fMRI, the sequential activation of the SMA, premotor areas (PM) and MI during preparatory and execution phases of a visually cued motor task. Another study utilized phase coherence in the fMRI data to reveal differences in the onsets of BOLD responses during execution of a bimanual motor task (Sun et al. 2005). SMA was consistently the first area activated followed by PM and MI.
2.1.2.2. The brain stem pathways
Several nuclei in the brain stem project to interneurons and motoneurons in the spinal cord. Two main pathways, medial and lateral, are distinguished. The medial pathway descends in the ipsilateral ventral columns of the spinal cord and axons within this pathway synapse primarily with interneurons in the spinal group and to lesser extent with motor neurons controlling axial muscle groups. The lateral pathways predominantly terminate at motor neurons controlling mainly distal muscles of the limbs (Kandel et al. 2000).
2.1.2.3. The corticospinal tract
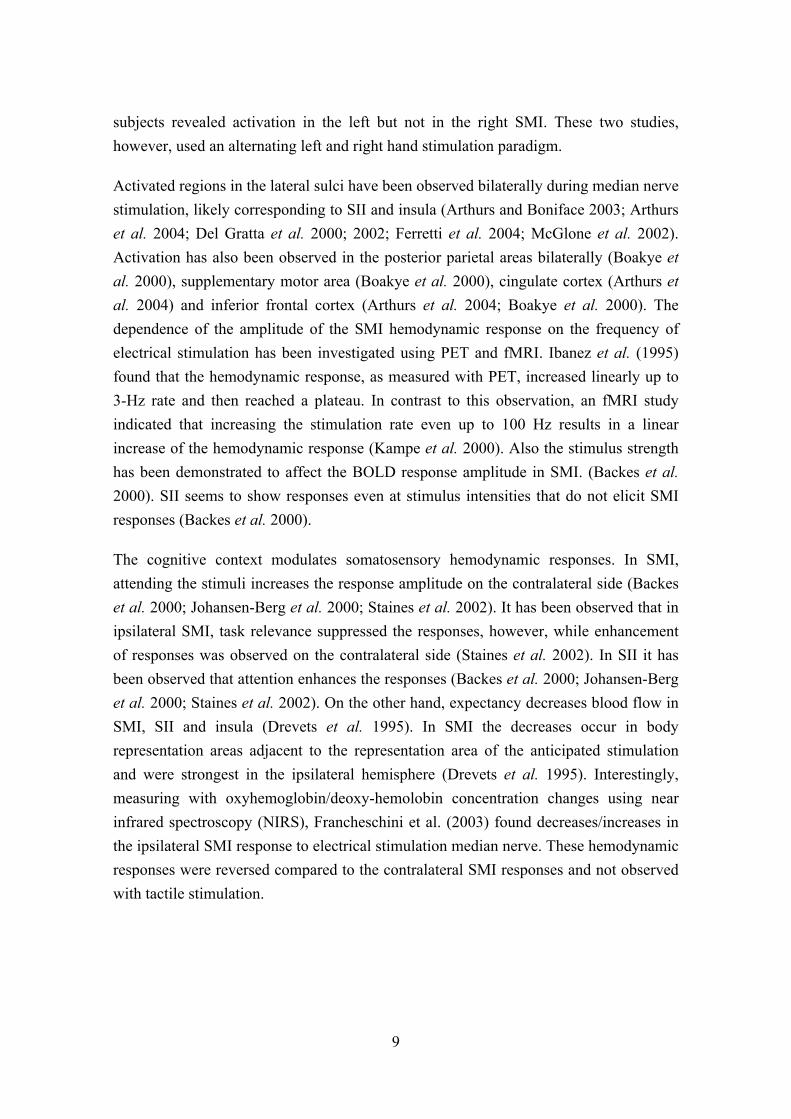
The neurons in the SMI and premotor areas send axons that synapse with motoneurons and associated interneurons in the ventral horn of the spinal cord (Figure 3). The axons travel in the internal capsule, then onwards to the basis pedunculi in the midbrain and into the pyramis of the medulla. The majority of the fibres cross the midline at the level of the medulla (the lateral corticospinal tract) except for about 10% of the fibres (the
12
ventral corticospinal tract) that continue to the spinal cord and cross the midline at the level where they terminate and synapse (Kandel et al. 2000).
Figure 3. The medial and lateral corticospinal tracts. Adapted from Kandel et al.(2000)
Medial corticospinalpathway
Lateral corticospinalpathway
Midbrain
Pons
Medulla
Medulla-spinal chordjuncture
Spinal cord
Pyramidal decussation
SMI, premotor areas
13
2.2. Magnetoencephalography
2.2.1. Generation of neuromagnetic activity
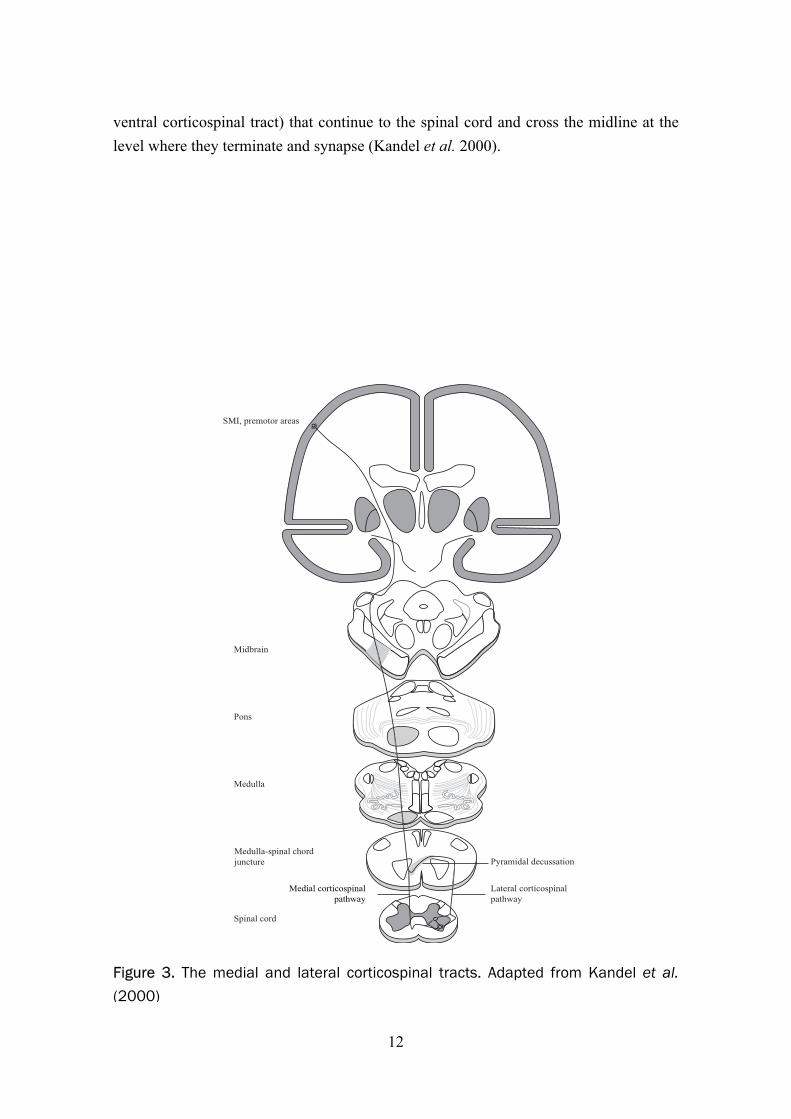
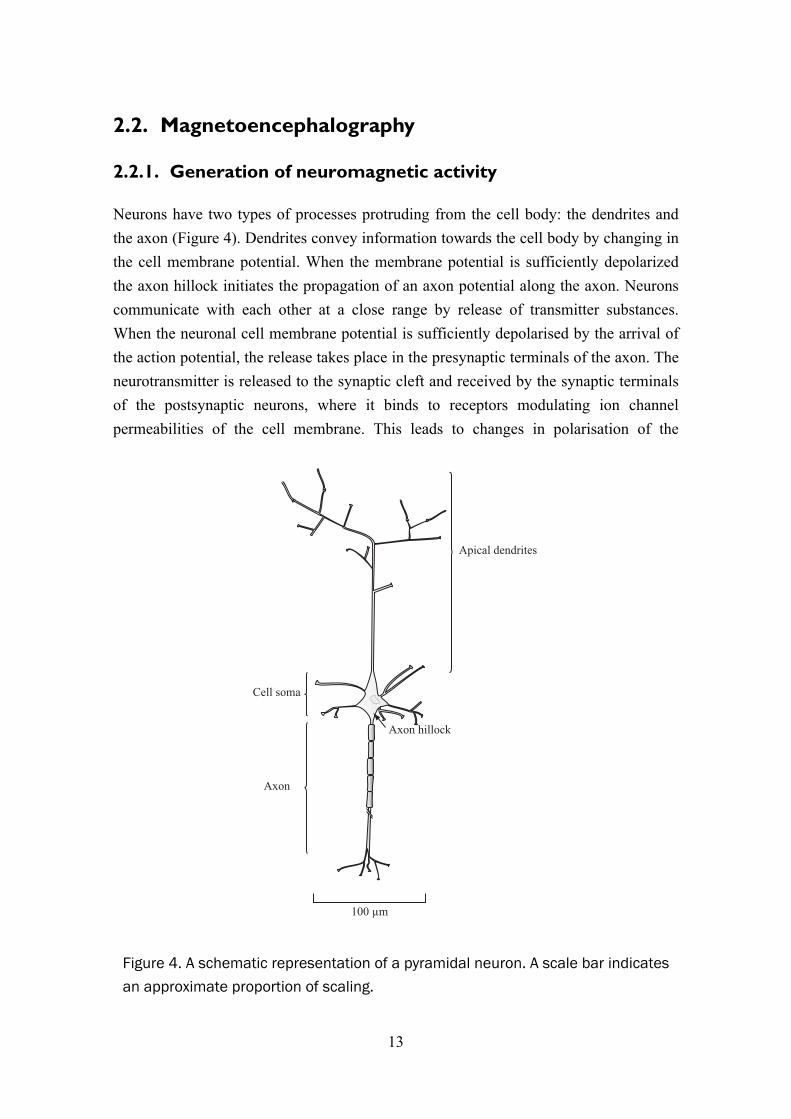
Neurons have two types of processes protruding from the cell body: the dendrites and the axon (Figure 4). Dendrites convey information towards the cell body by changing in the cell membrane potential. When the membrane potential is sufficiently depolarized the axon hillock initiates the propagation of an axon potential along the axon. Neurons communicate with each other at a close range by release of transmitter substances. When the neuronal cell membrane potential is sufficiently depolarised by the arrival of the action potential, the release takes place in the presynaptic terminals of the axon. The neurotransmitter is released to the synaptic cleft and received by the synaptic terminals of the postsynaptic neurons, where it binds to receptors modulating ion channel permeabilities of the cell membrane. This leads to changes in polarisation of the
Figure 4. A schematic representation of a pyramidal neuron. A scale bar indicates an approximate proportion of scaling.
Cell soma
Axon hillock
Axon
Apical dendrites
100 µm

14
postsynaptic neuron. The resting state is restored by ion pumps in the cell membrane, which restore the imbalance between extra- and intracellular concentration of sodium, potassium, calcium and chloride ions. The membrane potential changes in this chain of events are generated by the in- and outward flux of these ions, which produce currents mainly inside or in the vicinity of the cell. The electric field that this primary current generates gives rise to return currents that complete the current loop. They passively flow everywhere in the conducting medium, both intra- and extracellularly. The electrical activity in the neuron gives rise to a primary current mainly inside the cell (Hämäläinen et al. 1993). Thus, the current density J can be divided into two components:
vp JJJ += (1)
where Jp is the primary current and Jv the passive return current. The area of source activity can be localised by locating the primary current. The flow of both primary and volume currents is determined by tissue conductivity, which is largely influenced by cellular membranes acting as effective insulators (Hämäläinen et al. 1993).
The current distribution J and electric field E generated by neuronal activity are related to the magnetic field B outside the head as expressed by the Maxwell’s equations. Since neuromagnetic fields vary slowly (frequencies are below 1 kHz) the time dependent terms in these equations can be ignored and they can be expressed in a simplified form:
0/ερ=⋅∇ E (2)
0=×∇ E (3)
0=⋅∇ B (4)
JB 0µ=×∇ (5)
where ρ is the charge density, ε0 the permittivity and µ0 the permeability of vacuum (Hämäläinen et al. 1993).
The magnetic field B at point r is given by the Ampère–Laplace law:
´´)(4
)( 30 υπµ d
RRrJrB ∫
×= (6)
where R=r-r´ and r´ is the location of the source current (Hämäläinen et al. 1993).

15
An action potential travelling along the axon generates a quadrupolar electric source, while a postsynaptic potential appears as a dipolar current source. A quadrupolar field decreases with distance as 1/r3, while a dipolar field decreases with the factor 1/r2. The postsynaptic potentials summate more effectively temporally due to their longer duration (tens of ms) compared to action potentials. Synaptic currents therefore largely generate the measurable EEG and MEG. Macroscopically the synaptic currents appear as a dipole oriented parallel to the longitudinal axis of pyramidal neurons (Okada et al. 1997). To generate a typical dipolar source strength of the order of 10 nAm commonly observed in evoked EEG and MEG responses, simultaneous activity of approximately 105 synapses is required. This corresponds to a cortical patch with an area of about 40–200 mm2 (Hämäläinen et al. 1993).
2.2.2. Measurement of MEG
The electrical activity of the neurons in the brain generates electromagnetic fields, which can be measured externally. Potential differences on the scalp can be measured by placing electrodes on the skin. Measurement of the magnetic fields generated by neuronal activity became feasible by development of detectors sensitive enough for the detection of these weak fields, which are on the order of 50 to 500 femtotesla (fT). These sensors, Superconducting Quantum Interference Devices (SQUIDs, Zimmerman et al. 1970), were first employed for brain electromagnetic activity measurement in the 1970s. A SQUID is a superconducting ring interrupted by two Josephson junctions (Josephson 1962). The voltage across these junctions varies with the external magnetic field when the current is fed through these junctions. In magnetometers the external magnetic field is transferred to the SQUID by a flux transformer (Hämäläinen et al. 1993). It consists of a pick-up coil, which gathers the measured magnetic field and a signal coil connecting it to the SQUID. They can further be combined with an oppositely wound compensation coil. A homogeneous magnetic field, such as from distant noise generators, induces opposing and nearly equally strong currents to the pick-up and compensation coils, making the configuration effectively insensitive to all except the inhomogeneous fields generated by nearby sources (Hämäläinen et al. 1993). We performed measurements using planar gradiometers, which measure the gradient of the magnetic field in two orthogonal directions at each location. The magnetic field is often measured by using axial gradiometers, which measure the radial gradient of the magnetic fields arising from the brain. The axial and planar gradiometers differ in their spatial sensitivity patterns (lead fields, Hämäläinen et al. 1993). The axial gradiometers have a wider lead field, which extends deeper making them more sensitive to deep sources. A planar gradiometer has a more superficial and narrower sensitivity pattern,
16
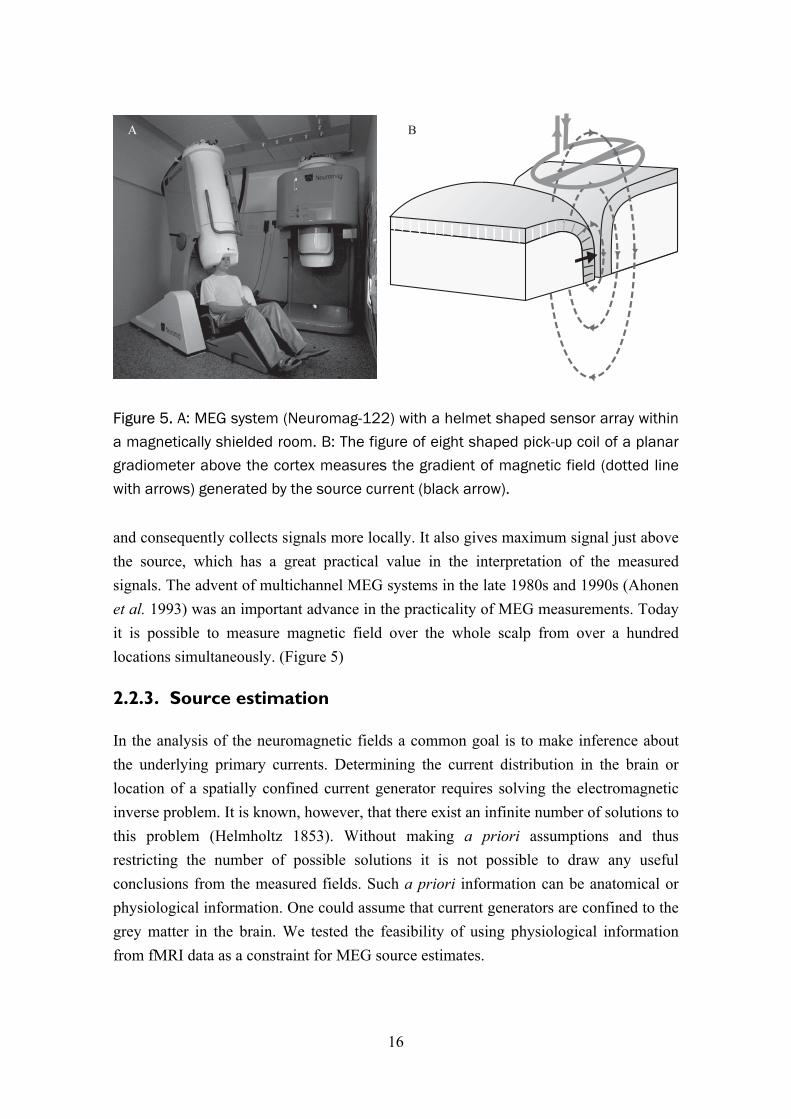
and consequently collects signals more locally. It also gives maximum signal just above the source, which has a great practical value in the interpretation of the measured signals. The advent of multichannel MEG systems in the late 1980s and 1990s (Ahonen et al. 1993) was an important advance in the practicality of MEG measurements. Today it is possible to measure magnetic field over the whole scalp from over a hundred locations simultaneously. (Figure 5)
2.2.3. Source estimation
In the analysis of the neuromagnetic fields a common goal is to make inference about the underlying primary currents. Determining the current distribution in the brain or location of a spatially confined current generator requires solving the electromagnetic inverse problem. It is known, however, that there exist an infinite number of solutions to this problem (Helmholtz 1853). Without making a priori assumptions and thus restricting the number of possible solutions it is not possible to draw any useful conclusions from the measured fields. Such a priori information can be anatomical or physiological information. One could assume that current generators are confined to the grey matter in the brain. We tested the feasibility of using physiological information from fMRI data as a constraint for MEG source estimates.
Figure 5. A: MEG system (Neuromag-122) with a helmet shaped sensor array within a magnetically shielded room. B: The figure of eight shaped pick-up coil of a planar gradiometer above the cortex measures the gradient of magnetic field (dotted linewith arrows) generated by the source current (black arrow).
A B
17
The most common method for estimating of the currents in the brain is to model the primary current as an equivalent current dipole (ECD). It models the summed primary currents in a relatively small region as a point-like current. The dipole that explains the measured data with the least summed squared error may be selected as the best model. When a relatively small number of sources is assumed, multiple dipoles can be used to simultaneously model activity in several brain areas (Mosher et al. 1992; Scherg and Von Cramon 1985). An assumption on the number and approximate location of the sources, however, must be made.
Activated areas may sometimes be extended over such large cortical areas that a point-like source is not a useful model. Distributed estimates of current distribution can be obtained by methods belonging to the class of minimum-norm estimates (Dale and Sereno 1993; Hämäläinen and Ilmoniemi 1994; Pascual-Marqui et al. 1994). These estimates do not require assumptions on the source configuration. Instead, they find the most plausible solution among all the possible solutions. The source space, all the possible solutions, can be reduced by using a priori information such as constraining the sources to the cortical grey matter and their orientation perpendicular to the surface (Dale and Sereno 1993; Lin et al. 2006). The ℓ2-norm based minimum norm estimate will give smooth estimates and therefore often have a limited ability to separate different activated areas. When the sum of the absolute current is minimized (ℓ1-norm) the estimates are more focal and model better compact source areas (Uutela et al. 1999). Furthermore, the norm order could be chosen from any value between 1 and 2. An approach to circumvent arbitrary choice of norm order has been proposed (Auranen et al. 2005). Bayesian inference has gained increasing attention as a way to use a priori information in solving the neuromagnetic inverse problem (Auranen et al. 2005; Baillet and Garnero 1997; Bertrand et al. 2001; Mattout et al. 2005; Phillips et al. 1997; Russell et al. 1998; Sato et al. 2004; Schmidt et al. 1999; Trujillo-Barreto et al. 2004). This approach offers a framework for integrating a priori information, such as fMRI data, into the estimation of the current distribution. Instead of presenting the estimated source strength one can also present statistical parameter maps in a fashion that is customary in fMRI by normalizing the estimates with predicted estimator noise (Dale et al. 2000).

18
2.3. Functional magnetic resonance imaging
2.3.1. Principles of magnetic resonance imaging
MRI is based on transmitting energy to the imaged object by radiofrequency (RF) pulses and reading the signal emitted back. In the case of imaging the signal mainly arises from hydrogen nuclei. Spin is a property of nucleons, which can pair up to cancel out the net spin of the nucleus. Nuclei with unpaired spins and thus a net spin, such as the hydrogen nucleus, can absorb a photon at the Larmor frequency. This frequency (ω0) depends on the gyromagnetic ratio (γ) of the particle and the external magnetic field (B0) (Equation 7). The energy needed to change the energy state of nuclei is transmitted by means of a RF excitation pulse.
00 γB=ω (7)
The spin can be thought of as a small magnetic moment vector. The nucleus aligns with the external magnetic field when in a low-energy state and is opposite to it in its high-energy state. The spins in low-energy state slightly outnumber those in the high-energy state and thus create a net magnetization vector in the direction of the external magnetic field. The ratio of spins in high and low energy states, and thus the magnitude of the net magnetization vector, depends on the temperature and the external magnetic field according to Bolzmann statistics,
kTBh
eNN γ
−
−
+
≈ (8)
where h is the Planck’s constant (6.626×10⁻³⁴ Js), k is the Bolzmann’s constant (1.3805×10⁻²³ J/K), and T is the temperature. The larger the external magnetic field, the larger the net magnetization vector and thus the larger the signal emitted from the nuclei when they return to equilibrium after absorbing the energy of the RF excitation pulse.
For the purposes of describing nuclear magnetic resonance and MRI on a macroscopic scale the net magnetization state of all the nuclei or local group of nuclei in the sample is usually considered. A local group of nuclei experiencing the same external magnetic field, and thus precessing at the same frequency, is referred to as an isochromat. The net magnetization vector is the vector sum of all the separate isochromat magnetization vectors.

19
More nuclei can be put into the high-energy state, changing the net magnetisation vector by transmitting energy to the nuclei in the tissue. After this excitation the energy is both transferred away from the spin system and redistributed within it. The time constant related to the time required for the system to return back to the original equilibrium magnetization, energy transfer away from the system, is called T1 relaxation time (spin-lattice relaxation, longitudinal relaxation).
The net magnetization vector rotates about the applied external magnetic field, B0, at the Larmor frequency. This is referred to as precession. The component of the magnetization vector in the plane perpendicular to B0 is referred to as the transverse magnetisation. The interactions between the spins (spin-spin relaxation, pure T2 relaxation), i.e. redistribution of energy within the spin system, will change precession frequency across the tissue. This causes dephasing of the isochromats and decay of the transverse relaxation and thereby the detectable signal from the spin system. The signal will decay exponentially:
20)( T
t
eStS−
= (9)
where S(t) is the signal at time t and S0 the signal at the time of excitation. T2 is a time constant related to the time required for the spins to dephase due to spin-spin interactions. Inhomogeneities of B0 will cause additional dephasing as the spins will precess at different frequencies. The decay of signal in the presence of such inhomogeneities is described by T2
* time constant. The relation between T2*, T2 is:
´22
*2
111TTT
+= (10)
where T2´ is an additional relaxation time constant related to the contribution of the magnetic field inhomogeneities.
By applying magnetic field gradients, as first proposed by Paul Lauterbur (Lauterbur 1973), the MR images can be formed by locally altering the external magnetic field. This method allows encoding of spatial position in the frequency and in the phase of the precessing spins. In this way, two dimensions of space can be encoded. A third dimension can be encoded by applying a slice selection gradient and an RF excitation pulse that consists of a narrow band of frequencies thus selectively exciting a plane with nuclei resonating at corresponding frequencies (Garroway et al. 1974).

20
Conventionally, the complex signal space is sampled line by line after several excitation pulses. This can lead to imaging times that are around several minutes. A faster method, echo-planar imaging, was already proposed in 1977 by Peter Mansfield (1977), but the extreme requirements for the electronics generating the magnetic field gradients only made its implementation possible in the end of 1980’s. Thereafter it has been possible to acquire several images per second and thus follow image signal changes related to physiological processes in real time. This was a crucial step for the development of fMRI.
Further acceleration of image acquisition can be achieved through the use of multi-channel receiver coil arrays. The information about the spatial sensitivity patterns of the coils can be used to reduce the number of Fourier encoding steps (Pruessmann et al. 1999; Sodickson and Manning 1997) thus reducing imaging time.
As the BOLD contrast-to-noise ratio increases approximately linearly with the scanner field strength (Gati et al. 1997), systems with 3 T field are now commonly used for fMRI and systems even with 7 T field have been introduced for human experiments (Yacoub et al. 2001a).
2.3.2. Neurovascular coupling
Roy and Sherrington (1890) proposed a connection between neuronal activity and local cerebral blood flow. A wealth of data from neuroimaging studies confirm their hypothesis that an increase in neuronal activity is accompanied by an increase in blood flow within the respective brain area. The local changes in cerebral blood flow (CBF) and volume (CBV) in primary cortical projection areas during activation have been characterized with various imaging techniques. First with PET and SPECT and later with fMRI as well as with optical imaging methods (NIRS). The exact details of the mechanisms mediating this phenomenon, however, are only beginning to be unravelled.
The question of how much the oxidative metabolism increases concomitantly with brain activation has been subject to debate. In the resting state a strong correlation exists between regional cerebral metabolic rate of oxygen (CMRO2) and CBF (Fox and Raichle 1986). Fox et al. (1986; 1988), however, observed a mismatch between increase in cerebral glucose uptake and CMRO2 during brain activation induced by sensory stimulation. This together with observation of increased lactate during activation (Frahm et al. 1996; Prichard et al. 1991) suggested that the brain engages transiently in a non-oxidative energy production when metabolic demands are increased by neuronal activity. These observations have been contested by other in vivo measurements (Hoge

21
et al. 1999; Hyder et al. 1996; Malonek and Grinvald 1996), which have suggested oxidative glucose metabolism as a main source of energy for brain activation. A more recent study (Kasischke et al. 2004) using two-photon fluorescence microscopic imaging (Denk et al. 1990) of NADH fluorescence (Chance and Baltscheffsky 1958; Chance et al. 1962) provided strong evidence that oxidative metabolism takes place in the neurons in the event of increased neuronal activity and is followed by non-oxidative glycolysis in astrocytes. It has been proposed that astrocytes feed neurons with lactate that is used in turn to produce energy via oxidative metabolic processes. The astrocytic glycolysis comes into play only after a period of approximately 10 s of increased neuronal activity. These results could explain earlier contradictory observations. It has been suggested (Kasischke et al. 2004; Pellerin and Magistretti 2004) that measurements at low temporal resolution with PET (Fox et al. 1988) and magnetic resonance spectroscopy (MRS) (Frahm et al. 1996; Prichard et al. 1991) have likely measured the later, non-oxidative part of the response. An initial decrease in lactate has been observed, however, in measurements with higher temporal resolution (Hu and Wilson 1997; Mangia et al. 2003). A hypothesis has been put forth which proposes that astrocytes, stimulated by glutamate, take up glucose and metabolize it to lactate (Pellerin and Magistretti 1994, 2004). Lactate is transported to neurons, which use it as a main source of energy through oxidation in mitochondria. The astrocyte–neuron lactate shuttle hypothesis, however, has not been unanimously accepted (Chih et al. 2001; Chih and Roberts Jr 2003; Gjedde et al. 2002; Hertz 2004) and no conclusive evidence of transfer of lactate from astrocytes to neurons has yet been demonstrated.
The mediating agents triggering the local response in vasculature remain unknown. Two main hypothesis have been outlined. The first hypothesis maintains a coupling between CBF and CMRO2. A linear relationship between CBF and CMRO2 was proposed based on fMRI data (Hoge et al. 1999). This coupling has been taken as suggestive of metabolism and the metabolic products as inductors of functional hyperaemia. Several models (Buxton and Frank 1997; Friston et al. 2000; Hyder et al. 1998; Vafaee and Gjedde 2000; Zheng et al. 2002) propose that the disproportionately large increase in blood flow would be needed in order to increase diffusion of oxygen to support the elevated metabolic rate (Gjedde et al. 1991). Several studies (Mintun et al. 2001; Tuunanen and Kauppinen 2006; Tuunanen et al. 2006) have demonstrated that CBF response is not significantly altered during mild hypoxic hypoxia, thus questioning the role of oxidative metabolism as the driving factor of the hemodynamic response to activation. Furthermore, it has been shown that during sustained sensory stimulation oxygen consumption increases gradually while CBF exhibits an opposing trend (Mintun et al. 2002). The mismatch between changes in CMRO2 and CBF led Fox et al. (1986;
22
1988) to propose that blood flow is upregulated during activation for other purposes than serving the only moderately increased oxidative metabolism. They also hypothesized that CMRO2 is limited by enzymatic capacity. Recently, neurotransmission has been put forward as the driving factor of the hemodynamic response (Attwell and Iadecola 2002).
It has become evident that glial cells play a key role in mediating vascular relaxation and increased perfusion. Zonta et al. (2003) observed dilation of arterioles in response to an increase of calcium in the astrocytic endfeets. Mulligan and McVicar (2004) demonstrated that an increase in intracellular calcium leads to arteriolar vasoconstriction and is regulated by noradrenergic neurotransmission. An in vivo study (Takano et al. 2006), paralleling the results of Zonta et al. (2003), indicated that increase in intracellular calcium does lead to relaxation of arterioles by activation of phospolipase A2 enzyme and furthermore to production of arachidonic acid, which is converted by cyclooxygenase-1 pathway to vasodilatory prostanoids (Takano et al. 2006; Zonta et al. 2003). Neuronal activity increases intracellular calcium in astrocytes and glutamate seems to play a key role in this neuron–astrocyte signalling (Takano et al. 2006; Zonta et al. 2003). Results by Metea and Newman (2006) seem to resolve previous slightly controversial findings by showing that an increase of calcium in astrocytes can produce both constriction and relaxation of arterioles dependent on the nitric oxide concentration.
The brain activations leads to an increase in CBF, CBV and CMRO2. The changes in these parameters follow different temporal patterns and together with the mismatch in the proportions of the changes lead to the concentration modulation of the deoxyhemoglobin. A couple of seconds after brain activation an increase of CBF ensues. As OEF is not elevated in the same proportion, this results in a reduced concentration of deoxyhemoglobin in the veins draining the respective area. This phenomenon is the basis for the most widely used hemodynamic brain imaging method today: the blood oxygenation level dependent (BOLD) fMRI. A decrease in concentration of deoxygenated haemoglobin on the post-capillary side of local circulation leads to the positive BOLD response, which peaks after approximately five seconds. Concomitantly the CBV is increased. The CBV increase may result from mechanical distension of vessels during increased flow (balloon and windkessel models, Buxton et al. 1998; Mandeville et al. 1999). After cessation of increased brain activation the CBF falls back to a baseline level within 10 seconds. After this a post-activation undershoot in the BOLD signal can be observed, which may last for tens of seconds (Frahm et al. 1996; Fransson et al. 1998; Kruger et al. 1996; Lu et al. 2004;
23
Schroeter et al. 2006). Balloon and windkessel models have explained this as a consequence of a delayed compliance of vessels and an increase in CBV that continues after CBF and CMRO2 have returned to baseline. These models have been further expanded to include a post-activation decrease in CBF as a contributing effect to the post-activation undershoot (Friston et al. 2000). It has been observed, however, that CMRO2 continues to be elevated beyond the duration of CBF increase (Lu et al. 2004). Consequently, OEF is increased and dexoxyhemoglobin concentration falls. CBV seems to behave differently in cortical tissue and surface vessels (Yacoub et al. 2006). In the tissue CBV rapidly returns to baseline while in surface vessels it remains elevated for a longer period.
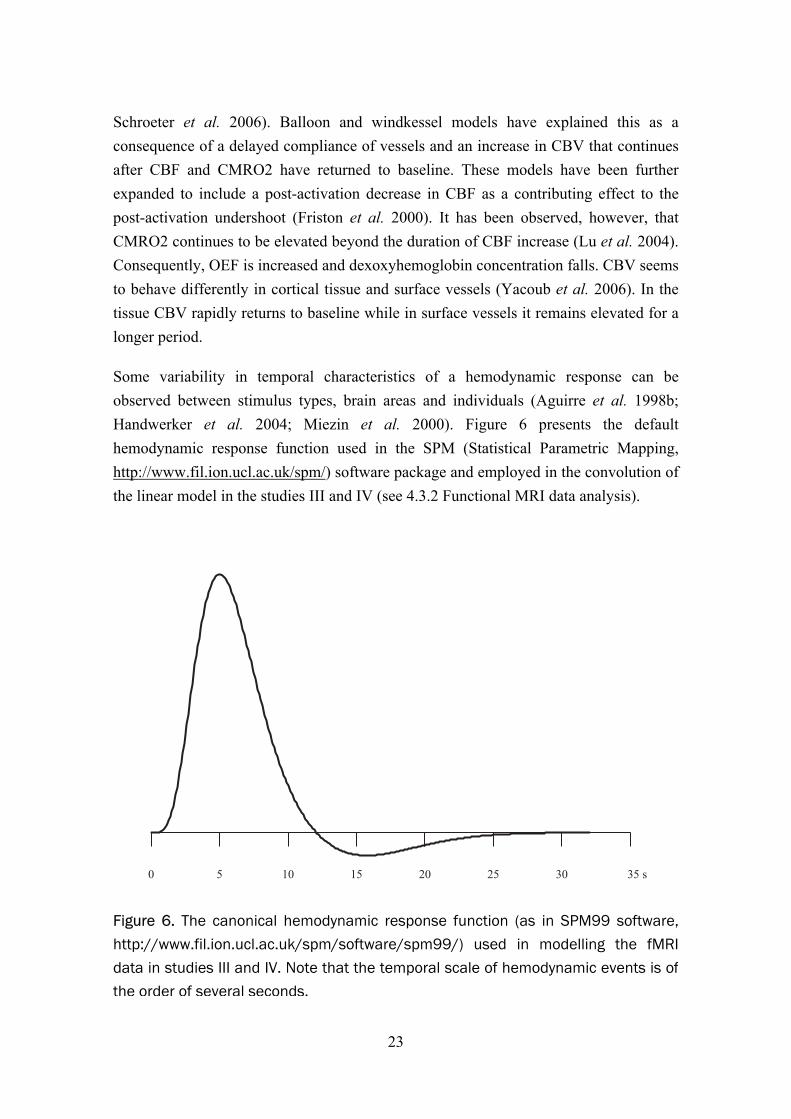
Some variability in temporal characteristics of a hemodynamic response can be observed between stimulus types, brain areas and individuals (Aguirre et al. 1998b; Handwerker et al. 2004; Miezin et al. 2000). Figure 6 presents the default hemodynamic response function used in the SPM (Statistical Parametric Mapping, http://www.fil.ion.ucl.ac.uk/spm/) software package and employed in the convolution of the linear model in the studies III and IV (see 4.3.2 Functional MRI data analysis).
Figure 6. The canonical hemodynamic response function (as in SPM99 software,http://www.fil.ion.ucl.ac.uk/spm/software/spm99/) used in modelling the fMRIdata in studies III and IV. Note that the temporal scale of hemodynamic events is ofthe order of several seconds.
0 5 10 15 20 25 30 35 s
24
An initial dip in the BOLD signal, during the first seconds following the brain activation, has been attributed to an initial increase in oxygen consumption before the increase in blood flow commences, thus increasing the OEF for less than a couple of seconds (Malonek and Grinvald 1996). It would be reflected as a minor increase in deoxyhemoglobin in the venules during the first few seconds of activation. The existence of the initial dip has been much debated (Buxton 2001; Jones et al. 2001; Lindauer et al. 2001; Vanzetta and Grinvald 2001). Measurements of tissue oxygenation (Thompson et al. 2003; Vanzetta and Grinvald 1999) have, however, demonstrated a decrease in oxygenation immediately after onset of sensory stimulation. Due to the weakness of this phenomenon, it has been difficult to observe it in other MR-systems than those with very high-field. Indeed, it seems to increase with field strength (Yacoub et al. 2001b). It has been suggested (Kim et al. 2000; Kim and Duong 2002; Malonek and Grinvald 1996) that the initial dip, owing to its hypothesized origin in neural tissue, would be spatially more specific to activated neuronal tissue, than the following positive part of the BOLD response, which is largely confined to the veins draining the activated cortical area (Lai et al. 1993; Oja et al. 1999; Turner 2002). Some studies have provided evidence that imaging the early parts of the rising BOLD response (Goodyear and Menon 2001; Menon and Goodyear 1999), would provide improved spatial specificity, even allowing imaging down to a cortical column level. It has been argued (Sheth et al. 2004a) that vascular events taking place immediately after the onset of brain activation, the early part of the initial dip and the later increase in BOLD signal likewise, could be located close to the neuronal tissue activated. Furthermore, the CBV response seems to be similarly spatially specific in its early phase only (Sheth et al. 2004a). Thus timing could be more critical than aetiology with respect to hemodynamic response spatial specificity.
The relationship between the neuronal electrical activity and the associated hemodynamic response has only recently been studied with more direct measurements. A certain degree of correlation has been found between axonal firing rates of neurons and the hemodynamic response (Logothetis et al. 2001; Rees et al. 2000; Smith et al. 2005). Logothetis et al. (2001) simultaneously recorded hemodynamic signals and electrical activity of the neurons in anesthetized non-human primates. They found that the local field potentials (LFP), which mostly reflect the synaptic activity of neurons is a better predictor of the BOLD signal than the multiple-unit spiking activity (MUA) reflecting the action potentials. Therefore BOLD may reflect a more local processing in a given region rather than the output. Recently it was observed that a decrease in neuronal activity as reflected by LFPs, is associated with a decrease in BOLD signal (Shmuel et al. 2006). Furthermore, the neuronal activity, as reflected in high-frequency

25
gamma-band LFPs (40–130 Hz) (Mukamel et al. 2005; Niessing et al. 2005), is positively and strongly correlated with the hemodynamic response. Contradictory results occur at lower frequencies. While Mukamel et al. (2005) reported that the low frequency activity at the alpha (5–15 Hz) range was negatively correlated to hemodynamic response amplitude, Niessing et al. (2005) found a positive correlation. Additionally, Niessing et al. (2005) reported a negative correlation of hemodynamic response and delta band (0–3 Hz) LFP. Spiking activity may in some circumstances be tightly correlated to BOLD signal (Mukamel et al. 2005). Dissociation of hemodynamic response and spiking, however, has been demonstrated (Mathiesen et al. 1998; Mathiesen et al. 2000). It remains to be investigated how the correlation of spiking with hemodynamic response is related to excitatory or inhibitory synaptic activity (reflected by LFP), which may in turn influence the firing rate of neurons.
Currently the most widely used neuroimaging analysis methods for BOLD fMRI assume that BOLD response is linearly and time-invariantly dependent on the underlying neuronal activity (Boynton et al. 1996; Dale and Buckner 1997; Friston et al. 1995b). This assumption holds, however, only within certain ranges of the time scale. A measured response to a stimulus with extended duration is smaller than predicted on the basis of a response to a shorter duration stimulus (Birn et al. 2001; Glover 1999; Robson et al. 1998; Vazquez and Noll 1998). This non-linearity is most pronounced when a stimulus with durations less than four seconds is used to predict a response to stimulus with duration of more than six seconds. When both short- and long-duration stimuli are longer than four seconds the non-linearity is less severe. Also when stimuli occur in rapid succession BOLD responses to them do not sum up linearly (Boynton et al. 1996; Buckner 1998; Huettel and McCarthy 2001). Indeed, while Logothetis et al. (2001) found a linear relationship between neuronal activity and BOLD signal, recent results point to a non-linear relationship following a power law (Devor et al. 2003; Sheth et al. 2004b). It has been observed that the linearity of the neurovascular coupling critically depends on the stimulation paradigm and that the CBV response follows linearity more faithfully than the oxygenation dependent signal (Nemoto et al. 2004). A point hemodynamic response may not only depend on the activity of immediately adjacent neurones, but also on the influence of a broader surrounding area (Devor et al. 2003).

26
2.3.3. MRI contrast mechanisms for detection of brain activation
During brain activation blood flow, volume and blood oxygenation change locally and all of these parameters have been exploited in the measurement and localization of brain activation with MRI. In the very first human fMRI experiment, mapping of changes in blood volume was utilized to show primary visual cortex activation (Belliveau et al. 1991). The contrast was created by a bolus injection of gadolinium contrast medium. The area under the time-concentration curve is proportional to blood volume. Blood flow can be measured using a similar procedure. Arterial spin labelling has been used to map blood flow without the use of an exogenous contrast agent (Kwong et al. 1992; Wang et al. 2005; Williams et al. 1992). A technique for blood volume mapping without the need of exogenous contrast agent has been introduced as well (Lu et al. 2003).
By far the most common approach to measure the hemodynamic response to neural activation is the BOLD signal change. This method exploits the difference in the magnetic susceptibility of deoxy- and oxyhemoglobin (Pauling and Coryell 1936). Deoxyhemoglobin is more paramagnetic and contributes to a local magnetic field gradient around the vessel. This gradient will lead to faster dephasing of the spins and thus to a shorter T2*. The decrease of deoxyhemoglobin concentration in the capillaries and venules draining the activated cortex will decrease this effect and increase the signal in T2*-weighted images. Since the realisation that this contrast mechanism could be used to follow local blood oxygenation in real time with the fast MR imaging techniques that had become available (Ogawa et al. 1990), it was soon applied to imaging hemodynamic responses in the human brain under sensory stimulation (Bandettini et al. 1992; Frahm et al. 1992; Kwong et al. 1992; Ogawa et al. 1992).
One of the drawbacks of both T2- and T2*-contrast based fMRI is the localization of the effect predominantly to larger-calibre veins away from the vicinity of the activated cortex (Lai et al. 1993; Oja et al. 1999). The contribution of extra- and intravascular compartments to BOLD contrast depends of the magnetic field strength with more intravascular contribution in lower fields (Gati et al. 1997). The blood flow and blood volume based techniques may provide a better spatial specificity (Culver et al. 2005; Lu et al. 2003). Unfortunately, their contrast-to-noise ratio is approximately a third of that of the BOLD technique (Lu et al. 2003). This is likely the main reason for the currently limited use of flow- and volume-based techniques.

27
2.3.4. Data analysis
fMRI data is invariably corrupted by motion, which may generate signal changes resembling brain activation induced effects and is thus a severe confound especially when correlated with the experimental paradigm (Hajnal et al. 1994). The signal changes are not only due to voxel shifts inducing image intensity changes, but also due to the spin excitation history effects (Friston et al. 1996) and movement-susceptibility interactions (Andersson et al. 2001). Even if the subject’s head could be completely immobilized by use of e.g. stereotactic fixation, a procedure not commonly feasible due to potential subject compliance problems, pulsatile motions following cardiac and respiratory cycles will remain (Dagli et al. 1999; Hu et al. 1995). Commonly the images in a time series are realigned by means of image intensity based registration techniques to reduce motion-induced changes in the voxel signal intensity (Jenkinson et al. 2002). fMRI data contains low frequency drifts (Smith et al. 1999) that are either dealt with by modelling or filtering them out with a high-pass filter.
A wide range of statistical tests have been proposed for use in the analysis of fMRI time series. Initially common techniques simply tested for a difference between signal intensity values in control and activation conditions. These kinds of approaches fail to accurately take into account the shape of the response. The proposal of a calculation for correlation ratio between an empirically derived expected response model and the actual measured time course data soon occurred (Bandettini et al. 1993). Presently, the most common approach is the framework of general linear model (Friston et al. 1995a), which includes as a special case the t-test and correlation analysis used in many early fMRI studies. The expected neuronal responses are used as regressors and they are convoluted with an empirically derived hemodynamic response function (Glover 1999). In study II we employed a non-parametric Kolmogorov–Smirnov test was employed. This test has been used fairly extensively in the past, but has since received critique on not accounting for the temporal autocorrelations and thus giving higher false positive rates than the nominal rates (Aguirre et al. 1998a). Notably the subtraction t-test and correlation analysis are still commonly offered as a method of analysis in the present clinical scanner software environments.
In the general linear model framework the time series is modelled with a linear regression model:
eXy += β (11)
28
where y is the vector of measured signals, X is the design matrix characterizing the regressors, and β is the vector of the estimated parameters. The model error is e. The residuals for fMRI time series contain temporal autocorrelations, which must be taken into account (Friston et al. 1995a; Woolrich et al. 2001; Worsley and Friston 1995). Otherwise the false positive rate is deflated. A number of approaches have been proposed for the whitening (i.e. removal of autocorrelations) of fMRI data.
The resulting statistical parameter maps are segmented to activated and non-activated areas. Most commonly this is carried out by intensity thresholding. It is usually desirable to control the family wise error rate, the probability of at least one false activation detected in the search volume. Alternatively, an approach has been proposed that aims at controlling the proportion of false positives in the thresholded maps (false discovery rate, Genovese et al. 2002). To achieve the desired family wise error rate or false discovery rate a suitable threshold must be found.
The data analysis of fMRI time series data is usually performed in a massively univariate fashion. One temporal sampling point, a 3D image volume, commonly consists of more than 10000 voxels. This results in a severe need to make correction for multiple comparisons when controlling the family wise error rate. Earlier this was commonly performed by the Bonferroni correction, which adjusts the threshold by dividing it with the number of tests performed. This leads to very conservative tests as the maps are spatially correlated and essentially have fewer independent elements (resolution elements or resels, Worsley et al. 1996) than the number of voxels in the image volume. Consequently, methods that take into account the extent of the activation have been developed to improve sensitivity. A methodology defined within the framework of Gaussian random field theory (Worsley et al. 1996) is currently the most widely used approach. To improve the signal-to-noise ratio of the statistical images and validity of the Gaussian random field based inference, the statistical images are smoothed with a Gaussian filter. The drawback is loss of spatial detail. One can also approach the problems associated with multiple testing by using anatomical physiological a priori information restricting the testing to predefined regions.
Apart from the extent of thresholded activation clusters the use the intensity information of neighbouring voxels is possible. Markov random fields allow modelling of interactions between neighbouring voxels and have been widely used in computer vision. Spatial mixture models are used in tissue classification of medical images and they have also been proposed for classification of fMRI activation maps (Everitt and Bullmore 1999; Hartvig and Jensen 2000; Woolrich et al. 2005). There they are used to

29
model the distributions of statistic image values belonging to either non-activated or activated classes. Neighbourhood information could also be used in segmenting statistic images (i.e. hypothesis testing) without building a model of the distributions of image intensities in the activated and non-activated classes. Salli et al. (2001a) proposed this kind of Markov random field based method. In study III we tested the reproducibility of motor activation patterns obtained with this method and compared it to the Bonferroni correction and Gaussian random field theory-based thresholding. Finally, we applied contextual clustering in the analysis of fMRI data from patients in study IV.
2.4. Comparison and integration of MEG and fMRI
2.4.1. Spatial and temporal resolution
MEG suffers from the non-uniqueness of the electromagnetic inverse problem solution, i.e. an infinite number of source configurations may equally well explain the measured set of signals. Particularly when a priori assumption that multiple cortical areas are not simultaneously active can be made, this ambiguity is avoided (Hämäläinen et al. 1993). In ideal conditions, for example when locating the activity artificially generated within a phantom, even an accuracy of 1 mm can be reached with MEG (Gharib et al. 1995), while in practical applications an accuracy on the order of 5 mm is possible (Crouzeix et al. 1999; Hämäläinen and Sarvas 1989; Virtanen et al. 1998). Typical resolution in fMRI studies of presurgical mapping has ranged from 3 to 4 mm in a plane with a slice thickness of 5 to 6 mm (Yoo et al. 2004). At its best, fMRI may resolve brain activity at the cortical column level (Kim et al. 2000).
Both methods are susceptible to registration errors, when the functional information is brought into alignment with structural images. In MEG the identification of external landmarks can be error prone. This may be alleviated by use of surface fitting or use of stereotactic fixation of the head (Singh et al. 1997).
In MRI both the structural images and especially the functional images are spatially distorted arising from gradient non-linearities and magnetic field inhomogeneities (Jezzard and Clare 1999). The distortions are most severe in the vicinity of tissue boundaries with large magnetic susceptibility differences (i.e. in orbitofrontal and temporal areas, Ojemann et al. 1997). The susceptibility induced distortions are more pronounced in the phase encoding direction especially in the case of echo-planar imaging and become more severe as the field strength increases. By acquiring maps of magnetic field variation, these distortions can be to some extent compensated for

30
(Jezzard and Balaban 1995). After this correction a certain amount of time varying distortion from head movement interactions with the magnetic fields still remain. Andesson et al. (2001) presented an approach to correct for this effect.
In the clinical context MEG and fMRI have usually been compared to intraoperative electrophysiological mapping results, which have served as a gold standard for delineating functional areas. They provide useful functional information for perioperative decision making (Duffau et al. 2003). Electrical stimulation may be used to elicit motor responses or suppress the normal function of a cortical area thus producing a temporary functional deficit. Evoked potentials may be recorded epi- and transcortically. Polarity reversals between recoding electrode sites can be used to make inferences about generator sites of evoked responses. Quantitative comparisons to non-invasive mapping results pose some problems, however (Hill et al. 2000). The brain will elastically deform when the skull is opened during an operation. Several strategies have been proposed for dealing with this mismatch between pre- and intraoperative states (Carter et al. 2005). The locality of electrical stimulation is dependent on the type of electrode used as well as stimulus intensity. When interpreting the invasively measured evoked potentials the limitations brought by the non-uniqueness of the electromagnetic inverse problem are similarly present as in recording outside the skull. Intracellular single unit and multiunit activity measurements are spatially the most fine-grained methods for measurement for neuronal activity (Engel et al. 2005). They can be combined with microdialysis for measurement of neurochemical substances in the extracellular space (Fried et al. 1999).
MEG can easily follow neuronal activity in the millisecond range. The hemodynamic response usually has a timescale of a few seconds to tens of seconds. The signal is commonly sampled at intervals of approximately three seconds, if whole brain coverage is desired. By suitably arranging the experimental setup so that the expected hemodynamic response is shifted (jittered) with respect to image acquisition time, it is possible to get samples of the response at finer timescale. It has been argued that by observing response onset delays it is possible to separate response onset differences as small as 20 ms (Menon et al. 1998). Additionally it has been suggested that by observing amplitude modulations of the BOLD signal introduced by interactions between stimuli one can observe fast vents down to time scale of tens of milliseconds (Ogawa et al. 2000). These approaches are, however, limited to specific experimental setups. Even then, the temporal resolution of EEG and MEG is an order of magnitude better. In conventional fMRI experimental settings, the activation detected represents temporally integrated activity over a period of several seconds.

31
2.4.2. Spatial correspondence
Agreement in localization of MI between MEG and fMRI has been quantified for motor tasks in normal subjects and surgical patients. The mean difference in localization in normal subjects has ranged from 10–16 mm (Beisteiner et al. 1997; Sanders et al. 1996; Stippich et al. 1998). Beinsteiner et al. (1997) noticed a wide range of distances between MEG and fMRI (5–85 mm) depending on the method used for delineation of fMRI activation. Exclusion of large amplitude signals in fMRI markedly decreased the differences. Their conclusion was that the large amplitude signals likely represented veins draining the activated cortex. This effect is a well-known source of spatial error in BOLD fMRI (Lai et al. 1993; Turner 2002).
The localization agreement between the two methods concerning SI, primary auditory (Stippich et al. 1998; Tuunanen et al. 2003) and visual cortices (Moradi et al. 2003) localization agreement has been in similar ranges (3–18, 5–25 and 3–5 mm respectively). This was also the case for higher order visual areas participating in motion processing (8–22 mm) (Ahlfors et al. 1999).
All of the MEG studies looking at the spatial correspondence with fMRI have used ECD models. Vitacco et al. (2002) studied the correspondence of a distributed EEG source model (LORETA) and fMRI activation maps. At the group level a reasonable agreement was obtained between the activation patterns. At the individual level, only half of the subjects showed spatial correspondence in the activation pattern.
2.4.3. Approaches to combine information from MEG and fMRI
Horwitz and Poeppel (2002) separated three categories of approaches in combining information from electrophysiological and hemodynamic neuroimaging methods. The first is to use information from independent measurements as converging evidence in support of a hypothesis. In the clinical context an example of this approach would be localisation of a functional landmark independently by fMRI and MEG. A converging localisation result could give reassurance in making clinical treatment decisions (Inoue et al. 1999; Roberts and Rowley 1997). Data from two modalities measuring different manifestations of neuronal processing can provide complementary information, when the data are not directly fused, but inferences on the location and timing of the activity are made independently from each modality (Mangun et al. 1998; Northoff et al. 2000)
The second approach is data fusion where spatial information is obtained from the spatially more accurate imaging modality and temporal information is derived from the

32
temporally more accurate modality. This approach was first applied by combining PET and EEG (Heinze et al. 1994; Mangun et al. 1997; Nenov et al. 1991). fMRI activation foci may be used as seeds for a multidipole solution in MEG (Ahlfors et al. 1999). When using a distributed source model in MEG, the structural and functional information can be used to spatially bias the inverse solution towards areas activated in fMRI (Dale et al. 2000; Liu et al. 1998).
Notably, fMRI does not always show activation in areas where evoked field patterns consistently suggest activation (Ahlfors et al. 1999). Whether these cases reflect true absence of a hemodynamic response in an source area for an evoked field, insufficient signal to noise ratio, or a problem in inverse modelling of neuromagnetic fields is presently unclear. The relationship between the hemodynamic events and electrical activity is still incompletely understood and therefore precautions are necessary when using the fMRI data in spatial biasing of the inverse solution. If the MEG inverse solution is strictly constrained using spatial a priori information that does not accurately reflect the underlying spatial distribution of neural activity, the result is likely not meaningful. The data fusion approaches need to take into account the possibility of mismatch between the information provided by the modalities that are fused together (Liu et al. 1998). One simple example of such a mismatch would be registration errors between MEG and fMRI coordinate spaces. Furthermore, limited sensitivity due to a susceptibility induced signal, loss, movement artefact, scanner noise, etc. could lead to failure in observing activation with fMRI.
The third approach proposed by Horwitz and Poeppel (2002) is the computational neural modelling which aims to construct a large-scale neural model capable of generating simulated MEG and fMRI data, which could be compared to experimental data. This bottom-up approach requires the making of explicit hypothesis about the mechanisms translating the brain activation at cellular level to signals measured at macroscopic scale and is consequently dependent on the correctness of the assumptions made.

33
2.5. fMRI and MEG in surgical planning for operations near SMI
Neurosurgical procedures are associated with a risk of causing dysfunction by damaging functionally important structures adjacent to the operation target areas. Detailed information about cerebral functional anatomy is required to minimize iatrogenic injuries. Aside from reducing human suffering this has significant economical importance, as rehabilitation and care after impairment of motor or any other function vital in daily life are costly.
Cerebral lesions may distort the local anatomy of the brain and impair delineation of functional anatomy based on anatomical landmarks alone. For example, in the identification of the central sulcus based on anatomical landmark criteria, inter-observer discordance can be as high as 24% (Sobel et al. 1993). Furthermore, an expansive lesion may lead to functional reorganization and alter the topographical organization of the cortex (Vates et al. 2002; Wunderlich et al. 1998). Characterization of the functional anatomy in the region of interest in candidates for neurosurgery is therefore important.
Invasive functional mapping techniques, such as cortical stimulation and electrocorticography, are valuable as perioperative guidance and may aid in reducing surgical risks (Duffau et al. 2003). Planning and risk assessment of therapeutic procedures, however, would greatly benefit from non-invasive preoperative information on functional anatomy. Current functional neuroimaging methods, such as MEG, fMRI, PET, EEG, and TMS may provide information for such purposes and surpass the accuracy of expert judgment based on anatomical criteria (Towle et al. 2003).
Of these methods, especially MEG and fMRI have been a focus of interest. For central sulcus localization, MEG and fMRI have been compared in a clinically (Ganslandt et al. 1999; Inoue et al. 1999; Kamada et al. 2003; Kober et al. 2001). While the two methods have mostly been consistent with each other and invasive cortical mapping, discrepancies also exist (Inoue et al. 1999). In 11 previous studies (Gallen et al. 1995; Ganslandt et al. 1999; Inoue et al. 1999; Kamada et al. 2003; Kober et al. 2001; Mäkelä et al. 2001; Rezai et al. 1996; Schiffbauer et al. 2002; Sobel et al. 1993; Sutherling et al. 1988), where altogether 175 SMI locations obtained with MEG were verified against intraoperative mapping, not a single inconsistent localization result was reported. Also, in previous studies utilizing fMRI to locate SMI, in most cases, a good agreement with invasive mapping occurs. In 19 of 22 reports that we considered (Ganslandt et al. 1999; Hirsch et al. 2000; Holodny et al. 2000; Jack et al. 1994; Kamada et al. 2003; Kober et

34
al. 2001; Krings et al. 1997; Krings et al. 2001; Krings et al. 2002; Lehéricy et al. 2000; Mueller et al. 1996; Puce et al. 1995; Pujol et al. 1998; Roux et al. 1999; Schulder et al. 1998; Towle et al. 2003; Yetkin et al. 1997; Yousry et al. 1995; Yousry et al. 1996), an agreement with intraoperative electrophysiological methods in all 266 cases existed. Discrepancies were reported in three studies. In the study by Pujol et al. (1996), activation arising from “wide-spread areas” in one of the four patients made the accurate identification of the primary sensorimotor cortex using fMRI impossible. Inoue et al. (Inoue et al. 1999) studied five subjects using fMRI, MEG and intraoperative cortical stimulation. In fMRI, postcentral sulcus activation was dominant in two cases in which MEG localization was consistent with intraoperative localization. In their study on 11 patients, Fandino et al. (1999) reported two cases with no correlation between fMRI and cortical stimulation results. Moreover, Yousry et al. (1996) found that while the venous BOLD signal change within the central sulcus provided a consistent and reliable landmark, the parenchymal activation was often also found in the postcentral sulcus. In one case, parenchymal activation occurred exclusively in the postcentral sulcus.
Due to patient movement, reports exist of occasional failures to detect, with fMRI, activation at SMI altogether (Hirsch et al. 2000; Krings et al. 2001; Pujol et al. 1998; Roberts and Rowley 1997). For example, in one clinical study comprising 194 patients, motor regions could not be identified in 15% of the investigations, motion artefacts being the most common cause of failure (Krings et al. 2001). On rare occasions, MEG recordings have failed because of magnetic artefacts generated by dental implants (Ganslandt et al. 1999; Kober et al. 2001). Schiffbauer et al. (2002) reported success rates of 97% for hand, 90% for lip, and 82% for toe somatosensory representation localization. Some authors have recommended performing preoperative mapping with both of these methods, if feasible, to ensure a technically successful localization result and to increase confidence in the results by convergence (Inoue et al. 1999; Roberts and Rowley 1997).
For the localization of the central sulcus with MEG, identification of SI with electrical stimulation of a peripheral nerve has been the method of choice. A motor task for primary motor cortex localization has usually been employed in fMRI. This difference in the experimental paradigms has largely been dictated by practical reasons in an attempt to optimize the signal-to-noise ratio; in fMRI a motor task usually yields stronger activation than a sensory stimulus (Puce et al. 1995; Roberts and Rowley 1997), while in MEG the reverse is usually true. Currently there does not seem to be a consensus over the type of motor paradigm to be employed for primary motor cortex
35
localization. Motor tasks have included hand clenching and finger tapping as well as extension and flexion of the fingers.
Diverse statistical tests have been used in the previous clinical studies. Most commonly, the t-test (Puce et al. 1995; Pujol et al. 1996; Pujol et al. 1998) or correlation-test (Fandino et al. 1999; Ganslandt et al. 1999; Holodny et al. 2000; Inoue et al. 1999; Kamada et al. 2003; Kober et al. 2001; Lehéricy et al. 2000; Mueller et al. 1996; Schulder et al. 1998) have been employed. These are both special cases of the general linear model framework (Friston et al. 1995b) that is currently the most commonly used statistical approach in the analysis of BOLD fMRI data. Non-parametric tests such as Mann–Whitney U-test (Yousry et al. 1995; Yousry et al. 1996) and Kolmogorov–Smirnov test (Krings et al. 1997; Krings et al. 2001; Krings et al. 2002) have also been employed. Finally and probably most importantly, varying methods were used for classification of voxels in activated and non-activated classes. Most often, the statistical images were thresholded at some statistical significance level, which varied between the studies (Fandino et al. 1999; Ganslandt et al. 1999; Holodny et al. 2000; Inoue et al. 1999; Kamada et al. 2003; Kober et al. 2001; Krings et al. 1997; Krings et al. 2001; Krings et al. 2002; Lehéricy et al. 2000; Mueller et al. 1996; Puce et al. 1995; Pujol et al. 1996; Pujol et al. 1998; Schulder et al. 1998; Yetkin et al. 1997; Yousry et al. 1995; Yousry et al. 1996). Some studies also used activation cluster size criteria (Lehéricy et al. 2000; Pujol et al. 1996; Pujol et al. 1998). The activation segmentation technique used in studies III and IV is more sensitive than the thresholding (Salli et al. 2001a).

36
3. Aims
Our aim was first to assess the feasibility of using spatial information provided by fMRI as a priori information in the modelling of the sources of cerebral neuromagnetic activity. Second, we aimed at comparing fMRI and MEG in a clinical setting in order to assess whether the differences in the inherent properties of the methods have an impact on their application in presurgical planning. Specific aims of the studies I–IV were:
I To characterize long-latency neuromagnetic responses arising from the primary sensorimotor cortex ipsilateral to somatosensory stimulation.
II To compare the results from MEG dipole modelling to those obtained with fMRI and to use the spatial information from fMRI as a spatial constraint for a multidipole model of the same data. The spatiotemporal model obtained is compared with the results of invasive electrophysiological studies reported in the literature.
III To test the hypothesis testing method to be used in study IV, in the analysis of hemodynamic responses to motor task performance. To assess the impact of the use of neighbourhood information in the segmentation of fMRI statistical images on the reproducibility of the results. We hypothesised that the use of neighbourhood information would increase robustness to noise and thus improve reproducibility.
IV To compare fMRI and MEG in the preoperative localization of the primary sensorimotor cortex.
37
4. Methods
4.1. Subjects
Ten healthy right-handed volunteers participated in study I. Of these, five also participated in study II. In study III we studied one male right-handed subject. In study IV we included 15 patients with brain tumours.
Informed consent was obtained from all subjects and the ethical committee of the Department of Radiology at the Helsinki University Central Hospital approved the study protocols.
4.2. MEG acquisition and analysis
4.2.1. Data acquisition and experimental setup
We acquired MEG data for studies I and II were acquired in the BioMag Laboratory at the Helsinki University Central Hospital with a 122-channel helmet-shaped planar gradiometer (Neuromag-122™, Elekta Neuromag Ltd., Finland, see Figure 5). The signals were digitally band-pass filtered between 0.03–310 Hz and sampled at 942 Hz. MEG data for study IV was acquired at the Low Temperature Laboratory of the Helsinki University of Technology using a 122- or 306-channel magnetometer (Neuromag-122™ and Vectorview, Elekta Neuromag Ltd., Finland). MEG signals were band-pass filtered between 0.3 and 310 Hz and sampled at 912 Hz.
The sweep duration was 550 ms including a 150-ms prestimulus baseline. We discarded epochs containing amplitudes exceeding 3000 fT/cm in MEG channels or 150 µV in electro-oculogram channels were discarded.
The subjects sat in a chair and watched a video, while the right median nerve was stimulation at the wrist with 0.2-ms constant-voltage pulses occured. Stimulus intensity was always adjusted to be slightly above the motor threshold. In study I, we collected two sets of 200 responses at five interstimulus intervals (ISI, 0.15, 0.3, 1.3 and 5 s). The MEG data from the subset of five subjects acquired with the ISI of 5s was used in study II where we compared MEG and fMRI data. In study IV, the interstimulus interval was 0.5 s. The median nerve contralateral to the lesion was stimulated and about 200 epochs were averaged.

38
In study I, in order to inspect the reproducibility of the ipsilateral responses, we re-studied the five subjects showing these responses. Responses to electrical left median nerve stimulation were recorded similarly in these subjects. Additionally, SEFs were recorded from two subjects while they executed a finger opposition task separately with the right and left hand. The task consisted of self-paced touching of the tips of fingers II to V sequentially with the thumb.
4.2.2. MEG data analysis
Source modelling was performed using software provided by Neuromag (Elekta Neuromag Ltd., Helsinki, Finland). An ECD was used to model the source currents that generated the measured MEG signals. We accepted only ECDs explaining more than 80% of the field variance as valid models. The dipoles were fitted to signals from a local subset of gradiometer channels (30 in study I, 16–58 in II, 27–44 in IV) covering the maxima of the dipolar field pattern.
4.3. MRI acquisition and analysis
4.3.1. Image acquisition and experimental setup
MRI was performed using the 1.5-T Siemens Vision system (Siemens, Erlangen, Germany) at the Helsinki University Central Hospital. A standard head coil was used.
A T1-weighted structural image (160 to 190 1 mm thick sagittal slices) was acquired from all subjects with a three-dimensional magnetisation prepared rapid gradient echo sequence with field of view (FoV) 256 mm, matrix 256×256, repetition time (TR) 9.7 ms, echo time (TE) 4 ms, inversion time (TI) 20 ms and flip angle 10°. For study IV, this image set was also acquired after administration of a gadolinium
m contrast agent. This image was used for creating a volume rendering exhibiting the cortical veins to be used in perioperative visual identification of structures.
For study II, two time series of 120 gradient-echo echo-planar images were acquired (16 transaxial 5 mm thick slices without a gap between slices, FoV 256 mm, matrix 128×128, TR 3500 ms, TE 76 ms except 66 ms for one subject, flip angle 90°). During the acquisition of these images the right median nerve was electrically stimulated with 0.2 ms constant voltage pulses at 4 Hz rate for the duration of 10 image volume acquisitions, interlaced with no stimulation for the duration of 10 image volume acquisitions.

39
For study III, a series of 120 gradient-echo echo-planar images (16 transaxial 3 mm thick slices with a gap of 1 mm between slices, FoV 256 mm, matrix 64×64, TR 2083 ms, TE 70 ms, flip angle 90°) was acquired four times with a motor task and 12 times without any task (null condition). The motor task in study III was flexing the right wrist for the duration of 8 scans alternating with a rest condition, which lasted for the duration of 15 scans.
For the study IV, a series of 91 to 128 volumes of gradient-echo echo-planar images (16 transaxial 3 mm thick slices with a gap of 1 mm between slices, FoV 256 mm, matrix 128×128, TR 3500 ms, TE 70 ms, flip angle 90°) was acquired. The subjects performed a motor task (flexion of the wrist) consisting of blocks of task execution for the duration of 10 scans alternating with blocks of rest for the duration of 10 scans.
4.3.2. Functional MRI data analysis
4.3.2.1. Software
We performed the study II fMRI data analysis of using software from Massachusetts General Hospital (XDS, Timothy L. Davis, Massachusetts General Hospital NMR Center). The software for spatial resampling of fMRI activation maps to anatomical image coordinate space was written in C language by Eero Salli and Hanna Pohjonen. The software for segmentation of the activation maps with k-means clustering algorithm was modified by the author of this dissertation and Eero Salli from a public domain Matlab (MathWorks Inc., Natick, MA, USA) source code.
For study III the data were processed using SPM99 software from Wellcome Institute of Neurology (http://www.fil.ion.ucl.ac.uk/spm/) and software implementing the contextual clustering algorithm was created by Eero Salli by using Matlab.
The data analysis in study IV was performed using software tools from the FSL package from Oxford Centre for Functional Magnetic Resonance Imaging of the Brain (http://www.fmrib.ox.ac.uk/fsl/) and the contextual clustering algorithm was implemented in Python programming language (http://www.python.org/) by the author of this dissertation.
4.3.2.2. Pre-processing
To allow time for longitudinal magnetization to reach a steady state and the subject to accommodate to the noisy scanner environment, in studies II and IV, we discarded the first 2 scans from the analysis. In study III, we discarded the first 8 functional scans.
40
In study II no spatial pre-processing was applied. The time series were inspected visually for motion by viewing them in a cine-loop. Two subjects were imaged in a second session since the original data was visibly corrupted by motion. In studies III and IV the image volumes of the functional image time series were realigned to correct for head movement during image acquisition.
In study III, spatial smoothing was performed as an alternative stage of the data analysis as explained later (see Statistical analysis). Spatial filtering was applied using a Gaussian filter with a full width at half maximum of 8 mm in all three orthogonal directions. Temporal filtering was performed within the linear modelling (see Statistical analysis).
In study IV, to remove low frequency baseline drifts from the time series we performed temporal filtering with a local fitting of a straight line with Gaussian weighting (Marchini and Ripley 2000).
4.3.2.3. Statistical analysis
We analysed data from study II using non-parametric statistics with the Kolmogorov–Smirnov test. The resulting statistical parameter maps were thresholded at p=10−6 to correct for multiple comparisons (Bonferroni correction, see 4.3.2.3.1).
In study III and IV, the general linear model framework was used in statistical testing. The neuronal input function was modelled with a boxcar function that followed the experimental paradigm. This hemodynamic response model was convolved with a canonical hemodynamic response function consisting of a combination of two gamma functions with default parameters of SPM99. The hemodynamic response function models the shape of the response as well as the delay of onset of the hemodynamic response after the neuronal activity starts. In study III, this model included a set of cosine basis functions, which model the slow frequency drifts commonly found in fMRI time series. They effectively acted as a high pass filter with cut-off period of 42, 62, 83, 104 and 125 s. The cut-off period was chosen according to the block length of the design used in the analysis. In study IV, the high pass filtering was already performed at the pre-processing stage (see 4.3.2.2).
In study III the data were processed using three different approaches: 1. Statistical parametric maps were computed from a spatially unsmoothed data and thresholded using a Bonferroni-corrected threshold, 2. The maps were computed from spatially unsmoothed data but were segmented into non-active and active regions using a spatial

41
contextual clustering method, 3. The statistical parametric maps were computed from spatially smoothed data and thresholded, optionally using a spatial extent threshold. The t-maps were transformed into z-maps prior to the segmentation or thresholding step.
4.3.2.3.1. Bonferroni correction
Bonferroni correction gives a conservative intensity threshold. To get an approximate false positive rate p for the whole volume the threshold is calculated by dividing p with the number of voxels within the brain and further by finding the corresponding z value for normal distribution. In study I the estimated number of brain voxels was 10000 and a desired false positive rate 1 %, resulting in p threshold 10−6. In study III the calculated number of voxels was 12000. The desired false positive rate was set at 5%, thus resulting in a z threshold of 4.46.
4.3.2.3.2. Contextual clustering algorithm
The contextual clustering algorithm introduced by Salli et al. (2001a) proceeds as follows. The statistical image is first thresholded at a chosen threshold level Tcc:
ccTzi > (12)
here zi is the z-statistic value of ith voxel. This step yields an initial classification of voxels into two classes: activated and not activated respective to whether these voxels show a signal change indicating brain activation or not. Voxels outside the brain are forced to belong to the non-activated class by assigning a very small (−1000) z-value to them. Thereafter a reclassification of the image is performed. A voxel with value zi is classified as activated if:
ccn
icc
i 2TNu
Tz >⎟
⎠⎞
⎜⎝⎛ −+
β (13)
the constant Nn is the number of neighbours in the neighbourhood system (26 in this study). Variable u is the number of voxels currently classified to the activated class within the neighbourhood of the voxel i. The parameter β determines the amount of weighting of the information from the neighbouring voxels. We defined β as
s
T 2cc=β (14)
42
where s is a tuning parameter for adjusting the weighting of the neighbourhood information. Written in this form s can be defined as the number by which the number of voxels in the activated class in the neighbourhood must exceed those belonging to the non-activated class in order to raise a voxel with a z-value zero to the level Tcc.
The image is then repeatedly reclassified using rule (7) until the classification does not change or starts to oscillate between two states. During every iteration, the classification and ui are updated.
We chose the study III segmentation parameters so that the family wise error rate would be approximately 5%. In order to find a suitable set of combinations of parameters for the contextual clustering algorithm, we tested a range of parameters by segmenting z-maps generated randomly (16×16×16 voxels). The segmentation was repeated several times in order to find a false positive rate for different combinations of Tcc and s.
From these results two parameter combinations were more closely validated. For this purpose we created larger statistic images (64×64×16 voxels) filled with random values drawn from normal distribution. In order to simulate the spatial autocorrelations in real fMRI data, the Pearson correlation coefficients between neighbouring voxels in the three orthogonal directions were calculated for the first time series acquired during the null condition (no task). We filtered the simulated statistical images with a Gaussian filter with a standard deviation of 0.5 voxels, in order to obtain a similar spatial autocorrelation. The simulated statistical images were normalized to a unit variance. We also used unfiltered simulated statistical images with both large (64×64×64) and small (16×16×16) matrices.
Segmentation was performed on 15000 simulated statistical images of each of the three types described above using the two previously selected parameter combinations (T=1.44, s=6 and β=1.07, s=4) to obtain the false positive rates.
Based on results obtained in study III, for study IV we chose the parameter combination T=1.6 and s=6, which appeared to give both reasonable control over false positive rate and a good trade-off between sensitivity and delineation accuracy. An empirical family wise error rate was obtained by segmenting 10000 statistical images with values drawn from standard distribution. The values were filled within a brain mask, generated from the echo-planar image of the patient with largest brain volume, created by thresholding an echo-planar image.
43
4.3.2.3.3. Gaussian random field based thresholding
The SPM99 software allows definition of a spatial extent threshold that was set either to zero or eight voxels. This is the minimum number of voxels within a cluster required, in order for it to be considered to represent an activated brain region. Thereafter we searched for an intensity threshold that allowed for the first data set acquired under null condition (no task), from study III, to have the corrected p value of 0.05.
4.3.2.3.4. Evaluation of false positive rates
The empirical false positive rates were determined by analyzing the null data with 24 different design matrices (block lengths of 5, 10 or 15 images).
4.3.2.3.5. Evaluation of sensitivity and segmentation accuracy
In order to precisely know the true activation pattern we used an activation phantom (see Figure 2, in publication III, page 461) embedded in the first data set acquired under null condition (study III). Thus, a computer generated activation time series with a known spatial shape was added to real human brain image series. The phantom represented a signal increase of either 2.5% or 5%. The percentage of phantom voxels detected was calculated as a measure of sensitivity. The number of false positive voxels was used to measure the segmentation accuracy. Analysis was done either on the whole time series (full data) or the first 60 image volumes (half data).
4.3.2.3.6. Evaluation of reproducibility
In study III four repetitions of the experiment were compared by creating a reliability map as termed by Genovese et al. (1997). In this map the classification images (activated vs. not activated) from each repetition were summed and the voxel value in the image thus represents the number of repetitionsin the study where the voxel was classified as representing activated brain region.
4.4. Intraoperative cortical mapping
The cortical functional anatomy of the 15 tumour patients was mapped using the epicortical SEP recording and/or electric stimulation of the cortex, while being operated on under light anaesthesia that permitted them to remain awake. Thus, the patient could report the sensations produced by cortical stimulation. A neuropsychologist monitored motor responses and dysfunctions, such as speech arrest evoked by electric stimulation of the cortex.

44
The stimulation and recording were performed using an 8-channel Viking IV device (Nicolet Biomedical Inc., Madison, WI, USA). For the SEP recording, the median nerve was stimulated at the wrist with 0.2 ms constant-current pulses at 4 Hz, the stimulus intensity exceeding the motor threshold. Responses were recorded from the first two rows of a 4×5-electrode grid (spacing 3 mm; PMT Inc., Chanhassen, MN, USA, see Figure 7) with 6.5 mm diameter silver-silver chloride electrodes (Figure 7). A reference needle electrode was inserted in the temporal muscle on the operated side. In cortical stimulation, we used50 Hz electric pulses (duration 0.2 ms, intensity 6–13 mA) were used.
4.5. Comparison and integration of MEG and MRI data
4.5.1. Co-registration of the functional imaging results to structural MRIs
For the purposes of visualization and spatial comparison, the MEG and the T1-weighted structural MRI set coordinate systems were aligned by using landmark-based registration, f. Locations of three anatomical landmarks, nasion and the pre-auricular points as well as three head position indicator coils were digitized with a 3D-digitizer (Polhemus, Inc., Colchester, VT, USA). The position of the head inside the magnetometer array was determined by letting a current pass through the head position indicator coils and measuring the induced magnetic field. The anatomical landmarks were then visually identified in the MR images. This produced an affine transformation, which could be used in coordinate space transformation from MEG space to MRI.
Figure 7. Surgical view during operation of a tumour patient. The sites stimulatedwere marked with numbered labels (A). An electrode grid (B) was used for the cortical SEP recordings.
A B

45
The fMRI statistical parameter maps were super positioned on the structural MR images by using the slice positioning information from the echo-planar image files in studies II, III, and IV. The thus obtained rigid body transformation was used in resampling the image to the same grid as the T1-weighted structural image. We employed nearest neighbour (studies II and III) and Hanning windowed sinc interpolation (study IV).
4.5.2. Comparison of the spatial agreement between fMRI and MEG
In study II the activation maps were segmented in to activation clusters by using a k-means clustering algorithm that minimized the squared sum of distances of voxels to the centre within a cluster. The Euclidian distance between centroids of these clusters and anatomically corresponding ECD locations were calculated.
In study IV our aim was to test the ability of fMRI and MEG to tell the central sulcus (SMI) from adjacent sulci. The reference information to which both methods were compared was the results of the intraoperative mapping. During the operation the central sulcus was delineated by either epicortical SEP (N=1), cortical stimulation (N=7), or by the combination of these methods (N=7). The 3D rendering of the cortical surface with cortical vessels overlaid, was compared with the view of area to be operated on. The location of the central sulcus was then visually determined on the computer-generated image. Thereafter it was determined on which sulcus the ECD and fMRI activation map maximum and the spatially largest fMRI activation fell. The two measurements were used as separate criteria for identification of the central sulcus. The Euclidian distance from the ECD to the nearest fMRI activation voxel served as a measurement of MEG and fMRI overlap.
4.5.2.1. Comparison of MEG, fMRI and intraoperative mapping results
In the SEPs, the central sulcus was identified by the phase reversal of the 20–25 ms response between the electrodes located frontally and parietally. During cortical stimulation, motor responses were monitored and subjects were requested to report their sensations. The central sulcus was identified as the sulcus posterior to the gyrus from which the stimulation elicited motor responses. The exposed cortex was photographed before and after the application of the tags, which identified the stimulated points, or the corticography electrode grid (Figure 4). For each patient in study IV we determined whether the sulcus identified by fMRI and MEG was the same as by the invasive measurements.

46
4.5.3. Construction of spatiotemporal model of somatosensory evoked responses
In study II, a spatiotemporal model of somatosensory evoked fields was constructed using eight spatially fixed equivalent current dipoles (ECD). Each dipole modelled the activity of one of the eight source areas, which were contra- and ipsilateral SMI, PO and AO as well as the contralateral PPC and the mesial SMA sources.
When that information was available we used the centroids of the fMRI activation areas as locations for these ECDs. As there were subjects who showed a clear indication of source areas in MEG that were not seen as fMRI activations, the location of the ECD was determined from MEG with a single dipole fit procedure for those sources.
The orientation of the dipole was allowed to vary during the multidipole fitting. We calculated a grand average over all subjects’ multidipole models.
47
5. Results and discussion
5.1. Neuronal generators of median nerve SEFs (Studies I, II)
5.1.1. Results
In study I, we observed dipolar field patterns over the ipsilateral (right) SMI after right median nerve stimulation indicating that it might be a cortical generator site to the somatosensory evoked fields in addition to the previously suggested cortical source areas. Such patterns could be observed in five of the ten subjects. The latency of the peak response ranged from 90 to 287 ms. The ipsilateral SMI responses were elicited only when the ISI was longer than 1 s.
The five subjects who exhibited ipsilateral SMI responses to right median nerve stimulation were further tested for occurrence of ipsilateral SMI responses to left-sided stimulation, but such responses were not found in any of these subjects.
Right-sided finger movements in the two subjects tested in this way abolished the ipsilateral responses. Left-sided finger movements did not have any effect on the ipsilateral SEFs from the right SMI.
In addition, we found evidence of activity arising from the four previously suggested cortical generator areas of somatosensory evoked fields: the contralateral SMI, the contralateral and ipsilateral opercular cortex, and the postcentral sulcus (PoCS). Responses from ipsilateral opercular cortex and PoCS were not observed in two of the subjects, while responses from the other two source areas were observed in all subjects.
In study II, the opercular source location was, however, unstable and shifted between two locations along the direction of Sylvian fissure. The posterior location corresponded to the secondary somatosensory cortex in the parietal operculum. The anterior location was in the frontal operculum and near insula. Anatomically matching activation patterns were found in fMRI. We therefore treated the opercular activity in MEG as arising from two separate source areas posterior (PO) and anterior operculum (AO).
In study II, those five subjects who showed ipsilateral SMI responses participated in the fMRI experiment where electrical stimulation of the right median nerve was applied. The network of cortical areas that was activated in the fMRI experiment was the same as indicated by MEG source modelling.

48
The pattern of activation was, however, not exactly the same at the individual level. MEG alone could not detect activation of PoCS in two subjects nor SMA in one subject, but fMRI did indicate activation of these areas in these subjects. In fMRI no statistically significant activation exists in the contralateral PoCS and ipsilateral SMI in one subject nor in the ipsilateral operculum in two subjects. MEG, however, indicated activation of the corresponding source areas. Thus, the activated areas reproducibly identified with both MEG or fMRI were SMI bilaterally, PoCS contralaterally, SMA medially, and AO and PO bilaterally.
5.1.2. Discussion
Our results agree with the previous studies using MEG and dipole modelling (Brenner et al. 1978; Forss et al. 1994; Forss et al. 1996; Hari et al. 1983; Hari et al. 1984; Mauguière et al. 1997a, b). Our results present the ipsilateral SMI as a novel generator site for the median nerve SEFs. This is expected on the basis of results from invasive electrophysiological measurements. Ipsilateral SMI responses to median nerve stimulation have since been reported in recent MEG (Kanno et al. 2003; Kanno et al. 2004) and fMRI studies. The results from our fMRI measurements support the source model obtained by the MEG dipole modelling alone. The exact functional role of the ipsilateral SMI in the somatosensory processing remains to be determined. An obvious possibility is that arrival of afferent impulses to the ipsilateral SMI may facilitate coordination of bimanual movement. The fact that the ipsilateral SEFs were suppressed by simultaneous movement of the stimulated (right) hand, but not by movement of the unstimulated hand, lends preliminary support for this notion.
The exact cytoarchitectonic area that elicited the ipsilateral SMI responses can not determined on the basis of our results. The wide latency range is similar to those obtained by Allison et al. (1989b) with invasive measurements. Based on cortical potential distribution their conclusion was that the long latency ipsilateral SMI responses are likely elicited by cortical areas other than Brodmann area 3b, possibly the areas 4, 1, 2, and 7. An fMRI study indicated involvement of areas 2 and 5 (Nihashi et al. 2005).
In Study II, a distributed neural network was revealed after median nerve stimulation. While most of the activation areas found in this study have been described in previous MEG studies, a comprehensive source model identifying all sources in a single study had not been described earlier. The results therefore corroborate the notion that electrical stimulation of the median nerve will activate a complex network involving

49
several separate cortical areas. A completely novel MEG finding, supported by the fMRI data, was that the opercular source reflected in the SEFs probably involves at least two separate generator areas. A recent study combining fMRI and EEG also found evidence in support of two opercular sources for SEPs (Stancák et al. 2005).
5.2. Somatosensory evoked activation localization with fMRI and MEG (Study II)
5.2.1. Results
We observed evidence of activation in the same cortical areas to the somatosensory stimulation using fMRI and MEG. Spatial agreement measured, as the distance between the fMRI activation cluster centroids and corresponding ECD, varied between 7 and 30 mm being smallest for contralateral posterior opercular (PO) source (mean 7 mm), SMI (P30m: mean 15 mm; N20m mean 16 mm), and PoCS (mean 19 mm) sources (see publication II, page 18, Table 1).
5.2.2. Discussion
The ranges of localization differences between fMRI cluster centroid and ECD were similar to those reported by other studies (Ahlfors et al. 1999; Beisteiner et al. 1997; Forss et al. 1999; Sanders et al. 1996; Stippich et al. 1998; Tuunanen et al. 2003) comparing ECD based modelling of MEG sources and fMRI localization. The areas with the smallest error were those that exhibited the largest responses, thus providing the best signal-noise ratio. Distances from ECD to the nearest voxel in an activated brain area are markedly smaller. fMRI activation clusters are biased towards pial veins, necessarily being some distance away from the activated neuronal tissue and therefore a complete agreement is not expected. Turner (2002) proposed an estimate based on modelling of the venous tree anatomy that would predict extension of the activated area by 4.2 mm for a 100 mm2 cortical patch. Geometric distortions in structural and functional images are likely another significant source of localization error (Ojemann et al. 1997; Walton et al. 1996). Further registration errors between MEG and MRI coordinate spaces may account for a certain amount of localization disagreement (Singh et al. 1997).

50
5.3. Sequence of activation during somatosensory stimulus processing (Studies I, II)
5.3.1. Results
As expected, according to the multidipole model constructed in study II, the first area that was activated after the somatosensory stimulus was the contralateral SMI. The mean latency of activation in this area was 20 ms (range, 17–22 ms). The activation of the PoCS source area followed at the mean onset latency of 23 ms (range, 21–25 ms). While the activation of contralateral opercular sources peaked in strength after 70 ms, the model indicated activity as early as 26 ms (range, 19–32) for PO and 33 ms (range, 24–48 ms) for AO. The SMA source was activated with mean latency of 36 ms (range 24–48 ms). In the ipsilateral hemisphere the SMI, PO and AO sources were clearly activated with longer latencies (54–67 ms). Figure 5 in publication II (page 24) illustrates the spatiotemporal pattern of activation suggested by the model.
Area Modelled time of onset (ms) Invasively measured time of onset (ms)
SMI contralateral 17–22 22 (Allison et al. 1989a)
PoCS contralateral 21–25 25 (Allison et al. 1989a)
PO contralateral 19–32 24 (Lüders et al. 1985) 27 (Barba et al. 2002)
AO contralateral 22–51
SMA/pre-SMA 24–48 40–50 (Allison et al. 1996) 60–100 (Barba et al. 2001)
SMI ipsilateral 36–70 40–50 (Allison et al. 1989a)
PO ipsilateral 42–92 33 (Barba et al. 2002)
AO ipsilateral 32–112
Table 1. The times of onset for the sources in the fMRI constrained multidipole model in study II. The two columns on the right list onset times found in invasive intraoperative recordings as reference.
51
5.3.2. Discussion
Times of onset of activity as measured by invasive recordings in humans, as reported in the literature, are summarized in Table 1 together with the latencies indicated by the spatiotemporal model constructed from our MEG data with the aid of the fMRI data. The timings in our model are in line with those found in the existing literature.
Notably, our model suggests short latency activation in the contralateral parietal operculum, which is in line with a previous MEG study that used the signal space separation method (Uusitalo and Ilmoniemi 1997) to selectively obtain the time course of activation of SII (Karhu and Tesche 1999). Whether SII is activated serially from SI or directly from the thalamus has been subjected to debate (Pons et al. 1987; Zhang et al. 2001). Our data seem to favour the serial activation hypothesis since in all except one subject the PO activation delays were longer than SI on both the contra- and ipsilateral side. Within the opercular region, our model tentatively suggests a serial activation proceeding from the more posterior parts (probably including SII proper as suggested by location of dipole and fMRI activation maps) toward more anterior opercular regions.
PoCS activation followed SI activation by 2–4 ms. The Brodmann areas 1 and 2 (Geyer et al. 1997) occupying the postcentral sulcus walls are targets of input from both area 3b and the thalamus. Thus a simultaneous or serial activation with a short latency would be expected on the basis of these connections.
Known anatomical connections from the thalamus (Wiesendanger and Wiesendanger 1985), SI (Jones et al. 1978) and SII (Jones and Powell 1969) to SMA in monkeys are in line with the observed early activation of SMA. We did not use any tasks that would make functional differentiation of pre-SMA and SMA proper possible. Therefore we cannot rule out that the early activation that we observed would not arise from pre-SMA as suggested by Barba et al. (2005).

52
5.4. The effect of the use of neighbourhood information on reproducibility in fMRI (Study III)
5.4.1. Results
5.4.1.1. Segmentation parameters and empirical false positive rates
The initial trials with the smaller search volume gave sets of parameter combinations resulting in false positive rates that are illustrated in Figure 6 in publication III. Contours representing different false positive rates are plotted against the neighbourhood weighting parameter s and the thresholding parameter T. Two combinations (T=1.44, s=6 and T=1.07, s=4) that led to a slightly lower false positive rate than 0.05 were chosen and were validated further with larger search volumes and gave false positive rates of 0.030±0.003 regardless of whether they where spatially filtered or not. The Pearson correlation coefficients between neighbouring voxels in the first null dataset of study III were found to be 0.18±0.01 in the x, y and z directions. The Gaussian filter, with a 0.5 voxels standard deviation introduced a slightly larger correlation coefficient of 0.24 to the simulated statistical images.
For the Bonferroni correction an intensity threshold of 4.46 corresponded to the desired global positive rate. For the Gaussian random field theory based thresholding the intensity thresholds 4.53 and 3.42 were found for spatial extent threshold parameters 0 and 8.
The empirical false positive rate for Bonferroni correction was found to be 13%, also with contextual clustering with parameters T=1.44 and s=6. With parameters T=1.07 and s=4 the contextual clustering produced false positive rate of 18%. With Gaussian random field based thresholding the lowest false positive rate (8%) was obtained with zero spatial extent threshold and an intensity threshold of 4.53. Meanwhile the larger spatial extent threshold of 8 and an intensity threshold of 3.42 produced a false positive rate as high as 23%.
5.4.1.2. Sensitivity, specificity and segmentation accuracy
Results on the sensitivity, specificity and segmentation accuracy when segmenting the computer generated activation phantom are summarized in Table 2. The segmentation accuracy is also illustrated in Figure 8 in publication III (page 468). Applied to the full data and the 5% signal change the sensitivity was similar for contextual clustering using either of the parameter combinations (99.1% voxels of the phantom detected). The

53
Gaussian random field based thresholding performed equally (99.0%) with the larger spatial extent threshold and only slightly worse with zero spatial extent threshold (92.4%). Bonferroni correction had the lowest sensitivity (85.4%). For the 2.5% signal change the sensitivity was markedly lower for the Bonferroni correction and the Gaussian random field based thresholding with zero spatial extent threshold.
Applying the same methods to the half data resulted in lower sensitivities especially for the Gaussian random field based thresholding with zero extent threshold and Bonferroni correction. Reduced signal change affected the contextual clustering least.
The specificity as indicated by the number of voxels falsely classified, was highest with the Bonferroni correction with no false positives. Contextual clustering classified 2–8 voxels falsely as activated, with the exception of the half data where the numbers were 22–33 with parameter s=4 (higher neighbourhood information weighting).
Method
True positives (%)
False positives (voxels)
False-negatives+False positives (voxels)
Full Data Half data Full Data Half data Full Data Half data
Signal change 2.5% 5% 2.5% 5% 2.5% 5% 2.5% 5% 2.5% 5% 2.5% 5%
CC(0.05, 6) 95.9 99.1 46.4 93.1 2 2 4 8 26 7 316 48
CC(0.05, 4) 96.6 99.1 72.2 93.8 6 3 33 20 26 8 195 56
SPM(0.05, 0) 62.0 92.4 1.4 0.9 35 262 2 11 256 306 576 588
SPM(0.05, 8) 90.9 99.0 29.9 72.5 242 723 49 191 295 729 457 351
BF(0.05) 25.4 85.4 1.9 3.1 0 0 0 0 434 85 571 564
Table 2. Results on the activation phantom embedded in fMRI time series acquired under the null condition. Two activation amplitudes were used. The methods were applied both to full and half time series. Percentage of phantom voxels detected, the number of voxels falsely classified as belonging to an activated area, and the number of voxels falsely classified either as belonging to activated or non-activated area (total number of false classifications) are presented. The methods are denoted as follows: Gaussian random field based thresholding with spatial extent threshold 0: SPM(0.05, 0) and 8: SPM(0.05, 8), contextual clustering with parameter s=4: CC(0.05, 4) and s=6: CC(0.05, 6), Bonferroni correction: BF(0.05). The table is extended from Table 3 on page 468 of publication III (Salli et al. 2001b).

54
The segmentation accuracy measured as the number of falsely classified voxels (sum of false-positives and false-negatives), was best with contextual clustering. With the Bonferroni correction the segmentation accuracy was low due to the large number of false negatives. For higher activation amplitude in the full data it performed relatively well. The Gaussian random field based thresholding classified large numbers of voxels falsely as belonging to an activated area (i.e. false-positives) resulting in the worst overall segmentation accuracy.
5.4.1.3. Reproducibility
The Bonferroni correction had the lowest proportion of voxels detected in all, or at least 3 sessions. The other methods did not differ much in this sense. The proportions of voxels detected in 1, 2, 3, or 4 sessions are presented in Figure 7 in publication III (page 467).
5.4.2. Discussion
The results indicate that contextual clustering provides sensitivity comparable to the currently most widely used approach in hypothesis testing for fMRI data: the Gaussian random field based spatial extent thresholding (Friston et al. 1994). At same time, it outperforms the Gaussian random field based thresholding with respect to segmentation accuracy. If the filter width happens to match the activation width, it optimally enhances the image signal-to-noise ratio. If it does not, the performance is less than optimal. Anyway, filtering will result in loss of detail and this could have impact on the identification anatomical structures activated. Filter width at least twice the voxel dimension has been recommended (Worsley and Friston 1995). The Bonferroni correction provides high specificity but has poor sensitivity and delineation accuracy. Good delineation accuracy has clinical relevance when outlining eloquent cortical areas.
It has been found that fMRI has a fairly good within-subject between-session reproducibility, judging both by response shape (Aguirre et al. 1998b) and statistical parameter map (McGonigle et al. 2000; Smith et al. 2005). Significant variability may be found, however, in segmented statistical parameter maps depending on the method used for hypothesis testing (McGonigle et al. 2000; Smith et al. 2005). Both methods using neighbourhood information had a better reproducibility than simple thresholding (Bonferroni correction) suggesting that robustness against the effect of spatially independent noise can be gained by use of contextual information.

55
We used data acquired under null condition as a model of realistic background noise in fMRI time series. The time series acquired under ‘resting’ conditions are known to contain low frequency (<0.1 Hz) fluctuations that are coherent between functionally related areas (Biswal et al. 1995; Cordes et al. 2000). A recent study (Fox et al. 2006) suggests that these fluctuations explain a large portion of the variability of evoked hemodynamic responses in the brain. The properties of these fluctuations, or some other factor contributing to the noise in fMRI time series, might differ between activation and control conditions. We did not attempt to model this effect in our study.
5.5. Localization of SMI for neurosurgical planning with MEG and fMRI (Study IV)
5.5.1. Results
In all 15 patients with intraoperative verification of the central sulcus location, MEG found the central sulcus correctly. In 11 of these patients, fMRI primary activation was concordant with MEG and the intraoperative mapping, while in four the fMRI primary activation occurred in the region of the postcentral sulcus. The two intraoperative mapping methods gave consistent results with each other in all seven patients tested with both methods.
Thus, altogether in four patients fMRI localized the central sulcus to the region that turned out to be the postcentral sulcus according to invasive measurements. The results were the same regardless of the decision criteria used, i.e. the spatial extent of fMRI activation or the maximum of statistical significance in statistical images.
In addition to the primary sensorimotor cortex, fMRI also showed activation in multiple non-primary areas, with considerable variation between patients. Individual activation patterns are summarized in Table 3.
5.5.2. Discussion
The reliability of MEG in the identification of the central sulcus has been demonstrated in many previous studies. Our results are in line with this. The primary somatosensory cortex is in many ways an ideal area for MEG source localization. The SEFs usually have a good signal-to-noise ratio, which means that a moderate number of epochs is sufficient for averaging, commonly 200–400. Fairly rapid stimulation rates (even 5 Hz) can be used without much reduction in amplitudes of the N20m response component
56
(Wikström et al. 1996). Altogether, this adds up to that recording times are comfortably short. Moreover, the first primary somatosensory response with clearly defined dipolar field patterns does not temporally overlap with activity in other areas, making the modelling unambiguous. The first cortical component of SEFs (N20m) also has a relatively large high-frequency content, which makes it resistant to external noise that occurs mostly at lower frequencies.
In fMRI, a larger number of areas activated by the motor task were detected than in previous studies on clinical populations. The activation segmentation technique we used is more sensitive than the simple thresholding of statistical maps when the same nominal family-wise error rate is pursued (Salli et al. 2001a). Most previous clinical studies on motor activation (Fandino et al. 1999; Ganslandt et al. 1999; Holodny et al. 2000; Inoue et al. 1999; Kamada et al. 2003; Kober et al. 2001; Krings et al. 1997; Krings et al. 2001; Krings et al. 2002; Lehéricy et al. 2000; Mueller et al. 1996; Puce et al. 1995; Pujol et al. 1996; Pujol et al. 1998; Schulder et al. 1998; Yetkin et al. 1997; Yousry et al. 1995; Yousry et al. 1996) used thresholding as a hypothesis testing technique. As the activations in most of the non-primary areas were weak, and close to detection threshold, the statistical testing method may have a considerable impact on the resulting activation pattern. Secondary activations have, however, been found in patient populations with different types of analysis methods (Fandino et al. 1999; Hirsch et al. 2000; Holodny et al. 2000; Inoue et al. 1999; Kober et al. 2001; Krings et al. 2001; Krings et al. 2002; Lehéricy et al. 2000; Mueller et al. 1996; Pujol et al. 1996; Pujol et al. 1998; Roux et al. 1999; Schulder et al. 1998; Towle et al. 2003; Yousry et al. 1996). Moreover, the observed interindividual variation in fMRI activation pattern (see Table 3) could reflect altered strategies in motor task performance in subjects with brain lesions. Brain pathology could also contribute to variation in hemodynamics and metabolism by other mechanisms. Holodny et al. (2000) observed spatially smaller activation on the side of the tumour compared to the unaffected hemisphere and proposed that this might be due to altered hemodynamics in the tumour and compression of the veins draining the sensorimotor cortex. This, nevertheless, did not lead to false localization results as verified by intraoperative mapping.
When the sensitivity of fMRI is increased through future developments in the methodology, more complex activation patterns are likely to be seen as the complete cortical and subcortical network involved in motor task performance is revealed. It seems that the commonly used simple motor tasks contrasted with rest are probably not optimal, as they may occasionally be unable to separate the region of interest, the sensorimotor strip, from secondary areas. Indeed, Pujol et al. (1996) found that in

57
healthy volunteers the Rolandic functional activity was separable from secondary areas in only 44% of the cases when task vs. rest contrast was used. In order to suppress activations from non-primary areas, some authors (Papke et al. 2000; Pujol et al. 1996) have suggested avoiding rest as the control condition and instead using unilateral movement of the opposite side as a control.
In four of our patients, the predominant fMRI activation was observed in the postcentral sulcus confined to the postcentral and superior parietal gyri. These activations probably correspond to Brodmann areas 2, 5 and 7. Area 2 and 5 neurons mostly process proprioceptive input, while area 7 is involved in visually guided movements (Hyvärinen 1982). The flexion of the wrist will result in proprioceptive input in the posterior parietal cortex. It has been suggested that movements that require skilful coordination activate non-primary areas, including areas lining the postcentral sulcus, more than execution of simpler movements (Ehrsson et al. 2002). Although the motor task in our study was simple, it is possible that for some of our patients it required using compensatory resources due to dysfunction caused by the lesion. On the other hand there is indication that multiple areas are also involved in tasks that do not involve complex coordination of movements such as self paced (Kollias et al. 2001) or externally cued (Fink et al. 1997) finger flexion and extension. In addition to activation of the SMI, Fink et al. (1997) also found activation in the lateral premotor cortex, in the opercular area within the premotor cortex, SII, insula, SMA, cingulate gyrus, and posterior parietal areas. Similar areas were observed by Kollias et al. (2001), with the addition of pre-SMA.
Primary motor cortex activation was detected in every patient. Thus, the most clinically important cortical area was included in the activated cortical network in every case. If one could rely on always detecting at least SMI, fMRI might turn out to be useful in situations where the lesion is clearly located away from the activated cortical network, even though the functional subareas could not be labelled with certainty.

58
A n a t o m i c a l a r e a s Patient 1 2 3 4 5 6 7 8 9 10 11 12 13 14 15Superior frontal sulcus
Superior frontal gyrus c b c b i b i b Middle frontal gyrus b c b b b i
Middle frontal sulcus Middle frontal gyrus c b i c Inferior frontal sulcus Inferior frontal gyrus c c i i
P r e c e n t r a l s u l c u s Superior frontal gyrus c b b c i i Middle frontal gyrus c b i i c Inferior frontal gyrus c c c i i P r e c e n t r a l g y r u s b b b b b c c i b b b C e n t r a l s u l c u s P r e c e n t r a l g y r u s b b c c b b c b b b b b b c i P o s t c e n t r a l g y r u s c b c c b c c b c b c b b c
P o s t c e n t r a l s u l c u s P o s t c e n t r a l g y r u s b b c b b c b c b c b b c Supramarginal gyrus c c b b c b i b b Superior parietal gyrus c b c c c b c i c b
I n t r a p a r i e t a l s u l c u s A n g u l a r g y r u s b i c b b b c c b c Supramarginal gyrus c b b c i c c b c Superior parietal gyrus c b i b c b c c i b
L a t e r a l s u l c u s Supramarginal gyrus i c c b i i c b Parieto-occipital sulcus Superior parietal gyrus c c
Interhemispheric sulcus P a r a c e n t r a l l o b u l e i b c Superior frontal gyrus b c i b c b c c b b i c Superior parietal gyrus b i
C i n g u l a t e s u l c u s C i n g u l a t e g y r u s b b b c c c P o s t c e n t r a l g y r u s c i Superior parietal gyrus c i i Superior frontal gyrus c b c c c b c b c c
Table 3. Activations in fMRI. Activation areas seen in more than three patients are listed. Abbreviations: bilateral (b), contralateral (c), ipsilateral (i). The atlas of Duvernoy (1999) was used as the anatomical reference.
59
6. Conclusions
The main conclusions of studies I–IV were:
I The ipsilateral SMI can in some subjects be a source area for SEFs.
II The results from somatosensory MEG and fMRI experiments converge spatially to a degree that justifies the use of fMRI data as a partial the constraint in construction of a spatiotemporal model of electrical activity in the brain. The resulting model is in line with published data from anatomical and invasive electrophysiological studies.
III In comparison to the two currently most widely used hypothesis testing techniques in fMRI data analysis (Gaussian random field theory based thresholding and Bonferroni corrected thresholding), contextual clustering has a superior delineation accuracy and a comparable or better reproducibility and sensitivity.
IV The low temporal resolution of fMRI may in some settings make it difficult to separate cortical processing areas of primary interest from those that are less critical for preservation of sensorimotor function.
The finding of study I was expected on the basis of invasive recordings in humans. Other groups have since provided further evidence of the contribution of the ipsilateral SMI to SEFs (Kanno et al. 2003; Kanno et al. 2004; Noachtar et al. 1997). The results from study I, suggesting involvement of the ipsilateral SMI, are in line with the fMRI results of study II. Modulation of the responses by movements of the contralateral hand suggests that somatosensory feedback to the ipsilateral SMI may have a role in coordination of bimanual movements. The relatively long latencies of these responses suggest that they are evoked by inputs relayed via other processing areas involved earlier in the processing of somatosensory information. As the callosal connections from SMI are lacking for the distal parts of the upper limbs in non-human primates, other pathways originating e.g. from SII are probably involved.
The degree of spatial convergence between MEG and fMRI in study II suggests that fMRI can provide meaningful a priori information to solution of the inverse problem of MEG. Possibly due to insufficient sensitivity of MEG and fMRI, however, discrepancies in the spatial activation pattern exist. These discrepancies must be taken into account when combining data from MEG and fMRI.

60
The spatiotemporal model of somatosensory processing constructed with the information from fMRI data in study II, was well in line with information obtained by invasive electrophysiological recordings. This suggests that fMRI may provide meaningful information for constraining the electromagnetic inverse solution. The results show that the activation of a complex and distributed neuronal network, following somatosensory stimulation, is amenable to a non-invasive study by MEG and fMRI.
Our findings, from study III, indicate that the contextual clustering has properties that are desirable for use in presurgical functional mapping of cortex. In comparison with the most widely used hypothesis testing techniques it shows a good sensitivity in detecting activations. For surgical risk assessment this is highly important. In addition it provides an excellent delineation accuracy, which may facilitate accurate planning of therapeutic procedures. The reproducibility of the results compared favourably with the currently most widely used techniques.
In study IV, it was demonstrated that the temporal resolutions of the functional neuroimaging techniques have clinical relevance. In fMRI, the SMI is currently most commonly localized using experimental designs which contrast rest to motor task execution. They are not optimal, however, as the whole cortical network participating in motor task execution is revealed. Usually it is desirable to pinpoint on primary areas, which are necessary for motor function. Interindividual variation in the activation of secondary processing areas and somatosensory areas can introduce ambiguity in the interpretation of the activation maps. Thus, the low temporal resolution of fMRI may in some settings make it difficult to separate cortical processing areas of primary interest from those that are less critical for preservation of sensorimotor function. In clinical use, the temporal resolution of the imaging technique used must be taken into account when mapping eloquent functional areas for neurosurgical planning and risk assessment purposes.
Our findings corroborate the ample evidence that although MEG has certain limitations with respect to spatially resolving the cortical areas involved in processing of sensory stimuli or cognitive and motor tasks, it has adequate spatial resolution for locating the SMI very reliably. On the other hand, fMRI may provide complementary information by delineating the borders of the activated areas.
Mapping the cortical functional anatomy, which the BOLD fMRI and MEG can accomplish, alone does not provide all the information needed in neurosurgical planning. Iatrogenic injury to the neuronal fibre tracts conveying signals to the

61
periphery can produce loss of function similarly as damage to the cortex. Diffusion tensor imaging has a potential for providing information about the course of subcortical neuronal bundles, an application commonly referred to as tractography of fibre tracking (Conturo et al. 1999; Mori et al. 1999). Combination of this structural information with cortical functional anatomical maps could provide a more complete map of the brain structures that should be spared during invasive therapeutic procedures (Kamada et al. 2003).
62
7. Acknowledgements
Work for this dissertation was conducted at the HUS Medical Imaging Center and the BioMag Laboratory at the Helsinki University Central Hospital. The MEG recordings on surgical patients were performed at the Low Temperature Laboratory at the Helsinki University of Technology and the intraoperative measurements were performed at the Department of Neurosurgery at the Helsinki University Central Hospital.
I wish to express my gratitude to Professors Carl-Gustaf Standertskjöld-Nordenstam and Leena Kivisaari at the Department of Radiology as well as the CEO of the Helsinki Medical Imaging Center, Docent Juhani Ahovuo for the opportunity to conduct my studies and for the access to the medical imaging facilities at the Helsinki University Central Hospital. I am thankful to Professor Riitta Hari, Head of the Brain Research Unit, and Professor Mikko Paalanen, Head of the Low Temperature Laboratory, for our collaboration with the Low Temperature Laboratory. Professor Riitta Hari greatly helped me to get initial funding for my work.
I wish to thank the pre-examiners of my Thesis, Professors Risto Kauppinen and Iiro Jääskeläinen for their helpful and constructive comments on this Thesis.
My supervisors, Professor Hannu Aronen, Professor Risto Ilmoniemi and Docent Juha Huttunen supported me with their own special expertise. I was especially inspired by the can-do spirit of Professor Aronen when we were struggling to setup functional MRI in the Helsinki University Central Hospital. From Professor Risto Ilmoniemi I learned a lot about setting high standards for scientific work along with the principles of magnetoencephalography. Docent Juha Huttunen provided me invaluable insights into the physiology of the sensorimotor system. His advice and suggestions in manuscript drafting were very valuable.
Many individuals have contributed to the studies of this Thesis. Especially I want to thank Dr. Heidi Wikström. With her I took my first steps in MEG and acquired data for the first two studies. I want to also thank Docent Anna-Maija Seppäläinen for her support and collaboration in the initial phase of my work for the Thesis.
Dr. Eero Salli’s input in image and signal processing was crucial in accomplishing the three last studies. Dr. Hanna Pohjonen’s contribution in this field was vital as well. I am grateful to Professors Ari Visa and Toivo Katila for their collaboration in the third study. Dr. Leena Lauronen, Dr. Matias Palva and Mr. Sami Martinkauppi helped in getting started with fMRI and the realisation of the second study.
63
Dr. Erika Kirveskari played a key role together with Dr. Sari Avikainen in performing MEG experiments for the patients in the final study of the Thesis. She also made the intracranial recordings together with Dr. Tero Kovalainen and Professor Juha Jääskeläinen. Collaboration with Professor Juha Jääskeläinen was essential for the realisation of the final study. I also wish to express my gratitude to Docent Jyrki Mäkelä, Docent Nina Forss and Mr. Mika Seppä, members of the CliniMEG team at the Low Temperature Laboratory, who were involved in the final study. I am indebted to Dr. Antti Brander with whom I performed the fMRI studies on the neurosurgical patients and with whom I assessed the results.
The work for this Thesis started almost simultaneously with the opening of the BioMag Laboratory. To work in a newly established laboratory has been exciting. I want to thank the present and former personnel of BioMag Laboratory for their support. Ms. Suvi Heikkilä came several times into rescue when we were faced with problems during our experiments. In the early phases of this work the Neuromag personnel greatly helped in getting the MEG measurements going. Special thanks go to Dr. Petteri Laine who was a co-worker in our first study.
Without the support of Professor Risto Näätänen and the members of his research group it would have been very difficult for newcomers like me to get started with my work. Docent Minna Huotilainen taught me in practice how to operate the MEG device. Dr. Janne Sinkkonen was my tutor in scientific computing and taught me the basics of Linux system administration. Dr. Juha Virtanen was the electronics wizard who manufactured our fMRI compatible electric stimulator and numerous black boxes necessary for our experiments.
After our research group became part of the Helsinki Brain Research Center I received valuable support and advice from Professor Synnöve Carlson in many aspects of my work. I want to thank Professor Leena Laasonen and Docent Oili Salonen, the former and the present head of the Functional Imaging Unit of Helsinki Brain Research Center, for all their support for our work.
During my work I spent several years working at the BioMag Laboratory and Department of Radiology at the Helsinki University Central Hospital. I want to thank all the researcher colleagues for a pleasant working atmosphere and collaborative attitude. I want to especially thank Docent Kirsi Lauerma, Dr. Vadim Nikuline, Dr. Klaus Linkenkaer-Hansen and Dr. Päivi Ryynänen, the colleagues with whom I have shared my office and with whom I had interesting discussions about many aspects of life aside from science. I also wish to thank Dr. Jussi Perkiö and Dr. Soile Komssi, the steadfast

64
members of the Functional Brain Imaging Unit, for their collaboration. I am grateful to Dr. Veli-Pekka Poutanen for his support with MR system operation.
Foremost, I want to thank my wife Tita for her love and support. Her patience has been remarkable, though my Thesis must at times have felt like a never-ending project. My children, Elisa, Lauri and Leo, brought me back to the reality and sometimes even beyond it when I became carried away by science. They have given me a frame of reference, which has helped me to see things in the right proportions. My deepest thanks to them as well.
This work was financially supported by the Finnish Cultural Foundation, the Maud Kuistila Memorial Foundation, the Maire Taponen Foundation, the Pehr Oscar Klingendal Foundation, the Radiological Society of Finland, the Finnish Cancer Organisations, the Clinical Research Institute Helsinki University Central Hospital, the Helsinki University Central Hospital research funds, the European Union 5th framework programme (Contract No:QLK3-CT-1999-00894), and the Academy of Finland.
Espoo, December 2006,
Antti Korvenoja
65
8. References
Aguirre GK, Zarahn E, D'Esposito M. A critique of the use of the Kolmogorov–Smirnov (KS) statistic for the analysis of BOLD fMRI data. Magn Reson Med 1998a;39(3):500–505.
Aguirre GK, Zarahn E, D'Esposito M. The variability of human, BOLD hemodynamic responses. Neuroimage 1998b;8(4):360–369.
Ahlfors SP, Simpson GV, Dale AM, Belliveau JW, Liu AK, Korvenoja A, Virtanen J, Huotilainen M, Tootell RB, Aronen HJ, Ilmoniemi RJ. Spatiotemporal activity of a cortical network for processing visual motion revealed by MEG and fMRI. J Neurophysiol 1999;82(5):2545–2555.
Ahonen AI, Hämäläinen MS, Kajola MJ, Knuutila JET, Laine PP, Lounasmaa OV, Parkkonen LT, Simola JT, Tesche CD. 122-channel SQUID instrument for investigating the magnetic signals from the human brain. Physica Scripta 1993;T49:198–205.
Alkadhi H, Crelier GR, Boendermaker SH, Golay X, Hepp-Reymond MC, Kollias SS. Reproducibility of primary motor cortex somatotopy under controlled conditions. AJNR Am J Neuroradiol 2002;23(9):1524–1532.
Allison T, McCarthy G, Wood CC, Darcey TM, Spencer DD, Williamson PD. Human cortical potentials evoked by stimulation of the median nerve. I. Cytoarchitectonic areas generating short-latency activity. J Neurophysiol 1989a;62(3):694–710.
Allison T, McCarthy G, Wood CC, Williamson PD, Spencer DD. Human cortical potentials evoked by stimulation of the median nerve. II. Cytoarchitectonic areas generating long-latency activity. J Neurophysiol 1989b;62(3):711–722.
Allison T, McCarthy G, Wood CC, Jones SJ. Potentials evoked in human and monkey cerebral cortex by stimulation of the median nerve. A review of scalp and intracranial recordings. Brain 1991;114 ( Pt 6):2465–2503.
Allison T, McCarthy G, Luby M, Puce A, Spencer DD. Localization of functional regions of human mesial cortex by somatosensory evoked potential recording and by cortical stimulation. Electroencephalogr Clin Neurophysiol 1996;100(2):126–140.
Andersson JLR, Hutton C, Ashburner J, Turner R, Friston K. Modeling geometric deformations in EPI time series. Neuroimage 2001;13(5):903–919.
Arthurs OJ, Williams EJ, Carpenter TA, Pickard JD, Boniface SJ. Linear coupling between functional magnetic resonance imaging and evoked potential amplitude in human somatosensory cortex. Neuroscience 2000;101(4):803–806.

66
Arthurs OJ, Boniface SJ. What aspect of the fMRI BOLD signal best reflects the underlying electrophysiology in human somatosensory cortex? Clin Neurophysiol 2003;114(7):1203–1209.
Arthurs OJ, Johansen-Berg H, Matthews PM, Boniface SJ. Attention differentially modulates the coupling of fMRI BOLD and evoked potential signal amplitudes in the human somatosensory cortex. Exp Brain Res 2004;157(3):269–274.
Attwell D, Iadecola C. The neural basis of functional brain imaging signals. Trends Neurosci 2002;25(12):621–625.
Auranen T, Nummenmaa A, Hämäläinen MS, Jääskeläinen IP, Lampinen J, Vehtari A, Sams M. Bayesian analysis of the neuromagnetic inverse problem with l(p)-norm priors. Neuroimage 2005;26(3):870–884.
Backes WH, Mess WH, van Kranen-Mastenbroek V, Reulen JP. Somatosensory cortex responses to median nerve stimulation: fMRI effects of current amplitude and selective attention. Clin Neurophysiol 2000;111(10):1738–1744.
Baillet S, Garnero L. A Bayesian approach to introducing anatomo-functional priors in the EEG/MEG inverse problem. IEEE Trans Biomed Eng 1997;44(5):374–385.
Bandettini PA, Wong EC, Hinks RS, Tikofsky RS, Hyde JS. Time course EPI of human brain function during task activation. Magn Reson Med 1992;25(2):390–397.
Bandettini PA, Jesmanowicz A, Wong EC, Hyde JS. Processing strategies for time-course data sets in functional MRI of the human brain. Magn Reson Med 1993;30(2):161–173.
Barba C, Frot M, Guenot M, Mauguiere F. Stereotactic recordings of median nerve somatosensory-evoked potentials in the human pre-supplementary motor area. Eur J Neurosci 2001;13(2):347–356.
Barba C, Frot M, Mauguiere F. Early secondary somatosensory area (SII) SEPs. Data from intracerebral recordings in humans. Clin Neurophysiol 2002;113(11):1778–1786.
Barba C, Valeriani M, Colicchio G, Mauguiere F. Short and middle-latency median nerve (MN) SEPs recorded by depth electrodes in human pre-SMA and SMA-proper. Clin Neurophysiol 2005;116(11):2664–2674.
Barker AT, Jalinous R. Non-invasive magnetic stimulation of human motor cortex. Lancet 1985;1(8437):1106–1107.
Beisteiner R, Erdler M, Teichtmeister C, Diemling M, Moser E, Edward V, Deecke L. Magnetoencephalography may help to improve functional MRI brain mapping. Eur J Neurosci 1997;9(5):1072–1077.

67
Beisteiner R, Windischberger C, Lanzenberger R, Edward V, Cunnington R, Erdler M, Gartus A, Streibl B, Moser E, Deecke L. Finger somatotopy in human motor cortex. Neuroimage 2001;13(6 Pt 1):1016–1026.
Beisteiner R, Gartus A, Erdler M, Mayer D, Lanzenberger R, Deecke L. Magnetoencephalography indicates finger motor somatotopy. Eur J Neurosci 2004;19(2):465–472.
Belliveau JW, Kennedy DN, Jr., McKinstry RC, Buchbinder BR, Weisskoff RM, Cohen MS, Vevea JM, Brady TJ, Rosen BR. Functional mapping of the human visual cortex by magnetic resonance imaging. Science 1991;254(5032):716–719.
Bertrand C, Ohmi M, Suzuki R, Kado H. A probabilistic solution to the MEG inverse problem via MCMC methods: the reversible jump and parallel tempering algorithms. IEEE Trans Biomed Eng 2001;48(5):533–542.
Birn RM, Saad ZS, Bandettini PA. Spatial heterogeneity of the nonlinear dynamics in the FMRI BOLD response. Neuroimage 2001;14(4):817–826.
Biswal B, Yetkin FZ, Haughton VM, Hyde JS. Functional connectivity in the motor cortex of resting human brain using echo-planar MRI. Magn Reson Med 1995;34(4):537–541.
Boakye M, Huckins SC, Szeverenyi NM, Taskey BI, Hodge CJ, Jr. Functional magnetic resonance imaging of somatosensory cortex activity produced by electrical stimulation of the median nerve or tactile stimulation of the index finger. J Neurosurg 2000;93(5):774–783.
Boakye M, Krauss BR, Huckins SC, Zhang L, Szeverenyi NM, Hodge CJ, Jr. Effects of hyperoxia on human sensorimotor cortex activity produced by electrical stimulation of the median nerve: a functional magnetic resonance imaging study. Neurosci Lett 2002;321(1-2):5–8.
Boynton GM, Engel SA, Glover GH, Heeger DJ. Linear systems analysis of functional magnetic resonance imaging in human V1. J. Neurosci. 1996;16(13):4207–4221.
Brenner D, Lipton J, Kaufman L, Williamson SJ. Somatically evoked magnetic-fields of human-brain. Science 1978;199(4324):81–83.
Buckner RL, Bandettini PA, O'Craven KM, Savoy RL, Petersen SE, Raichle ME, Rosen BR. Detection of cortical activation during averaged single trials of a cognitive task using functional magnetic resonance imaging. Proc Natl Acad Sci U S A 1996;93(25):14878–14883.
Buckner RL. Event-related fMRI and the hemodynamic response. Hum Brain Mapp 1998;6(5-6):373–377.

68
Burton H, Fabri M, Alloway K. Cortical areas within the lateral sulcus connected to cutaneous representations in areas 3b and 1: a revised interpretation of the second somatosensory area in macaque monkeys. J Comp Neurol 1995;355(4):539–562.
Buxton RB, Frank LR. A model for the coupling between cerebral blood flow and oxygen metabolism during neural stimulation. J Cereb Blood Flow Metab 1997;17(1):64–72.
Buxton RB, Wong EC, Frank LR. Dynamics of blood flow and oxygenation changes during brain activation: the balloon model. Magn Reson Med 1998;39(6):855–864.
Buxton RB. The elusive initial dip. Neuroimage 2001;13(6 Pt 1):953–958. Cannestra AF, Pouratian N, Bookheimer SY, Martin NA, Beckerand DP, Toga AW.
Temporal spatial differences observed by functional MRI and human intraoperative optical imaging. Cereb Cortex 2001;11(8):773–782.
Carter TJ, Sermesant M, Cash DM, Barratt DC, Tanner C, Hawkes DJ. Application of soft tissue modelling to image-guided surgery. Med Eng Phys 2005;27(10):893–909.
Chance B, Baltscheffsky H. Respiratory enzymes in oxidative phosphorylation. VII. Binding of intramitochondrial reduced pyridine nucleotide. J Biol Chem 1958;233(3):736–739.
Chance B, Cohen P, Jobsis F, Schoener B. Intracellular oxidation-reduction states in vivo. Science 1962;137:499–508.
Chih CP, Lipton P, Roberts EL, Jr. Do active cerebral neurons really use lactate rather than glucose? Trends Neurosci 2001;24(10):573–578.
Chih CP, Roberts Jr EL. Energy substrates for neurons during neural activity: a critical review of the astrocyte-neuron lactate shuttle hypothesis. J Cereb Blood Flow Metab 2003;23(11):1263–1281.
Conturo TE, Lori NF, Cull TS, Akbudak E, Snyder AZ, Shimony JS, McKinstry RC, Burton H, Raichle ME. Tracking neuronal fiber pathways in the living human brain. Proc Natl Acad Sci U S A 1999;96(18):10422–10427.
Cordes D, Haughton VM, Arfanakis K, Wendt GJ, Turski PA, Moritz CH, Quigley MA, Meyerand ME. Mapping functionally related regions of brain with functional connectivity MR imaging. AJNR Am J Neuroradiol 2000;21(9):1636–1644.
Crouzeix A, Yvert B, Bertrand O, Pernier J. An evaluation of dipole reconstruction accuracy with spherical and realistic head models in MEG. Clin Neurophysiol 1999;110(12):2176–2188.

69
Culver JP, Siegel AM, Franceschini MA, Mandeville JB, Boas DA. Evidence that cerebral blood volume can provide brain activation maps with better spatial resolution than deoxygenated hemoglobin. Neuroimage 2005;27(4):947–959.
Dagli MS, Ingeholm JE, Haxby JV. Localization of cardiac-induced signal change in fMRI. Neuroimage 1999;9(4):407–415.
Dale AM, Sereno MI. Improved localization of cortical activity by combining EEG and MEG with MRI cortical surface reconstruction-a linear-approach. J Cogn Neurosci 1993;5(2):162–176.
Dale AM, Buckner RL. Selective averaging of rapidly presented individual trials using fMRI. Hum Brain Mapp 1997;5(5):329–340.
Dale AM, Liu AK, Fischl BR, Buckner RL, Belliveau JW, Lewine JD, Halgren E. Dynamic statistical parametric mapping: combining fMRI and MEG for high-resolution imaging of cortical activity. Neuron 2000;26(1):55–67.
Dechent P, Frahm J. Functional somatotopy of finger representations in human primary motor cortex. Hum Brain Mapp 2003;18(4):272–283.
Del Gratta C, Della Penna S, Tartaro A, Ferretti A, Torquati K, Bonomo L, Romani GL, Rossini PM. Topographic organization of the human primary and secondary somatosensory areas: an fMRI study. Neuroreport 2000;11(9):2035–2043.
Del Gratta C, Della Penna S, Ferretti A, Franciotti R, Pizzella V, Tartaro A, Torquati K, Bonomo L, Romani GL, Rossini PM. Topographic organization of the human primary and secondary somatosensory cortices: comparison of fMRI and MEG findings. Neuroimage 2002;17(3):1373–1383.
Denk W, Strickler JH, Webb WW. Two-photon laser scanning fluorescence microscopy. Science 1990;248(4951):73–76.
Devor A, Dunn AK, Andermann ML, Ulbert I, Boas DA, Dale AM. Coupling of total hemoglobin concentration, oxygenation, and neural activity in rat somatosensory cortex. Neuron 2003;39(2):353–359.
Disbrow E, Roberts T, Poeppel D, Krubitzer L. Evidence for interhemispheric processing of inputs from the hands in human S2 and PV. J Neurophysiol 2001;85(5):2236–2244.
Drevets WC, Burton H, Videen TO, Snyder AZ, Simpson JR, Jr., Raichle ME. Blood flow changes in human somatosensory cortex during anticipated stimulation. Nature 1995;373(6511):249–252.
70
Duffau H, Capelle L, Denvil D, Sichez N, Gatignol P, Taillandier L, Lopes M, Mitchell MC, Roche S, Muller JC, Bitar A, Sichez JP, van Effenterre R. Usefulness of intraoperative electrical subcortical mapping during surgery for low-grade gliomas located within eloquent brain regions: functional results in a consecutive series of 103 patients. J Neurosurg 2003;98(4):764–778.
Ehrsson HH, Kuhtz-Buschbeck JP, Forssberg H. Brain regions controlling nonsynergistic versus synergistic movement of the digits: a functional magnetic resonance imaging study. J Neurosci 2002;22(12):5074–5080.
Engel AK, Moll CK, Fried I, Ojemann GA. Invasive recordings from the human brain: clinical insights and beyond. Nat Rev Neurosci 2005;6(1):35–47.
Everitt BS, Bullmore ET. Mixture model mapping of the brain activation in functional magnetic resonance images. Hum Brain Mapp 1999;7(1):1–14.
Fandino J, Kollias SS, Wieser HG, Valavanis A, Yonekawa Y. Intraoperative validation of functional magnetic resonance imaging and cortical reorganization patterns in patients with brain tumors involving the primary motor cortex. J Neurosurg 1999;91(2):238–250.
Ferretti A, Babiloni C, Gratta CD, Caulo M, Tartaro A, Bonomo L, Rossini PM, Romani GL. Functional topography of the secondary somatosensory cortex for nonpainful and painful stimuli: an fMRI study. Neuroimage 2003;20(3):1625–1638.
Ferretti A, Del Gratta C, Babiloni C, Caulo M, Arienzo D, Tartaro A, Rossini PM, Romani GL. Functional topography of the secondary somatosensory cortex for nonpainful and painful stimulation of median and tibial nerve: an fMRI study. Neuroimage 2004;23(3):1217–1225.
Fink GR, Frackowiak RS, Pietrzyk U, Passingham RE. Multiple nonprimary motor areas in the human cortex. J Neurophysiol 1997;77(4):2164–2174.
Forss N, Hari R, Salmelin R, Ahonen A, Hämäläinen M, Kajola M, Knuutila J, Simola J. Activation of the human posterior parietal cortex by median nerve stimulation. Exp Brain Res 1994;99(2):309–315.
Forss N, Merlet I, Vanni S, Hämäläinen M, Mauguière F, Hari R. Activation of human mesial cortex during somatosensory target detection task. Brain Res 1996;734(1-2):229–235.
Forss N, Hietanen M, Salonen O, Hari R. Modified activation of somatosensory cortical network in patients with right-hemisphere stroke. Brain 1999;122 ( Pt 10):1889–1899.
71
Fox MD, Snyder AZ, Zacks JM, Raichle ME. Coherent spontaneous activity accounts for trial-to-trial variability in human evoked brain responses. Nat Neurosci 2006;9(1):23–25.
Fox PT, Raichle ME. Focal physiological uncoupling of cerebral blood flow and oxidative metabolism during somatosensory stimulation in human subjects. Proc Natl Acad Sci U S A 1986;83(4):1140–1144.
Fox PT, Raichle ME, Mintun MA, Dence C. Nonoxidative glucose consumption during focal physiologic neural activity. Science 1988;241(4864):462–464.
Frahm J, Bruhn H, Merboldt KD, Hanicke W. Dynamic MR imaging of human brain oxygenation during rest and photic stimulation. J Magn Reson Imaging 1992;2(5):501–505.
Frahm J, Kruger G, Merboldt KD, Kleinschmidt A. Dynamic uncoupling and recoupling of perfusion and oxidative metabolism during focal brain activation in man. Magn Reson Med 1996;35(2):143–148.
Franceschini MA, Fantini S, Thompson JH, Culver JP, Boas DA. Hemodynamic evoked response of the sensorimotor cortex measured noninvasively with near-infrared optical imaging. Psychophysiology 2003;40(4):548–560.
Fransson P, Kruger G, Merboldt KD, Frahm J. Temporal characteristics of oxygenation-sensitive MRI responses to visual activation in humans. Magn Reson Med 1998;39(6):912–919.
Fried I, Wilson CL, Maidment NT, Engel J, Jr., Behnke E, Fields TA, MacDonald KA, Morrow JW, Ackerson L. Cerebral microdialysis combined with single-neuron and electroencephalographic recording in neurosurgical patients. Technical note. J Neurosurg 1999;91(4):697–705.
Friston KJ, Worsley KJ, Frackowiak RSJ, Mazziotta JC, Evans AC. Assessing the significance of focal activations using their spatial extent. Hum Brain Mapp 1994;1:214–220.
Friston KJ, Holmes AP, Poline J-B, Grasby PJ, Williams SCR, Frackowiak RSJ, Turner R. Analysis of fMRI time-series revisited. Neuroimage 1995a;2(1):45–53.
Friston KJ, Holmes AP, Worsley KJ, Poline JP, Frith CD, Frackowiak RSJ. Statistical parametric maps in functional imaging: a general linear approach. Hum Brain Mapp 1995b;2:189–210.
Friston KJ, Williams S, Howard R, Frackowiak RS, Turner R. Movement-related effects in fMRI time-series. Magn Reson Med 1996;35(3):346–355.
Friston KJ, Mechelli A, Turner R, Price CJ. Nonlinear responses in fMRI: the balloon model, Volterra kernels, and other hemodynamics. Neuroimage 2000;12(4):466–477.

72
Gallen CC, Schwartz BJ, Bucholz RD, Malik G, Barkley GL, Smith J, Tung H, Copeland B, Bruno L, Assam S, et al. Presurgical localization of functional cortex using magnetic source imaging. J Neurosurg 1995;82(6):988–994.
Ganslandt O, Fahlbusch R, Nimsky C, Kober H, Möller M, Steinmeier R, Romstöck J, Vieth J. Functional neuronavigation with magnetoencephalography: outcome in 50 patients with lesions around the motor cortex. J Neurosurg 1999;91(1):73–79.
Garroway AN, Grannell PK, Mansfield P. Image-formation in NMR by a selective irradiative process. J Phys C Solid State Phys 1974;7(24):L457–L462.
Gati JS, Menon RS, Ugurbil K, Rutt BK. Experimental determination of the BOLD field strength dependence in vessels and tissue. Magn Reson Med 1997;38(2):296–302.
Genovese CR, Noll DC, Eddy WF. Estimating test-retest reliability in functional MR imaging. I: Statistical methodology. Magn Reson Med 1997;38(3):497–507.
Genovese CR, Lazar NA, Nichols T. Thresholding of statistical maps in functional neuroimaging using the false discovery rate. Neuroimage 2002;15(4):870–878.
George JS, Aine CJ, Mosher JC, Schmidt DM, Ranken DM, Schlitt HA, Wood CC, Lewine JD, Sanders JA, Belliveau JW. Mapping function in the human brain with magnetoencephalography, anatomical magnetic resonance imaging, and functional magnetic resonance imaging. J Clin Neurophysiol 1995;12(5):406–431.
Geyer S, Ledberg A, Schleicher A, Kinomura S, Schormann T, Burgel U, Klingberg T, Larsson J, Zilles K, Roland PE. Two different areas within the primary motor cortex of man. Nature 1996;382(6594):805–807.
Geyer S, Schleicher A, Zilles K. The somatosensory cortex of human: cytoarchitecture and regional distributions of receptor-binding sites. Neuroimage 1997;6(1):27–45.
Gharib S, Sutherling WW, Nakasato N, Barth DS, Baumgartner C, Alexopoulos N, Taylor S, Rogers RL. MEG and ECoG localization accuracy test. Electroencephalogr Clin Neurophysiol 1995;94(2):109–114.
Gjedde A, Otta S, Kuwabara H, Meyer E. Is oxygen diffusion limiting for blood-brain transfer of oxygen? In: Lassen NA, Ingvar DH, Raichle ME, Friberg L, editors. Brain work and mental activity, Alfred Benzon symposium 31. Copenhagen: Munsksgaard; 1991. p. 177–184.
Gjedde A, Marrett S, Vafaee M. Oxidative and nonoxidative metabolism of excited neurons and astrocytes. J Cereb Blood Flow Metab 2002;22(1):1–14.
Glover GH. Deconvolution of impulse response in event-related BOLD fMRI. Neuroimage 1999;9(4):416–429.

73
Goodyear BG, Menon RS. Brief visual stimulation allows mapping of ocular dominance in visual cortex using fMRI. Hum Brain Mapp 2001;14(4):210–217.
Grimm C, Schreiber A, Kristeva-Feige R, Mergner T, Hennig J, Lucking CH. A comparison between electric source localisation and fMRI during somatosensory stimulation. Electroencephalogr Clin Neurophysiol 1998;106(1):22–29.
Hajnal JV, Myers R, Oatridge A, Schwieso JE, Young IR, Bydder GM. Artifacts due to stimulus correlated motion in functional imaging of the brain. Magn Reson Med 1994;31(3):283–291.
Handwerker DA, Ollinger JM, D'Esposito M. Variation of BOLD hemodynamic responses across subjects and brain regions and their effects on statistical analyses. Neuroimage 2004;21(4):1639–1651.
Hari R, Hämäläinen M, Kaukoranta E, Reinikainen K, Teszner D. Neuromagnetic responses from the second somatosensory cortex in man. Acta Neurol Scand 1983;68(4):207–212.
Hari R, Karhu J, Hämäläinen M, Knuutila J, Salonen O, Sams M, Vilkman V. Somatosensory evoked cerebral magnetic fields from SI and SII in man. Eur J Neurosci 1984;57(3):254–263.
Hartvig NV, Jensen JL. Spatial mixture modeling of fMRI data. Hum Brain Mapp 2000;11(4):233–248.
Heinze HJ, Mangun GR, Burchert W, Hinrichs H, Scholz M, Munte TF, Gos A, Scherg M, Johannes S, Hundeshagen H, et al. Combined spatial and temporal imaging of brain activity during visual selective attention in humans. Nature 1994;372(6506):543–546.
Helmholtz H. Ueber einige gesetze der vertheilung elektrischer ströme in körperlichen leitern, mit anwendung auf die thierisch-elektrischen versuche. Ann Phys Chem 1853;89:211–233, 353–377.
Hertz L. The astrocyte-neuron lactate shuttle: a challenge of a challenge. J Cereb Blood Flow Metab 2004;24(11):1241–1248.
Hill DL, Smith AD, Simmons A, Maurer CR, Jr., Cox TC, Elwes R, Brammer M, Hawkes DJ, Polkey CE. Sources of error in comparing functional magnetic resonance imaging and invasive electrophysiological recordings. J Neurosurg 2000;93(2):214–223.
Hirsch J, Ruge MI, Kim KH, Correa DD, Victor JD, Relkin NR, Labar DR, Krol G, Bilsky MH, Souweidane MM, DeAngelis LM, Gutin PH. An integrated functional magnetic resonance imaging procedure for preoperative mapping of cortical areas associated with tactile, motor, language, and visual functions. Neurosurgery 2000;47(3):711–721.
74
Hluštík P, Solodkin A, Gullapalli RP, Noll DC, Small SL. Somatotopy in human primary motor and somatosensory hand representations revisited. Cereb Cortex 2001;11(4):312–321.
Hoge RD, Atkinson J, Gill B, Crelier GR, Marrett S, Pike GB. Linear coupling between cerebral blood flow and oxygen consumption in activated human cortex. Proc Natl Acad Sci U S A 1999;96(16):9403–9408.
Holodny AI, Schulder M, Liu WC, Wolko J, Maldjian JA, Kalnin AJ. The effect of brain tumors on BOLD functional MR imaging activation in the adjacent motor cortex: implications for image-guided neurosurgery. AJNR Am J Neuroradiol 2000;21(8):1415–1422.
Horwitz B, Poeppel D. How can EEG/MEG and fMRI/PET data be combined? Hum Brain Mapp 2002;17(1):1–3.
Hoshi Y, Tamura M. Detection of dynamic changes in cerebral oxygenation coupled to neuronal function during mental work in man. Neurosci Lett 1993;150(1):5–8.
Hu X, Le TH, Parrish T, Erhard P. Retrospective estimation and correction of physiological fluctuation in functional MRI. Magn Reson Med 1995;34(2):201–212.
Hu Y, Wilson GS. A temporary local energy pool coupled to neuronal activity: fluctuations of extracellular lactate levels in rat brain monitored with rapid-response enzyme-based sensor. J Neurochem 1997;69(4):1484–1490.
Huettel SA, McCarthy G. Regional differences in the refractory period of the hemodynamic response: an event-related fMRI study. Neuroimage 2001;14(5):967–976.
Humberstone M, Sawle GV, Clare S, Hykin J, Coxon R, Bowtell R, Macdonald IA, Morris PG. Functional magnetic resonance imaging of single motor events reveals human presupplementary motor area. Ann Neurol 1997;42(4):632–637.
Huttunen J. Does the P35m SEF deflection really come from the motor cortex? Electroencephalogr Clin Neurophysiol 1997;104(1):101–102.
Hyder F, Chase JR, Behar KL, Mason GF, Siddeek M, Rothman DL, Shulman RG. Increased tricarboxylic acid cycle flux in rat brain during forepaw stimulation detected with 1H [13C] NMR. Proc Natl Acad Sci U S A 1996;93(15):7612–7617.
Hyder F, Shulman RG, Rothman DL. A model for the regulation of cerebral oxygen delivery. J Appl Physiol 1998;85(2):554–564.
Hyvärinen J. The parietal cortex of monkey and man. Berlin: Springer-Verlag; 1982.
75
Hämäläinen M, Hari R, Ilmoniemi RJ, Knuutila J, Lounasmaa OV. Magnetoencephalography-theory, instrumentation, and applications to noninvasive studies of the working human brain. Rev Mod Phys 1993;65(2):413–497.
Hämäläinen MS, Sarvas J. Realistic conductivity geometry model of the human head for interpretation of neuromagnetic data. IEEE Trans Biomed Eng 1989;36(2):165–171.
Hämäläinen MS, Ilmoniemi RJ. Interpreting magnetic fields of the brain: minimum norm estimates. Med Biol Eng Comput 1994;32(1):35–42.
Ibáñez V, Deiber MP, Sadato N, Toro C, Grissom J, Woods RP, Mazziotta JC, Hallett M. Effects of stimulus rate on regional cerebral blood flow after median nerve stimulation. Brain 1995;118 ( Pt 5):1339–1351.
Inoue T, Shimizu H, Nakasato N, Kumabe T, Yoshimoto T. Accuracy and limitation of functional magnetic resonance imaging for identification of the central sulcus: comparison with magnetoencephalography in patients with brain tumors. Neuroimage 1999;10(6):738–748.
Jack C, Jr, Thompson R, Butts R, Sharbrough F, Kelly P, Hanson D, Riederer S, Ehman R, Hangiandreou N, Cascino G. Sensory motor cortex: correlation of presurgical mapping with functional MR imaging and invasive cortical mapping. Radiology 1994;190(1):85–92.
Jenkinson M, Bannister P, Brady M, Smith S. Improved optimization for the robust and accurate linear registration and motion correction of brain images. Neuroimage 2002;17(2):825–841.
Jezzard P, Balaban RS. Correction for geometric distortion in echo planar images from B0 field variations. Magn Reson Med 1995;34(1):65-73.
Jezzard P, Clare S. Sources of distortion in functional MRI data. Hum Brain Mapp 1999;8(2-3):80–85.
Johansen-Berg H, Christensen V, Woolrich M, Matthews PM. Attention to touch modulates activity in both primary and secondary somatosensory areas. Neuroreport 2000;11(6):1237–1241.
Johnson KO. The roles and functions of cutaneous mechanoreceptors. Curr Opin Neurobiol 2001;11(4):455–461.
Jones EG, Powell TPS. Connexions of somatic sensory cortex of rhesus monkey. II. Contralateral cortical connexions. Brain 1969;92:717–730.
Jones EG, Coulter JD, Hendry SH. Intracortical connectivity of architectonic fields in the somatic sensory, motor and parietal cortex of monkeys. J Comp Neurol 1978;181(2):291–347.

76
Jones M, Berwick J, Johnston D, Mayhew J. Concurrent optical imaging spectroscopy and laser-Doppler flowmetry: the relationship between blood flow, oxygenation, and volume in rodent barrel cortex. Neuroimage 2001;13(6 Pt 1):1002–1015.
Josephson BD. Possible new effects in superconductive tunnelling. Phys Lett 1962;1(7):251–253.
Kaas JH, Nelson RJ, Sur M, Lin CS, Merzenich MM. Multiple representations of the body within the primary somatosensory cortex of primates. Science 1979;204(4392):521–523.
Kamada K, Houkin K, Takeuchi F, Ishii N, Ikeda J, Sawamura Y, Kuriki S, Kawaguchi H, Iwasaki Y. Visualization of the eloquent motor system by integration of MEG, functional, and anisotropic diffusion-weighted MRI in functional neuronavigation. Surg Neurol 2003;59(5):352–361.
Kampe KK, Jones RA, Auer DP. Frequency dependence of the functional MRI response after electrical median nerve stimulation. Hum Brain Mapp 2000;9(2):106–114.
Kandel ER, Schwartz JH, Jessel TM, editors. Principles of neural science. 4th ed. New York: McGraw-Hill; 2000.
Kanno A, Nakasato N, Hatanaka K, Yoshimoto T. Ipsilateral area 3b responses to median nerve somatosensory stimulation. Neuroimage 2003;18(1):169–177.
Kanno A, Nakasato N, Nagamine Y, Tominaga T. Non-transcallosal ipsilateral area 3b responses to median nerve stimulus. J Clin Neurosci 2004;11(8):868–871.
Karhu J, Tesche CD. Simultaneous early processing of sensory input in human primary (SI) and secondary (SII) somatosensory cortices. J Neurophysiol 1999;81(5):2017–2025.
Kasischke KA, Vishwasrao HD, Fisher PJ, Zipfel WR, Webb WW. Neural activity triggers neuronal oxidative metabolism followed by astrocytic glycolysis. Science 2004;305(5680):99–103.
Kato T, Kamei A, Takashima S, Ozaki T. Human visual cortical function during photic-stimulation monitoring by means of near-infrared spectroscopy. J Cereb Blood Flow Metab 1993;13(3):516–520.
Kawamura T, Nakasato N, Seki K, Kanno A, Fujita S, Fujiwara S, Yoshimoto T. Neuromagnetic evidence of pre- and post-central cortical sources of somatosensory evoked responses. Electroencephalogr Clin Neurophysiol 1996;100(1):44–50.
Kim DS, Duong TQ, Kim SG. High-resolution mapping of iso-orientation columns by fMRI. Nat Neurosci 2000;3(2):164–169.
Kim S-G, Duong TQ. Mapping cortical columnar structures using fMRI. Physiol Behav 2002;77(4-5):641–644.

77
Kober H, Nimsky C, Möller M, Hastreiter P, Fahlbusch R, Ganslandt O. Correlation of sensorimotor activation with functional magnetic resonance imaging and magnetoencephalography in presurgical functional imaging: a spatial analysis. Neuroimage 2001;14(5):1214–1228.
Kollias SS, Alkadhi H, Jaermann T, Crelier G, Hepp-Reymond MC. Identification of multiple nonprimary motor cortical areas with simple movements. Brain Res Brain Res Rev 2001;36(2-3):185–195.
Krings T, Buchbinder BR, Butler WE, Chiappa KH, Jiang HJ, Cosgrove GR, Rosen BR. Functional magnetic resonance imaging and transcranial magnetic stimulation: complementary approaches in the evaluation of cortical motor function. Neurology 1997;48(5):1406–1416.
Krings T, Reinges MH, Erberich S, Kemeny S, Rohde V, Spetzger U, Korinth M, Willmes K, Gilsbach JM, Thron A. Functional MRI for presurgical planning: problems, artefacts, and solution strategies. J Neurol Neurosurg Psychiatry 2001;70(6):749–760.
Krings T, Schreckenberger M, Rohde V, Spetzger U, Sabri O, Reinges MH, Hans FJ, Meyer PT, Moller-Hartmann W, Gilsbach JM, Buell U, Thron A. Functional MRI and 18F FDG-positron emission tomography for presurgical planning: comparison with electrical cortical stimulation. Acta Neurochir (Wien) 2002;144(9):889–899.
Krubitzer L, Clarey J, Tweedale R, Elston G, Calford M. A redefinition of somatosensory areas in the lateral sulcus of macaque monkeys. J Neurosci 1995;15(5):3821–3839.
Kruger G, Kleinschmidt A, Frahm J. Dynamic MRI sensitized to cerebral blood oxygenation and flow during sustained activation of human visual cortex. Magn Reson Med 1996;35(6):797–800.
Kwong KK, Belliveau JW, Chesler DA, Goldberg IE, Weisskoff RM, Poncelet BP, Kennedy DN, Hoppel BE, Cohen MS, Turner R, et al. Dynamic magnetic resonance imaging of human brain activity during primary sensory stimulation. Proc Natl Acad Sci U S A 1992;89(12):5675–5679.
Lai S, Hopkins AL, Haacke EM, Li D, Wasserman BA, Buckley P, Friedman L, Meltzer H, Hedera P, Friedland R. Identification of vascular structures as a major source of signal contrast in high resolution 2D and 3D functional activation imaging of the motor cortex at 1.5T: preliminary results. Magn Reson Med 1993;30(3):387–392.
Lauterbur PC. Image formation by induced local interactions - examples employing nuclear magnetic-resonance. Nature 1973;242(5394):190–191.

78
Lee KM, Chang KH, Roh JK. Subregions within the supplementary motor area activated at different stages of movement preparation and execution. Neuroimage 1999;9(1):117–123.
Lehéricy S, Duffau H, Cornu P, Capelle L, Pidoux B, Carpentier A, Auliac S, Clemenceau S, Sichez JP, Bitar A, Valery CA, Van Effenterre R, Faillot T, Srour A, Fohanno D, Philippon J, Le Bihan D, Marsault C. Correspondence between functional magnetic resonance imaging somatotopy and individual brain anatomy of the central region: comparison with intraoperative stimulation in patients with brain tumors. J Neurosurg 2000;92(4):589–598.
Lin FH, Belliveau JW, Dale AM, Hamalainen MS. Distributed current estimates using cortical orientation constraints. Hum Brain Mapp 2006;27(1):1–13.
Lindauer U, Royl G, Leithner C, Kuhl M, Gold L, Gethmann J, Kohl-Bareis M, Villringer A, Dirnagl U. No evidence for early decrease in blood oxygenation in rat whisker cortex in response to functional activation. Neuroimage 2001;13(6 Pt 1):988–1001.
Liu AK, Belliveau JW, Dale AM. Spatiotemporal imaging of human brain activity using functional MRI constrained magnetoencephalography data: Monte Carlo simulations. Proc Natl Acad Sci U S A 1998;95(15):8945–8950.
Logothetis NK, Pauls J, Augath M, Trinath T, Oeltermann A. Neurophysiological investigation of the basis of the fMRI signal. Nature 2001;412(6843):150–157.
Lu H, Golay X, Pekar JJ, Van Zijl PC. Functional magnetic resonance imaging based on changes in vascular space occupancy. Magn Reson Med 2003;50(2):263–274.
Lu H, Golay X, Pekar JJ, Van Zijl PC. Sustained poststimulus elevation in cerebral oxygen utilization after vascular recovery. J Cereb Blood Flow Metab 2004;24(7):764–770.
Lüders H, Lesser RP, Dinner DS, Hahn JF, Salanga V, Morris HH. The second sensory area in humans: evoked potential and electrical stimulation studies. Ann Neurol 1985;17(2):177–184.
Lüders H, Dinner DS, Lesser RP, Morris HH. Evoked potentials in cortical localization. J Clin Neurophysiol 1986;3(1):75–84.
Malonek D, Grinvald A. Interactions between electrical activity and cortical microcirculation revealed by imaging spectroscopy: implications for functional brain mapping. Science 1996;272(5261):551–554.
Mandeville JB, Marota JJ, Ayata C, Zaharchuk G, Moskowitz MA, Rosen BR, Weisskoff RM. Evidence of a cerebrovascular postarteriole windkessel with delayed compliance. J Cereb Blood Flow Metab 1999;19(6):679–689.
79
Mangia S, Garreffa G, Bianciardi M, Giove F, Di Salle F, Maraviglia B. The aerobic brain: lactate decrease at the onset of neural activity. Neuroscience 2003;118(1):7–10.
Mangun GR, Hopfinger JB, Kussmaul CL, Fletcher EM, Heinze HJ. Covariations in ERP and PET measures of spatial selective attention in human extrastriate visual cortex. Hum Brain Mapp 1997;5(4):273–279.
Mangun GR, Buonocore MH, Girelli M, Jha AP. ERP and fMRI measures of visual spatial selective attention. Hum Brain Mapp 1998;6(5-6):383–389.
Mansfield P. Multi-planar image-formation using NMR spin echoes. J Phys C Solid State Phys 1977;10(3):L55–L58.
Marchini JL, Ripley BD. A new statistical approach to detecting significant activation in functional MRI. Neuroimage 2000;12(4):366–380.
Mathiesen C, Caesar K, Akgoren N, Lauritzen M. Modification of activity-dependent increases of cerebral blood flow by excitatory synaptic activity and spikes in rat cerebellar cortex. J Physiol 1998;512 ( Pt 2):555–566.
Mathiesen C, Caesar K, Lauritzen M. Temporal coupling between neuronal activity and blood flow in rat cerebellar cortex as indicated by field potential analysis. J Physiol 2000;523 Pt 1:235–246.
Mattout J, Phillips C, Penny WD, Rugg MD, Friston KJ. MEG source localization under multiple constraints: An extended Bayesian framework. Neuroimage 2005.
Mauguière F, Merlet I, Forss N, Vanni S, Jousmäki V, Adeleine P, Hari R. Activation of a distributed somatosensory cortical network in the human brain: a dipole modelling study of magnetic fields evoked by median nerve stimulation. Part II: Effects of stimulus rate, attention and stimulus detection. Electroencephalogr Clin Neurophysiol 1997a;104(4):290–295.
Mauguière F, Merlet I, Forss N, Vanni S, Jousmäki V, Adeleine P, Hari R. Activation of a distributed somatosensory cortical network in the human brain. A dipole modelling study of magnetic fields evoked by median nerve stimulation. Part I: Location and activation timing of SEF sources. Electroencephalogr Clin Neurophysiol 1997b;104(4):281–289.
McGlone F, Kelly EF, Trulsson M, Francis ST, Westling G, Bowtell R. Functional neuroimaging studies of human somatosensory cortex. Behav Brain Res 2002;135(1-2):147–158.
McGonigle DJ, Howseman AM, Athwal BS, Friston KJ, Frackowiak RS, Holmes AP. Variability in fMRI: an examination of intersession differences. Neuroimage 2000;11(6 Pt 1):708–734.

80
Menon RS, Luknowsky DC, Gati JS. Mental chronometry using latency-resolved functional MRI. Proc Natl Acad Sci U S A 1998;95(18):10902–10907.
Menon RS, Goodyear BG. Submillimeter functional localization in human striate cortex using BOLD contrast at 4 Tesla: implications for the vascular point-spread function. Magn Reson Med 1999;41(2):230–235.
Metea MR, Newman EA. Glial cells dilate and constrict blood vessels: a mechanism of neurovascular coupling. J Neurosci 2006;26(11):2862–2870.
Michel CM, Murray MM, Lantz G, Gonzalez S, Spinelli L, Grave de Peralta R. EEG source imaging. Clin Neurophysiol 2004;115(10):2195–2222.
Miezin FM, Maccotta L, Ollinger JM, Petersen SE, Buckner RL. Characterizing the hemodynamic response: effects of presentation rate, sampling procedure, and the possibility of ordering brain activity based on relative Timing. Neuroimage 2000;11(6):735–759.
Millett D. Hans Berger: from psychic energy to the EEG. Perspect Biol Med 2001;44(4):522–542.
Mintun MA, Lundstrom BN, Snyder AZ, Vlassenko AG, Shulman GL, Raichle ME. Blood flow and oxygen delivery to human brain during functional activity: theoretical modeling and experimental data. Proc Natl Acad Sci U S A 2001;98(12):6859–6864.
Mintun MA, Vlassenko AG, Shulman GL, Snyder AZ. Time-related increase of oxygen utilization in continuously activated human visual cortex. Neuroimage 2002;16(2):531–537.
Moradi F, Liu LC, Cheng K, Waggoner RA, Tanaka K, Ioannides AA. Consistent and precise localization of brain activity in human primary visual cortex by MEG and fMRI. Neuroimage 2003;18(3):595–609.
Mori S, Crain BJ, Chacko VP, van Zijl PC. Three-dimensional tracking of axonal projections in the brain by magnetic resonance imaging. Ann Neurol 1999;45(2):265–269.
Mosher JC, Lewis PS, Leahy RM. Multiple dipole modeling and localization from spatio-temporal MEG data. IEEE Trans Biomed Eng 1992;39(6):541–557.
Mueller WM, Yetkin FZ, Hammeke TA, Morris GL, 3rd, Swanson SJ, Reichert K, Cox R, Haughton VM. Functional magnetic resonance imaging mapping of the motor cortex in patients with cerebral tumors. Neurosurgery 1996;39(3):515–520.
Mukamel R, Gelbard H, Arieli A, Hasson U, Fried I, Malach R. Coupling between neuronal firing, field potentials, and FMRI in human auditory cortex. Science 2005;309(5736):951–954.

81
Mulligan SJ, MacVicar BA. Calcium transients in astrocyte endfeet cause cerebrovascular constrictions. Nature 2004;431(7005):195–199.
Mäkelä JP, Kirveskari E, Seppä M, Hämäläinen M, Forss N, Avikainen S, Salonen O, Salenius S, Kovala T, Randell T, Jääskeläinen J, Hari R. Three-dimensional integration of brain anatomy and function to facilitate intraoperative navigation around the sensorimotor strip. Hum Brain Mapp 2001;12(3):180–192.
Nemoto M, Sheth S, Guiou M, Pouratian N, Chen JW, Toga AW. Functional signal- and paradigm-dependent linear relationships between synaptic activity and hemodynamic responses in rat somatosensory cortex. J Neurosci 2004;24(15):3850–3861.
Nenov VI, Halgren E, Smith ME, Badier JM, Ropchan J, Blahd WH, Mandelkern M. Localized brain metabolic response correlated with potentials evoked by words. Behav Brain Res 1991;44(1):101–104.
Niessing J, Ebisch B, Schmidt KE, Niessing M, Singer W, Galuske RA. Hemodynamic signals correlate tightly with synchronized gamma oscillations. Science 2005;309(5736):948–951.
Nihashi T, Naganawa S, Sato C, Kawai H, Nakamura T, Fukatsu H, Ishigaki T, Aoki I. Contralateral and ipsilateral responses in primary somatosensory cortex following electrical median nerve stimulation--an fMRI study. Clin Neurophysiol 2005;116(4):842–848.
Noachtar S, Lüders HO, Dinner DS, Klem G. Ipsilateral median somatosensory evoked potentials recorded from human somatosensory cortex. Electroencephalogr Clin Neurophysiol 1997;104(3):189–198.
Northoff G, Richter A, Gessner M, Schlagenhauf F, Fell J, Baumgart F, Kaulisch T, Kotter R, Stephan KE, Leschinger A, Hagner T, Bargel B, Witzel T, Hinrichs H, Bogerts B, Scheich H, Heinze HJ. Functional dissociation between medial and lateral prefrontal cortical spatiotemporal activation in negative and positive emotions: a combined fMRI/MEG study. Cereb Cortex 2000;10(1):93–107.
Ogawa S, Lee TM, Kay AR, Tank DW. Brain magnetic resonance imaging with contrast dependent on blood oxygenation. Proc Natl Acad Sci U S A 1990;87(24):9868–9872.
Ogawa S, Tank DW, Menon R, Ellermann JM, Kim SG, Merkle H, Ugurbil K. Intrinsic signal changes accompanying sensory stimulation: functional brain mapping with magnetic resonance imaging. Proc Natl Acad Sci U S A 1992;89(13):5951–5955.
82
Ogawa S, Lee T-M, Stepnoski R, Chen W, Zhu X-H, Ugurbil K. An approach to probe some neural systems interaction by functional MRI at neural time scale down to milliseconds. Proc Natl Acad Sci U S A 2000;97(20):11026–11031.
Oja JM, Gillen J, Kauppinen RA, Kraut M, van Zijl PC. Venous blood effects in spin-echo fMRI of human brain. Magn Reson Med 1999;42(4):617–626.
Ojemann JG, Akbudak E, Snyder AZ, McKinstry RC, Raichle ME, Conturo TE. Anatomic Localization and Quantitative Analysis of Gradient Refocused Echo-Planar fMRI Susceptibility Artifacts. Neuroimage 1997;6(3):156–167.
Okada YC, Wu J, Kyuhou S. Genesis of MEG signals in a mammalian CNS structure. Electroencephalogr Clin Neurophysiol 1997;103(4):474–485.
Papke K, Reimer P, Renger B, Schuierer G, Knecht S, Schulz M, Heindel W. Optimized activation of the primary sensorimotor cortex for clinical functional MR imaging. AJNR Am J Neuroradiol 2000;21(2):395–401.
Pascual-Marqui RD, Michel CM, Lehmann D. Low resolution electromagnetic tomography: a new method for localizing electrical activity in the brain. Int J Psychophysiol 1994;18(1):49–65.
Pauling L, Coryell CD. The magnetic properties and structure of hemoglobin, oxyhemoglobin and carbonmonoxyhemoglobin. Proc Natl Acad Sci U S A 1936;22(4):210–216.
Pellerin L, Magistretti PJ. Glutamate uptake into astrocytes stimulates aerobic glycolysis: a mechanism coupling neuronal activity to glucose utilization. Proc Natl Acad Sci U S A 1994;91(22):10625–10629.
Pellerin L, Magistretti PJ. Let there be (NADH) light. Science 2004;305(5680):50–52. Petersen SE, Fox PT, Posner MI, Mintun M, Raichle ME. Positron emission
tomographic studies of the cortical anatomy of single-word processing. Nature 1988;331(6157):585–589.
Phillips JW, Leahy RM, Mosher JC. MEG-based imaging of focal neuronal current sources. IEEE Trans Med Imaging 1997;16(3):338–348.
Picard N, Strick PL. Imaging the premotor areas. Curr Opin Neurobiol 2001;11(6):663–672.
Pons TP, Garraghty PE, Friedman DP, Mishkin M. Physiological evidence for serial processing in somatosensory cortex. Science 1987;237(4813):417–420.
Prichard J, Rothman D, Novotny E, Petroff O, Kuwabara T, Avison M, Howseman A, Hanstock C, Shulman R. Lactate rise detected by 1H NMR in human visual cortex during physiologic stimulation. Proc Natl Acad Sci U S A 1991;88(13):5829–5831.

83
Pruessmann KP, Weiger M, Scheidegger MB, Boesiger P. SENSE: Sensitivity encoding for fast MRI. Magn Res Med 1999;42(5):952–962.
Puce A, Constable RT, Luby ML, McCarthy G, Nobre AC, Spencer DD, Gore JC, Allison T. Functional magnetic resonance imaging of sensory and motor cortex: comparison with electrophysiological localization. J Neurosurg 1995;83(2):262–270.
Pujol J, Conesa G, Deus J, Vendrell P, Isamat F, Zannoli G, Martí-Vilalta JL, Capdevila A. Presurgical identification of the primary sensorimotor cortex by functional magnetic resonance imaging. J Neurosurg 1996;84(1):7–13.
Pujol J, Conesa G, Deus J, López-Obarrio L, Isamat F, Capdevila A. Clinical application of functional magnetic resonance imaging in presurgical identification of the central sulcus. J Neurosurg 1998;88(5):863–869.
Rademacher J, Burgel U, Geyer S, Schormann T, Schleicher A, Freund HJ, Zilles K. Variability and asymmetry in the human precentral motor system. A cytoarchitectonic and myeloarchitectonic brain mapping study. Brain 2001;124(Pt 11):2232–2258.
Rees G, Friston K, Koch C. A direct quantitative relationship between the functional properties of human and macaque V5. Nat Neurosci 2000;3(7):716–723.
Rezai AR, Hund M, Kronberg E, Zonenshayn M, Cappell J, Ribary U, Kall B, Llinas R, Kelly PJ. The interactive use of magnetoencephalography in stereotactic image-guided neurosurgery. Neurosurgery 1996;39(1):92–102.
Richter W, Andersen PM, Georgopoulos AP, Kim SG. Sequential activity in human motor areas during a delayed cued finger movement task studied by time-resolved fMRI. Neuroreport 1997;8(5):1257–1261.
Rizzolatti G, Luppino G. The cortical motor system. Neuron 2001;31(6):889–901. Roberts TP, Rowley HA. Mapping of the sensorimotor cortex: functional MR and
magnetic source imaging. AJNR Am J Neuroradiol 1997;18(5):871–880. Robson MD, Dorosz JL, Gore JC. Measurements of the temporal fMRI Response of the
human auditory cortex to trains of tones. Neuroimage 1998;7(3):185–198. Roux FE, Boulanouar K, Ranjeva JP, Tremoulet M, Henry P, Manelfe C, Sabatier J,
Berry I. Usefulness of motor functional MRI correlated to cortical mapping in Rolandic low-grade astrocytomas. Acta Neurochir (Wien) 1999;141(1):71–79.
Roy C, Sherrington C. On the regulation of the blood supply of the brain. J Physiol 1890;85-108.
Ruben J, Schwiemann J, Deuchert M, Meyer R, Krause T, Curio G, Villringer K, Kurth R, Villringer A. Somatotopic organization of human secondary somatosensory cortex. Cereb Cortex 2001;11(5):463–473.
84
Russell GS, Srinivasan R, Tucker DM. Bayesian estimates of error bounds for EEG source imaging. IEEE Trans Med Imaging 1998;17(6):1084–1089.
Salli E, Aronen HJ, Savolainen S, Korvenoja A, Visa A. Contextual clustering for analysis of functional MRI data. IEEE Trans Med Imaging 2001a;20(5):403–414.
Salli E, Korvenoja A, Visa A, Katila T, Aronen HJ. Reproducibility of fMRI: effect of the use of contextual information. Neuroimage 2001b;13:459–471.
Sanders JA, Lewine JD, Orrison WW. Comparison of primary motor cortex localization using functional magnetic resonance imaging and magnetoencephalography. Hum Brain Mapp 1996;4(1):47–57.
Sanes JN, Donoghue JP, Thangaraj V, Edelman RR, Warach S. Shared neural substrates controlling hand movements in human motor cortex. Science 1995;268(5218):1775–1777.
Sanes JN, Schieber MH. Orderly somatotopy in primary motor cortex: does it exist? Neuroimage 2001;13(6 Pt 1):968–974.
Sato MA, Yoshioka T, Kajihara S, Toyama K, Goda N, Doya K, Kawato M. Hierarchical Bayesian estimation for MEG inverse problem. Neuroimage 2004;23(3):806–826.
Scherg M, Von Cramon D. Two bilateral sources of the late AEP as identified by a spatio-temporal dipole model. Electroencephalogr Clin Neurophysiol 1985;62(1):32–44.
Schieber MH. Constraints on somatotopic organization in the primary motor cortex. J Neurophysiol 2001;86(5):2125–2143.
Schiffbauer H, Berger MS, Ferrari P, Freudenstein D, Rowley HA, Roberts TP. Preoperative magnetic source imaging for brain tumor surgery: a quantitative comparison with intraoperative sensory and motor mapping. J Neurosurg 2002;97(6):1333–1342.
Schmidt DM, George JS, Wood CC. Bayesian inference applied to the electromagnetic inverse problem. Hum Brain Mapp 1999;7(3):195–212.
Schroeter ML, Kupka T, Mildner T, Uludað K, von Cramon DY. Investigating the post-stimulus undershoot of the BOLD signal—a simultaneous fMRI and fNIRS study. Neuroimage 2006;30(2):349–358.
Schulder M, Maldjian JA, Liu WC, Holodny AI, Kalnin AT, Mun IK, Carmel PW. Functional image-guided surgery of intracranial tumors located in or near the sensorimotor cortex. J Neurosurg 1998;89(3):412–418.
Shanks MF, Pearson RC, Powell TP. The callosal connexions of the primary somatic sensory cortex in the monkey. Brain Res Rev 1985;356(1):43-65.

85
Sheth SA, Nemoto M, Guiou M, Walker M, Pouratian N, Hageman N, Toga AW. Columnar specificity of microvascular oxygenation and volume responses: implications for functional brain mapping. J Neurosci 2004a;24(3):634–641.
Sheth SA, Nemoto M, Guiou M, Walker M, Pouratian N, Toga AW. Linear and nonlinear relationships between neuronal activity, oxygen metabolism, and hemodynamic responses. Neuron 2004b;42(2):347–355.
Shmuel A, Augath M, Oeltermann A, Logothetis NK. Negative functional MRI response correlates with decreases in neuronal activity in monkey visual area V1. Nat Neurosci 2006;9(4):569–577.
Singh KD, Holliday IE, Furlong PL, Harding GF. Evaluation of MRI-MEG/EEG co-registration strategies using Monte Carlo simulation. Electroencephalogr Clin Neurophysiol 1997;102(2):81–85.
Smith AM, Lewis BK, Ruttimann UE, Ye FQ, Sinnwell TM, Yang Y, Duyn JH, Frank JA. Investigation of low frequency drift in fMRI signal. Neuroimage 1999;9(5):526–533.
Smith SM, Beckmann CF, Ramnani N, Woolrich MW, Bannister PR, Jenkinson M, Matthews PM, McGonigle DJ. Variability in fMRI: a re-examination of inter-session differences. Hum Brain Mapp 2005;24(3):248–257.
Sobel DF, Gallen CC, Schwartz BJ, Waltz TA, Copeland B, Yamada S, Hirschkoff EC, Bloom FE. Locating the central sulcus: comparison of MR anatomic and magnetoencephalographic functional methods. AJNR Am J Neuroradiol 1993;14(4):915–925.
Sodickson DK, Manning WJ. Simultaneous acquisition of spatial harmonics (SMASH): fast imaging with radiofrequency coil arrays. Magn Reson Med 1997;38(4):591–603.
Spiegel J, Tintera J, Gawehn J, Stoeter P, Treede RD. Functional MRI of human primary somatosensory and motor cortex during median nerve stimulation. Clin Neurophysiol 1999;110(1):47–52.
Staines WR, Graham SJ, Black SE, McIlroy WE. Task-relevant modulation of contralateral and ipsilateral primary somatosensory cortex and the role of a prefrontal-cortical sensory gating system. Neuroimage 2002;15(1):190–199.
Stancák A, Polácek H, Vrána J, Rachmanová R, Hoechstetter K, Tintera J, Scherg M. EEG source analysis and fMRI reveal two electrical sources in the fronto-parietal operculum during subepidermal finger stimulation. Neuroimage 2005;25(1):8–20.
86
Stippich C, Freitag P, Kassubek J, Soros P, Kamada K, Kober H, Scheffler K, Hopfengartner R, Bilecen D, Radu EW, Vieth JB. Motor, somatosensory and auditory cortex localization by fMRI and MEG. Neuroreport 1998;9(9):1953–1957.
Stokely EM, Sveinsdottir E, Lassen NA, Rommer P. A single photon dynamic computer-assisted tomograph (DCAT) for imaging brain-function in multiple cross-sections. J Comput Assist Tomogr 1980;4(2):230–240.
Sun FT, Miller LM, D'Esposito M. Measuring temporal dynamics of functional networks using phase spectrum of fMRI data. Neuroimage 2005;28(1):227–237.
Sutherling WW, Crandall PH, Darcey TM, Becker DP, Levesque MF, Barth DS. The magnetic and electric fields agree with intracranial localizations of somatosensory cortex. Neurology 1988;38(11):1705–1714.
Takano T, Tian GF, Peng W, Lou N, Libionka W, Han X, Nedergaard M. Astrocyte-mediated control of cerebral blood flow. Nat Neurosci 2006;9(2):260–267.
Thompson JK, Peterson MR, Freeman RD. Single-neuron activity and tissue oxygenation in the cerebral cortex. Science 2003;299(5609):1070–1072.
Towle VL, Khorasani L, Uftring S, Pelizzari C, Erickson RK, Spire JP, Hoffmann K, Chu D, Scherg M. Noninvasive identification of human central sulcus: a comparison of gyral morphology, functional MRI, dipole localization, and direct cortical mapping. Neuroimage 2003;19(3):684–697.
Trujillo-Barreto NJ, Aubert-Vazquez E, Valdes-Sosa PA. Bayesian model averaging in EEG/MEG imaging. Neuroimage 2004;21(4):1300–1319.
Trulsson M, Francis ST, Kelly EF, Westling G, Bowtell R, McGlone F. Cortical responses to single mechanoreceptive afferent microstimulation revealed with fMRI. Neuroimage 2001;13(4):613–622.
Turner R. How much cortex can a vein drain? Downstream dilution of activation-related cerebral blood oxygenation changes. Neuroimage 2002;16(4):1062–1067.
Tuunanen PI, Kavec M, Jousmaki V, Usenius JP, Hari R, Salmelin R, Kauppinen RA. Comparison of BOLD fMRI and MEG characteristics to vibrotactile stimulation. Neuroimage 2003;19(4):1778–1786.
Tuunanen PI, Kauppinen RA. Effects of oxygen saturation on BOLD and arterial spin labelling perfusion fMRI signals studied in a motor activation task. Neuroimage 2006;30(1):102–109.
Tuunanen PI, Murray IJ, Parry NR, Kauppinen RA. Heterogeneous oxygen extraction in the visual cortex during activation in mild hypoxic hypoxia revealed by quantitative functional magnetic resonance imaging. J Cereb Blood Flow Metab 2006;26(2):263–273.
87
Uusitalo MA, Ilmoniemi RJ. Signal-space projection method for separating MEG or EEG into components. Med Biol Eng Comput 1997;35(2):135–140.
Uutela K, Hämäläinen M, Somersalo E. Visualization of magnetoencephalographic data using minimum current estimates. Neuroimage 1999;10(2):173–180.
Vafaee MS, Gjedde A. Model of blood-brain transfer of oxygen explains nonlinear flow-metabolism coupling during stimulation of visual cortex. J Cereb Blood Flow Metab 2000;20(4):747–754.
Walton L, Hampshire A, Forster DM, Kemeny AA. A phantom study to assess the accuracy of stereotactic localization, using T1-weighted magnetic resonance imaging with the Leksell stereotactic system. Neurosurgery 1996;38(1):170–176.
Wang J, Zhang Y, Wolf RL, Roc AC, Alsop DC, Detre JA. Amplitude-modulated continuous arterial spin-labeling 3.0-T perfusion MR imaging with a single coil: Feasibility study. Radiology 2005;235(1):218–228.
Vanzetta I, Grinvald A. Increased cortical oxidative metabolism due to sensory stimulation: implications for functional brain imaging. Science 1999;286(5444):1555–1558.
Vanzetta I, Grinvald A. Evidence and lack of evidence for the initial dip in the anesthetized rat: implications for human functional brain imaging. Neuroimage 2001;13(6 Pt 1):959–967.
Vates GE, Lawton MT, Wilson CB, McDermott MW, Halbach VV, Roberts TP, Rowley HA. Magnetic source imaging demonstrates altered cortical distribution of function in patients with arteriovenous malformations. Neurosurgery 2002;51(3):614–623.
Vazquez AL, Noll DC. Nonlinear aspects of the BOLD response in functional MRI. Neuroimage 1998;7(2):108–118.
Wiesendanger R, Wiesendanger M. The thalamic connections with medial area 6 (supplementary motor cortex) in the monkey (macaca fascicularis). Exp Brain Res 1985;59(1):91–104.
Wikström H, Huttunen J, Korvenoja A, Virtanen J, Salonen O, Aronen H, Ilmoniemi RJ. Effects of interstimulus interval on somatosensory evoked magnetic fields (SEFs): a hypothesis concerning SEF generation at the primary sensorimotor cortex. Electroencephalogr Clin Neurophysiol 1996;100(6):479–487.
Williams DS, Detre JA, Leigh JS, Koretsky AP. Magnetic resonance imaging of perfusion using spin inversion of arterial water. Proc Natl Acad Sci U S A 1992;89(1):212–216.

88
Villringer A, Planck J, Hock C, Schleinkofer L, Dirnagl U. Near infrared spectroscopy (NIRS): A new tool to study hemodynamic changes during activation of brain function in human adults. Neurosci Lett 1993;154(1-2):101–104.
Virtanen J, Ahveninen J, Ilmoniemi RJ, Näätänen R, Pekkonen E. Replicability of MEG and EEG measures of the auditory N1/N1m-response. Electroencephalogr Clin Neurophysiol 1998;108(3):291–298.
Vitacco D, Brandeis D, Pascual-Marqui R, Martin E. Correspondence of event-related potential tomography and functional magnetic resonance imaging during language processing. Hum Brain Mapp 2002;17(1):4–12.
Woolrich MW, Ripley BD, Brady M, Smith SM. Temporal autocorrelation in univariate linear modeling of FMRI data. Neuroimage 2001;14(6):1370–1386.
Woolrich MW, Behrens TE, Beckmann CF, Smith SM. Mixture models with adaptive spatial regularization for segmentation with an application to FMRI data. IEEE Trans Med Imaging 2005;24(1):1–11.
Woolsey CN, Erickson TC, Gilson WE. Localization in somatic sensory and motor areas of human cerebral cortex as determined by direct recording of evoked potentials and electrical stimulation. J Neurosurg 1979;51(4):476–506.
Worsley KJ, Friston KJ. Analysis of fMRI time-series revisited—again. Neuroimage 1995;2(3):173–181.
Worsley KJ, Marrett S, Neelin P, Vandal AC, Friston KJ, Evans AC. A unified statistical approach for determining significant signals in images of cerebral activation. Hum Brain Mapp 1996;4(1):58–73.
Wunderlich G, Knorr U, Herzog H, Kiwit JC, Freund HJ, Seitz RJ. Precentral glioma location determines the displacement of cortical hand representation. Neurosurgery 1998;42(1):18–26.
Yacoub E, Shmuel A, Pfeuffer J, Van De Moortele PF, Adriany G, Andersen P, Vaughan JT, Merkle H, Ugurbil K, Hu X. Imaging brain function in humans at 7 Tesla. Magn Reson Med 2001a;45(4):588–594.
Yacoub E, Shmuel A, Pfeuffer J, Van De Moortele PF, Adriany G, Ugurbil K, Hu X. Investigation of the initial dip in fMRI at 7 Tesla. NMR Biomed 2001b;14(7-8):408–412.
Yacoub E, Ugurbil K, Harel N. The spatial dependence of the poststimulus undershoot as revealed by high-resolution BOLD- and CBV-weighted fMRI. J Cereb Blood Flow Metab 2006;26(5):634–644.
Yetkin FZ, Mueller WM, Morris GL, McAuliffe TL, Ulmer JL, Cox RW, Daniels DL, Haughton VM. Functional MR activation correlated with intraoperative cortical mapping. AJNR Am J Neuroradiol 1997;18(7):1311–1315.
89
Yoo SS, Talos IF, Golby AJ, Black PM, Panych LP. Evaluating requirements for spatial resolution of fMRI for neurosurgical planning. Hum Brain Mapp 2004;21(1):34–43.
Young JP, Herath P, Eickhoff S, Choi J, Grefkes C, Zilles K, Roland PE. Somatotopy and attentional modulation of the human parietal and opercular regions. J Neurosci 2004;24(23):5391–5399.
Yousry TA, Schmid UD, Jassoy AG, Schmidt D, Eisner WE, Reulen HJ, Reiser MF, Lissner J. Topography of the cortical motor hand area: prospective study with functional MR imaging and direct motor mapping at surgery. Radiology 1995;195(1):23–29.
Yousry TA, Schmid UD, Schmidt D, Hagen T, Jassoy A, Reiser MF. The central sulcal vein: a landmark for identification of the central sulcus using functional magnetic resonance imaging. J Neurosurg 1996;85(4):608–617.
Zhang HQ, Murray GM, Coleman GT, Turman AB, Zhang SP, Rowe MJ. Functional characteristics of the parallel SI- and SII-projecting neurons of the thalamic ventral posterior nucleus in the marmoset. J Neurophysiol 2001;85(5):1805–1822.
Zheng Y, Martindale J, Johnston D, Jones M, Berwick J, Mayhew J. A model of the hemodynamic response and oxygen delivery to brain. Neuroimage 2002;16(3, Part 1):617–637.
Zimmerman JE, Thiene P, Harding JT. Design and operation of stable rf-biased superconducting point-contact quantum devices, and a note on properties of perfectly clean metal contacts. J Appl Phys 1970;41(4):1572–1580.
Zonta M, Angulo MC, Gobbo S, Rosengarten B, Hossmann KA, Pozzan T, Carmignoto G. Neuron-to-astrocyte signaling is central to the dynamic control of brain microcirculation. Nat Neurosci 2003;6(1):43–50.