comparison and terrain influence on predictions with linear and cfd models
TRANSCRIPT

Comparison and Terrain Influence on
Predictions with Linear and CFD
Models
CANWEA Annual Conference, Vancouver, BC
October 04, 2011
GILLES BOESCH, M.Eng, Wind Project Analyst
Hatch (Montreal), Canada

Overview
• Introduction
• Presentation of a test case
• Model comparison, terrain influence
• Conclusions and investigations
2
Introduction
• CFD is now well established in the wind
industry
• Need to quantify the uncertainty associated
to these models
• Compare the errors with linear models
• Influence of the errors with topography
complexity – And how to deal with it
3
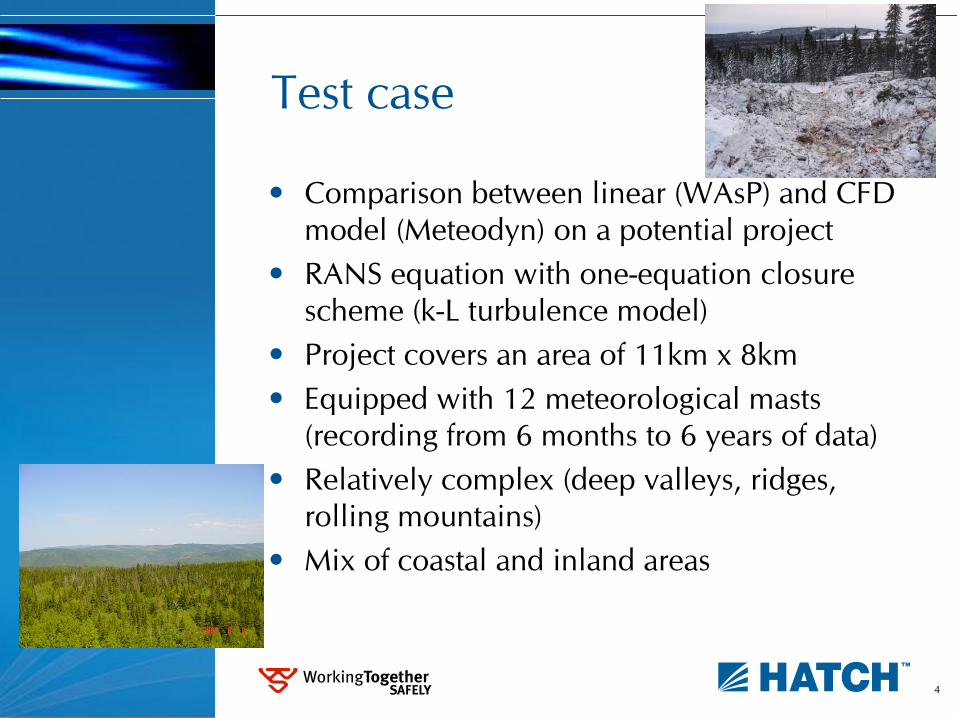
Test case
• Comparison between linear (WAsP) and CFD
model (Meteodyn) on a potential project
• RANS equation with one-equation closure
scheme (k-L turbulence model)
• Project covers an area of 11km x 8km
• Equipped with 12 meteorological masts
(recording from 6 months to 6 years of data)
• Relatively complex (deep valleys, ridges,
rolling mountains)
• Mix of coastal and inland areas
4
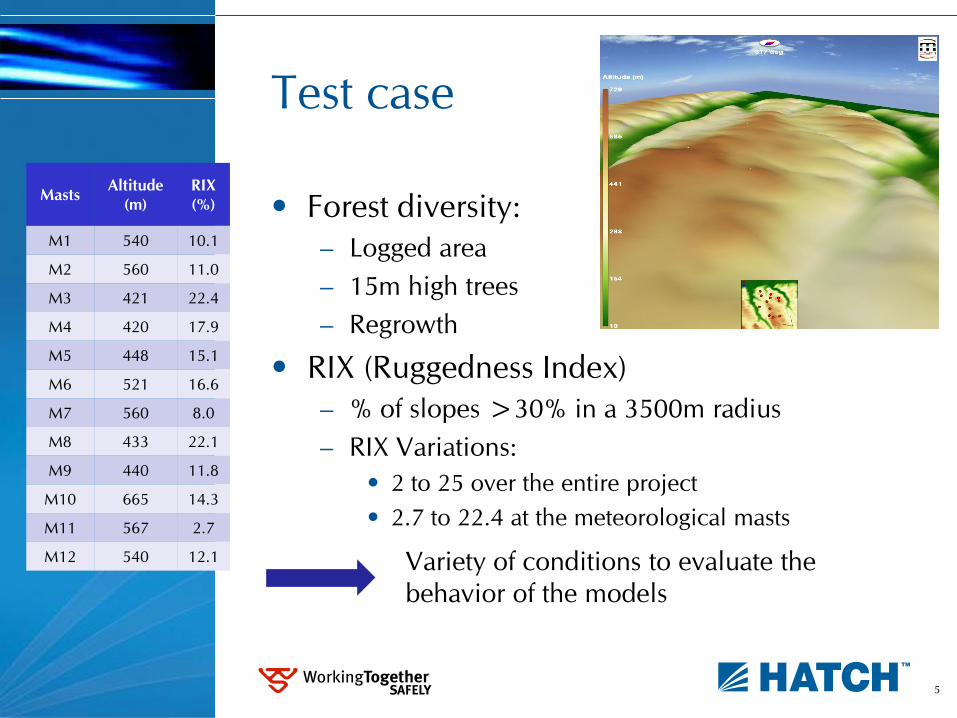
Test case
• Forest diversity:
– Logged area
– 15m high trees
– Regrowth
• RIX (Ruggedness Index)
– % of slopes >30% in a 3500m radius
– RIX Variations:
• 2 to 25 over the entire project
• 2.7 to 22.4 at the meteorological masts
Variety of conditions to evaluate the
behavior of the models
5
Masts Altitude
(m)
RIX
(%)
M1 540 10.1
M2 560 11.0
M3 421 22.4
M4 420 17.9
M5 448 15.1
M6 521 16.6
M7 560 8.0
M8 433 22.1
M9 440 11.8
M10 665 14.3
M11 567 2.7
M12 540 12.1
Test Case
• Meteodyn settings :
– Structured Mesh (30m cell size within the
project area)
– Use of a forest model (windflow over canopy)
– Neutral stability class assumed (can induce
errors for sea shore sites) – Resulting shear
verified for some masts
• Data :
– Measured and Quality controlled
– At 50m or 60m high (to avoid extrapolation
errors)
– Adjusted to long term with standard MCP
method (to have the same reference)
6
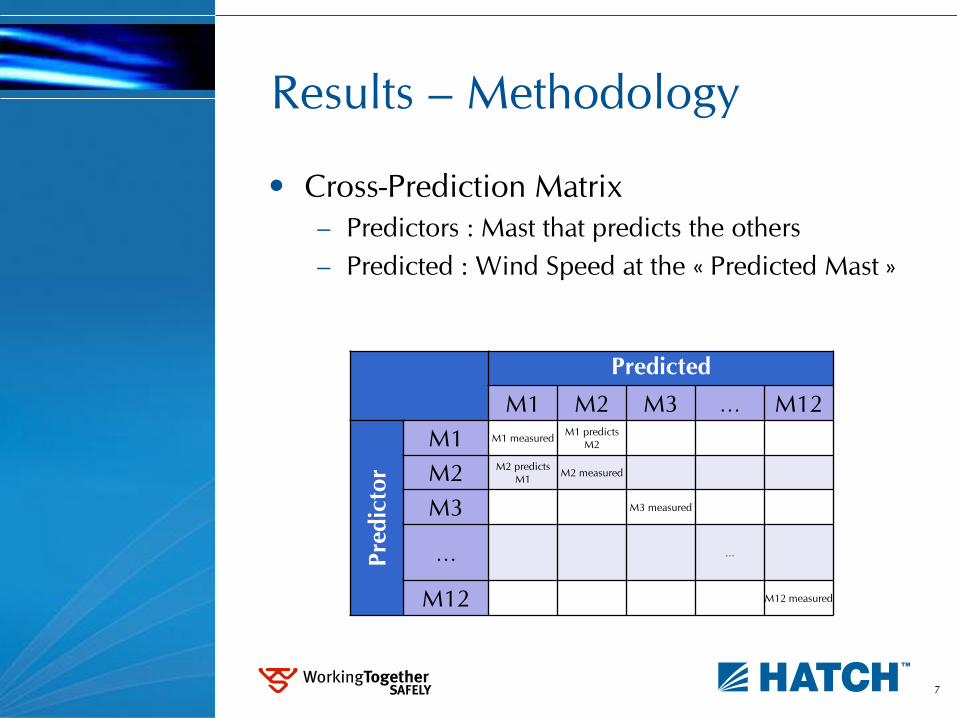
Results – Methodology
• Cross-Prediction Matrix
– Predictors : Mast that predicts the others
– Predicted : Wind Speed at the « Predicted Mast »
7
Predicted
M1 M2 M3 … M12 P
red
icto
r
M1 M1 measured M1 predicts
M2
M2 M2 predicts
M1 M2 measured
M3 M3 measured
… …
M12 M12 measured

Results - Methodology
• Cross-Prediction Matrix
– 12 x 12 matrix 132 cross predictions
– For both WAsP and Meteodyn
– No correction is applied to both models output
– Correction often applied with WAsP because of
wind speed inconsistencies in complex terrain
• Converted into a Relative Error Matrix :
• Resulting in 132 relative error values for
each cross-prediction
measured
measuredpredicted
V
VVE%
8

Results - Comparison
• Mean absolute errors
Masts Altitude
(m) RIX (%)
M1 540 10.1
M2 560 11.0
M3 421 22.4
M4 420 17.9
M5 448 15.1
M6 521 16.6
M7 560 8.0
M8 433 22.1
M9 440 11.8
M10 665 14.3
M11 567 2.7
M12 540 12.1
9
0.0%
5.0%
10.0%
15.0%
20.0%
25.0%
M1 M2 M3 M4 M5 M6 M7 M8 M9 M10 M11 M12
Err
or
(%)
Prediction Errors
WAsP Error
Meteodyn Error
< 2km from
water

Results - Comparison
• Absolute errors (direct output from models)
• On average, reduction of the error by 40%.
• Some exceptions : 33 cases out of 132
show better results with WAsP
WAsP Meteodyn
Min Error 0.0% 0.0%
Max Error 34.0% 14.1%
Average 7.7% 4.6%
10
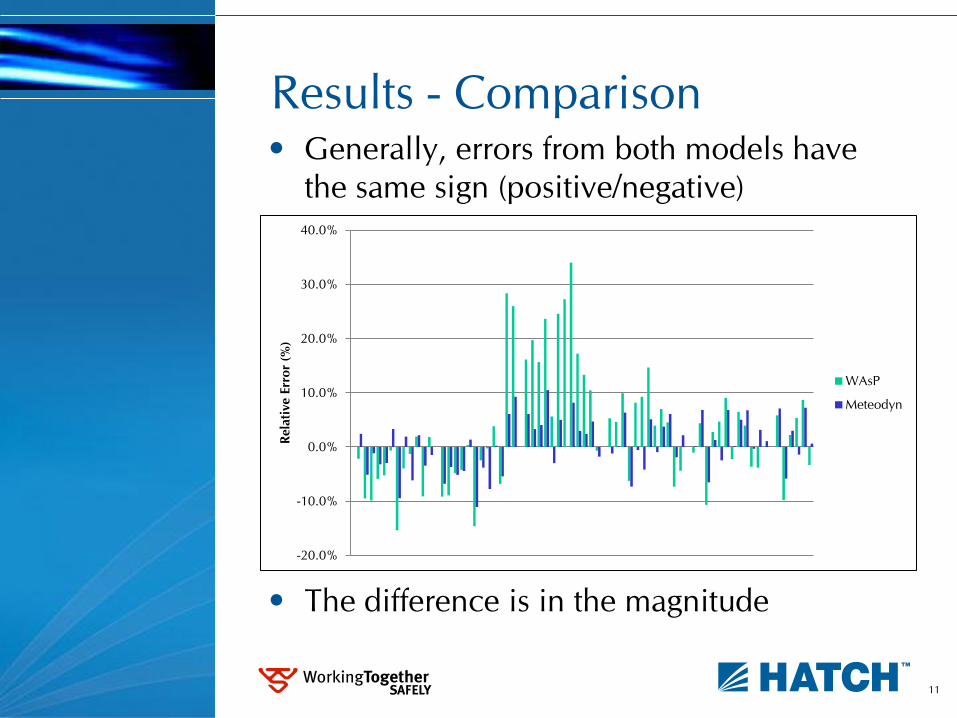
Results - Comparison • Generally, errors from both models have
the same sign (positive/negative)
• The difference is in the magnitude
-20.0%
-10.0%
0.0%
10.0%
20.0%
30.0%
40.0%
Rela
tive E
rro
r (%
)
WAsP
Meteodyn
11

Results – RIX Analysis
• RIX dependency:
– WAsP : Error increase sharply when RIX > 15%
– Meteodyn : Error is more constant
12
0.0%
5.0%
10.0%
15.0%
20.0%
25.0%
0.0 5.0 10.0 15.0 20.0 25.0
Avera
ge E
rro
r (%
)
RIX (%)
RIX influence on cross-prediction errors
Wasp Meteodyn
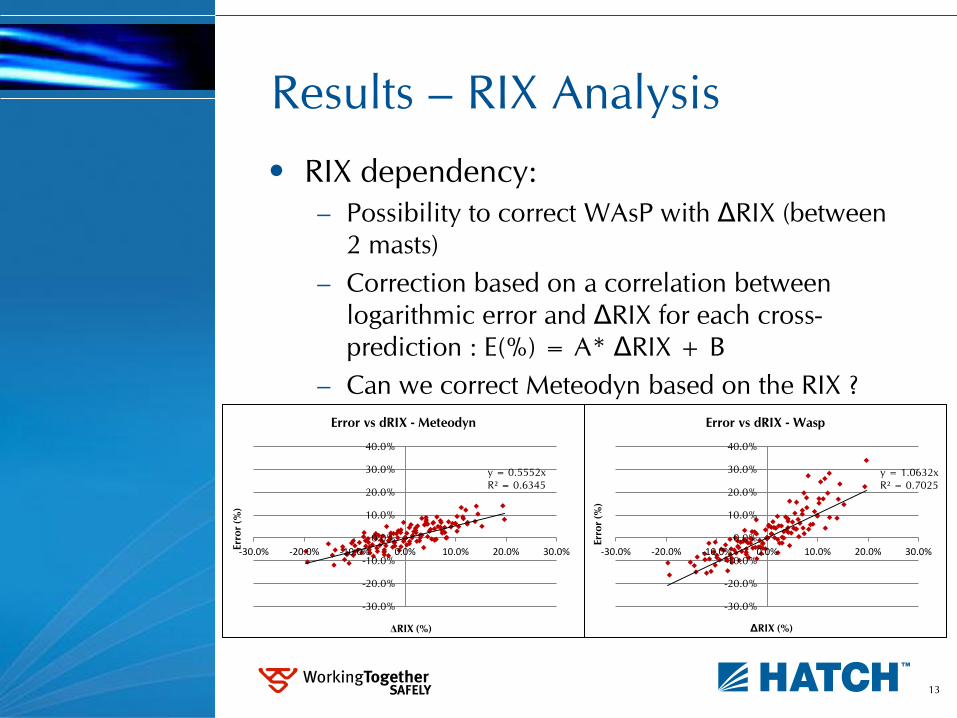
Results – RIX Analysis
• RIX dependency:
– Possibility to correct WAsP with ΔRIX (between
2 masts)
– Correction based on a correlation between
logarithmic error and ΔRIX for each cross-
prediction : E(%) = A* ΔRIX + B
– Can we correct Meteodyn based on the RIX ?
13
y = 0.5552x
R² = 0.6345
-30.0%
-20.0%
-10.0%
0.0%
10.0%
20.0%
30.0%
40.0%
-30.0% -20.0% -10.0% 0.0% 10.0% 20.0% 30.0% Err
or
(%)
ΔRIX (%)
Error vs dRIX - Meteodyn
y = 1.0632x
R² = 0.7025
-30.0%
-20.0%
-10.0%
0.0%
10.0%
20.0%
30.0%
40.0%
-30.0% -20.0% -10.0% 0.0% 10.0% 20.0% 30.0%
Err
or
(%)
ΔRIX (%)
Error vs dRIX - Wasp

Results – RIX Analysis
• CFD RIX dependency:
– Error increases when ΔRIX increases
– Error and ΔRIX seem to be correlating (not as
good than Wasp however)
– The slope is lower for Meteodyn
Influence of site topography differences is lower
14
y = 0.5552x
R² = 0.6345
-30.0%
-20.0%
-10.0%
0.0%
10.0%
20.0%
30.0%
40.0%
-30.0% -20.0% -10.0% 0.0% 10.0% 20.0% 30.0% Err
or
(%)
ΔRIX (%)
Error vs dRIX - Meteodyn
y = 1.0632x
R² = 0.7025
-30.0%
-20.0%
-10.0%
0.0%
10.0%
20.0%
30.0%
40.0%
-30.0% -20.0% -10.0% 0.0% 10.0% 20.0% 30.0%
Err
or
(%)
ΔRIX (%)
Error vs dRIX - Wasp

Results – RIX Analysis
• Wasp RIX Correction:
– 12 towers available
– Equation based on 11 towers and evaluate how
it corrects the 12th tower
15
0.0%
5.0%
10.0%
15.0%
20.0%
25.0%
M1 M2 M3 M4 M5 M6 M7 M8 M9 M10 M11 M12
Err
or
(%)
Prediction Errors
WAsP Error
Meteodyn Error
WAsP RIX Corrected Error

Results – RIX Analysis
• Meteodyn RIX Correction:
– Same methodology with updated correction
equation
16
0.0%
5.0%
10.0%
15.0%
20.0%
25.0%
M1 M2 M3 M4 M5 M6 M7 M8 M9 M10 M11 M12
Err
or
(%)
Prediction Errors
WAsP Error
WAsP RIX Corrected Error
Meteodyn Error
Meteodyn RIX Corrected Error
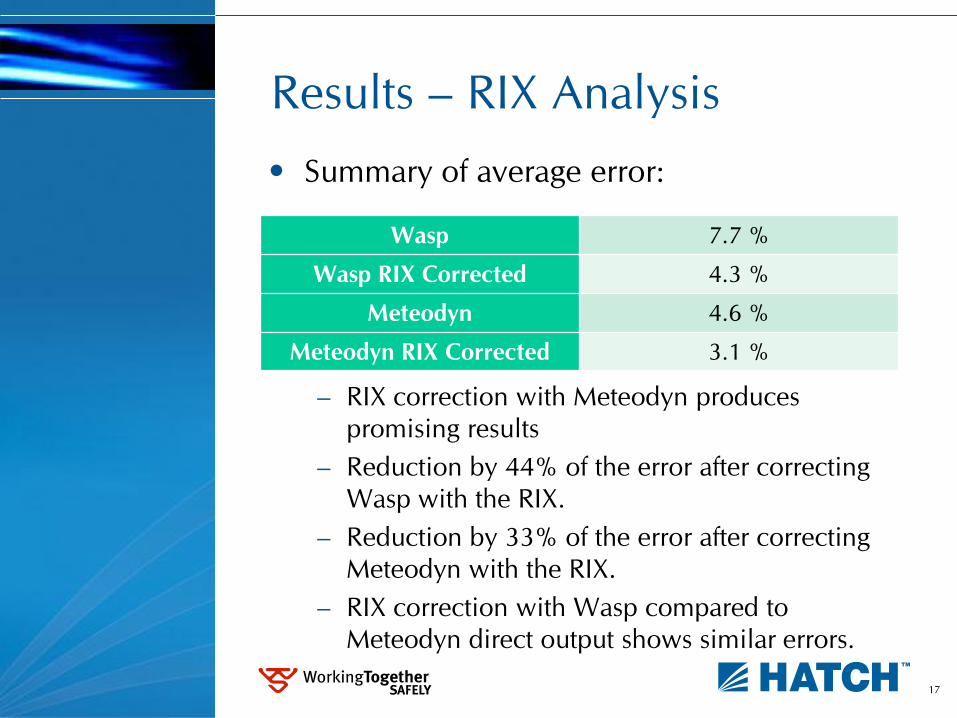
Results – RIX Analysis
• Summary of average error:
– RIX correction with Meteodyn produces
promising results
– Reduction by 44% of the error after correcting
Wasp with the RIX.
– Reduction by 33% of the error after correcting
Meteodyn with the RIX.
– RIX correction with Wasp compared to
Meteodyn direct output shows similar errors.
17
Wasp 7.7 %
Wasp RIX Corrected 4.3 %
Meteodyn 4.6 %
Meteodyn RIX Corrected 3.1 %

Conclusions
• In general, a project in complex terrain
requires lots of masts
• An alternative is the use of a CFD model
but linear corrected models can give good
results too
• Only few litterature over relation between
RIX and CFD models
• But quantification of CFD errors is more
complex (topography / volume
discretisation, forest model etc.)
In some cases error is bigger
18
Conclusions
• To go further :
– Try with concurrent data (when possible) to
avoid MCP related errors
– How does RIX correction with CFD performs for
other sites ?
– Introduction of new complexity index (takes
into account RIX, distance, vegetation,
stability…)
19
Thank you for your attention
Gilles Boesch, M.Eng
Wind Project Analyst
Hatch Ltd
20