comparison between method of one-factor...
TRANSCRIPT

COMPARISON BETWEEN METHOD OF ONE-FACTOR-AT-A-TIME (OFAT)
& DESIGN OF EXPERIMENT (DOE) IN SCREENING OF
IMMUNOGLOBULIN PRODUCTION STIMULATING FACTORS
MUHD ABD MURSYID B W MOHD.SABERI
A thesis submitted in fulfillment
of the requirements for the award of the degree of
Bachelor of Chemical Engineering (Biotechnology)
Faculty of Chemical & Natural Resources Engineering
Universiti Malaysia Pahang
Disember 2010

V
ABSTRACT
The medium of mouse-mouse hybridoma, 192 producing IgG against 17-OHP
was supplemented with seven different inducing agents at different range namely
lysozyme, lipopolysaccharides (LPS), potassium phosphate, aldolase, essential amino
acid, non-essential amino acid and sodium butyrate. This study aims to compare the
statistical design of experiments (DOE) and one-factor-at-a-time (OFAT) method in
screening immunoglobulin production stimulating factors. The culture medium
supplemented with the inducer agents were screened using OFAT method and Plakett-
Burman design method to determine inducer agent that gave positive effect. The effect
of inducer concentration towards the antibody production was studied using enzyme-
linked immunosorbent assay (ELISA) technique. The optimal concentrations for all the
inducing agent were failed to be found in OFAT method. The standard culture medium
without addition of inducer yield 0.234μg/ml of MAb. The culture supplemented with
the inducer agent that yields MAb close to the standard was non-essential amino acid.
Plakett-Burman design gave 12 runs with only the high level (+) and the low level (-) of
the inducer were used. Potassium phosphate, LPS and sodium butyrate was found to be
the most influential variable using Plakett-Burman design. Plakett-Burman design
however indicates that all the point was insignificant and the interaction between inducer
was not described. Plakett-Burman under DOE method gave the best time-wise
compared to OFAT method in screening monoclonal antibody stimulating factors.
VI
ABSTRAK
Media untuk sel hibridoma tikus-tikus, 192 yang menghasilkan immunoglobulin
(IgG) menentang 17-OHP dibekalkan dengan agen pemangkin pada sukatan yang
berbeza iaitu lisozim, lipopolysaccharides (LPS), kalium fosfat, aldolase, amino asid
perlu, amino asid tak-perlu, dan natrium butirat. Penyelidikan ini bertujuan
membandingan statistik rekaan eksperiment (DOE) dan kaedah satu-faktor-dalam-satu-
masa (OFAT) dalam saringan faktor ransangan ke atas penghasilan immunoglobulin.
Medium yang dilengkapi agen pemangkin disaring menggunakan kaedah OFAT dan
rekaan Plakett-Burman bagi menentukan agen pemangkin yang memberikan kesan
positif. Pengaruh kepekatan pemangkin terhadap pengeluaran antibodi dikaji
menggunakan teknik ELISA. Kepekatan optimum untuk semua agen pemangkin gagal
ditemui dalam kaedah OFAT. Medium kawalan tanpa penambahan pemangkin
mengeluarkan 0.234μg/ml MAb. Kultur dilengkapi agent pemangkin yang menghampiri
medium kawalan dalam pengeluaran MAb adalah amino asid tak-perlu. Rekaan Plakett-
Burman memberikan 12 percubaan dengan hanya menggunakan kadar maksima (+) dan
kadar minima (+). Dengan menggunakan rekaan Plakett-Burman Kalium fosfat, LPS
dan natrium butirat didapati menjadi pemngkin utama. Namun rekaan Plakett-Burman
menunjukkan bahawa semua nilai tidak releven dan gagal menunjukkan interaksi antara
pemangkin. Rekaan Plakett-Burman berdasarkan DOE memberikan pengendalian masa
yang terbaik dibandingkan dengan kaedah OFAT dalam saringan factor pemangkin
pengeluaran antibodi monoklonal.

VII
TABLE OF CONTENTS
CHAPTER TITLE PAGE
TITLE PAGE I
DECLARATION II
DEDICATION III
ACKNOWLEDGEMENT IV
ABSTRACT V
ABSTRAK VI
TABLE OF CONTENTS VII
LIST OF TABLES X
LIST OF FIGURES XI
LIST OF SYMBOLS/ABBREVIATIONS XII
1 INTRODUCTION
1.1 Background of Study 1
1.2 Choice of design for RSM 2
1.3 Identification of problem 3
1.4 Objectives 3
1.5 Scopes of Study 3

VIII
2 LITERATURE REVIEW
2.1 Introduction 4
2.2 Technique for cell culture 5
2.3 Selecting of inducing agent 6
2.4 Selcting of method use in screening 10
3 METHODOLOGY
3.1 Flow diagram 14
3.2 Materials 15
3.3 Baseline data collection 15
3.4 Screening using OFAT 15
3.5 Screening using Plakett-Burman design 16
3.6 Assay of stimulating activity of inducer 17
4 RESULTS AND DISCUSSIONS
4.1 Screening of the inducing agent by OFAT 19
4.1.1 Effect of Aldolase conc. on MAb conc. 20
4.1.2 Effect of LPS conc. on MAb conc. 21
4.1.3 Effect of Lysozyme conc. on MAb conc. 22
4.1.4 Effect of Sodium butyrate conc. on MAb conc. 23
4.1.5 Effect of Potassium phosphate conc. on MAb conc. 24
4.1.5 Effect of amino acid conc. on MAb conc. 26
4.2 Screening of the inducing agent by Plakett Burman 28

IX
5 CONCLUSION AND RECOMMENDATION
5.1 Conclusion 32
5.2 Recommendation 33
REFERENCES 35
APPENDICES 39

X
LIST OF TABLES
TABLE NO. TITLE PAGE
3.1 Range of inducing agent use in OFAT screening method 16
3.2 Plakett-Burman design 16
4.1 Plakett-Burman data
30
4.2 ANOVA data for Plakett-Burman Design
33

XI
LIST OF FIGURES
FIGURE
NO.
TITLE PAGE
2.1 Intracellular content of HB4C 8
2.2 Contour plot for CR catalytic degradation 11
3.1 6-well plate use for OFAT 17
3.2 ELISA 96-well plate
19
3.3 The process flow for ELISA 20
4.1 Graph for effect of aldolase
22
4.2 Graph for effect of LPS 23
4.3
Graph for effect of lysozyme 24
4.4
Graph for effect of sodium butyrate
25
4.5
Graph for effect of potassium phosphate 26
4.6 Graph for effect of essential amino acid 28
4.7 Graph for effect of non-essential amino acid 28
4.8 Main effect of inducing agents in Plakett-Burman 31

XII
LIST OF SYMBOLS/ABBREVIATIONS
ANOVA - Analysis of variance
CCD - Central composite design
g - Gram
g/L - Gram per litre
hr - Hour
L - Litre
M - Molar
mg - Miligram
min - Minutes
ml - Mililitre
mM - Milimolar
OD - Optical density
OFAT - One factor at time method
RSM - Response surface methodology
rpm - Round per minute

1
CHAPTER 1
INTRODUCTION
Monoclonal antibodies (MAbs) are high in demand nowadays for used in various
applications. To use these MAbs, large MAbs must be obtained from hybridoma cells.
However, mouse-mouse hybridomas usually produced low level of MAbs (Sato et al.,
1988). Therefore, many inducing agent is added to increase the antibodies production.
Screening test is the most appropriate experimental procedure to discover suitable
inducing agent or screening out insignificant inducing agent among others, in order to
identify those that may display significant effect on the antibodies production.
1.1 Background study
The screening is the way to determine which factors that returns the best possible
outcome (response). Generally there are two different strategies for screening: (a) One-
factor-at-a-time (OFAT) and (b) response surface methodology (RSM). One-factor-at-a-
time, OFAT approach examining one parameter while holding all other parameter
constant (Sakkas et al., 2010). In RSM, Design of Experiment (DOE) is employ. Design
of Experiment, DOE is a method for detecting interaction between parameter if any and
required fewer test than OFAT but require the use of statistics. As the research objective
is to compare which analyzing method is more practical in screening and optimizing of
MAbs stimulating factor. Most people preferred DOE because it account for interaction

2
effects between the studied parameter and determine accurately the combination of level
that produces the optimum condition.
1.2 Choice of design for RSM
The most important part before applying the RSM is the selection of appropriate
DOE. Compare to OFAT, DOE method is wider and has many type of design. The
common DOEs used in RSM (Sakkas et al., 2010) are:
1. Plackett-Burman (two-level fractional design) or full factorial design
Factor takes low (-) or high (+) value only. Its design is based on the first order model
which is; Z = bo + ∑ bixi where Z is the response, bo is the model intercept, bi is the
linear coefficient and xi is the level of independent. This model is selected because
although it does not describe the interaction among the factor, it gives less run compare
to other RSM method and only focus to select the factor that influences the response.
2. Full three level factorial design
Factor takes low, medium or high only and 2K or 3
K full factorial design is used to
determine number of run. In this design it is preferred if factor less than 5.
3. Central composite design (CCD)
Consist 3 type of point: cube point, axial point, and center point .To calculate the
number of experiment needed, N=2k+2k+Co. It is known as time consuming design with
large numbers of factors.
4. Box-Behnken design
The design is used for three levels of variable that are evenly spaced. To calculate the
number of experiment needed, N=2k(k-1)+ Co. This design avoids extreme conditions
of experiments.

3
1.2 Identification of Problem
1. Determination of number of component needed to be screen.
2. For OFAT method, screening large amount of inducing agent require long period
of time and may miss interaction effect.
3. For DOE method, can only detect interaction if any.
4. For DOE method, if choose too wide range will miss interaction effect and if
choose too narrow range won’t get the point.
1.3 Objectives
The main objective of this research is to compare the DOE and OFAT method in
screening MAbs stimulating factors.
1.4 Scope of Study
The scope of study is divided into three parts:
1. OFAT method and Plakett Burman design under DOE method is selected for
screening process.
2. The parameter that will be measured is specific growth rate and antibody
production.
3. 7 inducer agent is use in screening which are; potassium phosphate, lysozyme,
aldolase, lipopolysaccharide, sodium butyrate, essential amino acid, non-essential
amino acid.
1.5 Significance Study
The rationale of doing this research is so that DOE and OFAT methods can be
distinguish in screening MAbs.

4
CHAPTER 2
LITERATURE REVIEW
2.1 Introduction
In order to produce antibodies specific for human antigens, cell from mouse or
rat has always been the source of production (Mimura et al., 2001). However, mouse-
mouse hybridomas usually produced low level of MAbs (Sato et al., 1989). Therefore,
many attempts to facilitate immunoglobulin production on hybridomas cell by
modification of culture media has been made. Modification of culture media includes
addition of inducing agent such as lysozyme. This inducing agent even includes protein,
salt solution, and even antigen to be the stimulating factor of immunoglobulin
production. In addition to these possibilities, review is needed to determine material that
would stimulate the production of human MAbs and the range of concentration of the
material. To give a better proves, method for screening the material also needed to be
survey.

5
2.2 Technique for cell culture
There are many type of hybridomas cell and not all can tolerate in one condition
or has the same doubling time. However, all culture incubation should be in a
humidified 37°C, unless otherwise specified and DMEM medium may require CO2
alteration to maintain pH 7.4 (Phelan, 1998).
Based on the protocol for mammalian cell culture from Phelan (1998), before
passaging or subculture the cell into new flask to multiply the culture, cell must be
maintained in culture by feeding every 2 to 3 days until they reach confluency. One third
of the media need to be discarded before fresh medium is top up into the media. The
fresh media is also reminded to be warm before the replacement pocess. This is to
ensure the low temperature does not interrupt the cell growth or have cold shoch since
the old medium is warm already.
When a new cell is needed to be thawed, proper aseptic technique is needed
depending on the source of the freezer. If the cell is taken out form liquid nitrogen tank,
a quick thaw in the 37°C water bath with duration less than 60 second is needed to
prevent formation of ice crystals that can cause cell lysis. Then, cell is gently resuspend
in small amount of complete medium and centrifuge at 150g before discard the
supernatant to remove residual DMSO. Culture is checked after 24 hour to ensure that
cell have attached to the plate.
6
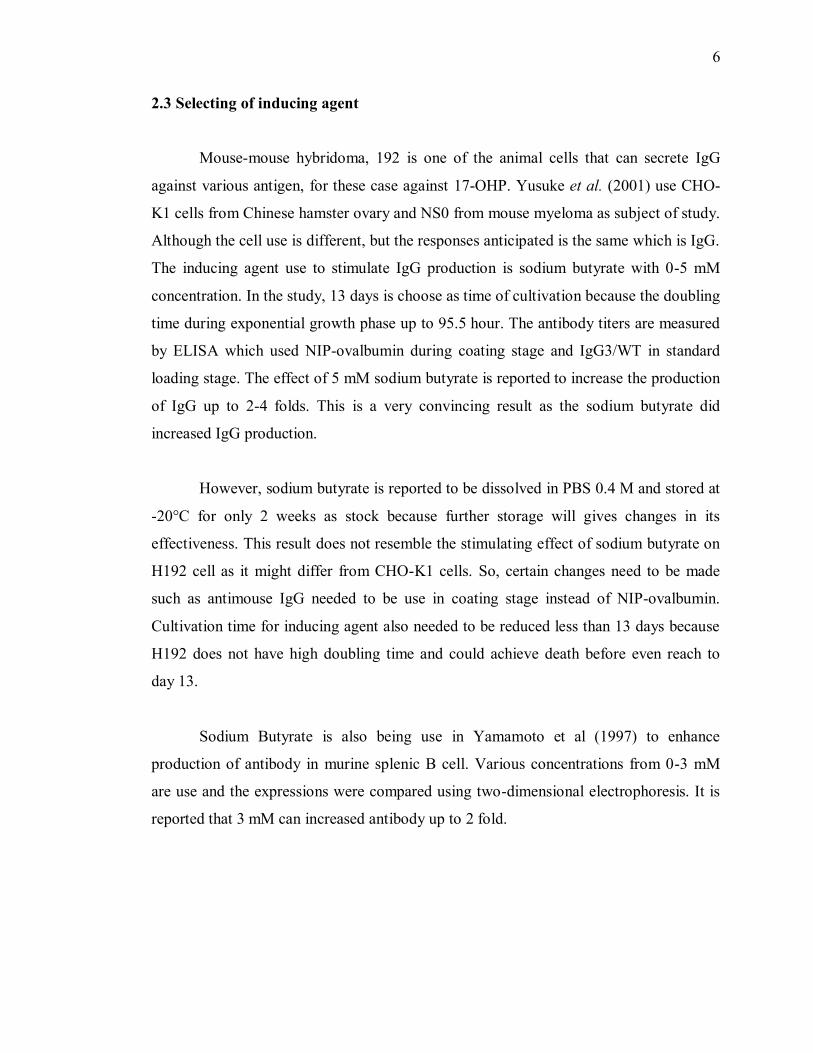
2.3 Selecting of inducing agent
Mouse-mouse hybridoma, 192 is one of the animal cells that can secrete IgG
against various antigen, for these case against 17-OHP. Yusuke et al. (2001) use CHO-
K1 cells from Chinese hamster ovary and NS0 from mouse myeloma as subject of study.
Although the cell use is different, but the responses anticipated is the same which is IgG.
The inducing agent use to stimulate IgG production is sodium butyrate with 0-5 mM
concentration. In the study, 13 days is choose as time of cultivation because the doubling
time during exponential growth phase up to 95.5 hour. The antibody titers are measured
by ELISA which used NIP-ovalbumin during coating stage and IgG3/WT in standard
loading stage. The effect of 5 mM sodium butyrate is reported to increase the production
of IgG up to 2-4 folds. This is a very convincing result as the sodium butyrate did
increased IgG production.
However, sodium butyrate is reported to be dissolved in PBS 0.4 M and stored at
-20°C for only 2 weeks as stock because further storage will gives changes in its
effectiveness. This result does not resemble the stimulating effect of sodium butyrate on
H192 cell as it might differ from CHO-K1 cells. So, certain changes need to be made
such as antimouse IgG needed to be use in coating stage instead of NIP-ovalbumin.
Cultivation time for inducing agent also needed to be reduced less than 13 days because
H192 does not have high doubling time and could achieve death before even reach to
day 13.
Sodium Butyrate is also being use in Yamamoto et al (1997) to enhance
production of antibody in murine splenic B cell. Various concentrations from 0-3 mM
are use and the expressions were compared using two-dimensional electrophoresis. It is
reported that 3 mM can increased antibody up to 2 fold.

7
Sato et al. (1989) analyzed stimulating effect of sodium and potassium phosphate
toward monoclonal antibody production in human hybridoma cells. Before stimulating
effect of sodium phosphate and potassium phosphate is being the scope of the study, a
research on additive for Rat Dermal Fibroblast (RDF) and Dulbecco Modified Eagle
(DME) basal medium is reported done. The research reported that result of IgG
stimulating only valid if insulin, transferin, ethanolamide, selenium and yolklipoprotein
(ITES/YLP) is use as an additive for basal medium because only basal medium with the
additive is further use to study the stimulating effect of sodium phosphate and potassium
phosphate.
Various concentration of sodium and potassium phosphate is used in1x105 to
5x10⁵cells/ml of HB4C5 cells according to Sato et al. (1989). It is reported that,
potassium phosphate was more effective compare to sodium phosphate. Cell seeded at
5x10⁵cells/ml only gives maximum production of Mabs. Control media only produced
0.08μg/ml-0.42μg/ml MAbs titer while addition of 15 mM potassium phosphate can
produced MAbs up to 1.8μg/ml. Although potassium phosphate is just a salt, but it gives
pH effect when added to medium. It is stated in the research to maintain the potassium
phosphate solution at pH 7.4 before adding into medium although no chemical addition
is stated to maintain the pH.
There are four main immunoglobulin (Ig) that is secreted in human body as
defense against pathogen and antigen which are IgG, IgM, IgA and IgD (McKee et al.,
2003). But not all inducing agent that stimulate one type of Ig can stimulate another type
of Ig. Sugawara et al. (1982) reported that Phorbal Myristate Acetate (PMA) only
induced polyclonal IgM production on human pheripheral B.

8
Sugahara et al. (1998) on the other hand reported that aldolase from rabbit
muscle can enhance both IgM and IgG by different fold respectively. 1x10⁶
cells/ml of
HBC5 cell is seeded into insulin-transferrin-ethanolamide-selenium (ITES-ERDF)
medium and added with 100μg/ml-1000μg/ml aldolase. MAbs titers are only being
reported analyzed after 4 days and 8 days. IgM is reported to increase about 5.3 folds
while IgG up to 1.4 fold. The research shows that aldolase still can be use to enhance
IgG production although it enhance IgM better. However, PMA use in Sugawara et al.
(1982) is not applicable to be use to enhance monoclonal IgG. Although only day 4 and
day 8 IgG titer data is recorded in data, but still increasing of IgM production after 4
hour is recorded in graph. This is why research needed to be done to determine whether
aldolase can increase IgG less than 4 days.
Sugahara et al. (2000) on the other hand study the mode of actions of lysozyme
as an immunoglobulin production stimulating factor. Human-numan hybridoma, HB4C5
cell was cultured in ITES-ERDF medium supplemented with 380 μg/ml of lysozyme.
The cell also was reported to be treated with actinomycin D to suppress transcription,
treated with cycloheximide to suppress translation and treated with monensin to suppress
post-transcription. The figure 2.1 clarify fact that monensin cause high IgM content in
cell but inhibit secretion of IgM. IgM production is reported to increase up till
501.1μg/ml and lysozyme also can increase the production of IgG up to 2.3 fold. So, in
order to use lysozyme to increase IgG secretion, no monensim treatment is needed.
A B
Figure 2.1: Intracellular content of HB4C cell with addition of lysozyme and:
(A) without monesim treatment; (B) with monesim treatment,
(Sugahara et al., 2000)

9
Shinohara et al. (1993) study the effect of some constituents’ egg yolk
lipoprotein (YLP) on the growth and IgM production of human hybridoma cells. HB4C5
cells were plated at cell density 5x10⁵cells/ml and supplement with various
concentrations of constituents’ YLP and after 4 days, YP-1 fraction at concentration of
500 μg/ml produced highest cell number and IgM concentration compare to YP-2, YP-3,
and YP-4. Sugahara Takuya et al. (1999) study the effect of aldolase from rabbit muscle
towards immunoglobulin production in human hybridoma cells. HB4C5 cells were
inoculated at 1x10⁵ cells/ml in ITES-ERDF medium supplemented with r-aldolase at
different concentrations. After 6 hour cultivation, aldolase concentration at 9000 μg/ml
increase the IgM concentration. Although all of them has tested to induced IgM, this
however only been done to human hybridoma cell and not to mouse hybridoma cell. The
effect might be varied if the cell used in culture is different. To improve their research,
this research will use as many inducing agent in mouse hybridoma cell culture and try to
screen using OFAT method and Plakett-Burmen under DOE to see which inducing agent
give the most effect towards MAbs production. Then, compare which method gives the
best result toward optimizing MAbs production.
A model based on the stoichiometric nutritional demand has also been developed
(Xie and Wang, 1994) to avoid toxic waste accumulation in the culture. The importance
of balance supplementation has been stressed especially amino acid to avoid excess
toxicity from certain vitamin (Baker et al., 1988). This toxic will suppress antibody
production and growth rate of cell. Therefore, Ducommun et al., (2001) has done
research to study the formulation of medium and concentration of amino acid on murine
hybridoma cell, Zac3. Medium use for cell nutrition supply is supplemented with
formulation of 13 types of amino acid. The amino acid range is reported varied from
0.06 mM-25 mM and cell is seeded at 5x10⁴ cells/ml. After 70 hour, it is recorded that
IgA concentration is increased from 26.6 to 100.2 mg/L. This shows that addition of
amino acid did increase the production of MAbs. However, many factor needed to be
tested again such as the range of effectiveness because the range is only being study to
incrase IgA not IgG. Cell density seeded is also need to take into consideration if amino

10
acid is use as inducing agent because the cell use is differ in type and probably in
doubling time too.
2.4 Selecting of method use in screening inducing agent
One-factor-at-a-time, OFAT is an unvaried analysis method which often shows
inadequate optimization toward responses. There is now increasing recognition that
OFAT method ought to be replace by chemometric methods such as response surface
methodology based on statistical DOEs (Sakkas et al., 2009).
Some researcher has done a comparative study between OFAT and DOEs
method while other just employ DOE method for optimizing the product or effect. Based
from the Plakett Burman model of Bari et al. (2009) research, the main effect is recorded
in bar graph and it is reported that 5 out of 8 indipendent variable gives effect on
production of citric acid. Then both central composite design (CCD) and OFAT is
employed in the optimization of production of citric acid from oil palm empty fruit
bunches (EFB). By using result gain from Plakett-Burman design, percent of glucose,
minerals and inoculums is analyzed using OFAT and CCD because only these three is
the most significant factor influence citric acid production. Production of citric acid from
screening gives 128.9g/kg-EFB, optimization using OFAT reported 218.6g/kg-EFB
while optimizing using CCD is 335.4g/kg-EFB. The result clearly shows that DOE is
more efficient compare to OFAT method toward citric acid production.
Plakett Burman is reported to be timewise in screening method but do not show
interaction (Bari et al., 2009). This comparative study only done for chemical production
not for MAbs in living cell production. Furthermore, the comparative study is only done
toward optimization and not screening. Different scope could give different effect
toward OFAT and DOE application. That is why this research will be done in a living
animal cell to see whether its affect the performance of DOE and OFAT.

11
Only optimization step using DOE can show interaction among parameters. CCD
which is one of the Research Surface Methodology (RSM) under DOE itself function to
hunt efficiency for the optimum value of the parameter such that response is maximize
by giving linking interaction between parameters (Tanyildizi et al., 2005).
Sakkas et al. (2010) only employed CCD to analyze the simultaneous effect of
H2O2, and TiO2 in the photocatalytic degradation of the Congo red (CR) in aqueous
solution. Experimental data were fitted using artificial neural network (ANNs) for
optimization. The findings indicate the influence of each variable, with TiO2 being the
most significant factor followed by H2O2. The software optimized degradation of CR up
to 90.22%. The optimum response can also be seen in 3D response and 2D contour plot
based from RSM design. Elliptical contours are only obtained when there is perfect
interaction between the independent variable (Muralidhar et al., 2001).
Figure 2.2: Contour plot for CR catalytic degradation showing interaction
(Sakkas et al., 2010)
Joelsson Daniel et al. (2008) on the other hand employed only statistical DOE to
optimize the assay precision over the linear part of the dose response curve. Two
separate factorials are created, one for each set of factors. Incubation times are

12
investigated in the plate factorial, and reagent concentrations are investigated in a
separate factorial that is replicate in each plate. Changing the assay condition to those
identified in the DOE studies significantly decrease the assay variability by a 3.5%
average.
Both of the researchers only used DOEs method toward optimization without
even considering OFAT method or consider screening the parameter to see which gives
best responses. It will be a waste if the OFAT method is more effective in the study
because DOE use more software and a lot of statistical which might give an error. That
is why OFAT and DOEs should be run along and compares to see which method give
the best toward screening. There is other method that has been tried by other researcher
that does not involve DOE method to screen or optimize responses. Although it does not
involve Design Expert software but still uses a lot of statistical data.
Kallel et al., (2003) used Taguchi’s methods as a basis to optimize hybridoma cell line
growth and antibody production. 23G11 murine hybridoma cells is culture in spinal flask
and L8 orthogonal experimental design was use to study different culture component,
stirring speed, nature of serum and nature of media. The experiments were conducted
using two levels for each factor studied and a direct ELISA test was used to estimate the
level of antibody production. The specific growth rate, μ (h) was estimated by the
following equation:
μ = (Ln X2 - Ln X1) /(t2 – t1)
where X represents the viable cell density per ml, t represent the time points of sampling
expressed in h; the subscripts 1 and 2 stand for two succeeding sampling points.
This study emphasizes the value of using Taguchi’s methods as a basis for
optimization of mAb production from a hybridoma culture, in cost effective and
significantly less labor intensive ways. Daigo et al., (2005) on the other hand suggested a

13
simple hybridoma screening method for high-affinity monoclonal antibodies using the
signal ratio obtain from time-resolved fluorescence assay. However both of the method
is impractical to be use since uses more time, equipment and involve lot of equation and
data analysis that can lead to high error compare to simple OFAT and Plakett Burman
under DOE method. Both of the method is only ideal to be use if complex analyze and
further study is needed to support result from simple screening and optimizing method.
14
CHAPTER 3
METHODOLOGY
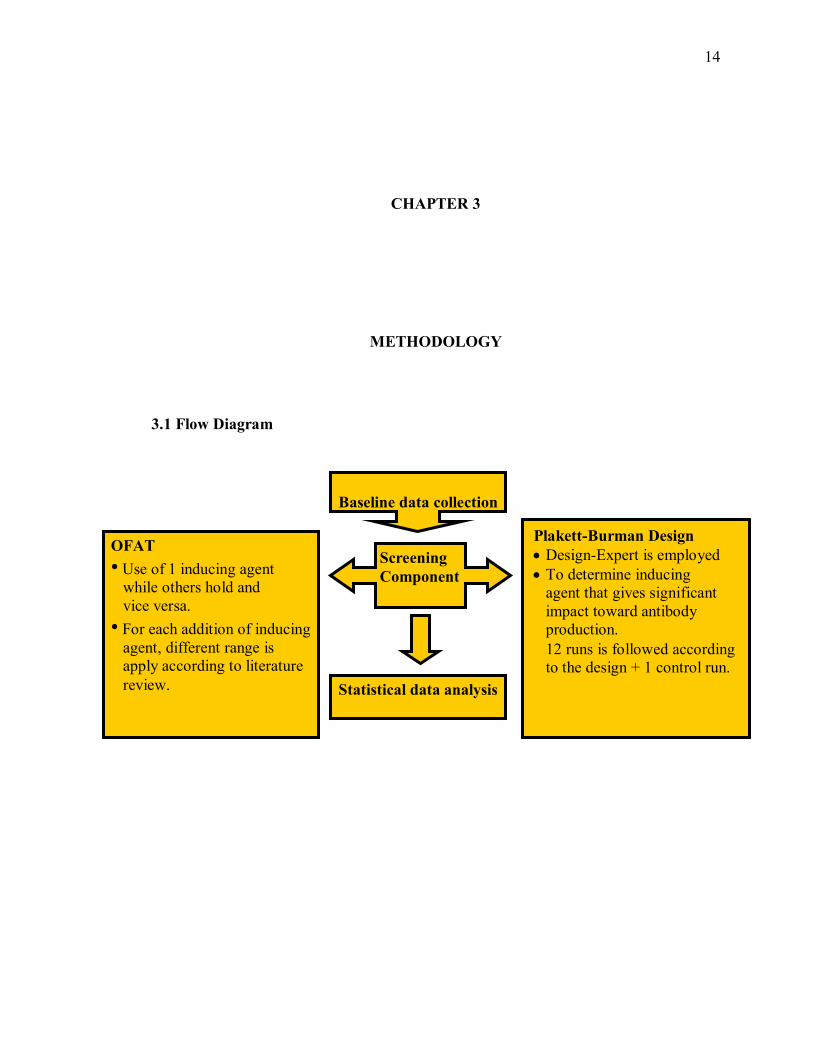
3.1 Flow Diagram
OFAT
• Use of 1 inducing agent
while others hold and
vice versa.
• For each addition of inducing
agent, different range is
apply according to literature
review.
Baseline data collection
Screening
Component
Plakett-Burman Design
Design-Expert is employed
To determine inducing
agent that gives significant
impact toward antibody
production.
12 runs is followed according
to the design + 1 control run.
Statistical data analysis

15
3.2 Material
Mouse hybridoma cell H192 was obtained from Universiti Malaya. The varied
inducing agent such as LPS, sodium butyrate, lysozyme, potassium phosphate, aldolase,
essential amino acid and non-essential amino acid were purchased from Sigma.
Dulbecco's Modified Eagle’s Medium (DMEM) is also purchased from Sigma for media
preparation. Other chemicals were available in UMP chemical laboratory.
3.3 Baseline data collection
Mouse-mouse hybridoma cell are seeded at 2.5x10⁵cells/ml volume in complete
medium and cultured in T-75 flask 250 ml and incubate at 32°C under humidified 5%
CO2 -95% humidified air. The cell was subcultured for several times to ensure its
continuous growth rate. As the cell reaches its maximum growth rate which at
1.35x10⁶cells/ml the cell is spun at 5000 rpm fro 5 minutes and the supernatant was kept
for ELISA analysis. ELISA analysis was done to determine baseline MAb titer for
control medium.
3.4. Screening using OFAT
The cell was seeded at 2.5x10⁵cells/ml for each 7 ml new tube. Six-well plate is
use instead of T-75 flask for cultivation of the cell. Each run was triplicate making one
run require 7 ml of medium seeded with cell. Inducing agent was added at various
concentrations shown in Table 3.1. The control medium without addition of inducing
agent is run concurrently. This is important for identifying whether medium with
addition of inducing agent produce high antibody concentration by comparing it with
control MAb titer. The culture medium is cultivated for 72 hour at 37°C under
humidified 5% CO2-95% air.

16
Table 3.1: Range of inducing agent use in OFAT screening method.
Inducing agent Control Concentration range
Potassium
phosphate 1020 - 4080μg/ml
Lysozyme 250 - 500μg/ml
LPS 25 - 50μg/ml
Aldolase 0μg/ml 200 - 400μg/ml
Essential amino acid 0.5 - 3.0mM
Sodium butyrate 550 - 8000μg/ml
Non-essential amino
acid 0.5 - 3.0mM
3.5 Screening using Plakett-Burman design
The purpose of the first step of screening was to identify the significance of the
inducing agent for the production of antibody. The Table 3.2 below show the design
with an output of 12 experimental runs to seven inducing agent used. It was based on the
first order model which is given by:
IgG conc.= 0.174207.77700 x 10-6
(A) - 3.56373 x 10⁻⁴
(B) - 1.44749 x 10⁻⁴
(C)
- 0.077243(D) + 2.47932 x 10⁻³
(E) + 2.57416 x 10⁻⁵
(F) + 5.74667 x 10⁻³
(G)
Table 3.2: Plakett-Burman design for the screening media
Run
A,
μg/ml
B,
μg/ml
C,
μg/ml
D,
mM
E,
μg/ml
F,
μg/ml
G,
μg/ml
IgG conc.,
μg/ml
1 550 400 250 0.5 25 4080 1 0.108121
2 550 200 500 1 50 1020 1 0.082701
3 550 200 250 0.5 25 1020 0.5 0.079066
4 550 200 250 1 50 4080 0.5 0.205622
5 8000 200 250 0.5 50 4080 1 0.41528
6 8000 400 500 0.5 50 4080 0.5 0.119427
7 8000 400 250 1 50 1020 1 0.097064
8 8000 400 250 1 25 1020 0.5 0.11089
9 550 400 500 0.5 50 1020 0.5 0.173336
10 550 400 500 1 25 4080 1 0.084819
11 8000 200 500 0.5 25 1020 1 0.128116
12 8000 200 500 1 25 4080 0.5 0.21052