comparison of an interactive green aam - lshtm research online
TRANSCRIPT

For Review Only
Comparison of an interactive 24-hour recall and weighed
food record for measuring energy and nutrient intakes from complementary foods among 9-10 month-old Malawian infants consuming Lipid-Based Nutrient Supplements
Journal: British Journal of Nutrition
Manuscript ID BJN-RA-17-0873.R2
Manuscript Type: Research Article
Date Submitted by the Author: n/a
Complete List of Authors: Hemsworth, Jaimie; London School of Hygiene and Tropical Medicine, Department of Population Health, School of Epidemiology and Population Health Arimond, Mary; FHI 360 Washington, Center for Dietary Intake Assessment Kumwenda, Chiza; University of Tampere and Tampere University Hospital , Department for International Health Rehman, Andrea; LSHTM: London School of Hygiene & Tropical Medicine, Department of Medical Statistics, School of Epidemiology & Population
Health Maleta, Kenneth; University of Blantyre, College of Medicine Ashorn, Ulla; University of Tampere and Tampere University Hospital, Department for International Health Keogh, Ruth; London School of Hygiene and Tropical Medicine Faculty of Epidemiology and Population Health, Department of Infectious Disease Epidemiology Ferguson, Elaine; LSHTM: London School of Hygiene and Tropical Medicine, Dept. of Population Health
Keywords: LNS, weighed record, 24-hr recall, dietary assessment, infants
Subject Category: Dietary Surveys and Nutritional Epidemiology
Cambridge University Press
British Journal of Nutrition

For Review Only
1
Comparison of an interactive 24-hour recall and weighed food record for measuring energy and
nutrient intakes from complementary foods among 9-10-month-old Malawian infants consuming
Lipid-Based Nutrient Supplements
Jaimie Hemsworth1, Mary Arimond
2, Chiza Kumwenda
3, Andrea M. Rehman
4, Kenneth Maleta
5, Ulla
Ashorn3, Ruth Keogh
6,* and Elaine L. Ferguson
1,*
1 Department of Population Health, London School of Hygiene and Tropical Medicine, UK
2 Intake - Centre for Dietary Intake Assessment, FHI 360, Washington, DC, USA
3 Department for International Health, School of Medicine, University of Tampere, Finland
4 Department of Medical Statistics, London School of Hygiene and Tropical Medicine, UK
5 College of Medicine, University of Blantyre, Malawi
6 Department of Infectious Disease Epidemiology, London School of Hygiene and Tropical
Medicine, UK
* Authors declare equal contribution to senior authorship
Corresponding author:
Elaine Ferguson
Department of Population Health
London School of Hygiene and Tropical Medicine
Keppel Street, London, UK
WC1E 7HTE-mail: [email protected]
Running title: Dietary assessment errors of common methods
Keywords
LNS, weighed record, 24-hr recall, dietary assessment, infants
Abstract word count: 250, Manuscript body word count: 5 411
Number of figures: 1
Number of tables: 4
Supplementary tables: 2, Supplementary figures: 3
Study Funding: This manuscript is based on research funded by a grant issued to the University of
California, Davis from the Bill & Melinda Gates Foundation. The findings and conclusions contained
within are those of the authors and do not necessarily reflect positions or policies of the Bill & Melinda
Gates Foundation.
All authors declare no conflicts of interest
Page 1 of 58
Cambridge University Press
British Journal of Nutrition
For Review Only
2
Abstract 1
Fortifying complementary foods with lipid-based nutrient supplements (LNS) may improve energy and 2
nutrient intakes of infants at risk for undernutrition. We aimed to determine the relative validity of an 3
interactive 24-hour dietary recall (i-24-HR) for assessing the impact of an LNS intervention on dietary 4
intakes of energy and nutrients among rural Malawian 9-10-month-old infants (n=132) participating in 5
the iLiNS dose trial. Dietary data were collected for the same day via i-24-HRs and weighed food 6
records. Inter-method agreements were estimated overall and by intervention group, using Bland-7
Altman plots and paired t-tests; measurement error models (differential error); and percentage of food 8
omissions and intrusions were estimated. Overall, inter-method differences in mean intakes of energy 9
and most nutrients were not significant. When stratified by group, recalled energy intakes were under-10
estimated (-88kcal p=0.01) in the control but not in the intervention group (-10kcal; p=0.6). This 11
differential reporting error was related to an over-estimation of recalled LNS (8.1g vs 4.5g; p<0.001) in 12
the intervention group, compensating for an under-estimation of energy and nutrient intakes from 13
complementary foods. Sources of measurement error in the i-24-HR were under-estimations of starchy 14
staples, meat/fish/eggs and legumes/nuts/seeds (overall percent agreement between 38-89%; p<0.028); 15
and over-estimations of added sugar, soups/broths and LNS (overall percent agreement between 138-16
149%; p<0.001). Common (>30% eating occasions) omissions were milk/fish/egg, starchy 17
roots/vegetables, and sweetened snacks. Common intrusions were milk/yogurt. Starchy staples and 18
LNS were recalled when consumed (>85%) (i.e. matched). These results emphasise the importance of 19
considering differential error when interpreting dietary results in LNS trials. 20
Page 2 of 58
Cambridge University Press
British Journal of Nutrition

For Review Only
3
Introduction 21
Undernutrition is common among young children living in low income countries (1). Both the short- 22
and long-term adverse effects of under-nutrition impact health and future livelihoods. This underscores 23
the need for comprehensive intervention packages, including effective dietary strategies. One such 24
intervention is the use of lipid-based nutrient supplements (LNS) as home fortification of infant foods 25
(2). Studies of the effectiveness of LNS for reducing undernutrition have shown mixed results (3-5). In 26
cases where there was no association between LNS intake and growth outcomes (3), low adherence to 27
the intervention (LNS consumption) and/or the displacement of other foods in the diet might partially 28
account for the lack of a physiological effect. Thus, to correctly interpret LNS intervention trial results, 29
accurate measurement of the LNS exposure and its influence on overall dietary intakes is fundamental. 30
The assessment of infant dietary intakes is complicated for several reasons: 1) infants eat very small 31
quantities of food; 2) measuring intake includes measuring not only the amount served, but also 32
amounts left over, spit-up, spilled or dropped; 3) infants are often cared for and fed by multiple people; 33
and 4) infants are unable to report their own intakes (6). The weighed food record is considered the 34
“gold standard” dietary assessment method for quantitative estimates of an individual’s dietary intake, 35
including for young children, because foods are weighed and recorded as they are consumed (7). 36
However, for large surveys, the 24-hour recall is more practical because it is relatively rapid to 37
conduct, has a low respondent burden and is less disruptive for low-literacy communities where, for the 38
weighed food record, research assistants must weigh and record all foods consumed by participants. 39
The disadvantages of 24-hour recalls are that they are prone to errors of memory, recall bias, errors in 40
portion size reporting and potentially a social-desirability bias (8). The interactive multiple pass 24-41
hour recall (i-24-HR) was developed specifically for areas with low literacy rates, and includes a 42
pictorial chart to prospectively record dietary intakes and reduce errors of memory (9). 43
Previous studies, in Malawi, Ghana, Sweden and the United States, have assessed the validity of the 44
24-hour dietary recall method relative to weighed food records (WFR) for estimating the energy and 45
nutrient intakes of young children (10-13). They show recalled compared to weighed energy intakes are 46
generally over-estimated (10, 12, 14), which for rural Malawian 15-m olds was by 13% (10). This 47
pattern of over-estimation of energy intakes might be more pronounced for toddlers than infants, if 48
accurate reporting becomes more difficult as the diet becomes more complex (12, 15). To our 49
knowledge no study has validated the 24-hour recall for African infants under 12-months of age. 50
There is also evidence that certain foods are more accurately reported than others (16, 17). Such 51
differences become important when assessing dietary exposures in a LNS intervention trial because 52
LNS, which is an energy and nutrient dense food, is not present in the diet of the control group. 53
Page 3 of 58
Cambridge University Press
British Journal of Nutrition

For Review Only
4
Systematic under- or over-estimation of LNS intakes would bias between-group comparisons by either 54
exaggerating or attenuating the observed effect of LNS on infant dietary intakes, of energy and 55
nutrients. An accurate assessment of dietary exposure is essential in dietary intervention trials to 56
properly understand the association between dietary exposure and outcome (18-20). To our knowledge, 57
the i-24-HR has not been validated for use among infants who are participating in an LNS intervention 58
trial. 59
This study, therefore, aimed to assess the relative validity of the i-24-HR used in an LNS intervention 60
trial, the iLiNS study (3). The iLiNS study aimed to evaluate the efficacy of three doses of LNS for the 61
prevention of stunting among infants supplemented from 6 to 18 months of age. In this trial, inter-62
group differences in dietary intakes of energy and nutrients were assessed when the infants were 9-10 63
months of age (21). The specific objectives of the current study were to 1) assess the relative validity of 64
the i-24-HR method for estimating dietary intakes of energy, protein, fat, iron, zinc, calcium and 65
vitamin A from complementary foods using a 1-day WFR as the reference method; 2) assess whether 66
there is a differential bias in i-24-HR measures of energy intake between the control group and 67
intervention groups, and 3) describe potential sources of measurement error in the i-24-HR, including 68
errors in the types or amounts of LNS and complementary foods reported. 69
Methods 70
Design and Study Population 71
A cross-sectional validation study was nested within a dietary assessment sub-study of infants 72
participating in a 12-month LNS randomised control trial (iLiNS-DOSE trial) conducted in Mangochi 73
district, Malawi from November 2009 and July 2012. Data collection for the dietary assessment sub-74
study took place between March 2010 and October 2011 when the infants were 9-10 m of age. Data 75
collection for the dietary validation study took place between October 2010 and October 2011. The 76
main trial was designed to assess the impact of three different doses of LNS (10g, 20g and 40g) on 77
linear growth; which was delivered bi-weekly to households in the intervention groups. The objectives 78
and methods of the iLiNS-DOSE trial (n=1980) and the dietary assessment sub-study (n=688) are 79
described in more detail in Maleta, et.al. (3) and Hemsworth, et.al. (21), respectively. In the dietary 80
assessment sub-study, two i-24-HRs were done exactly 7-days apart when the infants were between 9 81
and 10 months of age. One i-24-HR was done during the week LNS was delivered, and the other in the 82
subsequent week. In the validation study the WFRs which were done one-day prior to a corresponding 83
i-24-HR, were done just after the LNS delivery day to maximize capturing the presence of LNS in the 84
Page 4 of 58
Cambridge University Press
British Journal of Nutrition
For Review Only
5
child’s diet. The other i-24-HR was collected either 7-days before or 7-days after the i-24-HR that 85
corresponded with the WFR day. 86
Sampling 87
A randomsample of 228 infant-mother dyads was obtained for the validation study (56 in each of the 88
control, 10g, 20g, and 40g LNS groups). Thesample size for the validation study was calculated to 89
allow detection of a difference of 55kcal (one 10g dose of LNS) between each of the four intervention 90
groups with power of 80% and α=0.05, assuming a standard deviation of the difference between the 91
methods (WFR minus i-24-HR) of 138 kcal (derived from a pilot study), and a 10% attrition rate (e.g. 92
missed i-24-HR following the WFR). 93
The original inclusion criterion was participation in the dietary assessment sub-study of the iLiNS-94
DOSE trial. The validation study, however, began seven months after the trial began, which meant that 95
one third of participants had already completed the dietary sub-study and were no longer eligible for 96
the validation study. As a result, to meet our target sample size of 228 age-eligible infants, we selected 97
additional infants (n=78) at random from the basic sub-study group (i.e., not randomised to any 98
additional sub-study at baseline to minimise respondent burden) to reach the intended sample size. It 99
introduced an imbalance in the number of infants from the control and 10g LNS groups versus the 20g 100
and 40g LNS groups. As such, more infants were in the 20g LNS and 40g LNS groups than the other 101
two groups in this validation study. 102
Ethical Approval 103
Ethical approval for this sub-study was granted by the London School of Hygiene and Tropical 104
Medicine Research Ethics Board as well as by the College of Medicine Research Ethics Board in 105
Malawi. Informed written consent was obtained from all participating caregivers in this study. The trial 106
was registered at clinicaltrials.gov with the identifier: NCT00945698 107
Dietary Assessment 108
Interactive 24-hour Recall (i-24-HR) 109
Dietary data were collected using a 4-pass i-24-HR, developed for use in a rural African context (9). 110
The method was modified specifically for a similar population and included pictorial charts (intended 111
to reduce intrusions and omissions), bowls/cups/plates, and measured portion sizes using real food 112
replicas and salted models. In the dietary assessment sub-study, caregivers were given the pictorial 113
food chart and a plastic cup and bowl 2-days before the i-24-HR was done. On the day before the i-24-114
HR, caregivers were asked to prospectively record on the pictorial chart all foods, beverages, and LNS 115
Page 5 of 58
Cambridge University Press
British Journal of Nutrition

For Review Only
6
(if appropriate) when given to the child to minimise memory errors; and to feed their child from the cup 116
and bowl provided to minimise portion size estimation errors. In the first pass, during the i-24-HR 117
interview, from memory, the caregiver was asked to serially recall all foods, supplements and 118
beverages that their child had consumed in the previous 24 hours. In the second pass, information 119
about the time, place, and description of the food or beverage was collected. In the third pass, portion 120
sizes were estimated by the caregivers showing the amount served and the amount left-over using real 121
food replicas (with or without excess salt to preserve them) and unit descriptions (e.g. package of 122
biscuits). The amounts were weighed by the interviewers using digital kitchen scales (Home Elegance, 123
accurate to ± 1g), and recorded. The amount consumed was calculated as the amount served minus the 124
amount left-over. LNS portion sizes were measured using a pot of LNS, which was weighed before and 125
after the caregiver had removed the amount of LNS used at each eating occasion. Left-overs were 126
subtracted from the amount of LNS served. If LNS was mixed with other foods, the amount left over 127
was calculated by multiplying the amount served by the proportion of the mixed dish that was 128
consumed, assuming uniform mixing. The consumption of LNS was not specifically probed to prevent 129
errors of intrusion (i.e. items listed but not actually consumed). To reduce potential differences in 130
recording, interviewers were given extensive training and used standardised operating procedures, 131
including a portion size estimation manual, detailing the specific methods for portion size estimations 132
and probing. At the end of the third pass, interviewers asked for the pictorial chart. Any discrepancies 133
between the pictorial chart and the food list of the i-24-HR were discussed. In the final pass, the data 134
collector summarised and confirmed the food and drinks recorded in the i-24-HR. 135
Weighed Food Record (WFR) 136
All foods and beverages consumed by the child from 6 a.m. until the final meal of the day were 137
weighed and recorded by a data collector, using digital kitchen scales (Home Elegance, accurate to ± 138
1g). Left-over foods were weighed either individually, if they could be separated on the plate, or as a 139
mixture, assuming uniform mixing. Recipe data were collected by weighing all raw ingredients and the 140
final cooked dish. The WFR data collector was not involved in the collection of the i-24-HR data. 141
Questionnaires 142
Socio-demographic background characteristics of the infants were collected within two weeks of 143
baseline enrolment in the iLiNS study, when the infants were 6 months old, using an interviewer-144
administered questionnaire. 145
Page 6 of 58
Cambridge University Press
British Journal of Nutrition
For Review Only
7
Data processing 146
Conversion factors were developed for the i-24-HR,and used to estimate the grams of food consumed. 147
Average recipes were calculated for cooked dishes using the individual recipes collected from each 148
household. These data were used to calculate intakes of ingredients from cooked dishes in the i-24-149
HRs. Intakes of energy and nutrients from the WFR and i-24-HRs were estimated, using a food 150
composition table developed for this study (21). 151
The time each item was consumed was also recorded, and it was used to match the corresponding 152
eating occasions for inter-method portion size comparisons. Meals and snacks consumed after 19:00 153
were removed from both the WFR and i-24-HR (i.e. a 12-hour WFR and recall were created) because 154
there were occasions during the collection of the WFR when the final meal was consumed after the 155
data collector had left the household. 156
Statistical Analysis 157
All data analyses were performed using Stata version 12 (StataCorp LLC, College Station, Texas). The 158
three LNS intervention groups were collapsed to form one large group, for all analyses, because there 159
were no significant inter-group differences in energy and nutrient intakes from complementary foods 160
(including LNS), and the group sample sizes were small (21). In all analyses, except the analyses for an 161
instrument effect (see below), data from only one of the two i-24-HR were used, which was the i-24-162
HR collected for the same day as the WFR. Energy and nutrient intake distributions from the WFR and 163
i-24-HRs were mathematically transformed, when necessary, for the analyses. 164
165
Sociodemographic variables 166
A composite variable for socioeconomic status was calculated using principal component analysis 167
(PCA), and the PCA scores were divided into quintiles using the first principal component. The 168
following variables were used as part of the composite variable: maternal occupation, household 169
crowding, source of electricity, source of water, sanitary facilities, material of roofing, and material of 170
house walls. 171
Chi-squared tests, for categorical socio-demographic variables, and two-sample t-tests, for non-172
categorical socio-demographic variables, were used to check for variables associated with 173
“missingness” of WFRs and for differences between intervention groups (control vs. LNS) in the 174
validation study. 175
Page 7 of 58
Cambridge University Press
British Journal of Nutrition

For Review Only
8
Assessment of agreement between dietary assessment methods 176
Paired t-tests were used to compare mean intakes of energy and nutrients from the corresponding i-24-177
HR and WFR. Absolute differences (“error”) in amounts of energy and nutrients between the two 178
methods were calculated as follows: i-24-HR – WFR. A two-sample t-test with equal variances was 179
used to compare the absolute differences between the control and intervention groups. Bland-Altman 180
plots were used to estimate, for energy intakes, the level of agreement between the two methods and 181
the 95% limits of agreement. 182
Assessment of differential error 183
Measurement error modelling was used to investigate whether error in the i-24-HR differed by 184
treatment group. We let �� denote the i-24-HR measurement (square-root transformed) made at the 185
same time as the WFR, and �� denote the WFR measurement itself (square-root transformed). The 186
second independent i-24-HR measurement (square-root transformed) was denoted ��. The true, but 187
unobserved, intakes at time points 1 and 2 were denoted �� and �� respectively. At time point �(� =188
1,2) the relationships between the observed measurements of dietary intake and the unobserved 189
underlying true intake were assumed to be of the following forms, where we allowed separate model 190
parameters for individuals in the control (C) and combined intervention (T) groups, 191
Equation 1 192
193
Combinedinterventiongroup:�� = �� + �� �� + " �
Controlgroup:�� = ��$ + ��$�� + "$�
194
Combinedinterventiongroup:�� = �� + % �
Controlgroup:�� = �� + %$�
Page 8 of 58
Cambridge University Press
British Journal of Nutrition

For Review Only
9
The & and ' terms are random errors with mean zero and constant variance. The WFR is assumed to 195
provide an unbiased estimate of true intake in both the control and intervention groups. The intercept 196
parameters ()* and ()+ , and slope parameters (,* and (,+, represent systematic error in the i-24-HR 197
measurement. We assessed evidence for differential error based on estimates ofthe differences (,* −198
(,+ and ()* − ()+ and corresponding bootstrap confidence intervals. The parameters of the 199
measurement error model in Equation 1 were estimated via a method of moments approach. 200
Sources of disagreement between the i-24-HR and WFR 201
To identify possible sources of disagreement between the two dietary assessment methods, we 202
categorised each food and drink item (for composite dishes, we matched the individual ingredients) as 203
an omission (present on WFR, absent on i-24-HR), an intrusion (absent on WFR, present on i-24-HR) 204
or a match (present on both methods at matching meal/snack times). We calculated the frequency of 205
each category across food groups (i.e., phala; nsima and rice; added sugar; sweetened snacks; savoury 206
snacks; meat, fish and egg; legumes, nuts, and seeds; fruit; starchy roots and vegetables; milk and 207
yogurt; non-dairy beverages; soup/broth from relish; and LNS), a method previously described by 208
Smith, et.al. (22). We compared the median percentage agreement for each food group, (i.e. 100* 209
reported amount (i-24-HR) / reference amount (WFR)), for the intervention and control groups, using 210
Mann-Whitney rank sum test when the sample was at least five consumers. In the case where one food 211
within a food group of these is an intrusion, this resulted in a reference amount of zero (at the 212
individual food level only), and in the case where there is an omission, this resulted in a reported 213
amount of zero. We also compared the overall inter-method differences, in the grams of food consumed 214
in each food group, using the Wilcoxon signed-rank test. 215
Instrument Effect 216
We tested for an “instrument effect”, because the presence of a data collector on the day of the WFR 217
might have influenced the caregivers’ ability to recall dietary intakes during its corresponding i-24-HR. 218
This “instrument effect” was assessed using the Wilcoxon signed-rank test, by comparing the median 219
intakes of energy and nutrients estimated using the i-24-HR corresponding to the WFR day and the i-220
24-HR collected on a day independent of the WFR (i.e., collected one week before or after the WFR). 221
For this analysis, n=71 matched records were available. 222
Page 9 of 58
Cambridge University Press
British Journal of Nutrition

For Review Only
10
Results 223
Participants 224
A total of 228 infants were selected to participate in the validation study. However, 78 were lost to 225
follow-up and 18 did not have a matching WFR and i-24-HR. The final sample size analysed was 132 226
matching i-24HRs and WFRs (Figure 1). There were no significant differences in socio-demographic 227
characteristics comparing those with missing data and those who completed the WFR (data not shown). 228
Likewise, there were no differences in baseline characteristics between the intervention and control 229
group (Table 1). 230
Agreement between dietary assessment methods 231
The reported energy intakes were lower in the i-24-HR compared to the WFR, although the difference 232
was not statistically significant (p=0.09) (Table 2). Reported protein intake was significantly 233
underestimated and calcium intake was significantly over-estimated by the i-24-HR compared to the 234
WFR (p<0.001). There were no significant between-method differences in intakes of fat, iron, zinc or 235
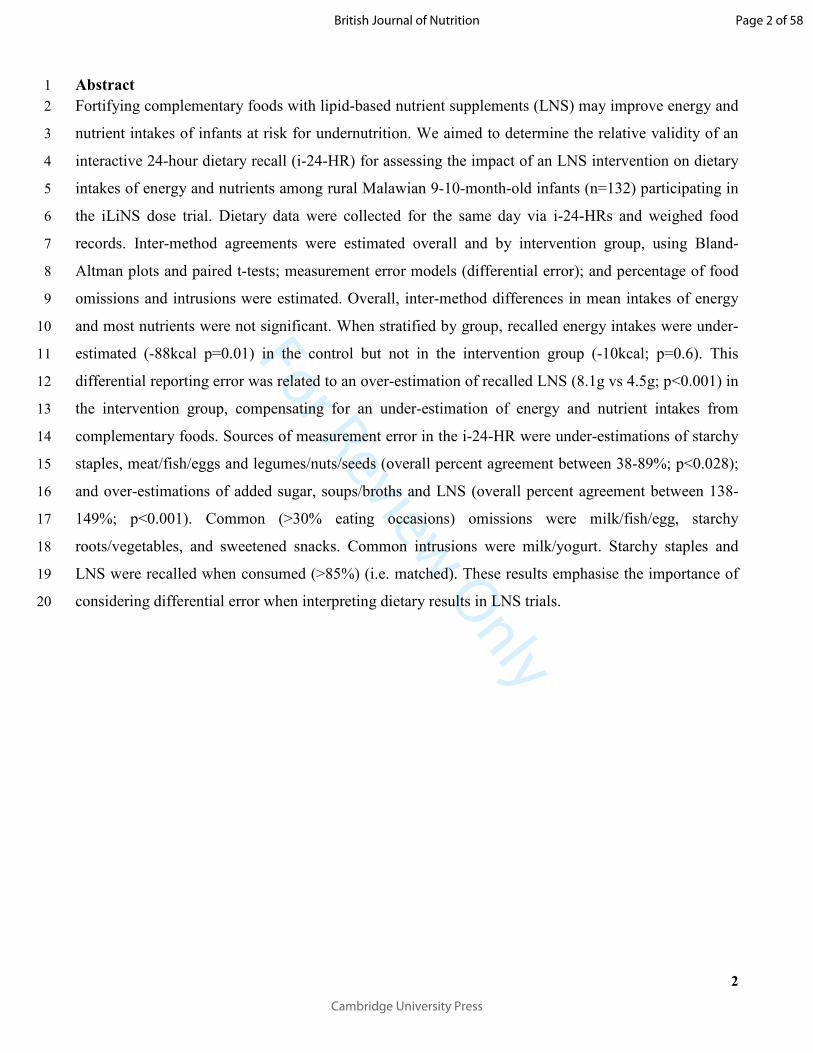
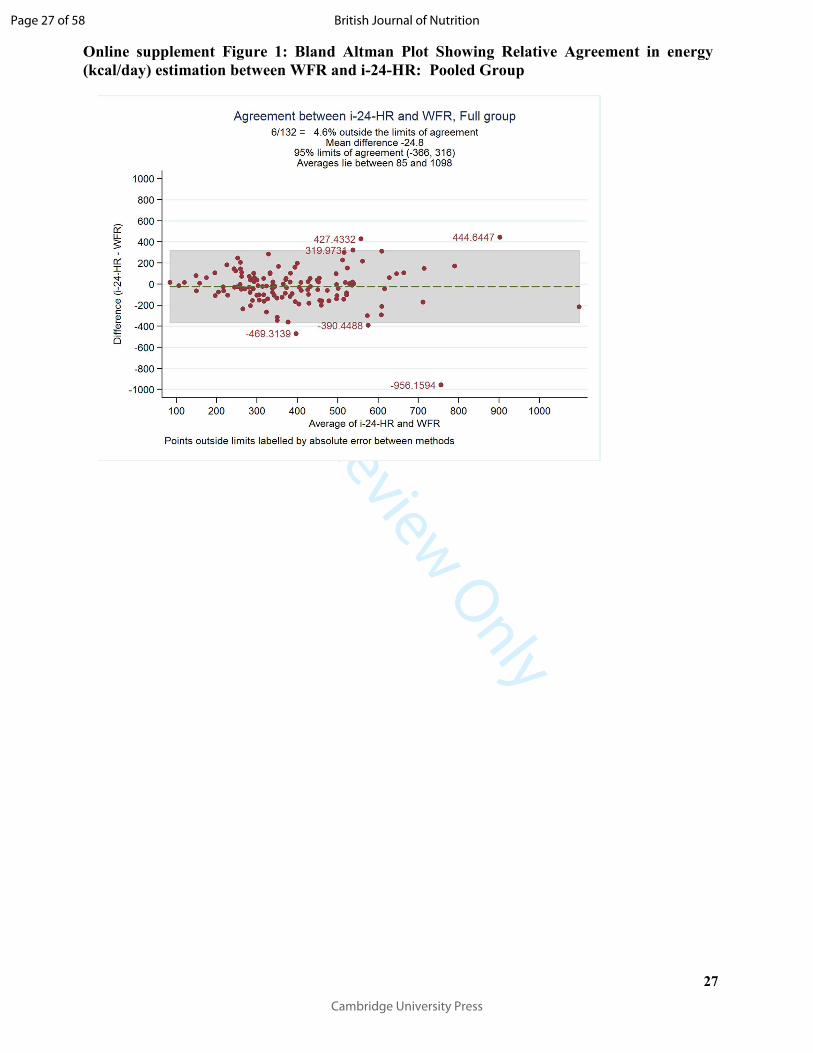
vitamin A. The Bland-Altman plot showed a systematic bias for under-reporting recalled energy 236
intakes compared to the WFR and poor agreement at the individual level, with 95% limits of agreement 237
of -366 kcal to 316 kcal (Online supplement Figure 1). 238
When stratified by intervention group, however, there was a significant under-estimation of recalled 239
energy intakes in the control group (p=0.010) but not in the intervention group (p=0.60) (Table 2). 240
Recalled intakes of protein, fat, iron and zinc were also significantly underestimated in the control 241
group. In the intervention group, recalled intakes of protein were significantly under-estimated, 242
whereas recalled intakes of calcium and zinc were significantly overestimated (Table 2). Further, after 243
comparing the absolute differences (“error”) calculated between the WFR and i-24-HR in the control 244
and intervention groups, we found significant differences (p<0.05) for energy (kcal) and iron, and all 245
other nutrients were considered non-significant (p>0.05). The Bland-Altman plot by intervention 246
group (Online supplement Figures 2a and 2b) showed poor 95% limits of agreement (LOA) for 247
energy at an individual level, for both the intervention (95% LOA -358, 337 kcal) and control (95% 248
LOA -375 to 207 kcal) groups; and a mean systematic under-estimation of energy intakes in the control 249
group only (-84 kcal) ). 250
251
By fitting the measurement error models in equation 1, we found that �.�$ = −2.4 (95% CI (-24.9, 252
29.7)) and �.� = 2.6 (95% CI (-20.0, 20.2)), �.�$ = 63.2 (95% CI (58.8, 67.3)) and �.� = −32.5 (95% 253
CI (-34.5,-30.6)). The confidence intervals were obtained from the 2.5 and 97.5 percentiles of 1000 254
Page 10 of 58
Cambridge University Press
British Journal of Nutrition

For Review Only
11
bootstrap estimates, using bootstrap samples stratified by intervention group. The expected i-24-HR 255
measure of energy intake (�) given the true intake (�) is therefore 4(�|�) = −32.5 + 2.6� in the 256
combined intervention group, and 4(�|�) = 63.2 − 2.4� in the control group. The estimates of the 257
slope are in opposite directions in the intervention and control groups because the correlation between 258
the independent i-24 and the WFR is positive in the intervention group, but negative in the control 259
group; however the CIs are very wide and the 95% bootstrap CI for the difference �� − ��$ was (-260
46.6, 56.5). However, there was strong evidence for a difference in the intercepts; the 95% bootstrap CI 261
for the difference �� − ��$ was (-100.1, -90.7) The model-based approach, therefore, suggests that the 262
relationship between the i-24-HR measure of energy intake and the true intake may be different in the 263
intervention and groups, i.e. potential differential error. 264
Sources of disagreement between thei-24-HR and WFR 265
LNS intakes 266
In the intervention group, there was a significant between-method difference in estimated LNS intakes. 267
The median intake was significantly higher for the recalled (i-24-HR) than reference (WFR) amount 268
(i.e., 8.1g (4.5, 11.8) vs 4.5g (2.0, 9.0); p<0.001) (Online Supplement Table 1). The median (IQR) 269
percentage agreement (matched LNS portions) indicates recalled LNS consumption was over-estimated 270
by over 50% compared to the WFR (Table 3). Close to 90% of the eating occasions matched on both 271
the WFR and i-24-HR; and rates of intrusions and omissions were similar and low (Table 4). 272
Complementary food intakes 273
At the pooled group level, phala, legumes, nuts and seeds, and meat, fish and eggs were significantly 274
under-estimated; whereas, soups/broths from relish and added sugar were significantly over-estimated 275
in the i-24-HR compared to the WFR (Online Supplement Table 1). There were no significant 276
differences between intervention- and control groups in reporting accuracy (i.e., percentage agreement 277
for food groups), except for soups/broths from relish, where the control group showed a higher over-278
reporting rate than the intervention group. These comparisons, for four of the 12 food groups, were 279
limited by the small sample size of the control group (Table 3). 280
In both the intervention and control groups, a comparison of food group matches, intrusions and 281
omissions showed the highest reporting agreement for staples, where over 88% of the phala and nsima 282
eating occasions matched between the two methods (Table 4). Episodically consumed foods such as 283
meat, fish and eggs (which were frequently misreported as soup/broth from relish), starchy roots and 284
vegetables, and sweetened snacks had poor reporting matching, with a higher tendency for respondents 285
to omit (i.e. forget) as opposed to intrude (i.e. add in error). 286
Page 11 of 58
Cambridge University Press
British Journal of Nutrition

For Review Only
12
The “instrument-effect” 287
There was no evidence of an “instrument effect”. There were no significant differences in estimated 288
intakes of energy or nutrients comparing the independent i-24-HR (performed either one week before 289
or after the WFR) and the corresponding i-24-HR (i.e., for the same day as the WFR). The absolute 290
differences ranged from zero RAE/d to 34 kcal/d (Online supplement Table 2). 291
Discussion 292
In the context of a LNS supplementation trial, we found there was no significant difference comparing 293
energy intakes measured using the i-24-HR to the WFR when all groups were pooled. This comparison 294
was not biased towards agreement by the weighing process, because the independent and 295
corresponding i-24-HRs provided similar estimates of energy and nutrients intakes. However, this 296
pooled comparison masked a difference between the intervention and control group. When stratified by 297
intervention group, the i-24-HR systematically under-estimated dietary energy intakes compared with 298
the WFR in the control group but not in the intervention group. The significant difference in the “error” 299
or absolute difference between the methods in control and intervention groups suggest a differential for 300
recalled energy intakes. This differential error, for estimating median energy intakes, primarily is the 301
result of an over-estimation of the energy-dense supplement (LNS), which was only consumed by the 302
intervention group. It compensated for the under-estimation of energy intakes from complementary 303
foods because most caregivers were able to report whether their infant had consumed it. In contrast, 304
when using dietary data collected via i-24-HRs to examine associations, the 95% LOA indicate poor 305
agreement at the individual level, in both groups, which will attenuate associations. These results 306
highlight, when aiming to estimate inter-group differences in median intakes of energy and nutrients in 307
an intervention trial, the importance of examining whether systematic measurement error when 308
quantifying intervention food consumption, contributes to a differential bias. In studies aiming to 309
examine associations between dietary intakes and functional outcomes (e.g., growth), the i-24-HR is 310
inferior to more accurate methods of dietary assessment. In our study considerable effort was made to 311
accurately estimate LNS consumption. The caregivers were asked to spoon out the amount of LNS 312
served to the infant and estimate the amount left-over, which were both weighed and recorded. 313
There were few differences, comparing the intervention and control group, for between-method 314
agreement in the estimation of complementary foods intakes. In the pooled group analyses, the main 315
sources of between-method disagreement were under-estimated recalled portion sizes of dietary staples 316
(phala, rice and nsima by between 11 and 14%), meat, fish and eggs and legumes, nuts and seeds. 317
Energy-dense foods, such as added sugar, were overestimated by over 40% compared with the WFR; 318
Page 12 of 58
Cambridge University Press
British Journal of Nutrition

For Review Only
13
but it did not compensate for the under-estimation of energy from staples (phala, nsima and rice). This 319
result is not surprising because dietary staples provide a high percentage of daily energy intakes for 320
rural infants in Malawi. 321
Underestimation of certain food groups is not unique and has been reported among women in Malawi 322
(9) as well as preschool aged children in Ghana (11). However, the underestimation in energy intakes 323
relative to the WFR, in the control group of our study, is in contrast to results from a study of 10-13 324
month old Senegalese infants (n=45), which showed the 24-hour recall was a relatively good measure 325
of intake compared to WFR (23, 24); and a study of 15-month old rural Malawian infants (n=169), 326
which showed a systematic over-estimation in energy and nutrient intakes (10). The sources of 327
measurement error, in the previous Malawian study, are unknown. These inter-study differences could 328
be a function of inter-method or age group differences. In our study, we probed for left-overs and 329
adjusted the portion sizes in the i-24-HR based on recalled left-overs. This adjustment was not reported 330
in the other studies. It has been suggested that as a diet becomes more complex (as the infant ages), the 331
reporting accuracy changes (12) and perhaps the direction of the error also changes. 332
The results of this validation study suggest that a differential error might be present when an i-24-HR is 333
used to measure group mean dietary intakes, which is related to a systematic over-estimation of the 334
exposure (LNS). Linear calibration techniques could be used to correct the systematic under-estimation 335
of energy intakes from non-LNS foods. Previous studies have developed correction factors using the 336
WFR as the reference standard to adjust i-24-HR energy intakes for a systematic overestimation of 337
energy intakes compared to the WFR. This technique is not recommended for the current study because 338
the reference method is subject to the same errors as the test method (19, 25), e.g. both the WFR and i-339
24-HR are subject to mis-estimation of items that were spilled or spit up. The linear calibration 340
equations would only have been appropriate if we had used a biomarker, such as the stable isotope 341
technique to measure total energy expenditure, which is an unbiased and independent measure of long-342
term energy intake (6, 20). 343
Study Limitations and Advantages 344
The main study limitations were the relatively low sample size and high rate of attrition. The study was 345
underpowered to detect differential error in the i-24-HR between control vs. intervention groups. The 346
high rate of attrition occurred because of the logistical demands of this validation study in a large 347
catchment area (i.e. transportation, communication with households, etc.). No observed background 348
characteristics were associated with missing the visit. 349
Page 13 of 58
Cambridge University Press
British Journal of Nutrition

For Review Only
14
Another limitation was the reference method used. The WFR is the most common reference standard 350
for comparison with a 24-hour dietary recall because it is less resource-intensive than collection of 351
biomarkers, and it provides useful robust information about portion size estimation, intrusions and 352
omissions. However, it does not meet the strict criteria for a valid reference method (26). To validate 353
the i-24-HR (repeated to provide an estimate of usual intakes), for estimating energy intakes alone, the 354
doubly labelled water method is the preferred reference method (25, 27). Further, the modelling 355
approach we used to assess evidence for differential error (equation 1), relies on an assumption that the 356
WFR provides an unbiased measure of intake, as well as additional assumptions about the form of the 357
systematic errors. 358
This study also had many advantages. It was carried out severalmonths after the start of the 359
intervention, which meant that the children were habituated to the intervention food. It was also 360
conducted over a long period of time which allowed for seasonal variation in dietary patterns and 361
episodically consumed foods to be captured. This study is also the first study that we are aware of that 362
has assessed the relative validity of the i-24-HR for estimating the dietary intakes of rural African 363
infants under 12 months of age who are participating in an LNS intervention trial. Such trials are 364
important because the process of stunting predominantly occurs before 15 months of age in rural Africa 365
(28). Detailed and accurate dietary intake information will contribute to an improved understanding of 366
direct causes of stunting and undernutrition. The study results emphasise the importance of considering 367
a potential differential bias to avoid the misinterpretation of intervention results. 368
Conclusions 369
At the pooled group level, the i-24-HR showed relatively good agreement to the WFR. However, there 370
was an apparent differential bias whereby the mean intakes of energy and some nutrients were under-371
estimated compared with the WFR in the control group but not in the intervention group. Considering 372
the cost and logistical implications of the WFR, the i-24-HR could be used in its place, for estimating 373
mean intakes, but careful attention should be made during the design stage to the objectives of the 374
study and whether only measures of absolute intakes or overall between-group differences are required. 375
Absolute intakes might be under-estimated, if the i-24-HR is used to estimate dietary energy intakes of 376
9-10-month-old infants who are not consuming an energy dense supplement, such as LNS. Future 377
interventions evaluating differential dietary exposures (such as LNS) should consider, when comparing 378
groups, whether a systematic error in intervention food measurement introduced a differential bias. 379
When designing the study, they should put effort into developing an accurate method of quantifying 380
intervention food consumption; and where possible, evaluate it in a pilot study before commencing data 381
Page 14 of 58
Cambridge University Press
British Journal of Nutrition

For Review Only
15
collection. For researchers aiming to examine associations between dietary intakes and functional 382
outcomes, such as growth, if resources permit, they should include a dietary assessment validation 383
study, with a biomarker reference method (or using a gold-standard reference method) to understand 384
the dietary assessment method’s measurement error structure to help avoid misinterpretation of dietary 385
intakes in relation to final growth outcomes. 386
Acknowledgements 387
We are grateful for the skilled and dedicated efforts of the data collection team: Mayamiko Banda, 388
Hamsa Banda, Zikomo Chipatso, Reuben Mbwana, Tony Kansilanga, Mike Njaya, and Yacinta Stima. 389
We are thankful to Jimmy Ngwaya who carefully prepared the food models which formed the basis of 390
the data collection tools. A special thank you to Kathryn Dewey and Per Ashorn for their guidance and 391
leadership in developing the protocol for this study, and expert advice throughout the study 392
implementation and analysis. We are grateful for the vision, wisdom and professional guidance of the 393
whole iLiNS study Steering Committee (http://ilins.org/about-ilins/who-we-are/ilins-steering-394
committee). 395
Author contributions 396
J.H, C.K., K.M., U.A., M.A., & E.L.F designed the research and significantly contributed to the aim 397
and structure of manuscript; J.H. & C.K. conducted the research; A.M.R. & R.K. provided statistical 398
guidance and assistance with methods; J.H, R.K. & E.L.F analysed data and performed statistical 399
analyses; J.H drafted the paper with inputs from R.K. & E.L.F; J.H., R.K. & E.L.F had primary 400
responsibility for the final content. R.K. & E.L.F have equal contribution to senior authorship. All 401
authors have read and approved the final manuscript. 402
Page 15 of 58
Cambridge University Press
British Journal of Nutrition

For Review Only
16
References
1. Black RE, Victora CG, Walker SP, Bhutta ZA, Christian P, de Onis M, et al. Maternal and child
undernutrition and overweight in low-income and middle-income countries. Lancet.
2013;382(9890):427-51.
2. Arimond M, Zeilani M, Jungjohann S, Brown KH, Ashorn P, Allen LH, et al. Considerations in
developing lipid-based nutrient supplements for prevention of undernutrition: experience from the
International Lipid-Based Nutrient Supplements (iLiNS) Project. Matern Child Nutr. 2013.
3. Maleta KM, Phuka J, Alho L, Cheung YB, Dewey KG, Ashorn U, et al. Provision of 10-40 g/d
Lipid-Based Nutrient Supplements from 6 to 18 Months of Age Does Not Prevent Linear Growth
Faltering in Malawi. J Nutr. 2015.
4. Iannotti LL, Dulience SJ, Green J, Joseph S, Francois J, Antenor ML, et al. Linear growth
increased in young children in an urban slum of Haiti: a randomized controlled trial of a lipid-based
nutrient supplement. Am J Clin Nutr. 2014;99(1):198-208.
5. Dewey KG, Mridha MK, Matias SL, Arnold CD, Cummins JR, Khan MS, et al. Lipid-based
nutrient supplementation in the first 1000 d improves child growth in Bangladesh: a cluster-randomized
effectiveness trial. Am J Clin Nutr. 2017;105(4):944-57.
6. Haisma H, Coward WA, Albernaz E, Barros A, Victora CG, Wright A, et al. 2H2O turnover
method as a means to detect bias in estimations of intake of nonbreast milk liquids in breast-fed infants.
Eur J Clin Nutr. 2005;59(1):93-100.
7. Gibson RS, Ferguson EL. An interactive 24-hour recall for assessing the adequacy of iron and
zinc intakes in developing countries. HarvestPlus Technical Monograph2008. p. pp 160.
8. Gibson RS. Principles of nutritional assessment. New York: Oxford University Press; 2005.
9. Ferguson EL, Gadowsky SL, Huddle JM, Cullinan TR, Lehrfeld J, Gibson RS. An interactive
24-h recall technique for assessing the adequacy of trace mineral intakes of rural Malawian women; its
advantages and limitations. Eur J Clin Nutr. 1995;49(8):565-78.
10. Thakwalakwa CM, Kuusipalo HM, Maleta KM, Phuka JC, Ashorn P, Cheung YB. The validity
of a structured interactive 24-hour recall in estimating energy and nutrient intakes in 15-month-old
rural Malawian children. Matern Child Nutr. 2012;8(3):380-9.
11. Ferguson EL, Gibson RS, Opare-Obisaw C. The relative validity of the repeated 24 h recall for
estimating energy and selected nutrient intakes of rural Ghanaian children. Eur J Clin Nutr.
1994;48(4):241-52.
12. Fisher JO, Butte NF, Mendoza PM, Wilson TA, Hodges EA, Reidy KC, et al. Overestimation
of infant and toddler energy intake by 24-h recall compared with weighed food records. Am J Clin
Nutr. 2008;88(2):407-15.
13. Persson LA, Carlgren G. Measuring children's diets: evaluation of dietary assessment
techniques in infancy and childhood. Int J Epidemiol. 1984;13(4):506-17.
Page 16 of 58
Cambridge University Press
British Journal of Nutrition

For Review Only
17
14. Olinto MT, Victora CG, Barros FC, Gigante DP. Twenty-four-hour recall overestimates the
dietary intake of malnourished children. J Nutr. 1995;125(4):880-4.
15. Piwoz EG, Creed de Kanashiro H, Lopez de Romana G, Black RE, Brown KH. Within- and
between-individual variation in energy intakes by low-income Peruvian infants. Eur J Clin Nutr.
1994;48(5):333-40.
16. Bornhorst C, Huybrechts I, Ahrens W, Eiben G, Michels N, Pala V, et al. Prevalence and
determinants of misreporting among European children in proxy-reported 24 h dietary recalls. Br J
Nutr. 2013;109(7):1257-65.
17. Piwoz EG, Creed de Kanashiro H, Lopez de Romana G, Black RE, Brown KH. Potential for
misclassification of infants' usual feeding practices using 24-hour dietary assessment methods. J Nutr.
1995;125(1):57-65.
18. Kipnis V, Freedman LS. Impact of exposure measurement error in nutritional epidemiology. J
Natl Cancer Inst. 2008;100(23):1658-9.
19. Willett W. Nutritional Epidemiology, Third Edition. New York, New York, USA.: Oxford
University Press; 2013.
20. Keogh RH, Carroll RJ, Tooze JA, Kirkpatrick SI, Freedman LS. Statistical issues related to
dietary intake as the response variable in intervention trials. Stat Med. 2016;35(25):4493-508.
21. Hemsworth J, Kumwenda C, Arimond M, Maleta K, Phuka J, Rehman AM, et al. Lipid-Based
Nutrient Supplements Increase Energy and Macronutrient Intakes from Complementary Food among
Malawian Infants. J Nutr. 2016;146(2):326-34.
22. Smith AF, Domel Baxter S, Hardin JW, Nichols MD. Conventional analyses of data from
dietary validation studies may misestimate reporting accuracy: illustration from a study of the effect of
interview modality on children's reporting accuracy. Public Health Nutr. 2007;10(11):1247-56.
23. Dop MC, Milan C, Milan C, N'Diaye AM. The 24-hour recall for Senegalese weanlings: a
validation exercise. Eur J Clin Nutr. 1994;48(9):643-53.
24. Dop MC, Milan C, Milan C, N'Diaye AM. Use of the multiple-day weighed record for
Senegalese children during the weaning period: a case of the "instrument effect". Am J Clin Nutr.
1994;59(1 Suppl):266S-8S.
25. Keogh RH, White IR, Rodwell SA. Using surrogate biomarkers to improve measurement error
models in nutritional epidemiology. Stat Med. 2013.
26. Kipnis V, Midthune D, Freedman L, Bingham S, Day NE, Riboli E, et al. Bias in dietary-report
instruments and its implications for nutritional epidemiology. Public Health Nutr. 2002;5(6A):915-23.
27. Moore SE, Prentice AM, Coward WA, Wright A, Frongillo EA, Fulford AJ, et al. Use of stable-
isotope techniques to validate infant feeding practices reported by Bangladeshi women receiving
breastfeeding counseling. Am J Clin Nutr. 2007;85(4):1075-82.
Page 17 of 58
Cambridge University Press
British Journal of Nutrition

For Review Only
18
28. Victora CG, de Onis M, Hallal PC, Blossner M, Shrimpton R. Worldwide timing of growth
faltering: revisiting implications for interventions. Pediatrics. 2010;125(3):e473-80.
Page 18 of 58
Cambridge University Press
British Journal of Nutrition

For Review Only
19
Table 1 Characteristics of participants at enrolment into the main study (at 6 months of
age)
Control Intervention p-value
Participants (n) 26 106
Female n (%) 14 (54) 49 (47) 0.50a
Socio-demographic Background
Characteristics (n) 24 105
Maternal age; mean (SD) years 28.8 (7.3) 26.6 (5.9) 0.12b
Maternal Education; mean (SD) years 3.9 (3.4) 4.4 (3.6) 0.52b
Female-headed household n (%) 2 (8.3) 12 (11.9) 0.78a
More than one child under 5 years old in
household n (%) 11 (45.8) 44 (41.9)
0.06a
Maternal occupation n (%)
Farming/Fishing
17 (77.3)
66 (66.0)
0.64a
House wife 3 (16.6) 27 (27.0)
Indoor / office work 1 (4.6) 3 (3.0)
Other 1 (4.6) 3 (3.0)
Unknown 0 (0) 1 (1)
Information collected during time of visit (n) 26 106
Season (rainy: October - March) n (%) 12 (46.1) 56 (52.8) 0.80a
Infant Breastfeeding n (%) 25 (100)c
104 (98.1) 0.49a
a Chi-square
b Two-sample t-test
c n=25 breastfed, n=1 missing value in this
control group
Page 19 of 58
Cambridge University Press
British Journal of Nutrition

For Review Only
20
Table 2: Estimated intakes of energy and selected nutrients (Mean and 95 % Confidence Interval)a using the i-24-HR compared
to WFR between the hours of 06:00 and 18:00 by intervention group and pooled group
Control Group (n=26) Intervention Group- LNS (n=106) Pooled Group (n=132)
Nutrient WFR i-24-HR
Recall
Abs.
Diffb
p-
valuec
WFR
i-24-
HR
Recall
Abs
Diffb
p-
valuec
p-
valued
WFR i-24-HR
Recall
Abs
Diffb
p-
valuec
Energy
(kcal/d)
376
(317,
437)
293
(246,
345)
-88
0.010
388
(352,
424)
379
(346,
412)
-10
0.60 0.052
385
(355, 416)
361
(333,
390)
-25
0.09
Protein
(g/d)
9.6
(7.7,
11.6)
7.1
(5.8, 8.4)
-2.9
0.009
9.4
(8.4,
10.5)
8.2
(7.3,
9.0)
-1.6
0.007 0.36
9.5
(8.5, 10.4)
8.0
(7.3, 8.6)
-1.8
<0.001
Fat (g/d) 7.3
(5.3, 9.8)
5.3
(4.0, 6.8)
-2.8
0.05
10.0
(8.7,
11.5)
10.4
(9.1,
11.7)
0.1
0.62 0.10
9.6
(8.3, 10.7)
9.2
(8.2,
10.4)
-0.4
0.65
Iron (mg/d) 2.6
(2.1, 3.2)
1.8
(1.4, 2.2)
-0.1
<0.00
1
3.7
(3.3,
4.2)
4.0
(3.4,
4.5)
0.3
0.25 0.020
3.5
(3.1, 3.9)
3.5
(3.0, 3.9)
0.03
0.68
Zinc (mg/d) 1.6
(1.2, 1.9)
1.1
(0.9, 1.4)
-0.5
<0.00
1
3.3
(2.8,
3.8)
3.8
(3.1,
4.4)
0.6
0.020 0.07
2.9
(2.5, 3.3)
3.1
(2.6, 3.7)
0.4
0.18
Calcium
(mg/d)
38
(25, 54)
53
(33, 77)
21.6
0.20
94
(77,
113)
128
(107,
152)
38.3
<0.001 0.41
81
(68, 96)
111
(93, 130)
35.1
<0.001
Vitamin A
(µg RAE/d)
39
(18, 67)
24
(9, 46)
-
18.8
0.19
143
(113,
176)
164
(130,
202)
24.1
0.10 0.23
117
(93, 144)
125
(99, 156)
15.9
0.37
a Data back-transformed from square root transformation for presentation
b Absolute mean difference
- i-24HR Recall – WFR
c Matched pairs T-test
d Two-group t-test with equal variances between intervention and control group absolute differences
Page 20 of 58
Cambridge University Press
British Journal of Nutrition

For Review Only
21
i-24-HR: interactive 24-hour recall, LNS: Lipid-based nutrient supplement, RAE: retinol activity equivalents, WFR: weighed food record
Page 21 of 58
Cambridge University Press
British Journal of Nutrition

For Review Only
22
Table 3: Percentage agreement for matching foods (items appearing both on the i-24-HR and the WFR)
between intervention groups
Median (25th, 75
th percentile)
Control Group (n=25) Intervention Group (n=106)
na,e Percentage
Agreementb n Percentage Agreement
b p-valuec
Phala, all types (full volume) 25 100.0 (78.5, 122.4) 99 87.5 (68.1, 118.6) 0.457
Nsima, Rice (full volume) 25 78.4 (61.7, 100.0) 98 95.4 (59.5, 141.5) 0.248
Added Sugar 14 141.5 (103.7, 250.0) 69 167.7 (111.2, 295.0) 0.776
Sweetened Snacks 5 61.4 (50.7, 166.0) 45 112.7 (61.1, 195.0) 0.258
Savoury Snacks 8 105.9 (84.6, 137.5) 18 100.0 (56.7, 175.0) 0.683
Meat, Fish and Egg (solid) 7 82.7 (62.9, 294.9) 26 107.8 (62.7, 151.9) 0.735
Legumes, Nuts, Seeds 8 36.1 (26.4, 76.6) 26 76.2 (37.5, 105.3) 0.680
Fruit 4 160.0 (88.1, 231.7) 27 94.0 (66.2, 140.0) --
Starchy Root and Vegetables 2 29.2 (22.1, 36.3) 20 80.8 (48.2, 145) --
Milk and Yogurt 3 90.2 (90.0, 103.7) 8 111.0 (53.0, 228.6) --
Non-dairy beverages 5 115.3 (85.6, 173.7) 15 100.0 (66.8, 142.2) --
Soup/Broth from Relish 14 239.0 (195.3, 308.3) 54 134.0 (85.7, 240.0) 0.038
LNS - 65 154.0 (98.8, 298.3)d
-- a Includes all portion sizes from items that match between the reported and reference values at the same time (i.e.: meal
or snack time) b Report percentage = (Reported amount / reference amount) x 100
Reference amount observed during the weighed food record; Reported amount taken from the 24-hour dietary recall. c Mann-Whitney two-sample rank sum test by food group
d LNS only present in the diets of the intervention group, which is why there is no between-group comparison. This is descriptive
only, looking at the percentage agreement of LNS in the intervention group. e One participant missing in the control group for these analyses
i-24-HR: interactive 24-hour recall, LNS: Lipid-based nutrient supplement, WFR: weighed food record
Page 22 of 58
Cambridge University Press
British Journal of Nutrition

For Review Only
23
Table 4: Number of eating episodes and percentages of matching food groups (items appearing both in the i-24-HR and the
WFR), intrusions and omissions by intervention groups
Control Group (n=25d) Intervention Group (n=106)
n (%) n (%)
matching a intrusion
b omission
c matching
a intrusion
b omission
c
Phala, all types (full volume) 49 (92.5) 0 (0) 4 (7.6) 166 (94.3) 2 (1.1) 8 (4.6)
Nsima, Rice (full volume) 30 (88.2) 3 (8.8) 1 (2.9) 150 (89.8) 9 (5.4) 8 (4.8)
Added Sugar 22 (73.3) 5 (16.7) 3 (6.7) 105 (68.6) 26 (17.0) 22 (14.4)
Sweetened Snacks 6 (50.0) 2 (16.7) 4 (33.3) 59 (68.6) 15 (17.4) 12 (14.0)
Savoury Snacks 10 (76.9) 2 (15.6) 1 (7.7) 23 (69.7) 5 (15.2) 5 (15.2)
Meat, Fish and Egg (solid) 8 (53.3) 0 (0) 7 (46.7) 34 (56.7) 7 (11.7) 20 (32.8)
Legumes, Nuts, Seeds 13 (76.5) 1 (5.9) 3 (17.6) 39 (68.4) 4 (7.0) 14 (24.6)
Fruit 4 (66.7) 1 (16.7) 1 (16.7) 34 (70.8) 8 (16.7) 6 (12.5)
Starchy Root and Vegetables 2 (40.0) 0 (0) 3 (60.0) 22 (71.0) 4 (12.9) 5 (16.1)
Milk and Yogurt 3 (100) 0(0) 0 (0) 8 (47.1) 6 (35.3) 3 (17.6)
Non-dairy beverages 6 (75.0) 2 (25.0) 0 (0) 20 (62.5) 7 (21.9) 5 (15.6)
Soup/Broth from Relish 18 (62.1) 8 (27.6) 3 (10.3) 68 (64.7) 30 (28.6) 7 (6.7)
LNS - -- 101 (89.4) 7 (6.2) 5 (4.4) a The total of portions that were matched between the reference (WFR) and reported (i-24-HR), as a percentage of all items in the
same group b The total of portions that were reported (i-24-HR) but not observed in the reference data (WFR)
c The total of portions that were observed in the reference data (WFR), but not reported (i-24-HR)
d One participant missing for these analyses
i-24-HR: interactive 24-hour recall, LNS: Lipid-based nutrient supplement, WFR: weighed food record
Page 23 of 58
Cambridge University Press
British Journal of Nutrition

For Review Only
24
Online supplement Table 1: Average reported (i-24-HR) and reference (WFR) portion sizes by food group
Median (25th, 75th Percentiles)
n a
Reported amount (g)b Reference Amount (g)
c
Percentage
agreementd P-value
e
Phala, all types (full volume) 125 78.9 (48.5, 112.0) 99.0 (64.7, 136.0) 86.4 (66.1, 114.1) <0.001
Nsima, Rice (full volume) 124 52.5 (29.1, 80.0) 56.8 (33.5, 89.8) 89.1 (56.6, 135.0) 0.028
Added Sugar 94 5.1 (3.6, 7.9) 3.0 (1.9, 5.5) 143.3 (99.2, 238.9) <0.001
Sweetened Snacks 64 7.9 (4.1, 15.8) 9.0 (4.0, 15.5) 91.7 (38.0, 158.0) 0.64
Savoury Snacks 34 7.7 (3.5, 11.0) 6.0 (3.0, 10.0) 86.1 (51.9, 157.1) 0.59
Meat, Fish and Egg (solid) 57 6.0 (0, 12.4) 9.2 (4.9, 18.2) 59.7 (0, 110.7) 0.015
Legumes, Nuts, Seeds 50 2.4 (0.4, 5.8) 7.8 (3.9, 16.0) 37.5 (2.4, 83.8) <0.001
Fruit 38 22.5 (10.0, 35.0) 17.0 (6.0, 32.5) 94.0 (52.0, 136.4) 0.64
Starchy Root and Vegetables 30 18.0 (7.0, 24.0) 15.5 (6.0, 43.0) 50.0 (19.4, 120.0) 0.12
Milk and Yogurt 15 11.8 (5.2, 41.0) 8.0 (1.0, 29.0) 90.1 (36.8, 183.2) 0.82
Non-dairy beverages 33 47.3 (27.5, 76.1) 27.7 (9.0, 86.3) 98.1 (43.8, 123.5) 0.28
Soup/Broth from Relish 94 17.0 (11.7, 26.0) 7.4 (0, 16.9) 138.5 (80.0, 243.1) <0.001
LNS 68 8.1 (4.5, 11.8) 4.5 (2.0, 9.0) 148.7 (95.0, 274.0) <0.001 a
Refers to the number of participants where this food group was present on the WFR, i-24-HR, or both. This includes the average
portion size estimation per food group per participant. In the case where one was an intrusion, this resulted in a reference value of
zero, and in the case where there is an omission, this resulted in a reported amount of zero. This is the participant average per food
group.
b median daily average per participant of reported amount derived from i-24-HR
c median daily average per participant of reference amount derived from WFR
d Percentage agreement: (Reported amount / reference amount) x 100
e p-value derived from Wilcoxon signed-rank test for matched pairs
i-24-HR: interactive 24-hour recall, LNS: Lipid-based nutrient supplement, WFR: weighed food record
Page 24 of 58
Cambridge University Press
British Journal of Nutrition

For Review Only
25
Online supplement Table 2: Comparison of i-24-HRs that corresponded to and were independent of the WFR. An Assessment of
bias in reporting related to the presence of the WFR: the “instrument effect”.
N=71
Median Intake (25th,75
th percentile)
Nutrient
Independent 24-HR Recall i24-HR WFR
Absolute
Differencea
p-valueb
Energy (kcal/d) 375 (273, 553) 327 (246, 463) -34 0.10
Protein (g/d) 8.8 (5.8, 12.5) 7.6 (5.0, 10.3) -0.78 0.06
Fat (g/d) 9.8 (5.0, 15.4) 8.1 (4.2, 11.8) -1.9 0.06
Fe (mg/d) 3.2 (1.9, 5.8) 2.6 (1.7, 5.3) -0.2 0.50
Zn (mg/d) 2.2 (1.2, 5.9) 2.0 (1.2, 6.1) -0.1 0.97
Ca (mg/d) 115.9 (41.5, 204.3) 104.9 (34.7, 208.5) -1.1 0.48
Vitamin A (µg RAE/d) 122.9 (30.3, 262.9) 107.9 (20.5, 292.9) 0 0.79 a i-24HR WFR – Independent 24-HR
b Wilcoxon signed rank matched-pairs test
Page 25 of 58
Cambridge University Press
British Journal of Nutrition

For Review Only
26
Figure 1: Consort Flow Diagram of Participant Enrolment and Inclusion in the Validation Sub-Study
Page 26 of 58
Cambridge University Press
British Journal of Nutrition
For Review Only
27
Online supplement Figure 1: Bland Altman Plot Showing Relative Agreement in energy
(kcal/day) estimation between WFR and i-24-HR: Pooled Group
Page 27 of 58
Cambridge University Press
British Journal of Nutrition

For Review Only
28
Online Figure 2a: Bland Altman Plot Showing Relative Agreement in Energy (kcal)
estimation between WFR and i-24-HR: Control Group
Page 28 of 58
Cambridge University Press
British Journal of Nutrition

For Review Only
29
Online supplement Figure 2b: Bland Altman Plot Showing Relative Agreement in Energy
(kcal) estimation between WFR and i-24-HR: Intervention Group
Page 29 of 58
Cambridge University Press
British Journal of Nutrition

For Review Only
1
Comparison of an interactive 24-hour recall and weighed food record for measuring energy and
nutrient intakes from complementary foods among 9-10-month-old Malawian infants consuming
Lipid-Based Nutrient Supplements
Jaimie Hemsworth1, Mary Arimond
2, Chiza Kumwenda
3, Andrea M. Rehman
4, Kenneth Maleta
5, Ulla
Ashorn3, Ruth Keogh
6,* and Elaine L. Ferguson
1,*
1 Department of Population Health, London School of Hygiene and Tropical Medicine, UK
2 Intake - Centre for Dietary Intake Assessment, FHI 360, Washington, DC, USA
3 Department for International Health, School of Medicine, University of Tampere, Finland
4 Department of Medical Statistics, London School of Hygiene and Tropical Medicine, UK
5 College of Medicine, University of Blantyre, Malawi
6 Department of Infectious Disease Epidemiology, London School of Hygiene and Tropical
Medicine, UK
* Authors declare equal contribution to senior authorship
Corresponding author:
Elaine Ferguson
Department of Population Health
London School of Hygiene and Tropical Medicine
Keppel Street, London, UK
WC1E 7HTE-mail: [email protected]
Running title: Dietary assessment errors of common methods
Keywords
LNS, weighed record, 24-hr recall, dietary assessment, infants
Abstract word count: 250, Manuscript body word count: 5 094
Number of figures: 1
Number of tables: 4
Supplementary tables: 2, Supplementary figures: 3
Study Funding: This manuscript is based on research funded by a grant issued to the University of
California, Davis from the Bill & Melinda Gates Foundation. The findings and conclusions contained
within are those of the authors and do not necessarily reflect positions or policies of the Bill & Melinda
Gates Foundation.
All authors declare no conflicts of interest
Page 30 of 58
Cambridge University Press
British Journal of Nutrition

For Review Only
2
Abstract 1
Fortifying complementary foods with lipid-based nutrient supplements (LNS) may improve energy and 2
nutrient intakes of infants at risk for undernutrition. We aimed to determine the relative validity of an 3
interactive 24-hour dietary recall (i-24-HR) for assessing the impact of an LNS intervention on dietary 4
intakes of energy and nutrients among rural Malawian 9-10-month-old infants (n=132) participating in 5
the iLiNS dose trial. Dietary data were collected for the same day via i-24-HRs and weighed food 6
records. Inter-method agreements were estimated overall and by intervention group, using Bland-7
Altman plots and paired t-tests; measurement error models (differential error); and percentage of food 8
omissions and intrusions were estimated. Overall, inter-method differences in mean intakes of energy 9
and most nutrients were not significant. When stratified by group, recalled energy intakes were under-10
estimated (-88kcal p=0.01) in the control but not in the intervention group (-10kcal; p=0.6). This 11
differential reporting error was related to an over-estimation of recalled LNS (8.1g vs 4.5g; p<0.001) in 12
the intervention group, compensating for an under-estimation of energy and nutrients intakes from 13
complementary foods. Sources of measurement error in the i-24-HR were under-estimations of starchy 14
staples, meat/fish/eggs and legumes/nuts/seeds (overall percent agreement overall report rates 15
betweenranged from 38-89%; p<0.028); and over-estimations of added sugar, soups/broths and LNS 16
(overall percent agreement betweenoverall report rates ranged from 138-149%; p<0.001). Common 17
(>30% of eating occasions) omissions were milk/fish/egg, starchy roots/vegetables, and sweetened 18
snacks. Common intrusions were milk/yogurt. Common (>20% eating occasions) omissions were 19
meat/fish/eggs, legumes/nuts/seeds and starchy roots/vegetables, and intrusions were milk/ yogurt, 20
beverages and soup/broths. Starchy staples and LNS were recalled when consumed (>85%) (i.e. well 21
matched). These results emphasise the importance of considering differential error when interpreting 22
dietary results in LNS trials. 23
Page 31 of 58
Cambridge University Press
British Journal of Nutrition

For Review Only
3
Introduction 24
Undernutrition is common among young children living in low income countries (1). Both the short- 25
and long-term adverse effects of under-nutrition impact health and future livelihoods. This underscores 26
the need for comprehensive intervention packages, including effective dietary strategies. One such 27
intervention is the use of lipid-based nutrient supplements (LNS) as home fortification of infant foods 28
(2). Studies of the effectiveness of LNS for reducing undernutrition have shown mixed results (3-5). In 29
cases where there was no association between LNS intake and growth outcomes (3), low adherence to 30
the intervention (LNS consumption) and/or the displacement of other foods in the diet might partially 31
account for the lack of a physiological effect. Thus, to correctly interpret LNS intervention trial results, 32
accurate measurement of the LNS exposure and its influence on overall dietary intakes is fundamental. 33
The assessment of infant dietary intakes is complicated for several reasons: 1) infants eat very small 34
quantities of food; 2) measuring intake includes measuring not only the amount served, but also 35
amounts left over, spit-up, spilled or dropped; 3) infants are often cared for and fed by multiple people; 36
and 4) infants are unable to report their own intakes (6). The weighed food record is considered the 37
“gold standard” dietary assessment method for quantitative estimates of an individual’s dietary intake, 38
including for young children, because foods are weighed and recorded as they are consumed (7). 39
However, for large surveys, the 24-hour recall is more practical because it is relatively rapid to 40
conduct, has a low respondent burden and is less disruptive for low-literacy communities where, for the 41
weighed food record, research assistants must weigh and record all foods consumed by participants. 42
The disadvantages of 24-hour recalls are that they are prone to errors of memory, recall bias, errors in 43
portion size reporting and potentially a social-desirability bias (8). The interactive multiple pass 24-44
hour recall (i-24-HR) was developed specifically for areas with low literacy rates, and includes a 45
pictorial chart to prospectively record dietary intakes and reduce errors of memory (9). 46
Previous studies, in Malawi, Ghana, Sweden and the United States, have assessed the validity of the 47
24-hour dietary recall method relative to weighed food records (WFR) for estimating the energy and 48
nutrient intakes of young children (10-13). They show recalled compared to weighed energy intakes are 49
generally over-estimated (10, 12, 14), which for rural Malawian 15-m olds was by 13% (10). This 50
pattern of over-estimation of energy intakes might be more pronounced for toddlers than infants, if 51
accurate reporting becomes more difficult as the diet becomes more complex (12, 15). To our 52
knowledge no study has validated the 24-hour recall for African infants under 12-months of age. 53
There is also evidence that certain foods are more accurately reported than others (16, 17). Such 54
differences become important when assessing dietary exposures in a LNS intervention trial because 55
LNS, which is an energy and nutrient dense food, is not present in the diet of the control group. 56
Page 32 of 58
Cambridge University Press
British Journal of Nutrition

For Review Only
4
Systematic under- or over-estimation of LNS intakes would bias between-group comparisons by either 57
exaggerating or attenuating the observed effect of LNS on infant dietary intakes, of energy and 58
nutrients. An accurate assessment of dietary exposure is essential in dietary intervention trials to 59
properly understand the association between dietary exposure and outcome (18-20). To our knowledge, 60
the i-24-HR has not been validated for use among infants who are participating in an LNS intervention 61
trial. 62
This study, therefore, aimed to assess the relative validity of the i-24-HR used in an LNS intervention 63
trial, the iLiNS study (3). The iLiNS study aimed to evaluate the efficacy of three doses of LNS for the 64
prevention of stunting among infants supplemented from 6 to 18 months of age. In this trial, inter-65
group differences in dietary intakes of energy and nutrients were assessed when the infants were 9-10 66
months of age (21). The specific objectives of the current study were to 1) assess the relative validity of 67
the i-24-HR method for estimating dietary intakes of energy, protein, fat, iron, zinc, calcium and 68
vitamin A from complementary foods using a 1-day WFR as the reference method; 2) assess whether 69
there is a differential bias in i-24-HR measures of energy intake between the control group and 70
intervention groups, and 3) describe potential sources of measurement error in the i-24-HR, including 71
errors in the types or amounts of LNS and complementary foods reported. 72
Methods 73
Design and Study Population 74
A cross-sectional validation study was nested within a dietary assessment sub-study of infants 75
participating in a 12-month LNS randomised control trial (iLiNS-DOSE trial) conducted in Mangochi 76
district, Malawi from November 200910 and July 2012. Data collection for the dietary assessment sub-77
study took place between March 2010 and October 2011xxx when the infants were 9-10 m of age. Data 78
collection Data collection for the dietary validation study took place between October 2010 and 79
October 2011. The main trial was designed to assess the impact of three different doses of LNS (10g, 80
20g and 40g) on linear growth; which was delivered bi-weekly to households in the intervention 81
groups. The objectives and methods of the iLiNS-DOSE trial (n=1980) and the dietary assessment 82
sub-study (n=688) are described in more detail in Maleta, et.al. (3) and Hemsworth, et.al. (21), 83
respectively. In the dietary assessment sub-study, two i-24-HRs were done exactly 7-days apart when 84
the infants were between 9 and 10 months of age. One i-24-HR was done during the week LNS was 85
delivered, and the other in the subsequent week. In the validation study the WFRs which were done 86
one-day prior to a corresponding i-24-HR, were done just after the LNS delivery day to maximize 87
Page 33 of 58
Cambridge University Press
British Journal of Nutrition

For Review Only
5
capturing the presence of LNS in the child’s diet. The other i-24-HR was collected either 7-days before 88
or 7-days after the i-24-HR that corresponded with the WFR day. 89
Sampling 90
A stratified random random sample of 228 infant-mother dyads was obtained calculatedselected for the 91
validation study (i.e., 56 in each of the control, 10g, 20g, and 40g LNS groups). Theis sample size for 92
the validation study was chosen calculated to allow detection of a difference of 55kcal (one 10g dose of 93
LNS) between each of the four intervention groups with power of 80% and α=0.05, assuming a 94
standard deviation of the difference between the methods (WFR minus i-24-HR) of 138 kcal (derived 95
from a pilot study), and a 10% attrition rate (e.g. missed i-24-HR following the WFR). 96
The original inclusion criterion was participation in the dietary assessment sub-study of the iLiNS-97
DOSE trial. The validation study, however, began seven months after the trial began, which meant that 98
one third of participants had already completed the dietary sub-study and were no longer eligible for 99
the validation study. As a result, to meet our target sample size of 228 age-eligible infants, we selected 100
additional infants (n=78) at random from the basic sub-study group (i.e., not randomised to any 101
additional sub-study at baseline to minimise respondent burden) to reach the intended sample size. It 102
introduced an imbalance in the number of infants from the control and 10g LNS groups versus the 20g 103
and 40g LNS groups. As such, more infants were in the 20g LNS and 40g LNS groups than the other 104
two groups in this validation study. 105
Ethical Approval 106
Ethical approval for this sub-study study was granted by the London School of Hygiene and Tropical 107
Medicine Research Ethics Board as well as by the College of Medicine Research Ethics Board in 108
Malawi. Informed written consent was obtained from all participating caregivers in this study. The trial 109
was registered at clinicaltrials.gov with the identifier: NCT00945698 110
Dietary Assessment 111
Interactive 24-hour Recall (i-24-HR) 112
Dietary data were collected using a 4-pass i-24-HR, developed for use in a rural African context (9). 113
The method was modified specifically for a similar population to and included pictorial charts 114
(intended to reduce intrusions and omissions), bowls/cups/plates, and measured portion sizes using real 115
food replicas and salted models. In the dietary assessment sub-study, caregivers were given the 116
pictorial food chart and a plastic cup and bowl 2-days before the i-24-HR was done. On the day before 117
the i-24-HR, caregiversthey were asked to prospectively record on the pictorial chart all foods, 118
Page 34 of 58
Cambridge University Press
British Journal of Nutrition

For Review Only
6
beverages, and LNS (if appropriate) when given to the child to minimise memory errors; and to feed 119
their child from the cup and bowl provided to minimise portion size estimation errors. In the first pass, 120
during the i-24-HR interview, from memory, the caregiver was asked to serially recall all foods, 121
supplements and beverages that their child had consumed in the previous 24 hours. In the second pass, 122
information about the time, place, and description of the food or beverage was collected. In the third 123
pass, portion sizes were estimated by the caregiversrespondents showing the amount served and the 124
amount left-over using real food replicas (with or without excess salt to preserve them) and unit 125
descriptions (e.g. package of biscuits). The amounts were weighed by the interviewers using digital 126
kitchen scales (Home Elegance, accurate to ± 1g), and recorded. The amount consumed was calculated 127
as the amount served minus the amount left-over. LNS portion sizes were measured using a pot of 128
LNS, which was weighed before and after the caregiver had removed the amount of LNS used at each 129
eating occasion. Left-overs were subtracted from the amount of LNS served. If LNS was mixed with 130
other foods, the amount left over was calculated by multiplying the amount served by the proportion of 131
the mixed dish that was consumed, assuming uniform mixing. The consumption of LNS was not 132
specifically probed to prevent errors of intrusion (i.e. items listed but not actually consumed). To 133
reduce potential differences in recording, interviewers were given extensive training and used 134
standardised operating procedures, including a portion size estimation manual, detailing the specific 135
methods for portion size estimations and probing. At the end of the third pass, interviewers data 136
collectors asked for the pictorial chart. Any discrepancies between the pictorial chart and the food list 137
of the i-24-HR were discussed. In the final pass, the data collector summarised and confirmed the food 138
and drinks recorded in the i-24-HR. 139
Weighed Food Record (WFR) 140
All foods and beverages consumed by the child from 6 a.m. until the final meal of the day were 141
weighed and recorded by a data collector, using digital kitchen scales (Home Elegance, accurate to ± 142
1g). Left-over foods were weighed either individually, if they could be separated on the plate, or as a 143
mixture, assuming uniform mixing. Recipe data were collected by weighing all raw ingredients and the 144
final cooked dish. The WFR data collector was not involved in the collection of the i-24-HR data. 145
Questionnaires 146
Socio-demographic background characteristics of the infants were collected within two weeks of 147
baseline enrolment in the iLiNS study, when the infants were 6 months old, using an interviewer-148
administered questionnaire. analysed(maternal occupation, maternal education level, household size, 149
head of household, and presence of other child under 5 years in the household) of the infants were 150
Page 35 of 58
Cambridge University Press
British Journal of Nutrition

For Review Only
7
collected using an interviewer administered questionnaire within two weeks of baseline enrolment 151
(when infants were 6 months of age). 152
Data processing 153
Conversion factors were developed for the i-24-HR, and used to estimate the grams of food consumed. 154
Average recipes were calculated for cooked dishes using the individual recipes collected from each 155
household. These data were used to calculate intakes of ingredients from cooked dishes in the i-24-156
HRs. Intakes of energy and nutrients from the WFR and i-24-HRs were estimated, using a food 157
composition table developed for this study (21). 158
The time each item was consumed was also recorded, and it was used to match the corresponding 159
eating occasions for inter-method portion size comparisons. Meals and snacks consumed after 19:00 160
were removed from both the WFR and i-24-HR (i.e. a 12-hour WFR and recall were created) because 161
there were occasions during the collection of the WFR when the final meal was consumed after the 162
data collector had left the household. 163
Statistical Analysis 164
All data analyses were performed using Stata version 12 (StataCorp LLC, College Station, Texas). The 165
three LNS intervention groups were collapsed to form one large group, for all analyses, because there 166
were no significant inter-group differences in energy and nutrient intakes from complementary foods 167
(including LNS), and the group sample sizes were small (21). In all analyses, except the analyses for an 168
instrument effect (see below), data from only one of the two i-24-HR were used, which was the i-24-169
HR collected for the same day as the WFR. Energy and nutrient intake distributions from the WFR and 170
i-24-HRs were mathematically transformed, when necessary, for the analyses. 171
172
Sociodemographic variables 173
A composite variable for socioeconomic status was calculated using principal component analysis 174
(PCA), and the PCA scores were divided into quintiles using the first principal component. The 175
following variables were used as part of the composite variable: maternal occupation, household 176
crowding, source of electricity, source of water, sanitary facilities, material of roofing, and material of 177
house walls. 178
Chi-squared tests, for categorical socio-demographic variables, and two-sample t-tests, for non-179
categorical socio-demographic variables, were used to check for variables associated with 180
“missingness” of WFRs and for differences between intervention groups (control vs. LNS) in the 181
validation study. 182
Page 36 of 58
Cambridge University Press
British Journal of Nutrition

For Review Only
8
Assessment of agreement between dietary assessment methods 183
Paired t-tests were used to compare mean intakes of energy and nutrients from the corresponding i-24-184
HR and WFR. Absolute differences (“error”) in amounts of energy and nutrients between the two 185
methods were calculated as follows: i-24-HR – WFR. A two-sample t-test with equal variances was 186
used to compare the absolute differences between the control and intervention groups. Bland-Altman 187
plots were used to estimate, for energy intakes, the level of agreement between the two methods and 188
the 95% limits of agreement. 189
Assessment of differential error 190
Measurement error modelling was used to investigate whether error in the i-24-HR differed by 191
treatment group. We let �� denote the i-24- HR measurement (square-root transformed) made at the 192
same time as the WFR, and �� denote the WFR measurement itself (square-root transformed). The 193
second independent i-24- HR measurement (square-root transformed) was denoted the square-root 194
transformed measure ��. The true, but unobserved, intakes at time points 1 and 2 were denoted �� and 195
�� respectively. At time point �(� = 1,2) the relationships between the observed measurements of 196
dietary intake and the unobserved underlying true intake were assumed to be of the following forms, 197
where we allowed separate model parameters for individuals in the control (C) and combined 198
intervention (T) groups, 199
Equation 1 200
201
Combinedinterventiongroup:�� = �� + �� �� + " �
Controlgroup:�� = ��$ + ��$�� + "$�
202
Combinedinterventiongroup:�� = �� + % �
Controlgroup:�� = �� + %$�
Page 37 of 58
Cambridge University Press
British Journal of Nutrition

For Review Only
9
The " and % terms are random errors with mean zero and constant variance. The WFR is assumed to 203
provide an unbiased estimate of true intake in both the control and intervention groups. The intercept 204
parameters �� and ��$ , and slope parameters �� and ��$ , represent systematic error in the i-24- HR 205
measurement. We assessed evidence for differential error based on estimates ofbootstrap confidence 206
intervals for the differences �� − ��$ and �� − ��$ and corresponding bootstrap confidence intervals. 207
The parameters of the measurement error model in Equation 1 were estimated via a method of 208
moments approach. 209
Sources of disagreement between the i-24-HR and WFR 210
To identify possible sources of disagreement between the two dietary assessment methods, we 211
categorised each food and drink item (for composite dishes, we matched the individual ingredients) as 212
an omission (present on WFR, absent on i-24-HR), an intrusion (absent on WFR, present on i-24-HR) 213
or a match (present on both methods at matching meal/snack times). We calculated the frequency of 214
each category across food groups (i.e., phala; nsima and rice; added sugar; sweetened snacks; savoury 215
snacks; meat, fish and egg; legumes, nuts, and seeds; fruit; starchy roots and vegetables; milk and 216
yogurt; non-dairy beverages; soup/broth from relish; and LNS), a method previously described by 217
Smith, et.al. (22). We compared the median percentage agreement for each food group, (i.e. 100* 218
reported amount (i-24-HR) / reference amount (WFR)), for the intervention and control groups, using 219
Mann-Whitney rank sum test when the sample was at least five consumers. In the case where one food 220
within a food group of these is an intrusion, this resulted in a reference amount of zero (at the 221
individual food level only), and in the case where there is an omission, this resulted in a reported 222
amount of zero. We also compared the overall inter-method differences, in the grams of food consumed 223
in each food group, using the Wilcoxon signed-rank test. 224
Instrument Effect 225
We tested for an “instrument effect”, because the presence of a data collector on the day of the WFR 226
might have influenced the caregiversrespondent’s ability to recall dietary intakes during its 227
corresponding i-24-HR. This “instrument effect” was assessed using the Wilcoxon signed-rank test, by 228
comparing the median intakes of energy and nutrients estimated using the i-24-HR corresponding to the 229
WFR day and the i-24-HR collected on a day independent of the WFR (i.e., collected one week before 230
or after the WFR). For this analysis, n=71 matched records were available. 231
Page 38 of 58
Cambridge University Press
British Journal of Nutrition

For Review Only
10
Results 232
Participants 233
A total of 228 infants were selected to participate in the validation study. However, 78 were lost to 234
follow-up and 18 did not have a matching WFR and i-24-HR. The final sample size analysed was 132 235
matching i-24HRs and WFRs (Figure 1). There were no significant differences in socio-demographic 236
characteristics comparing those with missing data and those who completed the WFR (data not shown). 237
Likewise, there were no differences in baseline characteristics between the intervention and control 238
group (Table 1). 239
Agreement between dietary assessment methods 240
The reported energy intakes were lower in the i-24-HR compared to the WFR, although the difference 241
was not statistically significant (p=0.09) (Table 2). Reported protein intake was significantly 242
underestimated and calcium intake was significantly over-estimated by the i-24-HR compared to the 243
WFR (p<0.001). There were no significant between-method differences in intakes of fat, iron, zinc or 244
vitamin A. The Bland-Altman plot showed a systematic bias for under-reporting recalled energy 245
intakes compared to the WFR and poor agreement at the individual level, with 95% limits of agreement 246
of -3668 kcal to 3167 kcal (Online supplement Figure 1). 247
When stratified by intervention group, however, there was a significant under-estimation of recalled 248
energy intakes in the control group (p=0.010) but not in the intervention group (p=0.60) (Table 2). 249
Recalled intakes of protein, fat, iron and zinc were also significantly underestimated in the control 250
group. In the intervention group, recalled intakes of protein were significantly under-estimated, 251
whereas recalled intakes of calcium and zinc were significantly overestimated (Table 2). Further, after 252
comparing the absolute differences (“error”) calculated between the WFR and i-24-HR in the control 253
and intervention groups, we found significant differences (p<0.05) for energy (kcal) and iron, and all 254
other nutrients were considered non-significant (p>0.05). The Bland-Altman plot by intervention 255
group (Online supplement Figures 2a and 2b) showed poor 95% limits of agreement (LOA) for 256
energy at an individual level, for both the intervention (95% LOA -358, 337 kcal) and control (95% 257
LOA -375 to 207 kcal) groups; and a mean systematic under-estimation of energy intakes in the control 258
group only (-84 kcal, 95% LOA -375 to 207 kcal)84 kcal ). 259
260
By fitting the measurement error models in equation 1, we found that �'�$ = −2.4 (95% CI (-24.9, 261
29.7)) and �'� = 2.6 (95% CI (-20.0, 20.2)), �'�$ = 63.2 (95% CI (58.8, 67.3)) and �'� = −32.5 (95% 262
CI (-34.5,-30.6)). The confidence intervals were obtained from the 2.5 and 97.5 percentiles of 1000 263
Page 39 of 58
Cambridge University Press
British Journal of Nutrition

For Review Only
11
bootstrap estimates, using bootstrap samples stratified by intervention group. The expected i-24-HR 264
measure of energy intake (�) given the true intake (�) is therefore -(�|�) = −32.5 + 2.6� in the 265
combined intervention group, and -(�|�) = 63.2 − 2.4� in the control group. The estimates of the 266
slope are in opposite directions in the intervention and control groups because the correlation between 267
the independent i-24 and the WFR is positive, in the intervention group, but negative in the control 268
group; however the CIs are very wide and the 95% bootstrap CI for the difference �� − ��$ was (-269
46.6, 56.5). However, there was strong evidence for a difference in the intercepts; the 95% bootstrap CI 270
for the difference �� − ��$ was (-100.1, -90.7) The model-based approach, therefore, provides 271
suggests that the relationship between the i-24-HR measure of energy intake and the true intake may be 272
different in the intervention and groups, i.e. indication of aindicates a potential evidence of differential 273
error. 274
Sources of disagreement between themeasurement error in the i-24-HR and WFR 275
LNS intakes 276
In the intervention group, there was a significant between-method difference in estimated LNS intakes. 277
The median intake was significantly higher for the recalled (i-24-HR) than reference (WFR) amount 278
(i.e., 8.1g (4.5, 11.8) vs 4.5g (2.0, 9.0); p<0.001) (Online Supplement Table 1). The median (IQR) 279
percentage agreement (matched LNS portions) indicates recalled LNS consumption was over-estimated 280
by over 50% compared to the WFR (Table 3). Close to 90% of the eating occasions matched on both 281
the WFR and i-24-HR; and rates of intrusions and omissions were similar and low (Table 4). 282
Complementary food intakes 283
At the pooled group level, phala, legumes, nuts and seeds, and meat, fish and eggs were significantly 284
under-estimated; whereas, soups/broths from relish and added sugar were significantly over-estimated 285
in the i-24-HR compared to the WFR (Online Supplement Table 1). There were no significant 286
differences between intervention- and control groups in reporting accuracy (i.e., percentage agreement 287
for food groups), except for soups/broths from relish, where the control group showed a higher over-288
reporting rate than the intervention group. These comparisons, for four of the 12 food groups, were 289
limited by the small sample size of the control group (Table 3). 290
In both the intervention and control groups, a comparison of food group matches, intrusions and 291
omissions showed the highest reporting agreement for staples, where over 88% of the phala and nsima 292
eating occasions matched between the two methods (Table 4). Episodically consumed foods such as 293
meat, fish and eggs (which were frequently misreported as soup/broth from relish), starchy roots and 294
Formatted: Font: Bold
Page 40 of 58
Cambridge University Press
British Journal of Nutrition

For Review Only
12
vegetables, and sweetened snacks had poor reporting matching, with a higher tendency for respondents 295
to omit (i.e. forget) as opposed to intrude (i.e. add in error). 296
The “instrument-effect” 297
There was no evidence of an “instrument effect”. There were no significant differences in estimated 298
intakes of energy or nutrients comparing the independent i-24-HR (performed either one week before 299
or after the WFR) and the corresponding i-24-HR (i.e., for the same day as the WFR). The absolute 300
differences ranged from zero RAE/d to 34 kcal/d (Online supplement Table 2). 301
Discussion 302
In the context of a LNS supplementation trial, we found there was no significant difference comparing 303
energy intakes measured using the i-24-HR to the WFR when all groups were pooled. This comparison 304
was not biased towards agreement by the weighing process, because the independent and 305
corresponding i-24-HRs provided similar estimates of energy and nutrients intakes. However, this 306
pooled comparison masked a difference between the intervention and control group. When stratified by 307
intervention group, the i-24-HR systematically under-estimated dietary energy intakes compared with 308
the WFR in the control group but not in the intervention group. The significant difference in the “error” 309
or absolute difference between the methods in control and intervention groups suggest a differential for 310
recalled energy intakes. This differential error, for estimating median energy intakes, primarily is the 311
result of an over-estimation of the energy-dense supplement (LNS), which was only consumed by the 312
intervention group. It compensated for the under-estimation of energy intakes from complementary 313
foods because most caregiversrespondents were able to report whether their infant had consumed it. In 314
contrast, when using dietary data collected via i-24-HRs to examine associations, the 95% LOA 315
indicate poor agreement at the individual level, in both groups, which will attenuate associations. 316
These results highlight the importance, when aiming to of estimating differential measurement error to 317
correctly interpret estimate inter-group differences in the impact of an energy- and nutrient-dense 318
supplement onmedian intakes of energy and nutrients dietary intakes (and growth outcomes) in an 319
intervention trial, the importance of examining whether systematic measurement error when 320
quantifying intervention food consumption, contributes to a differential bias. In studies aiming to 321
examine associations between dietary intakes and functional outcomes (e.g., growth), the i-24-HR is 322
inferior to more accurate methods of dietary assessment. In our study considerable effort was made to 323
accurately estimate LNS consumption. The caregiversrespondentscaregivers were asked to spoon out 324
the amount of LNS served to the infant and estimate the amount left-over, which were both weighed 325
and recorded. 326
Formatted: Highlight
Formatted: Highlight
Formatted: Highlight
Formatted: Highlight
Formatted: Highlight
Formatted: Highlight
Formatted: Highlight
Formatted: Highlight
Formatted: Highlight
Page 41 of 58
Cambridge University Press
British Journal of Nutrition

For Review Only
13
There were few differences, comparing the intervention and control group, for between-method 327
agreement in the estimation of complementary foods intakes. In the pooled group analyses, the main 328
sources of between-method disagreement were under-estimated recalled portion sizes of dietary staples 329
(phala, rice and nsima by between 11 and 14%), meat, fish and eggs and legumes, nuts and seeds. 330
Energy-dense foods, such as added sugar, were overestimated by over 40% compared with the WFR; 331
but it did not compensate for the under-estimation of energy from staples (phala, nsima and rice). This 332
result is not surprising because dietary staples provide a high percentage of daily energy intakes for 333
rural infants in Malawi. 334
Underestimation of certain food groups is not unique and has been reported among women in Malawi 335
(9) as well as preschool aged children in Ghana (11). However, the underestimation in energy intakes 336
relative to the WFR, in the control group of our study, is in contrast to results from a study of 10-13 337
month old Senegalese infants (n=45), which showed the 24-hour recall was a relatively good measure 338
of intake compared to WFR (23, 24); and a study of 15-month old rural Malawian infants (n=169), 339
which showed a systematic over-estimation in energy and nutrient intakes (10). The sources of 340
measurement error, in the previous Malawian study, is are unknown. These inter-study differences 341
could be a function of inter-method or age group differences. In our study, we probed for left-overs 342
and adjusted the portion sizes in the i-24-HR based on recalled left-overs. This adjustment was not 343
reported in the other studies. It has been suggested that as a diet becomes more complex (as the infant 344
ages), the reporting accuracy changes (12) and perhaps the direction of the error also changes. 345
The results of this validation study suggest that a differential error might be present when an i-24- HR 346
is used to measure group meanedian dietary intakes, which is related to a systematic over-estimation of 347
the exposure (LNS). Linear calibration techniques could be used to correct the systematic under-348
estimation of energy intakes from non-LNS foods. Previous studies have developed correction factors 349
using the WFR as the reference standard to adjust i-24-HR energy intakes for a systematic 350
overestimation of energy intakes compared to the WFR. This technique is not recommended for the 351
current study because the reference method is subject to the same errors as the test method (19, 25), e.g. 352
both the WFR and i-24-HR are subject to mis-estimation of items that were spilled or spit up. The 353
linear calibration equations would only have been appropriate if we had used a biomarker, such as the 354
stable isotope technique to measure total energy expenditure, which is an unbiased and independent 355
measure of long-term energy intake (6, 20). 356
Formatted: Highlight
Formatted: Highlight
Page 42 of 58
Cambridge University Press
British Journal of Nutrition

For Review Only
14
Study Limitations and Advantages 357
The main study limitations were the relatively low sample size and high rate of attrition. The study was 358
underpowered to detect differential error in the i-24-HR between control vs. intervention groups. The 359
high rate of attrition occurred because of the logistical demands of this validation study in a large 360
catchment area (i.e. transportation, communication with households, etc.). No observed background 361
characteristics were associated with missing the visit. 362
Another limitation was the reference method used. The WFR is the most common reference standard 363
for comparison with the a 24-hour dietary recall because it is less resource-intensive than collection of 364
biomarkers, and it provides useful robust information about portion size estimation, intrusions and 365
omissions. However, it does not meet the strict criteria for a valid reference method (26). To validate 366
the i-24- HR (repeated to provide an estimate of usual intakes), for estimating energy intakes alone, the 367
doubly labelled water method is the preferred reference method (25, 27). Further, the modelling 368
approach we used to assess evidence for differential error (equation 1), relies on an assumption that the 369
WFR provides an unbiased measure of intake, as well as additional assumptions about the form of the 370
systematic errors. 371
This study also had many advantages. It was carried out several3 months after the start of the 372
intervention, which meant that the children were habituated to the intervention food. It was also 373
conducted over a long period of time which allowed for seasonal variation in dietary patterns and 374
episodically consumed foods to be captured. This study is also the first study that we are aware of that 375
has assessed the relative validity of the i-24-HR for estimating the dietary intakes of rural African 376
infants under 12 months of age who are participating in an LNS intervention trial. Such trials are 377
important because the process of stunting predominantly occurs before 15 months of age in rural Africa 378
(28). Detailed and accurate dietary intake information will contribute to an improved understanding of 379
direct causes of stunting and undernutrition. The study results emphasise the importance of considering 380
a potential differential bias to avoid the misinterpretation of intervention results. 381
Conclusions 382
At the pooled group level, the i-24-HR showed relatively good agreement to the WFR. However, there 383
was an apparent differential bias whereby the meandian intakes of energy and some nutrients were 384
under-estimated compared with the WFR in the control group but not in the intervention group. 385
Considering the cost and logistical implications of the WFR, the i-24-HR could be used in its place, for 386
estimating meandian intakes, but careful attention should be made during the design stage to the 387
objectives of the study and whether only measures of absolute intakes or overall between-group 388
Formatted: Not Highlight
Formatted: Not Highlight
Page 43 of 58
Cambridge University Press
British Journal of Nutrition

For Review Only
15
differences are required. Absolute intakes might be under-estimated, if the i-24-HR is used to estimate 389
dietary energy intakes of 9-10-month-old infants who are not consuming an energy dense supplement, 390
such as LNS. Future interventions evaluating differential dietary exposures (such as LNS) should 391
consider, when comparing groups, whether a systematic error in intervention food measurement 392
introduced a differential bias. When designing the study, they should put effort into developing an 393
accurate method of quantifying intervention food consumption;, and where possible, evaluate it in a 394
pilot study before commencing data collection. For researchers aiming to examine associations 395
between dietary intakes and functional outcomes, such as growth, if resources permit, they should 396
include a dietary assessment validation study, preferably with a biomarker reference method (or using a 397
gold-standard reference method) to understand the dietary assessment method’s measurement error 398
structure and to help avoid misinterpretation of dietary intakes in relation to final growth outcomes. 399
Acknowledgements 400
We are grateful for the skilled and dedicated efforts of the data collection team: Mayamiko Banda, 401
Hamsa Banda, Zikomo Chipatso, Reuben Mbwana, Tony Kansilanga, Mike Njaya, and Yacinta Stima. 402
We are thankful to Jimmy Ngwaya who carefully prepared the food models which formed the basis of 403
the data collection tools. A special thank you to Kathryn Dewey and Per Ashorn for their guidance and 404
leadership in developing the protocol for this study, and expert advice throughout the study 405
implementation and analysis. We are grateful for the vision, wisdom and professional guidance of the 406
whole iLiNS study Steering Committee (http://ilins.org/about-ilins/who-we-are/ilins-steering-407
committee). 408
Author contributions 409
J.H, C.K., K.M., U.A., M.A., & E.L.F designed the research and significantly contributed to the aim 410
and structure of manuscript; J.H. & C.K. conducted the research; A.M.R. & R.K. provided statistical 411
guidance and assistance with methods; J.H, R.K. & E.L.F analysed data and performed statistical 412
analyses; J.H drafted the paper with inputs from R.K. & E.L.F; J.H., R.K. & E.L.F had primary 413
responsibility for the final content. R.K. & E.L.F have equal contribution to senior authorship. All 414
authors have read and approved the final manuscript. 415
Formatted: Not Highlight
Formatted: Not Highlight
Formatted: Not Highlight
Formatted: Not Highlight
Formatted: Not Highlight
Formatted: Not Highlight
Formatted: Not Highlight
Formatted: Not Highlight
Page 44 of 58
Cambridge University Press
British Journal of Nutrition

For Review Only
16
References
1. Black RE, Victora CG, Walker SP, Bhutta ZA, Christian P, de Onis M, et al. Maternal and child
undernutrition and overweight in low-income and middle-income countries. Lancet.
2013;382(9890):427-51.
2. Arimond M, Zeilani M, Jungjohann S, Brown KH, Ashorn P, Allen LH, et al. Considerations in
developing lipid-based nutrient supplements for prevention of undernutrition: experience from the
International Lipid-Based Nutrient Supplements (iLiNS) Project. Matern Child Nutr. 2013.
3. Maleta KM, Phuka J, Alho L, Cheung YB, Dewey KG, Ashorn U, et al. Provision of 10-40 g/d
Lipid-Based Nutrient Supplements from 6 to 18 Months of Age Does Not Prevent Linear Growth
Faltering in Malawi. J Nutr. 2015.
4. Iannotti LL, Dulience SJ, Green J, Joseph S, Francois J, Antenor ML, et al. Linear growth
increased in young children in an urban slum of Haiti: a randomized controlled trial of a lipid-based
nutrient supplement. Am J Clin Nutr. 2014;99(1):198-208.
5. Dewey KG, Mridha MK, Matias SL, Arnold CD, Cummins JR, Khan MS, et al. Lipid-based
nutrient supplementation in the first 1000 d improves child growth in Bangladesh: a cluster-randomized
effectiveness trial. Am J Clin Nutr. 2017;105(4):944-57.
6. Haisma H, Coward WA, Albernaz E, Barros A, Victora CG, Wright A, et al. 2H2O turnover
method as a means to detect bias in estimations of intake of nonbreast milk liquids in breast-fed infants.
Eur J Clin Nutr. 2005;59(1):93-100.
7. Gibson RS, Ferguson EL. An interactive 24-hour recall for assessing the adequacy of iron and
zinc intakes in developing countries. HarvestPlus Technical Monograph2008. p. pp 160.
8. Gibson RS. Principles of nutritional assessment. New York: Oxford University Press; 2005.
9. Ferguson EL, Gadowsky SL, Huddle JM, Cullinan TR, Lehrfeld J, Gibson RS. An interactive
24-h recall technique for assessing the adequacy of trace mineral intakes of rural Malawian women; its
advantages and limitations. Eur J Clin Nutr. 1995;49(8):565-78.
10. Thakwalakwa CM, Kuusipalo HM, Maleta KM, Phuka JC, Ashorn P, Cheung YB. The validity
of a structured interactive 24-hour recall in estimating energy and nutrient intakes in 15-month-old
rural Malawian children. Matern Child Nutr. 2012;8(3):380-9.
11. Ferguson EL, Gibson RS, Opare-Obisaw C. The relative validity of the repeated 24 h recall for
estimating energy and selected nutrient intakes of rural Ghanaian children. Eur J Clin Nutr.
1994;48(4):241-52.
12. Fisher JO, Butte NF, Mendoza PM, Wilson TA, Hodges EA, Reidy KC, et al. Overestimation
of infant and toddler energy intake by 24-h recall compared with weighed food records. Am J Clin
Nutr. 2008;88(2):407-15.
13. Persson LA, Carlgren G. Measuring children's diets: evaluation of dietary assessment
techniques in infancy and childhood. Int J Epidemiol. 1984;13(4):506-17.
Page 45 of 58
Cambridge University Press
British Journal of Nutrition

For Review Only
17
14. Olinto MT, Victora CG, Barros FC, Gigante DP. Twenty-four-hour recall overestimates the
dietary intake of malnourished children. J Nutr. 1995;125(4):880-4.
15. Piwoz EG, Creed de Kanashiro H, Lopez de Romana G, Black RE, Brown KH. Within- and
between-individual variation in energy intakes by low-income Peruvian infants. Eur J Clin Nutr.
1994;48(5):333-40.
16. Bornhorst C, Huybrechts I, Ahrens W, Eiben G, Michels N, Pala V, et al. Prevalence and
determinants of misreporting among European children in proxy-reported 24 h dietary recalls. Br J
Nutr. 2013;109(7):1257-65.
17. Piwoz EG, Creed de Kanashiro H, Lopez de Romana G, Black RE, Brown KH. Potential for
misclassification of infants' usual feeding practices using 24-hour dietary assessment methods. J Nutr.
1995;125(1):57-65.
18. Kipnis V, Freedman LS. Impact of exposure measurement error in nutritional epidemiology. J
Natl Cancer Inst. 2008;100(23):1658-9.
19. Willett W. Nutritional Epidemiology, Third Edition. New York, New York, USA.: Oxford
University Press; 2013.
20. Keogh RH, Carroll RJ, Tooze JA, Kirkpatrick SI, Freedman LS. Statistical issues related to
dietary intake as the response variable in intervention trials. Stat Med. 2016;35(25):4493-508.
21. Hemsworth J, Kumwenda C, Arimond M, Maleta K, Phuka J, Rehman AM, et al. Lipid-Based
Nutrient Supplements Increase Energy and Macronutrient Intakes from Complementary Food among
Malawian Infants. J Nutr. 2016;146(2):326-34.
22. Smith AF, Domel Baxter S, Hardin JW, Nichols MD. Conventional analyses of data from
dietary validation studies may misestimate reporting accuracy: illustration from a study of the effect of
interview modality on children's reporting accuracy. Public Health Nutr. 2007;10(11):1247-56.
23. Dop MC, Milan C, Milan C, N'Diaye AM. The 24-hour recall for Senegalese weanlings: a
validation exercise. Eur J Clin Nutr. 1994;48(9):643-53.
24. Dop MC, Milan C, Milan C, N'Diaye AM. Use of the multiple-day weighed record for
Senegalese children during the weaning period: a case of the "instrument effect". Am J Clin Nutr.
1994;59(1 Suppl):266S-8S.
25. Keogh RH, White IR, Rodwell SA. Using surrogate biomarkers to improve measurement error
models in nutritional epidemiology. Stat Med. 2013.
26. Kipnis V, Midthune D, Freedman L, Bingham S, Day NE, Riboli E, et al. Bias in dietary-report
instruments and its implications for nutritional epidemiology. Public Health Nutr. 2002;5(6A):915-23.
27. Moore SE, Prentice AM, Coward WA, Wright A, Frongillo EA, Fulford AJ, et al. Use of stable-
isotope techniques to validate infant feeding practices reported by Bangladeshi women receiving
breastfeeding counseling. Am J Clin Nutr. 2007;85(4):1075-82.
Page 46 of 58
Cambridge University Press
British Journal of Nutrition

For Review Only
18
28. Victora CG, de Onis M, Hallal PC, Blossner M, Shrimpton R. Worldwide timing of growth
faltering: revisiting implications for interventions. Pediatrics. 2010;125(3):e473-80.
Page 47 of 58
Cambridge University Press
British Journal of Nutrition

For Review Only
19
Table 1 Characteristics of participants at enrolment into the main study (at 6 months of
age)
Control Intervention p-value
Participants (n) 26 106
Female n (%) 14 (54) 49 (47) 0.50a
Socio-demographic Background
Characteristics (n) 24 105
Maternal age; mean (SD) years 28.8 (7.3) 26.6 (5.9) 0.12b
Maternal Education; mean (SD) years 3.9 (3.4) 4.4 (3.6) 0.52b
Female-headed household n (%) 2 (8.3) 12 (11.9) 0.78a
More than one child under 5 years old in
household n (%) 11 (45.8) 44 (41.9)
0.06a
Maternal occupation n (%)
Farming/Fishing
17 (77.3)
66 (66.0)
0.64a
House wife 3 (16.6) 27 (27.0)
Indoor / office work 1 (4.6) 3 (3.0)
Other 1 (4.6) 3 (3.0)
Unknown 0 (0) 1 (1)
Information collected during time of visit (n) 26 106
Season (rainy: October - March) n (%) 12 (46.1) 56 (52.8) 0.80a
Infant Breastfeeding n (%) 25 (100)c
104 (98.1) 0.49a
a Chi-square
b Two-sample t-test
c n=25 breastfed, n=1 missing value in this
control group
Formatted: Superscript
Page 48 of 58
Cambridge University Press
British Journal of Nutrition

For Review Only
20
Table 2: Estimated intakes of energy and selected nutrients (Mean and 95 % Confidence Interval)a using the i-24-HR compared
to WFR between the hours of 06:00 and 18:00 by intervention group and pooled group
Control Group (n=26) Intervention Group- LNS (n=106) Pooled Group (n=132)
Nutrient WFR i-24-HR
Recall
Abs.
Diffb
p-
valuec
WFR
i-24-
HR
Recall
Abs
Diffb
p-
valuec
p-
valued
WFR i-24-HR
Recall
Abs
Diffb
p-
valuec
Energy
(kcal/d)
376
(317,
437)
293
(246,
345)
-88
0.010
388
(352,
424)
379
(346,
412)
-10
0.60
0.052 385
(355, 416)
361
(333,
390)
-25
0.09
Protein
(g/d)
9.6 (7.7,
11.6)
7.1
(5.8, 8.4)
-2.9
0.009
9.4 (8.4,
10.5)
8.2 (7.3,
9.0)
-1.6
0.007
0.36 9.5
(8.5, 10.4)
8.0
(7.3, 8.6)
-1.8
<0.001
Fat (g/d) 7.3
(5.3, 9.8)
5.3
(4.0, 6.8)
-2.8
0.05
10.0
(8.7, 11.5)
10.4
(9.1, 11.7)
0.1
0.62
0.10 9.6
(8.3, 10.7)
9.2
(8.2, 10.4)
-0.4
0.65
Iron (mg/d) 2.6
(2.1, 3.2)
1.8
(1.4, 2.2)
-0.1
<0.00
1
3.7
(3.3,
4.2)
4.0
(3.4,
4.5)
0.3
0.25
0.020 3.5
(3.1, 3.9)
3.5
(3.0, 3.9)
0.03
0.68
Zinc (mg/d) 1.6
(1.2, 1.9)
1.1
(0.9, 1.4)
-0.5
<0.00
1
3.3 (2.8,
3.8)
3.8 (3.1,
4.4)
0.6
0.020
0.07 2.9
(2.5, 3.3)
3.1
(2.6, 3.7)
0.4
0.18
Calcium
(mg/d)
38
(25, 54)
53
(33, 77)
21.6
0.20
94
(77,
113)
128
(107,
152)
38.3
<0.001
0.41 81
(68, 96)
111
(93, 130)
35.1
<0.001
Vitamin A
(µg RAE/d)
39
(18, 67)
24
(9, 46)
-
18.8
0.19
143
(113,
176)
164
(130,
202)
24.1
0.10
0.23 117
(93, 144)
125
(99, 156)
15.9
0.37
a Data back-transformed from square root transformation for presentation
b Absolute mean difference
- i-24HR Recall – WFR
c Matched pairs T-test d Two-group t-test with equal variances between intervention and control group absolute differences
Page 49 of 58
Cambridge University Press
British Journal of Nutrition

For Review Only
21
i-24-HR: interactive 24-hour recall, LNS: Lipid-based nutrient supplement, RAE: retinol activity equivalents, WFR: weighed food record
Page 50 of 58
Cambridge University Press
British Journal of Nutrition

For Review Only
22
Table 3: Percentage agreement for matching foods (items appearing both on the i-24-HR and the WFR)
between intervention groups
Median (25th, 75
th percentile)
Control Group (n=25) Intervention Group (n=106)
na,e Percentage
Agreementb n Percentage Agreement
b p-valuec
Phala, all types (full volume) 25 100.0 (78.5, 122.4) 99 87.5 (68.1, 118.6) 0.457
Nsima, Rice (full volume) 25 78.4 (61.7, 100.0) 98 95.4 (59.5, 141.5) 0.248
Added Sugar 14 141.5 (103.7, 250.0) 69 167.7 (111.2, 295.0) 0.776
Sweetened Snacks 5 61.4 (50.7, 166.0) 45 112.7 (61.1, 195.0) 0.258
Savoury Snacks 8 105.9 (84.6, 137.5) 18 100.0 (56.7, 175.0) 0.683
Meat, Fish and Egg (solid) 7 82.7 (62.9, 294.9) 26 107.8 (62.7, 151.9) 0.735
Legumes, Nuts, Seeds 8 36.1 (26.4, 76.6) 26 76.2 (37.5, 105.3) 0.680
Fruit 4 160.0 (88.1, 231.7) 27 94.0 (66.2, 140.0) --
Starchy Root and Vegetables 2 29.2 (22.1, 36.3) 20 80.8 (48.2, 145) --
Milk and Yogurt 3 90.2 (90.0, 103.7) 8 111.0 (53.0, 228.6) --
Non-dairy beverages 5 115.3 (85.6, 173.7) 15 100.0 (66.8, 142.2) --
Soup/Broth from Relish 14 239.0 (195.3, 308.3) 54 134.0 (85.7, 240.0) 0.038
LNS - 65 154.0 (98.8, 298.3)d -- a Includes all portion sizes from items that match between the reported and reference values at the same time (i.e.: meal
or snack time) b Report percentage = (Reported amount / reference amount) x 100
Reference amount observed during the weighed food record; Reported amount taken from the 24-hour dietary recall. c Mann-Whitney two-sample rank sum test by food group
d LNS only present in the diets of the intervention group, which is why there is no between-group comparison. This is descriptive
only, looking at the percentage agreement of LNS in the intervention group. e One participant missing in the control group for these analyses
i-24-HR: interactive 24-hour recall, LNS: Lipid-based nutrient supplement, WFR: weighed food record
Formatted: Space After: 0 pt, Line spacing:
single
Formatted: Font: Not Bold, Superscript
Formatted: Font: Not Bold
Page 51 of 58
Cambridge University Press
British Journal of Nutrition

For Review Only
23
Table 4: Number of eating episodes and percentages of matching food groups (items appearing both in the i-24-HR and the
WFR), intrusions and omissions by intervention groups
Control Group (n=25d) Intervention Group (n=106)
n (%) n (%)
matching a intrusion
b omission
c
matching amatching
intrusion bintrusion
omission comission
Phala, all types (full volume) 49 (92.5) 0 (0) 4 (7.6) 166 (94.3) 2 (1.1) 8 (4.6)
Nsima, Rice (full volume) 30 (88.2) 3 (8.8) 1 (2.9) 150 (89.8) 9 (5.4) 8 (4.8)
Added Sugar 22 (73.3) 5 (16.7) 3 (6.7) 105 (68.6) 26 (17.0) 22 (14.4)
Sweetened Snacks 6 (50.0) 2 (16.7) 4 (33.3) 59 (68.6) 15 (17.4) 12 (14.0)
Savoury Snacks 10 (76.9) 2 (15.6) 1 (7.7) 23 (69.7) 5 (15.2) 5 (15.2)
Meat, Fish and Egg (solid) 8 (53.3) 0 (0) 7 (46.7) 34 (56.7) 7 (11.7) 20 (32.8)
Legumes, Nuts, Seeds 13 (76.5) 1 (5.9) 3 (17.6) 39 (68.4) 4 (7.0) 14 (24.6)
Fruit 4 (66.7) 1 (16.7) 1 (16.7) 34 (70.8) 8 (16.7) 6 (12.5)
Starchy Root and Vegetables 2 (40.0) 0 (0) 3 (60.0) 22 (71.0) 4 (12.9) 5 (16.1)
Milk and Yogurt 3 (100) 0(0) 0 (0) 8 (47.1) 6 (35.3) 3 (17.6)
Non-dairy beverages 6 (75.0) 2 (25.0) 0 (0) 20 (62.5) 7 (21.9) 5 (15.6)
Soup/Broth from Relish 18 (62.1) 8 (27.6) 3 (10.3) 68 (64.7) 30 (28.6) 7 (6.7)
LNS - -- 101 (89.4) 7 (6.2) 5 (4.4) a The total of portions that were matched between the reference (WFR) and reported (i-24-HR), as a percentage of all items in the
same group b The total of portions that were reported (i-24-HR) but not observed in the reference data (WFR) c The total of portions that were observed in the reference data (WFR), but not reported (i-24-HR) d
One participant missing for these analyses
i-24-HR: interactive 24-hour recall, LNS: Lipid-based nutrient supplement, WFR: weighed food record
Formatted: Superscript
Formatted: Normal, Left, Don't keep with next
Formatted: Font: 11 pt, Bold
Page 52 of 58
Cambridge University Press
British Journal of Nutrition

For Review Only
24
Online supplement Table 1: Average reported (i-24-HR) and reference (WFR) portion sizes by food group
Median (25th, 75th Percentiles)
n a
Reported amount (g)b Reference Amount (g)
c
Percentage
agreementd P-value
e
Phala, all types (full volume) 125 78.9 (48.5, 112.0) 99.0 (64.7, 136.0) 86.4 (66.1, 114.1) <0.001
Nsima, Rice (full volume) 124 52.5 (29.1, 80.0) 56.8 (33.5, 89.8) 89.1 (56.6, 135.0) 0.028
Added Sugar 94 5.1 (3.6, 7.9) 3.0 (1.9, 5.5) 143.3 (99.2, 238.9) <0.001
Sweetened Snacks 64 7.9 (4.1, 15.8) 9.0 (4.0, 15.5) 91.7 (38.0, 158.0) 0.64
Savoury Snacks 34 7.7 (3.5, 11.0) 6.0 (3.0, 10.0) 86.1 (51.9, 157.1) 0.59
Meat, Fish and Egg (solid) 57 6.0 (0, 12.4) 9.2 (4.9, 18.2) 59.7 (0, 110.7) 0.015
Legumes, Nuts, Seeds 50 2.4 (0.4, 5.8) 7.8 (3.9, 16.0) 37.5 (2.4, 83.8) <0.001
Fruit 38 22.5 (10.0, 35.0) 17.0 (6.0, 32.5) 94.0 (52.0, 136.4) 0.64
Starchy Root and Vegetables 30 18.0 (7.0, 24.0) 15.5 (6.0, 43.0) 50.0 (19.4, 120.0) 0.12
Milk and Yogurt 15 11.8 (5.2, 41.0) 8.0 (1.0, 29.0) 90.1 (36.8, 183.2) 0.82
Non-dairy beverages 33 47.3 (27.5, 76.1) 27.7 (9.0, 86.3) 98.1 (43.8, 123.5) 0.28
Soup/Broth from Relish 94 17.0 (11.7, 26.0) 7.4 (0, 16.9) 138.5 (80.0, 243.1) <0.001
LNS 68 8.1 (4.5, 11.8) 4.5 (2.0, 9.0) 148.7 (95.0, 274.0) <0.001 a Refers to the number of participantsrespondents where this food group was present on the WFR, i-24-HR, or both. This includes the
average portion size estimation per food group per participant. In the case where one was an intrusion, this resulted in a reference
value of zero, and in the case where there is an omission, this resulted in a reported amount of zero. This is the participantrespondent
average per food group.
b median daily average per participant of reported amount derived from i-24-HR c median daily average per participant of reference amount derived from WFR d Percentage agreement: (Reported amount / reference amount) x 100
e p-value derived from Wilcoxon signed-rank test for matched pairs
i-24-HR: interactive 24-hour recall, LNS: Lipid-based nutrient supplement, WFR: weighed food record
Page 53 of 58
Cambridge University Press
British Journal of Nutrition

For Review Only
25
Online supplement Table 2: Comparison of i-24-HRs that corresponded to and were independent of the WFR. An Assessment of
bias in reporting related to the presence of the WFR: the “instrument effect”.
N=71
Median Intake (25th,75
th percentile)
Nutrient
Independent 24-HR Recall i24-HR WFR
Absolute
Differencea
p-valueb
Energy (kcal/d) 375 (273, 553) 327 (246, 463) -34 0.10
Protein (g/d) 8.8 (5.8, 12.5) 7.6 (5.0, 10.3) -0.78 0.06
Fat (g/d) 9.8 (5.0, 15.4) 8.1 (4.2, 11.8) -1.9 0.06
Fe (mg/d) 3.2 (1.9, 5.8) 2.6 (1.7, 5.3) -0.2 0.50
Zn (mg/d) 2.2 (1.2, 5.9) 2.0 (1.2, 6.1) -0.1 0.97
Ca (mg/d) 115.9 (41.5, 204.3) 104.9 (34.7, 208.5) -1.1 0.48
Vitamin A (µg RAE/d) 122.9 (30.3, 262.9) 107.9 (20.5, 292.9) 0 0.79 a i-24HR WFR – Independent 24-HR b Wilcoxon signed rank matched-pairs test
Page 54 of 58
Cambridge University Press
British Journal of Nutrition

For Review Only
26
Figure 1: Consort Flow Diagram of Participant Enrolment and Inclusion in the Validation Sub-Study
Page 55 of 58
Cambridge University Press
British Journal of Nutrition

For Review Only
27
Online supplement Figure 1: Bland Altman Plot Showing Relative Agreement in energy
(kcal/day) estimation between WFR and i-24-HR: Pooled Group
Page 56 of 58
Cambridge University Press
British Journal of Nutrition

For Review Only
28
Online Figure 2a: Bland Altman Plot Showing Relative Agreement in Energy (kcal)
estimation between WFR and i-24-HR: Control Group
Page 57 of 58
Cambridge University Press
British Journal of Nutrition

For Review Only
29
Online supplement Figure 2b: Bland Altman Plot Showing Relative Agreement in Energy
(kcal) estimation between WFR and i-24-HR: Intervention Group
Page 58 of 58
Cambridge University Press
British Journal of Nutrition