comparison of bone-implant contact and bone-implant...
TRANSCRIPT

237 www.ecmjournal.org
R Bernhardt et al. Comp arison of histological sections with CT slicesEuropean Cells and Materials Vol. 23 2012 (pages 237-248) DOI: 10.22203/eCM.v023a18 ISSN 1473-2262
Abstract
Histological imaging is still considered the gold standard for analysing bone formation around metallic implants. Generally, a limited number of histological sections per sample are used for the approximation of mean values of peri-implant bone formation. In this study we compared statistically the results of bone-implant contact (BIC) and bone-implant volume (BIV) obtained by histological sections, with those obtained by X-ray absorption images from synchrotron radiation micro-computed tomography (SRμCT) using osseointegrated screw-shaped implants from a mini-pig study. Comparing the BIC results of 3-4 histological sections per implant sample with the appropriate 3-4 SRμCT slices showed a non-signifi cant difference of 1.9 % (p = 0.703). The contact area assessed by the whole 3D information from the SRμCT measurement in comparison to the histomorphometric results showed a non-signifi cant difference in BIC of 4.9 % (p = 0.171). The amount of the bone-implant volume in the histological sections and the appropriate SRμCT slices showed a non-signifi cant difference by only 1.4 % (p = 0.736) and also remains non-signifi cant with 2.6 % (p = 0.323) using the volumetric SRμCT information. We conclude that for a clinical evaluation of implant osseointegration with histological imaging at least 3-4 sections per sample are suffi cient to represent the BIC or BIV for a sample. Due to the fact that in this study we have found a signifi cant intra-sample variation in BIC of up to ± 35 % the selection of only one or two histological sections per sample may strongly infl uence the determined BIC.
Keywords: Bone formation, metallic implants, imaging, histology.
*Address for correspondence:Dr Ricardo BernhardtMax-Bergmann-Center for BiomaterialsTechnische Universität DresdenBudapester Str. 2701062 Dresden, Germany
Telephone Number: +49 351 46339388FAX Number: +49 351 46339401
E-mail: [email protected]
Introduction
The aim of this study was to investigate the use of synchrotron radiation micro-computed tomography (SRμCT) as a means of assessing osseointegration and bone formation around implants. The observation of a direct bone-implant contact after a defi ned healing period, without interposed fi brous tissue, was fi rst reported by Branemark (1983) and described as osseointegration. The defi nition of the term osseointegration was clarifi ed by Albrektsson et al. (1981) as the direct contact between a loaded implant surface and bone at a microscopic level. To analyse undecalcifi ed sections of bone and teeth, Donath and Breuner (1982) developed a method which was also applicable for implants. A sawing and grinding technique enabled the preparation of thin bone/implant sections. These are mostly examined after staining at a thickness of 20-30 μm. This method serves as the basis for the assessment of bone-implant contact. Microscopically, a high degree of bony contact along several implant threads provided illustrated evidence of an implant anchored in bone (Albrektsson and Jacobsson, 1987). Although the assessment of the bone-implant contact was also possible with techniques like electron microscopy (Linder et al., 1983; Oyonarte et al., 2005), the histomorphometric evaluation of the bone-implant contact (BIC) was established as the most common method and was applied in the majority of subsequent studies. After implant placement, primary implant stability is achieved by passive mechanical fi xation within the host bone. Subsequent steps of bone resorption and new bone formation enable secondary implant stability through osseointegration. The attainment of osseointegration and secondary implant stability are essential to successful implant treatment (Sennerby et al., 2001). It is the BIC that is essential in creating secondary implant stability. This BIC is usually studied by means of histomorphometry (Johansson et al., 1990). Greater bone contact is generally believed to result in a better implant stability (Park et al., 2005). However, there is uncertainty whether the analysed histological sections represent the entire osseous situation. Histomorphometry is a destructive method. This limits the analysis to approximately three to four histological sections along the implant length axis, per implant. Micro-computed tomography – a non-destructive technique – uses the absorption of X-rays in order to detect density differences inside solid matter. Due to the fact that this tomography is not a direct imaging technique, the resulting three-dimensional information is generated from a mathematical reconstruction procedure of absorption
COMPARISON OF BONE-IMPLANT CONTACT AND BONE-IMPLANT VOLUME BETWEEN 2D-HISTOLOGICAL SECTIONS AND 3D-SRμCT SLICES
Ricardo Bernhardt1*, Eberhard Kuhlisch2, Matthias C. Schulz3, Uwe Eckelt3 and Bernd Stadlinger4
1Max-Bergmann-Center for Biomaterials, Technische Universität Dresden, Dresden, Germany2Institute for Medical Informatics and Biometry, Technische Universität Dresden, Germany
3Department of Oral & Maxillofacial Surgery, Technische Universität Dresden, Dresden, Germany4Department of Cranio-Maxillofacial and Oral Surgery, University of Zurich, Zurich, Switzerland

238 www.ecmjournal.org
R Bernhardt et al. Comp arison of histological sections with CT slices
radiograms from different sample angles. The quality of the representation of the BIC, as well as the bone-implant volume (BIV), mainly depends on the quality of absorption radiograms and is directly associated with X-ray quality. Limitations of desktop μCT systems for the investigation of the BIC around metal implants are mainly related to metal-induced artifacts. In a recent μCT study the BIC around titanium wires in rat tibia was correlated to fi ndings of backscattered electron microscopy (Liu et al., 2012). In relation to metal-induced artifacts, the authors found for μCT analysis an exclusion zone of 48 μm from the implant surface, which prevents any suffi cient BIC investigation. In this study we used X-ray photons from the Synchrotron Source BESSY II (Berlin, Germany) for micro-computed tomography. The strength of SRμCT in contrast to desktop μCT systems is the possibility to use monoenergetic X-rays with high intensity in order to eliminate metal-induced artifacts at the implant surface. Obtaining histomorphometric information from the histological sections, and the three-dimensional information from the tomograms of the same implant/bone samples enabled us to consider two questions: (i) Are different results obtained for BIC and BIV when comparing 3-4 histological sections (representing one implant/bone sample) to the identical 3-4 virtual slices created by SRμCT volume? (ii) If these results are similar, are differences found in BIC and BIV when comparing the entire data volume from SRμCT to the 3-4 histological sections?
Materials and Methods
Study designThreaded titanium implants (Fig. 1a) with a diameter of 4.5 mm and a length of 9.5 mm were employed. These experimental implants were based on a Xive® (Friadent, Dentsply, Germany) implant. The implant geometry featured a cavity along the implant length axis in order to create a defi ned area between the implant surface and the round drill hole. This cavity was designed with a defi ned width of 1.50 mm and a depth of 0.35 mm. The titanium implants were sandblasted with 250 μm corundum, cleaned
with isopropanol, rinsed with distilled water, air dried and acid-etched. From a minipig study evaluating the submerged healing of dental implants in the maxilla (Stadlinger et al., 2011), six implant/host bone samples were randomly selected from different animals after a two-month healing period. The study protocol was approved by the commission for animal studies at the District Government Offi ce, Dresden, Germany. After sacrifi ce, maxillary en bloc resections were obtained for analysis. The samples were fi xed in formaldehyde and dehydrated in a graded series of ethanol. Next, the implants with surrounding bone were embedded in methylmethacrylate (Technovit 9100 neu®, Heraeus Kulzer, Wehrheim, Germany), containing the implant nearly centred within the bony tissue.
Synchrotron microcomputed tomographyIn order to perform tomographic measurements, the samples containing the implants were prepared in cylindrical shape with a diameter of about 8 mm. For the non-destructive analysis of newly formed bone within the implant cavity and in close proximity to the implant surface, a SRμCT source at the Berliner Elektronensynchrotron (BESSY II, Berlin, Germany) was used. With monochromatic X-ray energy of 50 keV, 1500 radiograms within a 180° sample rotation were obtained. The reconstruction of the radiograms was performed with a fi ltered back-projection algorithm for parallel beam. The resolution of the resulting absorption information was 3.58 μm in all three dimensions. The six implants so analysed were then used for the histologic and histomorphometric analysis.
HistologyUndecalcifi ed 100 m thick sections along the length axis of all implants were cut in a parallel direction using a diamond saw microsectioning system (Exakt-Apparatebau, Norderstedt, Germany). For all samples, 3-4 sections were prepared with a cutting distance of about 600 μm. Only sections representing the implant at full length were included in the analysis. These sections were reduced to 30 m thickness using grinding techniques on a roll grinder containing sandpaper (Exakt-Apparatebau). Subsequently,
Fig. 1. (a) Experimental titanium implants with cavities after 8 weeks of healing in the upper jaw bone of minipigs. (b) Regions of interest for the evaluation of newly formed bone (BIC: bone-implant contact, BIV: bone-implant volume).

239 www.ecmjournal.org
R Bernhardt et al. Comp arison of histological sections with CT slices
Masson-Goldner staining was performed. This staining allowed a clear differentiation of mineralised bone, non-mineralised osteoid and soft tissues. Next, the sections were imaged and analysed using light microscopy (Olympus BX 61, Hamburg, Germany) connected to a computerised system for histomorphometry (Analysis, Soft Imaging Systems, Münster, Germany).
HistomorphometryPlacing a border at the outer implant surface defi ned an area within the cavity which served as a region of interest (ROI) for further measurements. The amount of BIC along to the implant length axis within the ROI was measured for every histological section and for two independent lines per section. (Fig. 1b,) Mean values were calculated for each implant. Next, the amount of bone within the ROI was assessed by calculating the percentage of surface area inside the ROI occupied by bone (Fig. 1b, green). Due to the fact that 3-4 histological sections per implant were evaluated, this area is referred to as BIV. Two cavity areas for each slice were independently analysed.
Analysis procedures for 3D volumes from SRμCTThreshold of bone values from CT imagesIn order to fi nd an appropriate threshold for mineralised bone in the CT volume, the selection was made in best visual agreement with the histological information using identical slices. In the resulting 8-bit grey-level CT images this threshold was set between all absorption values for mineralised bone.
Rotation of SRμCT-volume to the histological slice orientationFor the comparison of identical morphological information between histological images and X-ray absorption data, the histologic slice orientation had to be matched in the SRμCT volume. The 3D visualisation software (VG Studio MAX 1.2, Volume Graphics, Heidelberg, Germany) was applied in order to rotate the SRμCT volume for each sample in the x- and y-axis to determine the best matching orientation to the corresponding histological section. Next, the entire SRμCT-volume was rearranged according to the detected spatial angles. A z-axis scan through the newly orientated SRμCT-volume was performed for each sample in order to determine the exact position of the other histological sections of the same implant. The BIV for each cavity per SRμCT slice was calculated in accordance to the histomorphometric assessment. This was measured by dividing the amount of threshold pixels representing bone inside the cavity by the cavity area (Fig. 1b, green area). Due to the partial volume effect (PVE) from the CT measurement and the pixel interpolation during arbitrary image rotation, a distance of 18 μm from the implant surface was defi ned as the position to obtain values for BIC in the oriented SRμCT slices. As there is no straight line or boundary for the assessment of the bone-implant interface in SRμCT-slices, the virtual position of the interface was set within the implant adjacent to the rough implant surface. For the BIC measurement this line was shifted 5 pixels (18 μm) towards the peri-implant tissues. The histological BIC was measured along a line on the
Histo CT-2D CT-3Dsample [mean ± SD] [mean ± SD] [mean ± SD]
1 88.97 ± 18.37 85.69 ± 15.08 84.70 ± 17.72
2 70.56 ± 20.52 70.60 ± 18.86 78.66 ± 20.52
3 62.31 ± 17.28 62.52 ± 19.34 65.90 ± 17.52
4 87.57 ± 21.67 86.38 ± 18.40 69.29 ± 26.23
5 77.42 ± 35.54 72.37 ± 33.66 70.01 ± 25.78
6 84.37 ± 20.38 82.66 ± 23.22 73.84 ± 22.10
Mean: 78.42 ± 23.40 76.29 ± 22.61 73.74 ± 22.79
Table 1. Statistical analysis of the bone-implant contact (BIC [%]).
Table 2. Statistical analysis of the bone-implant volume (BIV [%]).
Histo CT-2D CT-3Dsample [mean ± SD] [mean ± SD] [mean ± SD]
1 41.63 ± 13.45 49.52 ± 15.72 47.17 ± 16.41
2 39.87 ± 9.19 43.55 ± 13.52 46.71 ± 15.07
3 54.84 ± 11.08 52.51 ± 9.69 56.80 ± 13.72
4 80.41 ± 11.26 81.20 ± 11.74 76.21 ± 9.34
5 60.24 ± 30.58 59.74 ± 27.32 61.83 ± 21.26
6 74.86 ± 21.30 74.59 ± 20.71 78.19 ± 16.16
Mean: 59.46 ± 22.84 60.87 ± 21.38 61.18 ± 20.15
240 www.ecmjournal.org
R Bernhardt et al. Comp arison of histological sections with CT slices
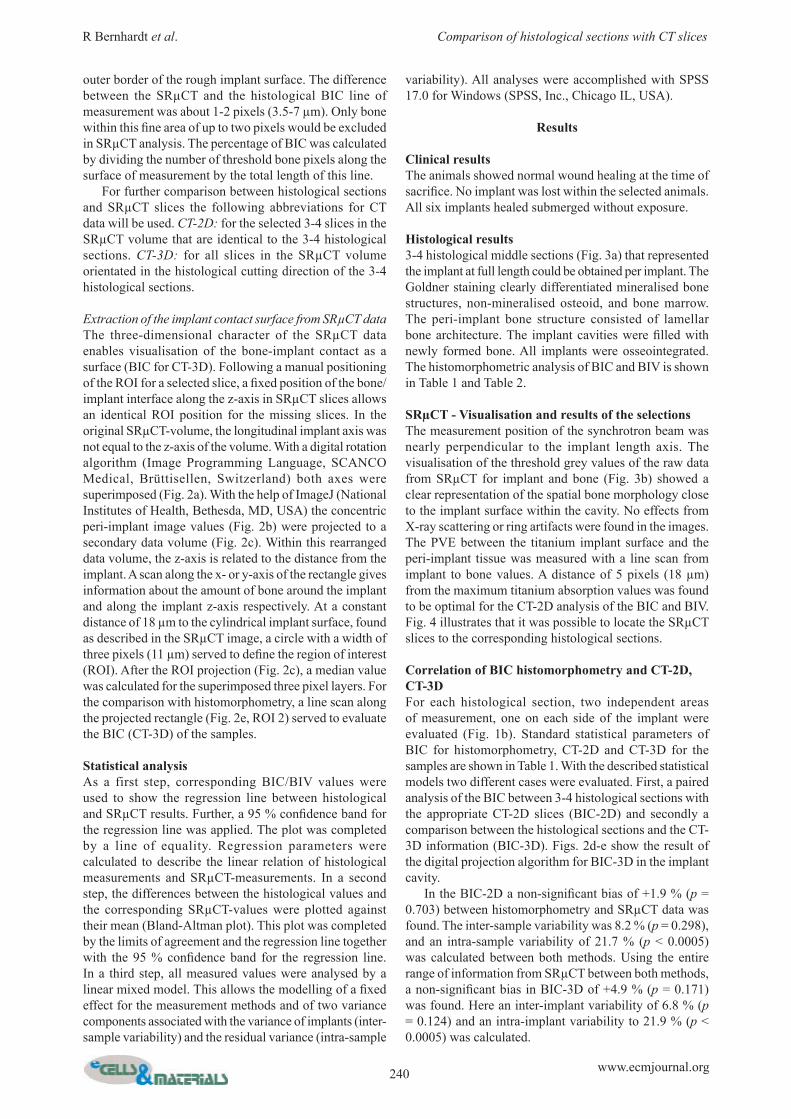
outer border of the rough implant surface. The difference between the SRμCT and the histological BIC line of measurement was about 1-2 pixels (3.5-7 μm). Only bone within this fi ne area of up to two pixels would be excluded in SRμCT analysis. The percentage of BIC was calculated by dividing the number of threshold bone pixels along the surface of measurement by the total length of this line. For further comparison between histological sections and SRμCT slices the following abbreviations for CT data will be used. CT-2D: for the selected 3-4 slices in the SRμCT volume that are identical to the 3-4 histological sections. CT-3D: for all slices in the SRμCT volume orientated in the histological cutting direction of the 3-4 histological sections.
Extraction of the implant contact surface from SRμCT dataThe three-dimensional character of the SRμCT data enables visualisation of the bone-implant contact as a surface (BIC for CT-3D). Following a manual positioning of the ROI for a selected slice, a fi xed position of the bone/implant interface along the z-axis in SRμCT slices allows an identical ROI position for the missing slices. In the original SRμCT-volume, the longitudinal implant axis was not equal to the z-axis of the volume. With a digital rotation algorithm (Image Programming Language, SCANCO Medical, Brüttisellen, Switzerland) both axes were superimposed (Fig. 2a). With the help of ImageJ (National Institutes of Health, Bethesda, MD, USA) the concentric peri-implant image values (Fig. 2b) were projected to a secondary data volume (Fig. 2c). Within this rearranged data volume, the z-axis is related to the distance from the implant. A scan along the x- or y-axis of the rectangle gives information about the amount of bone around the implant and along the implant z-axis respectively. At a constant distance of 18 μm to the cylindrical implant surface, found as described in the SRμCT image, a circle with a width of three pixels (11 μm) served to defi ne the region of interest (ROI). After the ROI projection (Fig. 2c), a median value was calculated for the superimposed three pixel layers. For the comparison with histomorphometry, a line scan along the projected rectangle (Fig. 2e, ROI 2) served to evaluate the BIC (CT-3D) of the samples.
Statistical analysisAs a first step, corresponding BIC/BIV values were used to show the regression line between histological and SRμCT results. Further, a 95 % confi dence band for the regression line was applied. The plot was completed by a line of equality. Regression parameters were calculated to describe the linear relation of histological measurements and SRμCT-measurements. In a second step, the differences between the histological values and the corresponding SRμCT-values were plotted against their mean (Bland-Altman plot). This plot was completed by the limits of agreement and the regression line together with the 95 % confi dence band for the regression line. In a third step, all measured values were analysed by a linear mixed model. This allows the modelling of a fi xed effect for the measurement methods and of two variance components associated with the variance of implants (inter-sample variability) and the residual variance (intra-sample
variability). All analyses were accomplished with SPSS 17.0 for Windows (SPSS, Inc., Chicago IL, USA).
Results
Clinical resultsThe animals showed normal wound healing at the time of sacrifi ce. No implant was lost within the selected animals. All six implants healed submerged without exposure.
Histological results3-4 histological middle sections (Fig. 3a) that represented the implant at full length could be obtained per implant. The Goldner staining clearly differentiated mineralised bone structures, non-mineralised osteoid, and bone marrow. The peri-implant bone structure consisted of lamellar bone architecture. The implant cavities were fi lled with newly formed bone. All implants were osseointegrated. The histomorphometric analysis of BIC and BIV is shown in Table 1 and Table 2.
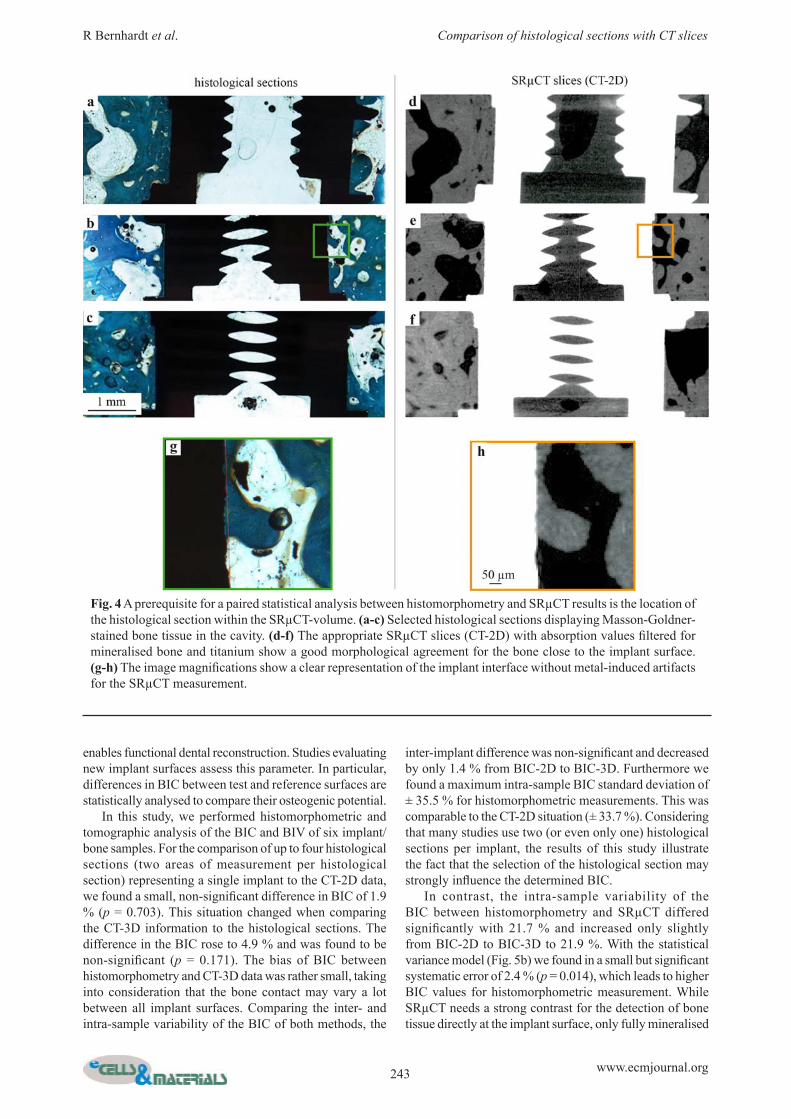
SRμCT - Visualisation and results of the selectionsThe measurement position of the synchrotron beam was nearly perpendicular to the implant length axis. The visualisation of the threshold grey values of the raw data from SRμCT for implant and bone (Fig. 3b) showed a clear representation of the spatial bone morphology close to the implant surface within the cavity. No effects from X-ray scattering or ring artifacts were found in the images. The PVE between the titanium implant surface and the peri-implant tissue was measured with a line scan from implant to bone values. A distance of 5 pixels (18 μm) from the maximum titanium absorption values was found to be optimal for the CT-2D analysis of the BIC and BIV. Fig. 4 illustrates that it was possible to locate the SRμCT slices to the corresponding histological sections.
Correlation of BIC histomorphometry and CT-2D, CT-3DFor each histological section, two independent areas of measurement, one on each side of the implant were evaluated (Fig. 1b). Standard statistical parameters of BIC for histomorphometry, CT-2D and CT-3D for the samples are shown in Table 1. With the described statistical models two different cases were evaluated. First, a paired analysis of the BIC between 3-4 histological sections with the appropriate CT-2D slices (BIC-2D) and secondly a comparison between the histological sections and the CT-3D information (BIC-3D). Figs. 2d-e show the result of the digital projection algorithm for BIC-3D in the implant cavity. In the BIC-2D a non-signifi cant bias of +1.9 % (p = 0.703) between histomorphometry and SRμCT data was found. The inter-sample variability was 8.2 % (p = 0.298), and an intra-sample variability of 21.7 % (p < 0.0005) was calculated between both methods. Using the entire range of information from SRμCT between both methods, a non-signifi cant bias in BIC-3D of +4.9 % (p = 0.171) was found. Here an inter-implant variability of 6.8 % (p = 0.124) and an intra-implant variability to 21.9 % (p < 0.0005) was calculated.

241 www.ecmjournal.org
R Bernhardt et al. Comp arison of histological sections with CT slices
Fig. 2. The rearrangement of SRμCT absorption data using the cylindrical implant geometry is illustrated. (a) First, an alignment between implant longitudinal axis and the z-axis of the SRμCT volume was performed. Then, a circular ROI around the implant was manually set for a selected slice. (b) The projection algorithm collects the image values along the ROI and reorganise these values to straight lines. (c) With the procedure on all aligned SRμCT slices results in an even morphology of peri-implant bone. (d) A 3D representation of the projected bone implant volume inside the titanium screw cavity shows the result of the procedures. (e) An 11 μm thick slice of mineralised bone values at 18 μm from the defi ned implant surface for SRμCT (ROI 2) is shown. This gives real information on the entire bone-implant contact (BIC-3D).

242 www.ecmjournal.org
R Bernhardt et al. Comp arison of histological sections with CT slices
The linear regression coefficient (R) of the BIC between CT-2D and histomorphometry was calculated with R = 0.968 (Fig. 5a). With the Bland-Altman-Plot from Fig. 5b, there is no evidence of a proportional error related to the amount of detected BIC between SRμCT and histomorphometry. The regression coeffi cient R = 0.50 (p = 0.883) is not signifi cantly different from zero. Reducing the statistical model to a constant bias, thus revealing systematic errors, results in a signifi cantly higher BIC for histomorphometry compared to SRμCT with 2.4 % (p = 0.014).
Correlation of BIV histomorphometry and CT-2D, CT-3DFigs. 6a-d illustrates the change of BIV in selected samples comparing histological and CT-3D data in the same diagram. An overall agreement between histomorphometry and CT-2D data for BIV is seen. The standard statistical parameters of BIV for histomorphometry, CT-2D and CT-3D for the samples are shown in Table 2. Statistical models were identical to the BIC calculation. A paired model (BIV-2D) and a model using all information from SRμCT (BIV-3D) were distinguished. For all samples two independent areas of measurement per section/slice were used. For BIV-2D a non-signifi cant bias of -1.4 % (p = 0.736) between histomorphometry and CT-2D was found. The inter-sample variability was 14.7 % (p = 0.080) and the intra-sample variability was 17.6 % (p < 0.0005). For the BIV-3D the bias between histomorphometry and SRμCT was -2.6 % (p = 0.323), but remained non-signifi cant. The
inter-sample variability in the BIV-3D was 13.7 % (p < 0.0005) and the intra-sample variability was 15.8 % (p < 0.0005). A linear regression coeffi cient (R) of BIV between CT-2D and histomorphometry with R = 0.831 was calculated (Fig. 5c). Using the Bland-Altman-Plot of Fig. 5d, there is no evidence of a proportional error related to the amount of detected BIV between SRμCT and histomorphometry. The regression coeffi cient R = 0.07 (p = 0.491) is not signifi cantly different from zero. Reducing the statistical model to a constant bias shows a non-signifi cant 1.4 % (p = 0.519) lower BIV for histomorphometry compared to SRμCT.
Discussion
The aim of this paper was to compare the histomorphometric features of osseointegrated titanium implants with three-dimensional information from high-resolution SRμCT measurements. Due to the fact that SRμCT tomograms are obtained from the absorption of X-ray photons, we analysed whether this spatial data, representing the peri-implant tissue, was comparable to microscopic two-dimensional histological information. To assess this question, BIC and BIV values from histological sections were compared to 2D- and 3D-SRμCT slices. The histomorphometric measurement of the BIC of osseointegrated implants is the standard procedure for the evaluation of bone formation on an implant surface. High BIC values are considered to be a prerequisite for implant stability, which clinically
Fig. 3. Generally, morphological information of bone tissue can be assessed by light microscopy of stained histological sections (a), and non-destructively using fi ltered reconstructed absorption data from SRμCT measurements (b). The three-dimensional absorption values of fully mineralised bone are coloured grey and the values for titanium are coloured white.
243 www.ecmjournal.org
R Bernhardt et al. Comp arison of histological sections with CT slices
enables functional dental reconstruction. Studies evaluating new implant surfaces assess this parameter. In particular, differences in BIC between test and reference surfaces are statistically analysed to compare their osteogenic potential. In this study, we performed histomorphometric and tomographic analysis of the BIC and BIV of six implant/bone samples. For the comparison of up to four histological sections (two areas of measurement per histological section) representing a single implant to the CT-2D data, we found a small, non-signifi cant difference in BIC of 1.9 % (p = 0.703). This situation changed when comparing the CT-3D information to the histological sections. The difference in the BIC rose to 4.9 % and was found to be non-signifi cant (p = 0.171). The bias of BIC between histomorphometry and CT-3D data was rather small, taking into consideration that the bone contact may vary a lot between all implant surfaces. Comparing the inter- and intra-sample variability of the BIC of both methods, the
inter-implant difference was non-signifi cant and decreased by only 1.4 % from BIC-2D to BIC-3D. Furthermore we found a maximum intra-sample BIC standard deviation of ± 35.5 % for histomorphometric measurements. This was comparable to the CT-2D situation (± 33.7 %). Considering that many studies use two (or even only one) histological sections per implant, the results of this study illustrate the fact that the selection of the histological section may strongly infl uence the determined BIC. In contrast, the intra-sample variability of the BIC between histomorphometry and SRμCT differed signifi cantly with 21.7 % and increased only slightly from BIC-2D to BIC-3D to 21.9 %. With the statistical variance model (Fig. 5b) we found in a small but signifi cant systematic error of 2.4 % (p = 0.014), which leads to higher BIC values for histomorphometric measurement. While SRμCT needs a strong contrast for the detection of bone tissue directly at the implant surface, only fully mineralised
Fig. 4 A prerequisite for a paired statistical analysis between histomorphometry and SRμCT results is the location of the histological section within the SRμCT-volume. (a-c) Selected histological sections displaying Masson-Goldner-stained bone tissue in the cavity. (d-f) The appropriate SRμCT slices (CT-2D) with absorption values fi ltered for mineralised bone and titanium show a good morphological agreement for the bone close to the implant surface. (g-h) The image magnifi cations show a clear representation of the implant interface without metal-induced artifacts for the SRμCT measurement.

244 www.ecmjournal.org
R Bernhardt et al. Comp arison of histological sections with CT slices
bone can be clearly separated on the image using a fi tting threshold from the absorption histograms. If the implant surface is predominantly covered by bone tissue the partial volume effect in SRμCT measurements infl uences the threshold BIC values and may also lead to a mixture of bone/implant absorption values above the constantly defined 18 μm distance of analysis. These absorption values, which are higher compared to mineralised bone, were fi ltered by the threshold procedure. Due to the partial volume effect the BIC line of measurement for SRμCT can be 1 - 2 pixels away from the histological line of measurement. This can infl uence the SRμCT BIC value, as separated thin regions of mineralised tissue, which are part of the histological BIC value, would not be counted. Associated to this effect, Fig. 5a shows values where the histological BIC is about 100 % and where the BIC of the SRμCT is noticeably lower. However, these conditions were not prevalent in our study and do not
result in signifi cant differences of the BIC between SRμCT and histomorphometry. If a small soft tissue layer on the implant is followed by mineralised bone, this would not be measured as BIC in histology and would cause an overestimation of BIC in SRμCT. In this study, there were no such cases found within the BIC analysis (Fig. 5a). Figs. 4g-h gives an example of the direct contact of bone tissue with the implant surface. In order to compare the BIC between SRμCT slices and histological sections it has to be ensured that the ROI selection (Fig. 1b) is as identical to histology as possible. Other studies (Park et al., 2005; Rebaudi et al., 2004) have also compared the histomorphometric BIC of dental implants to 3D measurements, using a conventional μCT. Rebaudi et al. (2004) showed a maximum difference of 16 % mean BIC. In contrast to our study, a 45 μm thick peri-implant boundary served for the BIC measurement. Because of the monochromatic character of the X-rays
Fig. 5. (a) Relationship of the bone-implant contact (BIC) measurement between the histological data and the SRμCT data with the line of equality. Data of the same samples are shown in equal colours. (b) Bland Altman plot of the difference between the histological and SRμCT BIC measurements against their mean value. Mean difference (long dash) describing the bias between the methods. Short dashed lines indicate limits of agreement. (c) Relationship of the bone-implant volume (BIV) measurement between the histological data and the SRμCT data with the line of equality. (d) Bland Altman plot of the difference between the histological and SRμCT BIV measurements against their mean value.

245 www.ecmjournal.org
R Bernhardt et al. Comp arison of histological sections with CT slices
and the high photon density, our SRμCT measurements enabled the use of a distance of 18 μm, which more closely represents the implant surface in contact with bone (Bernhardt et al., 2004; Bernhardt et al., 2005). It was found that of the type of bone has an infl uence from where the BIC originates (Ivanoff et al., 1997). Our study focused on newly formed spongious bone structures. Another study performed BIC measurements with conventional μCT and histomorphometry, without however selecting identical slice positions (Park et al., 2005). They showed a correlation in BIC between the two methods with an underestimation of 10 % for μCT data in relation to histomorphometry. These two studies suffered from the infl uence of the partial volume effect around the trabecular boundaries and beam hardening near the implant surface using conventional μCT. These problems of conventional μCT measurements of peri-implant bone response in correlation to histomorphometry were also shown by Jansen et al. (2009). With the knowledge gained from this analysis of BIC, we made two main conclusions. First, the application of high resolution SRμCT has the potential to detect BIC in close proximity to the implant surface, with the overall results being comparable to histomorphometric fi ndings.
Secondly, using the full SRμCT 3D-data with about 360 CT positions per implant, the comparison with four histological sections showed a non-signifi cant difference of only 4.9 %. On the basis of our results using a maximum of eight areas of measurement per implant (two areas/section, four sections/implant) we concluded that histomorphometry is an appropriate method to demonstrate pronounced differences of BIC. As mentioned earlier, in many cases only one or two histological sections per implant can be used for histomorphometric evaluation. This can lead to an over- or underestimation of the BIC. In case expected signifi cant differences are lower than 5 %, SRμCT could give additional information on the performance of different surfaces. The analysis of the BIV gives information about the thickness of newly formed peri-implant bone, which is of interest in correlation to the determined BIC. Differences in bone volume are of interest when comparing different implant surfaces and their possible infl uence on bone formation, e.g. by the application of surface-integrated growth factors. In a previous study we showed a reasonable agreement of peri-implant bone morphology between SRμCT and histomorphometry (Bernhardt et al., 2004). Because of
Fig. 6. BIV analysis for selected samples along the histological orientation shows a good agreement between the single values from histomorphometry (red dots) and the continuous data from the SRμCT analysis (blue dots). Although there is a high variability of the intra-sample BIV, the mean values of the BIV are nearly the same for 3-4 histological sections against the whole bone volume in the cavity analysed with SRμCT (b-d). With a bone volume of about 50 %, the overlap of similar absorption values between embedding material and low mineralised bone becomes signifi cant and leads to a higher amount of BIV detected by SRμCT analysis (a).

246 www.ecmjournal.org
R Bernhardt et al. Comp arison of histological sections with CT slices
the loss of information during the histological sawing and grinding process, we concluded that differences in bone formation could become questionable. This is also described by other studies (Sennerby et al., 2001). In contrast to these earlier results, we could show in this study that information from 3-4 histological sections per implant (2 areas/section) leads to reasonable results in BIV analysis. In another study (Chappard et al., 2005), histomorphometry of 70 bone biopsies of patients suffering from metabolic bone diseases were compared to conventional 3D-μCT. Stiller et al. (2009) compared the validity of histomorphometry to CT-2D and CT-3D (SRμCT), analysing bone biopsies without implants. Bone area fractions determined by histomorphometry and the corresponding slice from CT-2D also showed a good agreement, with a minor difference of only 1.6 %. Comparing histomorphometry to CT-3D, a maximum difference of 8.5 % was shown. These results are very similar to our fi ndings. The SRμCT-measurement was done after PMMA embedding. This was a prerequisite to preserve the morphology of the tissues over time. The absorption histograms for PMMA values were found to be in the same range as soft tissue and low mineralised bone. A high amount of low mineralised bone thus can lead to an underestimation of detected bone tissue, as there will be insuffi cient contrast between PMMA and low mineralised bone tissue. The maximum intra-sample difference of BIV in our study showed a non-signifi cant difference between histomorphometry and SRμCT. The difference between histomorphometry compared to CT-2D and compared to CT-3D was only 1.2 %. Based on these results, we conclude that the BIV values gained from 3-4 histological sections per implant/bone sample represent solid data with only minor differences to the 3D situation (Fig. 6a-d). An advantage of SRμCT in contrast to conventional μCT is the reduction of the partial volume effect for trabecular boundaries, thus facilitating threshold setting. As the PVE is related to the CT image resolution, the effect could be reduced with high-resolution μCT-scanners and suffi cient X-ray intensity. For pure bone biopsies, conventional μCT should be able to replace conventional histomorphometry in the measurement of bone volume and microstructure of trabecular bone (Uchiyama et al., 1997). The analysis of a highly absorbent osseointegrated implant, when measuring the BIC, is more feasible using a SRμCT (Bernhardt et al., 2004). This study demonstrated that 3-4 histological sections allow the demonstration of differences in BIC and BIV, without major disagreement with synchrotron measurements. Although histomorphometry is a time-consuming procedure, it has the advantage of revealing information from non-mineralised bone tissue. Such tissue is invisible to μCT when scanning highly absorbent materials like osseointegrated dental implants. A limiting factor of SRμCT is the availability of synchrotron radiation facilities for such experiments. The question arises of what is meant by a clinically important difference in BIC. It would be preferable for clinically signifi cant differences in BIC to be supported
by signifi cant differences in other areas, e.g. mechanics. Various studies have tried to correlate biomechanical data to histomorphometric data (Buser et al., 2004; Ferguson et al., 2006). A major disadvantage of biomechanical testing is the destructive nature of methods, like removal torque testing. In such cases SRμCT with its non-destructive character would enable a consecutive test method of the same implant/bone sample. Because of the digital 3D representation of peri-implant bone in SRμCT it is possible to simulate mechanical behaviour of the implant with the help of fi nite element models. Further data, e.g. the degree of mineralisation within newly formed bone, can be three dimensionally determined (Campbell et al., 2011).
Acknowledgements
This study has been funded by the German Research Foundation DFG (Deutsche Forschungsgemeinschaft) under the Transregio SFB 67 and the BMBF project (05 ES3XBA/5). Further we thank Dr. Jürgen Goebbels for his assistance in synchrotron experiments, Mrs. Andrea Groß for the graphical layout and Dr. Ian Chambers for the English editing.
References
Albrektsson T, Branemark PI, Hansson HA, Lind strom J (1981) Osseointegrated titanium implants. Requirements for ensuring a long-lasting, direct bone-to-implant anchorage in man. Acta Orthop Scand 52: 155-170. Albrektsson T, Jacobsson M (1987) Bone-metal interface in osseointegration. J Prosthet Dent 57: 597-607. Bernhardt R, Scharnweber D, Muller B, Thurner P, Schliephake H, Wyss P, Beckmann F, Goebbels J, Worch H (2004) Comparison of microfocus- and synchrotron X-ray tomography for the analysis of osteointegration around Ti6Al4V implants. Eur Cell Mater 7: 42-51. Bernhardt R, van den Dolder J, Bierbaum S, Be utner R, Scharnweber D, Jansen J, Beckmann F, Worch H (2005) Osteoconductive modifi cations of Ti-implants in a goat defect model: characterization of bone growth with SRÊCT and histology. Biomaterials 26: 3009-3019. Branemark PI (1983) Osseointegration and its e xperimental background. J Prosthet.Dent 50: 399-410. Buser D, Broggini N, Wieland M, Schenk RK, Den zer AJ, Cochran DL, Hoffmann B, Lussi A, Steinemann SG (2004) Enhanced bone apposition to a chemically modifi ed SLA titanium surface. J Dent.Res 83: 529-533. Campbell GM, Bernhardt R, Scharnweber D, Boyd SK (2011) The bone architecture is enhanced with combined PTH and alendronate treatment compared to monotherapy while maintaining the state of surface mineralization in the OVX rat. Bone 49: 225-232. Chappard D, Retailleau-Gaborit N, Legrand E, B asle MF, Audran M (2005) Comparison insight bone measurements by histomorphometry and microCT. J Bone Miner Res 20: 1177-1184. Donath K, Breuner G (1982) A method for the st udy of undecalcifi ed bones and teeth with attached soft tissues.

247 www.ecmjournal.org
R Bernhardt et al. Comp arison of histological sections with CT slices
The Sage-Schliff (sawing and grinding) technique. J Oral Pathol 11: 318-326. Ferguson SJ, Broggini N, Wieland M, de Wild M, Rupp F, Geis-Gerstorfer J, Cochran DL, Buser D (2006) Biomechanical evaluation of the interfacial strength of a chemically modifi ed sandblasted and acid-etched titanium surface. J Biomed Mater Res A 78: 291-297. Ivanoff CJ, Sennerby L, Johansson C, Rangert B , Lekholm U (1997) Infl uence of implant diameters on the integration of screw implants. An experimental study in rabbits. Int J Oral Maxillofac Surg 26: 141-148. Jansen JA, Schouten C, Meijer GJ, van den Beuc ken JJJP, Spauwen PHM (2009) The quantitative assessment of peri-implant bone responses using histomorphometry and micro-computed tomography. Biomaterials 30: 4539-4549. Johansson CB, Hansson HA, Albrektsson T (1990) Qualitative interfacial study between bone and tantalum, niobium or commercially pure titanium. Biomaterials 11: 277-280. Linder L, Albrektsson T, Branemark PI, Hansson HA, Ivarsson B, Jonsson U, Lundstrom I (1983) Electron microscopic analysis of the bone-titanium interface. Acta Orthop Scand 54: 45-52. Liu S, Broucek J, Virdi AS, Sumner DR (2012) Li mitations of using micro-computed tomography to predict bone-implant contact and mechanical fi xation. J Microsc 245: 34-42. Oyonarte R, Pilliar RM, Deporter D, Woodside DG (2005) Peri-implant bone response to orthodontic loading: Part 1. A histomorphometric study of the effects of implant surface design. Am J Orthod Dentofacial Orthop 128: 173-181. Park YS, Yi KY, Lee IS, Jung YC (2005) Correla tion between microtomography and histomorphometry for assessment of implant osseointegration. Clin Oral Implants Res 16: 156-160. Rebaudi A, Koller B, Laib A, Trisi P (2004) Mi crocomputed tomographic analysis of the peri-implant bone. Int J Periodontics Restorative Dent 24: 316-325. Sennerby L, Wennerberg A, Pasop F (2001) A new microtomographic technique for non-invasive evaluation of the bone structure around implants. Clin Oral Implants Res 12: 91-94. Stadlinger B, Hintze V, Bierbaum S, Moller S, Schulz MC, Mai R, Kuhlisch E, Heinemann S, Scharnweber D, Schnabelrauch M, Eckelt U (2011) Biological functionalization of dental implants with collagen and glycosaminoglycans. A comparative study. J Biomed Mater Res B Appl Biomater 100B: 331-341. Stiller M, Rack A, Zabler S, Goebbels J, Dalug ge O, Jonscher S, Knabe C (2009) Quantifi cation of bone tissue regeneration employing beta-tricalcium phosphate by three-dimensional non-invasive synchrotron micro-tomography – a comparative examination with histomorphometry. Bone 44: 619-628. Uchiyama T, Tanizawa T, Muramatsu H, Endo N, T akahashi HE, Hara T (1997) A morphometric comparison of trabecular structure of human ilium between microcomputed tomography and conventional histomorphometry. Calcif Tissue Int 61: 493-498.
Discussion with Reviewers
Reviewer I: What is the fi nal advantage of μCT analysis compared with histology?Authors: Providing suffi cient availability, the advantage of μCT analysis compared to histology is a fast and non-destructive analysis of samples with three-dimensional data and high statistical power. Furthermore, there is no tissue preparation necessary for the measurement of mineralised bone samples. The special character of the μCT information provides the possibility to apply more than one method. Next to histology, other analytical methods like FEM investigation or spatial pore analysis are feasible. The challenge for desktop μCT systems still is to reduce metal induced artifacts.
Reviewer I: Is it not better to examine the specimens fresh (without fi xation) using μCT in order to avoid artifacts due to fi xation and embedding?Authors: It is true that a measurement of fresh samples would be favourable. In most cases this can be done using desktop μCT systems due to their availability. For SRμCT, which has been used in this study, it was hard to plan the synchrotron beam-time between animal experiment and histological preparation. The reason for the fi xation of tissues as applied in this study is the necessity of an unchanged morphological agreement of the bone/implant interface between both measurements (SRμCT / histology) for the time of investigation.
Reviewer III: What are the correlation coeffi cients of the linear regressions between histology and SRμCT-based measurements of BIC and BIV? What are the main sources for discrepancies between the two methods?Authors: The correlation coeffi cients between SRμCT and histology are R = 0.97 for BIC and R = 0.83 for BIV. The main aspect for BIC differences is the partial volume effect in the SRμCT at the bone/implant interface. This shifts the distance between histological and SRμCT line of measurement toward the peri-implant tissues. If the implant is mostly covered with a bone layer being thinner than the PVE (in our study < 18 μm), this will result in an underestimation of bone in SRμCT analysis. In our study this effect did not lead to a signifi cant change within the BIC between histology and SRμCT. An important factor for discrepancies of BIC between histomorphometry and SRμCT may also be the matching of the ROI positions in the images being compared. For BIV measurement, PMMA fi xation of the samples, which was essential for the preservation of tissue morphology, complicates the fi nding of an appropriate threshold, only being associated with newly formed bone. This can also affect the BIC and BIV values.
Reviewer III: In addition to BIC and BIV, would it be possible to measure the degree of mineralisation of bone around the implant with SRμCT? Or would the presence of the implant hamper this quantifi cation?Authors: The measurement of the degree of mineralisation by SRμCT using bone absorption histograms is possible.

248 www.ecmjournal.org
R Bernhardt et al. Comp arison of histological sections with CT slices
In the magnifi ed SRμCT image Fig. 4h, different grey (absorption) values of bone are visible. These can be used for the classifi cation of the mineral density close to the implant surface, as there were no metal induced artifacts detectable.
Reviewer III: If BIC and BIV are assessed with desktop micro-computed tomography at the same resolution reported in the present study, would it be possible to estimate the “exclusion zone” where image artefacts would not allow a proper analysis?
Authors: A proper distance from the implant surface for the analysis of BIC using a desktop μCT system depends on the extension of metal induced artifacts around the implant. The artifacts are related to the applied hardware (e.g. implant material, shape and thickness, X-ray fi lter and X-ray intensity, and the software (e.g. reconstruction algorithm and beam hardening fi ltering). Using a CaP/implant phantom of appropriate size, the ‘exclusion zone’ of applied μCT systems can be estimated by a line scan analysis through the bone/implant interface.