comparison of cognitive modeling and …etd.lib.metu.edu.tr › upload › 12616846 ›...
TRANSCRIPT

COMPARISON OF COGNITIVE MODELING AND USER
PERFORMANCE ANALYSIS FOR TOUCH SCREEN MOBILE
INTERFACE DESIGN
A THESIS SUBMITTED TO
THE GRADUATE SCHOOL OF INFORMATICS
OF
THE MIDDLE EAST TECHNICAL UNIVERSITY
BY
NİHAN OCAK
IN PARTIAL FULFILLMENT OF THE REQUIREMENTS FOR THE DEGREE OF
MASTER OF SCIENCE
IN
THE DEPARTMENT OF INFORMATION SYSTEMS
JANUARY 2014


COMPARISON OF COGNITIVE MODELING AND USER PERFORMANCE
ANALYSIS FOR TOUCH SCREEN MOBILE INTERFACE DESIGN
Submitted by Nihan OCAK in partial fulfillment of the requirements for the degree
of Master of Science in the Department of Information Systems,
Middle East Technical University by,
Prof. Dr. Nazife Baykal ___________________
Director, Informatics Institute
Prof. Dr. Yasemin Yardımcı ___________________
Head of Department, Information Systems
Prof. Dr. Kürşat Çağıltay ___________________
Supervisor, Computer Education and Instructional Technology, METU
Examining Committee Members
Prof. Dr. Onur Demirörs ___________________
IS, METU
Prof. Dr. Kürşat Çağıltay ___________________
CEIT, METU
Assist. Prof. Dr. Aysu Betin Can ___________________
IS, METU
Assist. Prof. Dr. Murat Perit Çakır ___________________
COGS, METU
Assist. Prof. Dr. Banu Günel ___________________
IS, METU
Date: 22.01.2014


iii
I hereby declare that all information in this document has been obtained and
presented in accordance with academic rules and ethical conduct. I also declare
that, as required by these rules and conduct, I have fully cited and referenced all
material and results that are not original to this work.
Name, Last name: Nihan OCAK
Signature : __________

iv
ABSTRACT
COMPARISON OF COGNITIVE MODELING AND USER PERFORMANCE
ANALYSIS FOR TOUCH SCREEN MOBILE INTERFACE DESIGN
OCAK, Nihan
M.S., Department of Information Systems
Supervisor: Prof. Dr. Kürşat Çağıltay
January 2014, 99 Pages
The main aim of this thesis is to analyze and comparatively evaluate the usability of
touch screen mobile applications through cognitive modeling and end-user usability
testing. The study investigates the accuracy of the estimated results cognitive model
produces for touch screen mobile phone interfaces.
CogTool application was used as the cognitive modeling method. Turkcell Cüzdan
application, which is suitable for the implementation of both methods, was chosen as
the mobile application. Based on the feedback given by the developer of the
application, 8 tasks were determined, considering the most widely used actions and
critical operations on the application. 10 people who had not used the application
before were selected and user tests were conducted in a usability laboratory. Since
CogTool gives skilled users’ performance prediction, the test was performed twice.
CogTool predictions were compared with the second test results. The results obtained
from CogTool were analyzed step by step, and tasks were compared on the basis of
step time and total task completion time. This study reveals that CogTool gives
approximate estimations with actual user performance on touch screen mobile phone
application interfaces. However, if there are special cases in the tasks such that users
v
are very accustomed to the steps or decision-making is involved in the tasks, the
“Think Operation” in CogTool should be changed appropriately or it should be
deleted. In addition, this study shows that performing cognitive modeling method
requires one third of the time needed for conducting end user tests. Furthermore, the
results reveal that CogTool can be used for measuring some factors which affect user
satisfaction level.
Keywords: Mobile usability, Cognitive Modeling, CogTool, User Testing, GOMS

vi
ÖZ
BİLİŞSEL MODELLEME VE KULLANICI PERFORMANS TESTİ
YÖNTEMLERİNİN DOKUNMATİK MOBİL ARAYÜZ TASARIMINDA
KARŞILAŞTIRILMASI
OCAK, Nihan
Yüksek Lisans, Bilişim Sistemleri
Tez Yöneticisi: Prof. Dr. Kürşat Çağıltay
Ocak 2014, 99 Sayfa
Bu tez çalışmasının temel amacı, dokunmatik ekranlı mobil uygulamaların
kullanılabilirliğini bilişsel modelleme ve son kullanıcı kullanılabilirlik testi
metotlarıyla analiz ederek karşılaştırmalı olarak değerlendirmektir. Çalışma, bilişsel
modelleme yönteminin dokunmatik mobil cihazlarda verdiği tahmini sonuçlarının
doğruluğunu araştırmaktadır.
Çalışmada, bilişsel modelleme yöntemi için CogTool uygulaması kullanılmıştır.
Mobil uygulama olarak her iki yöntemin uygulanması için uygun olan Turkcell
Cüzdan uygulaması seçilmiştir. Uygulama geliştiricileri ile görüşülerek en çok
kullanılan ve kritik olduğu düşünülen 8 görev belirlenmiştir. Uygulamayı daha önce
kullanmamış 10 kullanıcı seçilerek kullanılabilirlik laboratuvarında kullanıcılarla test
gerçekleştirilmiştir. CogTool deneyimli kullanıcı performans tahmin sonuçları verdiği
için çalışma iki aşamalı olarak gerçekleştirilmiştir. Kullanıcılar ilk önce görevleri
gerçekleştirerek uygulama üzerinde deneyim sahibi olmuştur. Kullanıcılarla yapılan
ikinci testin sonuçları CogTool sonuçları ile karşılaştırılmıştır. CogTool sonuçları

vii
adım adım analiz edilerek, görevler adım bazında ve toplam süre bazında
karşılaştırılmıştır. Bu çalışmanın sonuçlarına göre, CogTool dokunmatik mobil telefon
uygulama arayüzlerinde kullanıcı performanslarına yakın tahmin sonuçları
vermektedir. Ancak, CogTool kullanılırken kullanıcıların sayfa üzerinde yapmaya çok
alışık oldukları işlemler veya seçim yapmasını gerektiren seçenekler olduğu
durumlarda “Think Operation” süresi işleme uygun olarak değiştirilmeli veya
silinmelidir. Ayrıca, çalışma CogTool’u uygulamanın kullanıcı testi yöntemini
gerçekleştirmenin üçte biri zaman gerektirdiğini göstermiştir. Bunun yanında, çalışma
sonuçları CogTool’un kullanıcı memnuniyetini etkileyen bazı faktörlerin ölçülmesi
için kullanılabileceğini göstermiştir.
Keywords: Mobil kullanılabilirlik, Bilişsel Modelleme, CogTool, Kullanılabilirlik
testi
viii
To the memories of my grandmother
&
My Parents and Brothers
who believed me and offered me unconditional love throughout my life

ix
ACKNOWLEDGMENT
First and foremost, I would like to give special thanks to my supervisor, Prof. Dr.
Kürşat Çağıltay, for his invaluable guidance, encouragement and support during my
thesis study. His inspiration and experience have been an invaluable resource for me.
I feel lucky and privileged to have the chance to work with him throughout this thesis
study.
I would like to express my deepest gratitude for my mother, Ayşe Ocak, my father
Kadir Ocak and my lovely brothers Furkan, Melih and Muhammet for their
unconditional support and endless love throughout my life, and their patience during
this thesis study. I would also want to thank Erol Ünal and Sevim Ünal for their
unconditional support throughout my education. Their support in this study means a
lot for me.
I would also like to thank Çağlar Yıldırım, whom I consider to be my brother, and my
friends Mahmut Teker, Özge Alaçam, Murat Ulubay, Özge Gürbüz, Nurcan Alkış
Deniz İren and Murat Duman for their endless support and help during this thesis
study. I am grateful to have them in my life.
I wish to express my sincere appreciation to Turkcell İletişim Hizmetleri A.Ş for their
support and especially to Bahri Okuroğlu for his insight and guidance during this
study. I would also like to thank the scholarship program, Teknoloji Liderleri
Lisansüstü Burs Programı, for supporting this study.
I would like to show my gratitude to my colleagues from METU Computer Center,
Feride Erdal, Nilgün Öner Tangör, Hasan Nadir Derin, Can İz Yemişçioğlu and
Yasemin Saatçioğlu Oran for their support and motivation during the completion of
this thesis.
This research would not have been successfully completed without support from my
love Önder Eren and beloved friends Seçil Kurbal, Meryem Ayas, İpek Tatlı, and my
housemates Nazlı Aydın and Burcu Yılmaz. Although I was not able to spend enough
time with them during this thesis study, they were always there to support me and
cheer me up. I feel fortunate to have such invaluable friends.
Finally, I would like to thank everyone else who supported and helped me during this
process.

x
TABLE OF CONTENTS
ABSTRACT ............................................................................................................................ iv
ÖZ ........................................................................................................................................... vi
ACKNOWLEDGMENT ......................................................................................................... ix
TABLE OF CONTENTS ......................................................................................................... x
LIST OF TABLES ................................................................................................................ xiii
LIST OF FIGURES .............................................................................................................. xiv
LIST OF ABBREVIATIONS ............................................................................................... xvi
CHAPTER
I. INTRODUCTION ................................................................................................................ 1
1.1 INTRODUCTION ................................................................................................... 1
1.2 PURPOSE OF THE STUDY ................................................................................... 2
1.3 SIGNIFICANCE OF THE STUDY ......................................................................... 2
1.4 RESEARCH QUESTIONS...................................................................................... 3
1.5 DEFINITIONS OF TERMS .................................................................................... 3
CHAPTER
II. LITERATURE REVIEW .................................................................................................... 4
2.1 METHODS USED IN USABILITY FIELDS ......................................................... 4
2.1.1 User Tests ......................................................................................................... 4
2.1.2 Heuristic Evaluation ......................................................................................... 6
2.1.3 Surveys ............................................................................................................. 6
2.1.4 Cognitive Modeling ......................................................................................... 7
2.2 MOBILE USABILITY ............................................................................................ 8
2.3 METHODS USED IN MOBILE USABILITY ....................................................... 8
2.4 MODELS USED IN THE COGNITIVE MODELING STUDIES ......................... 9
2.5 DISCUSSION OF THE LITERATURE REVIEW ............................................... 10

xi
CHAPTER
III. METHODOLOGY ........................................................................................................... 12
3.1 STUDY SETTING ................................................................................................. 12
3.2 DATA COLLECTION ........................................................................................... 18
3.3 DATA ANALYSIS ................................................................................................ 19
3.4 PARTICIPANTS .................................................................................................... 23
3.5 TASKS ................................................................................................................... 24
CHAPTER
IV RESULTS ........................................................................................................................ 35
4.1 THE COMPARISON OF SKILLED USER USABILITY TEST AND COGTOOL
RESULTS ........................................................................................................................... 35
4.1.1 TASK 1- Viewing promotions in the eating/drinking field ............................ 36
4.1.2 TASK 2- Buying promotion of nearby supermarket ...................................... 37
4.1.3 TASK 3- Using the promotion ....................................................................... 38
4.1.4 TASK 4- Prioritization of Paracard ................................................................ 38
4.1.5 TASK 5- Adding a Profile Photo ................................................................... 39
4.1.6 TASK 6- Adding units to a contact’s account ................................................ 40
4.1.7 TASK 7- Sending money to the phone number ............................................. 41
4.1.8 TASK 8- Checking the last actions of Paracard ............................................. 42
4.2 USER INTERACTION SATISFACTION QUESTIONNAIRE ........................... 45
4.2.1 Overall Reaction to the Application ............................................................... 45
4.2.2 Application Interface ...................................................................................... 46
4.2.3 Terminology and System Information ............................................................ 46
4.2.4 Learning.......................................................................................................... 47
4.3 SUMMARY OF THE RESULTS .......................................................................... 48
CHAPTER
V. DISCUSSION & CONCLUSION ..................................................................................... 49
5.1 DISCUSSION ........................................................................................................ 49
5.2 CONCLUSION ...................................................................................................... 53
5.3 CONTRIBUTION OF THE STUDY ..................................................................... 54
5.4 LIMITATION AND FURTHER RESEARCH ...................................................... 55

xii
REFERENCES ...................................................................................................................... 56
APPENDICES ....................................................................................................................... 60
APPENDIX A: Demographic Information Form (In Turkish) .......................................... 60
APPENDIX B: User Interaction Satisfaction Questionnaire - QUIS (In Turkish) ............ 61
APPENDIX C: Gönüllü Katılım Formu (In Turkish) ........................................................ 65
APPENDIX D: Katılım Sonrası Bilgi Formu (In Turkish) ................................................ 66
APPENDIX E: Tasks (In Turkish)..................................................................................... 67
APPENDIX F: CogTool Predictions ................................................................................. 68
APPENDIX G: Detailed User Test Data ........................................................................... 84

xiii
LIST OF TABLES
Table 1 - Participants' Information ......................................................................................... 24
Table 2 - CogTool and User Performance Results of the Task1 ............................................ 36
Table 3 - CogTool and User Performance Results of the Task2 ............................................ 37
Table 4 - CogTool and User Performance Results of the Task3 ............................................ 38
Table 5 - CogTool and User Performance Results of the Task4 ............................................ 38
Table 6 - CogTool and User Performance Results of the Task5 ............................................ 39
Table 7 - CogTool and User Performance Results of the Task6 ............................................ 40
Table 8 - CogTool and User Performance Results of the Task7 ............................................ 41
Table 9 - CogTool and User Performance Results of the Task8 ............................................ 42
Table 10 - Comparisons of Task Completion Time Results of CogTool and User Test ........ 43
Table 11 - The Time Required for Applying Methods ........................................................... 44
Table 12 - Result of the Overall Reaction to Application Section of the Questionnaire ........ 45
Table 13 - Results of Application Interface Section of the Questionnaire ............................. 46
Table 14 - Results of Terminology and System Information Section of the QUIS ................ 47
Table 15 - Results of Learning Section of the Questionnaire................................................. 47
Table 16 - The Comparison of CogTool predictions and user test task completion time
results ..................................................................................................................................... 51
Table G. 1 - User test results for task 1 .................................................................................. 84
Table G. 2 - User test results for task 2 .................................................................................. 85
Table G. 3 - User test results for task 3 .................................................................................. 87
Table G. 4 - User test results for task 4 .................................................................................. 88
Table G. 5 - User test results for task 5 .................................................................................. 89
Table G. 6 - User test results for task 6 .................................................................................. 91
Table G. 7 - User test results for task 7 .................................................................................. 94
Table G. 8 - User test results for task 8 .................................................................................. 97

xiv
LIST OF FIGURES
Figure 1 - Methods Used in Evaluating Mobile Usability ....................................................... 9
Figure 2 - Models Used in the Cognitive Modeling Studies .................................................. 10
Figure 3 - Using Phone on the Table ..................................................................................... 13
Figure 4 - Using Phone in Users' Hand .................................................................................. 14
Figure 5 - METU Human Computer Interaction Research and Application Laboratory ....... 14
Figure 6 - CogTool Frame Window ....................................................................................... 15
Figure 7 - CogTool Design Window...................................................................................... 16
Figure 8 - CogTool Demonstration Script Window ............................................................... 17
Figure 9 - CogTool Project Window...................................................................................... 18
Figure 10 - Timeline of the Methodology .............................................................................. 18
Figure 11 - ELAN Video Analysis Program .......................................................................... 20
Figure 12 - CogTool Visualization Window .......................................................................... 21
Figure 13 - Detailed Analysis in Visualization Window ....................................................... 22
Figure 14 - Age Distribution of Participants .......................................................................... 23
Figure 15 - Steps of the Task1 ............................................................................................... 25
Figure 16 - Steps of the Task2 ............................................................................................... 26
Figure 17 - Steps of the Task3 ............................................................................................... 27
Figure 18 - Steps of the Task4 ............................................................................................... 28
Figure 19 - Steps of the Task5 ............................................................................................... 29
Figure 20 - Steps of the Task6 ............................................................................................... 31
Figure 21 - Steps of the Task7 ............................................................................................... 33
Figure 22 - Steps of the Task8 ............................................................................................... 34
Figure 23 - The comparison of CogTool predictions and user test task completion time
results ..................................................................................................................................... 44
Figure F. 1 - Task1 Script Window........................................................................................ 68
Figure F. 2 - Task1 Visualization Window ............................................................................ 69
Figure F. 3 - Task2 Script Window........................................................................................ 70
Figure F. 4 - Task2 Visualization Window ............................................................................ 71
Figure F. 5 - Task3 Script Window........................................................................................ 72
Figure F. 6 - Task3 Visualization Window ............................................................................ 73
Figure F. 7 - Task4 Script Window........................................................................................ 74
Figure F. 8 - Task4 Visualization Window ............................................................................ 75
Figure F. 9 - Task5 Script Window........................................................................................ 76
Figure F. 10 - Task5 Visualization Window .......................................................................... 77
Figure F. 11 - Task6 Script Window...................................................................................... 78
Figure F. 12 - Task6 Visualization Window .......................................................................... 79
Figure F. 13 - Task7 Script Window...................................................................................... 80
Figure F. 14 - Task7 Visualization Window .......................................................................... 81

xv
Figure F. 15 - Task8 Script Window ...................................................................................... 82
Figure F. 16 - Task8 Visualization Window .......................................................................... 83

xvi
LIST OF ABBREVIATIONS
HCI: Human Computer Interaction
ISO: International Standards Organization
METU: Middle East Technical University
QUIS: Questionnaire for User Interaction Satisfaction
MHP: Model Human Processor
GOMS: Goals, Operators, Methods, and Selection Rules
ACT-R: Adaptive Control of Thought—Rational
KLM: Keystroke-Level Model
UI: User Interface
IOS: iPhone Operating system
3G: Third Generation
ELAN: EUDICO Linguistic Annotator


1
CHAPTER I
INTRODUCTION
The first chapter serves as an introductory chapter for the study, thereby the purpose
and the significance of the present study are described in detail. Moreover, the chapter
concludes by presenting the research questions and the definition of the terms used
within the scope of this thesis.
1.1 INTRODUCTION
The increasing use of mobile devices has brought about significant changes and trends
in the fields of Human Computer Interaction (HCI) and Communications. With the
help of mobile devices, users have the opportunity to access information independent
of time and place. According to the Smartphone Adoption report published by Deloitte
(2012), smartphone sales will have remarkably increased by the end of 2013 due to the
increasing amount of data and the convenience provided by smartphones that facilitate
daily life. Also, smartphones are estimated to take over computers as the most
preferred devices. Moreover, according to the research report created by iSuppli
(2009), touch screen technology also grows every year with the development of new
technical devices with corresponding human-computer interface. Touch screens are
used in many kinds of devices but are more popular by means of smartphones.
The increase in the use of smartphones has led to the rise of the number of mobile
applications and mobile application developers, meaning that the demands for such
applications increased as a result of the increased interaction between users and mobile
applications. For this interaction to be effective and efficient, mobile usability studies
are of utmost importance. Conceivably, interacting with small screens and accessing
information on such screens on the move is much more difficult than desktop
application (Nielsen, 2011). Therefore, it is imperative for companies developing
mobile applications to learn about mobile usability and take it into account when
developing mobile applications.
There is a wide range of usability methods to evaluate the usability of the products.
These usability methods differ from each other in terms of application, results
obtained, time and cost required etc. (Nielsen, 2008). The most commonly used
methods to evaluate usability of the human computer-interface are end user usability
tests, heuristic evaluation and survey methods. Cognitive modeling is another method

2
that is used to evaluate usability and it that predicts user performance through a
generalized representation (John, 2012). However, it is not a widely used method for
evaluating usability of user interface of touch screen mobile phones.
There are several cognitive modeling methods used to evaluate usability by estimating
how long it takes to execute tasks on an interface. The most commonly used methods
are Model Human Processor (MHP), Keystroke-Level Model (KLM), and Goals,
Operators, Methods and Selection Rules (GOMS). CogTool, developed by researchers
in the Human Computer Interaction Institute at Carnegie Mellon University, is a
modeling tool which uses KLM modeling to predict the approximate mean time to
execute a task on an interface. In this thesis study, CogTool was used as a cognitive
modeling method and the accuracy of the predictions for touch screen mobile phones
was investigated by comparing actual users’ performance.
1.2 PURPOSE OF THE STUDY
The purpose of the study is threefold;
1. to investigate the differences between results obtained from the cognitive
modeling tool and user tests,
2. to explore the effectiveness of cognitive modeling tools in a performance
aspect of usability testing on touch screen mobile application,
3. to explore the optimum usability method that is suitable for guiding the
development of touch screen mobile applications.
1.3 SIGNIFICANCE OF THE STUDY
The rapid development in the usage of mobile phones and rigorous competition in the
market make it necessary to evaluate user performance and usability in the early stages
of the development of application interfaces so as to prevent potential problems in the
interaction between users and interfaces (Li, Liu, Liu, Wang, Li & Rau, 2010).
Cognitive modeling is an appropriate method to evaluate usability in the early steps of
the development process due to its validity and reliability. John, Prevas, Salvucci, and
Koedinger (2004) stated that CogTool’s predictions are within about 10% of empirical
data. However, this has not been widely validated for the touch screen mobile
applications.
In addition, comparison of cognitive model predictions with actual users’ observed
data is the most frequently used way to investigate the accuracy of cognitive modeling.
In this study, two usability methods have been used to evaluate the touch screen mobile
application interface; cognitive modeling and end user performance test.
The findings of this study will be important for both developers and end users. Firstly,
the findings will be helpful for mobile application developers in deciding which
method they should choose to evaluate the usability of mobile applications. Also, the
findings of this study will aid in improving mobile interfaces in terms of effectiveness
and efficiency. Moreover, since the research into the use of cognitive modeling method
3
to evaluate the usability of the applications for new generation smartphones is scarce,
the findings will contribute to the field of Human Computer Interaction.
1.4 RESEARCH QUESTIONS
This study is guided by the following research questions:
1. Does cognitive modeling method yield similar results to those of user tests
in the usability evaluation of touch screen mobile applications?
2. To what extent is cognitive modeling method suitable to evaluate the
performance aspect of usability on touch screen mobile applications?
3. What is the optimum usability method that can guide the development of
touch screen mobile applications?
1.5 DEFINITIONS OF TERMS
Cognitive modeling: A computer science area which produce a computational model
to simulate or predict how people perform tasks and solve problems, based on
cognitive psychology principles.
CogTool: According to John (2010) CogTool is a general purpose user interface
prototyping tool. Differently from other tools, it automatically evaluates interface with
a predictive human performance model.
Touch screen: It is an electronic visual display that the user can interact with it by
touching the screen with fingers. In some touch screen displays, objects such as a stylus
or specially pen can be used for interaction.


4
CHAPTER II
LITERATURE REVIEW
Usability is defined in the ISO 9241-11 Usability Guide, which is a section of the ISO
9241 “Ergonomics of Human System Interaction” as the degree of usage satisfaction
for the effective and efficient use of a product by certain users toward certain goals in
particular environments (ISO 9241-11, 1998). In order to evaluate usability, the
effectiveness of a product is measured by the user’s proper use for certain aims and
reaching the wholeness. On the other hand, efficiency is evaluated by the
measurement of resources spent in reaching proper usage and wholeness.
For evaluating the usability of products, there is a wide range of usability methods,
varying from end user usability tests to desirability studies used to measure aesthetic
appeal (Nielsen, 2008). End user usability tests, heuristic evaluations and survey
methods are the most commonly used ones to evaluate the usability of interfaces.
Cognitive modeling is another method that predicts user performance through a
generalized representation (John, 2012). Nonetheless, this method is not very
commonly used.
In this chapter, some of the usability evaluation methods relevant to this study are
discussed in detail. Moreover, mobile usability is elaborated in this chapter.
2.1 METHODS USED IN USABILITY FIELDS
2.1.1 User Tests
Usability testing with end users is described as a technique to collect data from
authentic users by observing them while using the product to perform representative
tasks (Rubin, 1994). In a usability test the participants must be real users which are
members of the population who currently use or who will use the product (Dumas
& Redis, 1993). Furthermore, the participants must perform real tasks during tests.
According to Dumas and Redis (1993), usability studies can vary according to how
and where they are conducted but there are some characteristics that are common
to all usability studies. In all usability studies, the person who conducts the study
observes the participants and record what they do and say. Also, since the primary
goal of usability studies is to improve the usability of products, observers analyze
the data collected during the tests in order to diagnose usability problems, and then

5
they make recommendations to fix those problems for the purpose of improving the
usability of products.
According to Nielsen (2012), of all the various usability testing methods, user based
usability testing method is the most basic and useful one since, with the help of this
method, it is possible to directly collect data from real users about how they use the
system. However, it is not so easy to conduct usability test with end users. To
perform a usability test, there are several steps that should be followed, which are
planning the test, defining test tasks, recruiting test users, conducting tests with
users, analyzing the results, and writing the report. Conducting usability studies by
following these steps takes about 39 hours, as suggested by Nielsen (1998). This
time estimation may increase depending on the time spent on identifying and
recruiting appropriate test users. When time and cost are limited, end user test
method is not a suitable method. This is also true if the product has many usability
problems in its early stages of development. In this case, different usability testing
methods should be used because it is unnecessary to bring participants to identify
apparent usability problems (Rubin, 1994).
As for test settings, end user usability tests may be conducted in a usability
laboratory or in the field. In usability laboratories, users try to accomplish the given
tasks on the interface being tested and usability specialists observe what users do
while doing tasks and note the steps and behaviors of users. In user tests, users are
asked to think out aloud while performing the assigned tasks and their comments
are recorded. Usability laboratories may include cameras to record users’ behaviors
and one-way mirror to hide observers during tests. As Nielsen (2005) states, in spite
of artificial situation of usability laboratories, since users are strongly engaged in
the tasks and get into the scenario quickly as if they perform the tasks at their home,
or in their office, etc., the end user tests conducted in usability laboratory can reveal
realistic findings. Nevertheless, field studies, in which users are tested in their
home, office with their own computer or phone etc., are one of the most valuable
usability methods because observers collect information from users in their natural
habitats. However, field studies are much more expensive than laboratory studies
(Nielsen, 2005).
Another aspect of the end user usability test method is the number of users who will
be tested. According to Nielsen (2012), 5 users are enough to find out most of the
usability problems. As Nielsen (2012) states, the results of the comparison of 83
case studies show that the number of the usability problems found does not change
significantly by testing more users. However, there is an opposing view about
whether 5 users are sufficient in a usability test. Spool and Schroeder (2001) argue
that only 35% of usability problems are found with 5 users. They found new, severe
usability problems in 13th and 15th user’s section and if the study had been finished
after 5 users some severe problems would have been missed. According to Çağıltay
(2011), the number of the users in usability study is a disputable issue. To obtain
meaningful results from the tests, it is more important to specify the appropriate
users, appropriate tasks and appropriate study design than specifying the number of
the users.

6
2.1.2 Heuristic Evaluation
In heuristic evaluation, interfaces are reviewed by usability experts according to
commonly accepted heuristics, which are usability principles. In order to conduct
heuristic evaluations more than one usability expert should examine the interface
and judge its compliance with the heuristics (Nielsen, 1995). Since it is difficult for
one expert to find all usability problems in an interface, it is possible to increase
effectiveness of the method by involving multiple experts. According to Jeffries
and Desurvire (1992), the number of usability problems found in a heuristic
evaluation conducted by four usability experts is greater than that of any other
usability test. However, with heuristic evaluation, half of the usability problems
which are found in usability test are missed. Same with that, usability test missed
similar number of usability problems detected with heuristics (Desurvire,
Kondziela & Atwood, 1992). Moreover, different search methods reveal various
types of problems which are quite different from each other.
In addition, it is possible to use heuristic evaluation method in the early lifecycle of
usability engineering since it is not necessary to perform real tasks on the system
during heuristic evaluation (Nielsen, 1995). According to Nielsen, for one expert, a
heuristic evaluation session lasts only one or two hours for a typical interface.
Nevertheless, the explorers should be experts to find significant usability problems
in the interface. The more expert the explorer who analyzes the interface is, the
more usability problems are found (Desurvire et al., 1992). This suggests that the
cost for heuristic evaluations will also increase with an increase in the number of
usability experts employed in the study.
2.1.3 Surveys
Survey is another search method used in usability studies. With the help of surveys,
quantitative data about users’ opinions regarding software or website being tested
is collected. As Holzinger (2005) states, surveys are a good way to search end users’
preferred features and to see how they use the software or website. Because data is
gathered directly from the user, surveys give users’ subjective preferences,
satisfaction level and possible anxieties. In addition, according to Nielsen (2004)
one of the most important advantages of surveys is that they enable researchers to
collect data from a large number of users. Besides, survey research is usually a
quick and practical method and it is cost effective in terms of conducting and
analyzing data (Kirakowski, 2000). However, there are some disadvantages of the
survey method. First of all, participants should be selected carefully so that they
represent actual users. Otherwise, the data becomes unreliable (Nielsen, 2004).
Moreover, according to Holzinger (2005), survey search method defines fewer
usability problems in contrast to other usability methods. Also, survey studies
should be administered to a sufficient amount of participants in order to gather
significant result.

7
2.1.4 Cognitive Modeling
Predictive Human Performance Modeling is one of the models in human computer
interaction field with the longest research history (John et al., 2004). Designing a
model behaving, making mistakes and thinking like a human being would be very
beneficial for testing and comparing design ideas in terms of speed and cost (John
& Suzuki, 2009). The first model to satisfy these goals was Model Human Processor
(MHP), developed by Card, Moran and Newell in 1983. The MHP model is
comprised of three interacting systems: perceptual, motor and cognitive. According
to Crystal and Ellington (2004), the MHP model assumes that brain is able to make
several information processing operations like comparing, matching and
calculating. Later on, Card et al. (1983) developed an engineering model using
MHP’s characteristics about human performance in 1983. This model was named
GOMS, which stands for Goals, Operators, Methods, and Selection Rules. In
GOMS modeling technique, the user’s procedural knowledge needed to accomplish
tasks on a system is described. With the help of GOMS, researchers have been able
to predict and collect the quantitative data about skilled users’ task execution time.
The KLM, which is the simplified version of GOMS, stands for Keystroke-Level
Model and it uses only keystroke-level operators. Goals, methods, or selection rules
are not included in the analysis of this model. In this model, task execution time is
described in terms of four physical-motor operators: K (key-stroking), P (pointing),
H (homing), D (drawing); together with one system response operator R(t) and one
user mental operator M (John & Kieras, 1996). The number of studies concerning
the prediction of skilled users’ performance time has continuously increased and
this has validated the use of this method in many areas of human computer
interaction in time. Over one hundred research papers about GOMS and KLM have
been published (John et al., 2004).
Cognitive modeling extends classical usability methods by providing insight into
detailed cognitive aspects of human computer interaction. As Heinath and Urbas
state (2007), it is possible to use the cognitive model method in early stages of
design in contrast to empirical user testing. However, although cognitive modeling
provides a variety of advantages to usability testing studies, it is not, surprisingly,
such a popular tool for studies including user interface design and usability tests
(John et al., 2004). The reason why the use of cognitive modeling in usability
studies is rare has been ascribed to the difficulty in learning its modeling process.
Therefore, the need for the tools that do not require considerable time for learning
to model has arisen. For this reason, various studies have been done in order to
develop tools with a new methodology to minimize the effort while developing
cognitive models. Several tools with different working principles have been
developed in order to make it easier to analyze user interface design in terms of
usability by using the cognitive modeling method.
CogTool, developed by Carnegie Mellon University, is one of the user interface
(UI) prototyping tools which produce quantitative prediction of skilled user's’
execution time. The quantitative prediction data produced by CogTool is based on
the extensive research in cognitive psychology. CogTool has the ability to simulate
8
the cognitive, perceptual and motor behavior of humans while trying to complete
the assigned tasks on an interface successfully. In order to develop this simulation
CogTool uses ACT-R cognitive architecture which is a theory that explains how
simulation and human cognition work (Anderson, Bothell, Byrne, Douglass,
Lebiere & Qin, 2004). When the task is demonstrated, CogTool turns the
demonstrations into ACT-R code which emulates the KLM and gives estimation
for the mean of skilled users’ task execution time.
2.2 MOBILE USABILITY
While the use of mobile devices increases quickly, studies have revealed that it is very
difficult for users to understand information by reading from small screens of mobile
devices (Nielsen, 2011). According to Nielsen (2011), it is a known fact that presenting
information in a concise way is the best method for web users and this fact also applies
to mobile applications. In mobile applications, even short is too long for mobile users:
in mobile interfaces, very short rule should be applied.
As Nielsen (2011) asserts, mobile users are hastier than desktop users to access
information. Therefore, in mobile applications/web pages, interfaces should be
designed specifically for small screens and, features should be limited. Moreover, 2
years after the first report published in 2009, the number of the studies and level of
consciousness in the field of mobile usability have increased. The success rate of
mobile users on the tasks has increased from 59% to 62% in two years but this rate is
low when compared with the rapidly increasing number of mobile users. Besides,
within these two years between the two studies, the number of design principles
offered to mobile application/web site developers has increased from 85 to 210 thanks
to the extensive research and resources about mobile usability. This shows that there
is a rapid development in the mobile usability area. However, while the evaluation
process of mobile usability has improved rapidly, the performance of mobile users
have not increased as expected. This shows the failure in using design suggestions and
having users involved in the development process of mobile applications in order to
increase usability.
2.3 METHODS USED IN MOBILE USABILITY
In order to see which methods are preferred for mobile usability studies, a literature
review has been conducted. The articles which use different methods on mobile
usability and are written in English have been selected. Moreover, considering that the
use of mobile applications and mobile usability issues has rapidly risen, only the
studies done between 2006 and 2013 years have been analyzed. After applying these
filters, most related 50 articles have been selected for analysis. The methods used in
the analyzed articles to evaluate mobile application interfaces are shown in the Figure
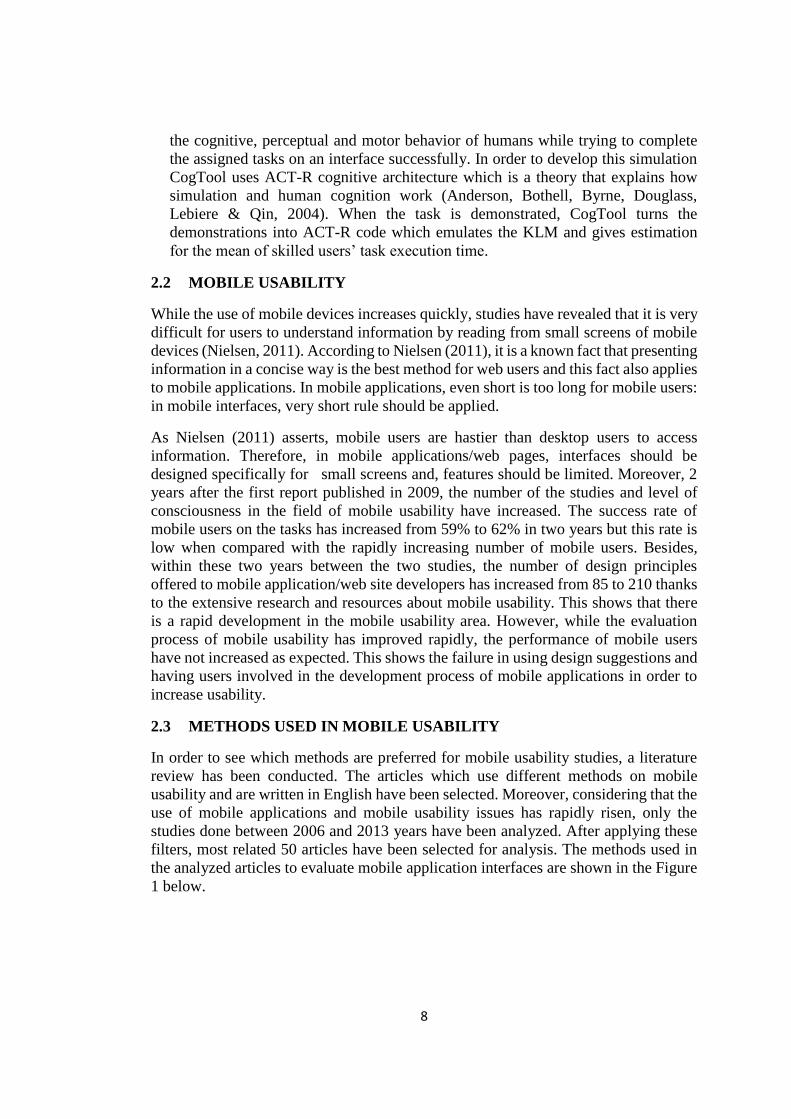
1 below.
9
Figure 1 - Methods Used in Evaluating Mobile Usability
As it is shown in the figure, the end user usability test method was used in the 44% of
the analyzed 50 studies. The end user usability test method, which is the most preferred
method in order to gather realistic results, is not regarded suitable for the studies with
time and cost constraints. The second mostly-used method for evaluating usability of
mobile applications is surveys with the 26% rate. Surveys may provide an advantage
compared to other methods in terms of speed and cost but it reveals relatively fewer
usability problems. Another method used in the analyzed articles is user experience
method. With this method, data are collected by observing or using specific tools to
record users’ behaviors when using mobile applications. Different from the end user
usability test, in user experience method no tasks are assigned to users: users are
supposed to use the application as they would if they were alone. In time and budget
limited circumstances, user experience method is not preferred similar to the end user
usability test method. Moreover, it was seen that in 6% of the analyzed 50 studies,
usability expert method was used and that 4% of the mobile applications were analyzed
through heuristic evaluations. Finally, it was seen from the analyzed 50 studies that
cognitive modeling method was used in limited number of study, only in 2%, to
evaluate usability of mobile devices.
2.4 MODELS USED IN THE COGNITIVE MODELING STUDIES
As part of this thesis, the studies that utilize cognitive modeling methods in a variety
of different areas related with human computer interaction were analyzed in order to
see which cognitive modeling methods are mostly preferred to be used. When
searching, the studies done between 2006-2013 in English are selected. After applying
the abovementioned filters, the most related 50 studies were selected by reviewing the
abstracts of the articles. The models used in the analyzed articles are shown below in
the Figure 2.
User Experience
18%
Expert Analyze 6%
Heuristics4%
Surveys26%
End User Test44%
Cognitive Modeling
2%

10
Figure 2 - Models Used in the Cognitive Modeling Studies
As it is shown in the figure, CogTool was used in 30% of the cognitive modeling
studies. The ease of use of CogTool on application interfaces increases its utilization
rate. The second and third most commonly used models, which are "Keystroke - Level
Model" (KLM) and "Goals, Operators, Methods, and Selection rules" (GOMS)
models, have proved their validity by being used for the large number of tasks on
desktop computers studies. Therefore, these two cognitive modeling methods continue
to be used extensively in the modeling studies.
The 13 out of 50 studies were conducted using mobile devices but only in two studies
touch screen mobile devices were used. Most of the studies were focusing on extending
the cognitive modeling for mobile devices. One study investigated the accuracy of
CogTool results by comparing observed user performance results on middle sized
touch screen devices similarly with this study (Abdulin, 2011).
2.5 DISCUSSION OF THE LITERATURE REVIEW
Mobile phones have become an indispensable part of our daily lives and the use of
mobile applications has been increasing day by day. Therefore, developing efficient,
effective and user friendly mobile interfaces is important for the mobile users who
would like to reach information quickly and with the minimum number of errors.
Furthermore, it is seen that the number of usability studies in the field of mobile
application interfaces and the value of these studies are increasing every day. In
addition, studies using cognitive modeling method have proved the accuracy of this
method’s estimates for performance on interfaces. However, it is also seen that
cognitive modeling method is not a commonly used method when evaluating the
usability of touch screen mobile applications. Since there are not so many studies that
evaluate mobile application usability using the cognitive modeling method, there is a
need for revealing if the result of the cognitive modeling method is accurate on touch
screen mobile applications.
CogTool30%
KLM26%
GOMS24%
Other20%

11
In this study, the performance results obtained through cognitive modeling method on
applications running on touch screen mobile devices were compared with the
performance results of actual users. By investigating the similarities between two
performance data obtained from different usability methods, the accuracy of the result
of cognitive modelling method on mobile application interfaces was questioned.
Interpretation of the data obtained from this study will reveal if cognitive modeling is
suitable for use in the usability evaluation of touch screen mobile applications.

12
CHAPTER III
METHODOLOGY
This chapter provides an in-depth overview of the research design used in the present
study, the procedures of data collection and analysis as well as information about the
participants and the tasks they were assigned.
3.1 STUDY SETTING
In cooperation with Turkcell, which is the leading mobile phone operator in Turkey,
Turkcell Cüzdan application was selected as the mobile application to be analyzed in
terms of usability with two different usability testing methods, namely cognitive
modeling and end user performance tests. The criterion for the selection of the mobile
application was that it should be suitable for prototyping and user testing. This
application was installed on a smartphone with iOS operating system and during the
study there have not been any changes to the operating system, applications or the
smartphone per se.
In order to identify the tasks to be used in the study, a task analysis was conducted by
the researcher to find out the mostly-used features and the critical operations that could
be performed with the mobile application. At the end of the task analysis, 8 tasks were
generated and these selected tasks were practiced by the researcher. The researcher’s
performance in these tasks; that is, completion time and number of steps, were
recorded to be used for analysis.
Later on, 10 participants from the target audience of the application were recruited to
participate in end user tests. The participants were able to use a smartphone and they
had not used the designated application, Turkcell Cüzdan, before. Prior to conducting
the end user tests with the participants, a pilot study with 3 different participants was
conducted so as to eliminate and fix probable study failures and to clarify and edit the
tasks that might be misunderstood by the participants.
Since CogTool gives an estimate for the performance of skilled users, who are
supposed to have used the application at least once, this study was carried out in two
stages to compensate for the participants’ lack of experience in using the designated
mobile application. In their first encounter with the application, the participants were

13
asked to perform the 8 specified tasks and then they were informed of their
performance; that is, whether they performed the tasks correctly or not. If they had not
completed a task correctly, the participants were asked to explore the application in
order to find the desired information while performing the task. On average, users were
given a 10-minute period to explore the application. In their second encounter with the
application, the same participants, who were experienced with the application at that
time, were asked to complete the same 8 tasks again. Thus, two different results were
obtained for each participants: one as a novice user in the first stage and one as an
experienced user in the second stage.
End user performance tests were conducted in the Human Computer Interaction
Research and Application Laboratory at Middle East Technical University (METU).
The lab consists of a control room and a test room separated from each other by a one-
way mirror. During the tests, the steps which the participants followed to complete
each task on the mobile application were recorded with the help of two moving
camcorders. During the tests, the participants were free to use the smartphone however
they like: whether on the table (Figure 3) or in their hands (Figure 4). All of the tests
with the participants were conducted by the researcher. The participants performed the
tasks presented to them by the researcher one by one in the test room, while the
researcher observed the participants’ behaviors in the control room.
Figure 1 - Using Phone on the Table

14
Figure 2 - Using Phone in Users' Hand
As it is seen in the Figure 5, thanks to the design of the laboratory, the participants
could not see the researcher while the researcher had the ability to observe the
participants and the interface of the mobile phone. The researcher presented the tasks
verbally via a microphone one by one to the participants and asked them to complete
the stated tasks. The tasks were given to all participants in the same order. Turkcell 3G
connection was used during the tests.
Figure 3 - METU Human Computer Interaction Research and Application
Laboratory
The end user tests, including the first and second trials and the time given to the
participants in order for them to explore the application, took about 30 minutes in total
for each participant. The first test in which the participants used the application for the
first time took about 10 minutes and the second test in which the participants were
already familiar with the application took about 5 minutes. At the end of the study, the

15
participants were asked to fill out the Questionnaire for User Interaction Satisfaction
(QUIS) in order to measure their satisfaction level with the application.
In the second stage of the study, the Turkcell Cüzdan application was evaluated in
terms of usability with cognitive modeling method by using CogTool program. The
CogTool was used as a cognitive modeling program in this study since it is fast and
easy to construct a user interfaces with CogTool and the results can be interpreted
easily by researchers who have not any background about psychology. For this
purpose, the screenshots of the application were taken and each screen of the interface
for each step to be followed while performing the tasks was installed to CogTool.
Afterwards, widgets such as button, text, menu, etc. were defined on the screens loaded
for each interface as a background in the Frame window of CogTool (Figure 6).
Figure 4 - CogTool Frame Window
Using the widgets available in CogTool, the prototype of each screen of the application
used to execute the tasks was created. The widgets were placed on the prototype in
such a way that they are consistent with the real design of the application and that the
prototype looks like the real application. Then, transactions were defined for the
components, taking into consideration their actions and the changes they make on the
page when activated in the Design window of CogTool. For instance, which interface
will be opened when pressing a button was defined (Figure 7). By creating transactions
between prototypes, the steps required to complete a task were simulated as they were

16
in the real application. Moreover, the system response time for the activation of each
component was computed from the actual application and entered to CogTool.
Figure 5 - CogTool Design Window
After each interface was designed and its transaction was defined, 8 tasks were
demonstrated through the prototyped screens. After the demonstration, CogTool
estimated the completion time for each task. For tasks in which users took certain
actions without thinking, the ‘Think’ operations between steps were altered or
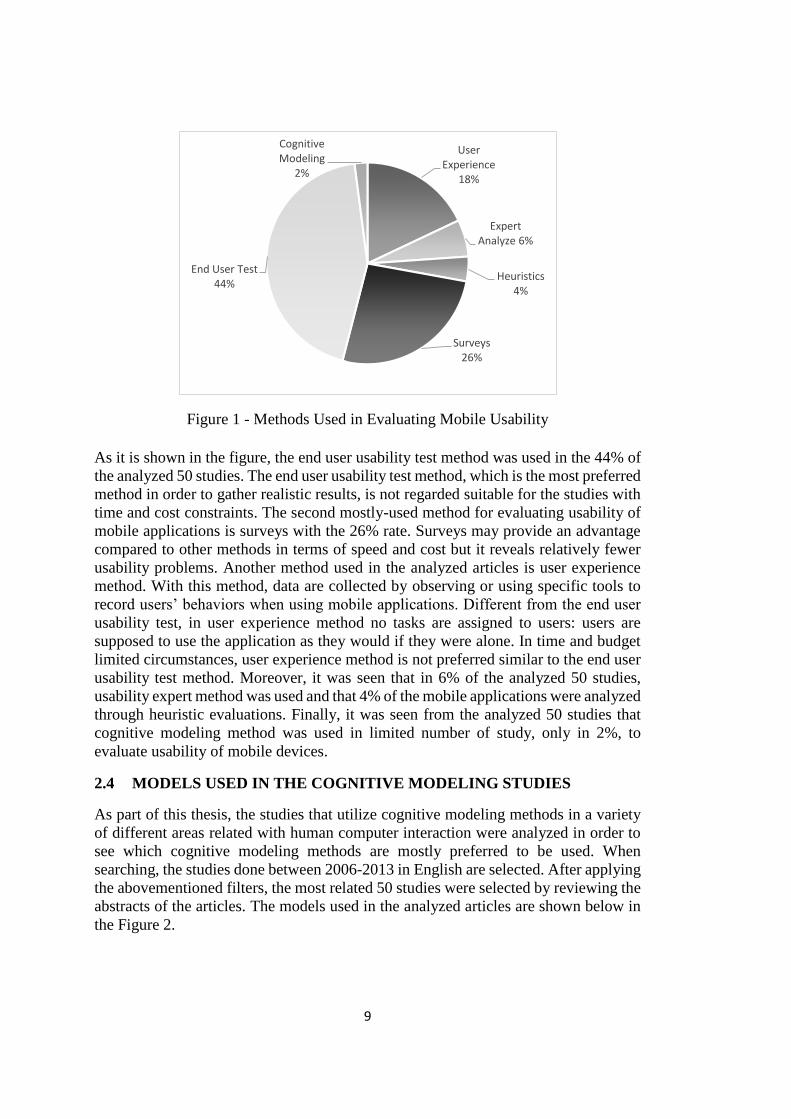
removed in the demonstration on the Script window of CogTool (Figure 8).
17
Figure 6 - CogTool Demonstration Script Window
As it was pointed out before, CogTool gives predicted task completion times for each
task in seconds after the demonstration of each task (Figure 9). In addition, on the
Visualization window of CogTool, the time of each separate step can be analyzed.
From this page, time required to perform each step was calculated in terms of
cognition, eye movement preparation-execution, vision encoding and motor behaviors.

18
Figure 7 - CogTool Project Window
The following timeline illustrates the processes completed throughout the study
(Figure 10).
Figure 8 - Timeline of the Methodology
3.2 DATA COLLECTION
For data collection, two different methods were employed. In the first method, the end
user usability testing, the participants were asked to complete the designated tasks one
by one on the mobile application selected for the study. The participants performed the
Deciding
on Tasks Pilot Test
Taking
Screenshots
of Interfaces
Running
Tasks on
CogTool
Selection
of
Participant
s
End-User
Test &
Survey
Creating
Prototypes
of
Interfaces
Analyzing
the
Results
Cognitive Modeling Method End-User Usability Test Method
Selection
of
Application

19
same tasks twice, but the results acquired from the first test were evaluated separately
as the participants used the application for the first time.
The results obtained from the first tests and the think-aloud process in which the
participants spoke out their opinions about the application while performing the tasks
are presented separately in Chapter IV under Results. The usability issues with the
selected mobile application were detected based on these results. The results of the
second tests, which were conducted after the participants were exposed to the
application and became familiar with it, were scrutinized step by step. The results of
the stepwise performance and overall performance durations were analyzed as a
timeframe in CogTool so that the results from the two methods could be compared.
In the second method, the cognitive modeling method, the graphical interface
components and actions of mobile application interfaces were modeled as they were
in the real application by using CogTool. Each task was executed on CogTool. . The
estimated performance results obtained from CogTool were analyzed step by step and
total time for each task was recorded.
Apart from end user performance tests and CogTool modeling, the QUIS
(Questionnaire for User Interaction Satisfaction) questionnaire, consisting of 39
questions in 4 main sections, was administered to the participants in order to collect
data about their opinions and satisfaction level with the selected mobile application.
The four main parts of the questionnaire are as follows: general user responses,
appearance of Turkcell Cüzdan application, terms used in Turkcell Cüzdan application
and learning the use of the Turkcell Cüzdan application.
3.3 DATA ANALYSIS
In order to analyze the videos recorded during the end user performance tests, ELAN
(EUDICO Linguistic Annotator) video analysis program was used (Figure 11). When
analyzing the video records, the time right after the researcher read the task and before
the participants’ first interaction with the smartphone was taken ass the first step time.
The time spent by the participants on each step of each task was calculated in this
fashion. The total time for each task was calculated by subtracting the time when the
participants began the task from the time at which the participants stated that they
completed the task. The times were recorded in mm:ss.SS (minute:second.split
second) format.

20
Figure 9 - ELAN Video Analysis Program
At the end of its computations, CogTool application gives an estimated completion
time for each task. In this study, the steps of each task were also examined individually
under the “Visualization” menu of CogTool. In addition to giving the total estimated
time to complete a task, CogTool also gives the opportunity to analyze the cognitive,
sensory and motor behavior of users while performing a task. It is possible to see the
start and finish time of the users’ eye movements, thinking duration and moving their
hand to an appropriate point for each step from the visualization page of CogTool
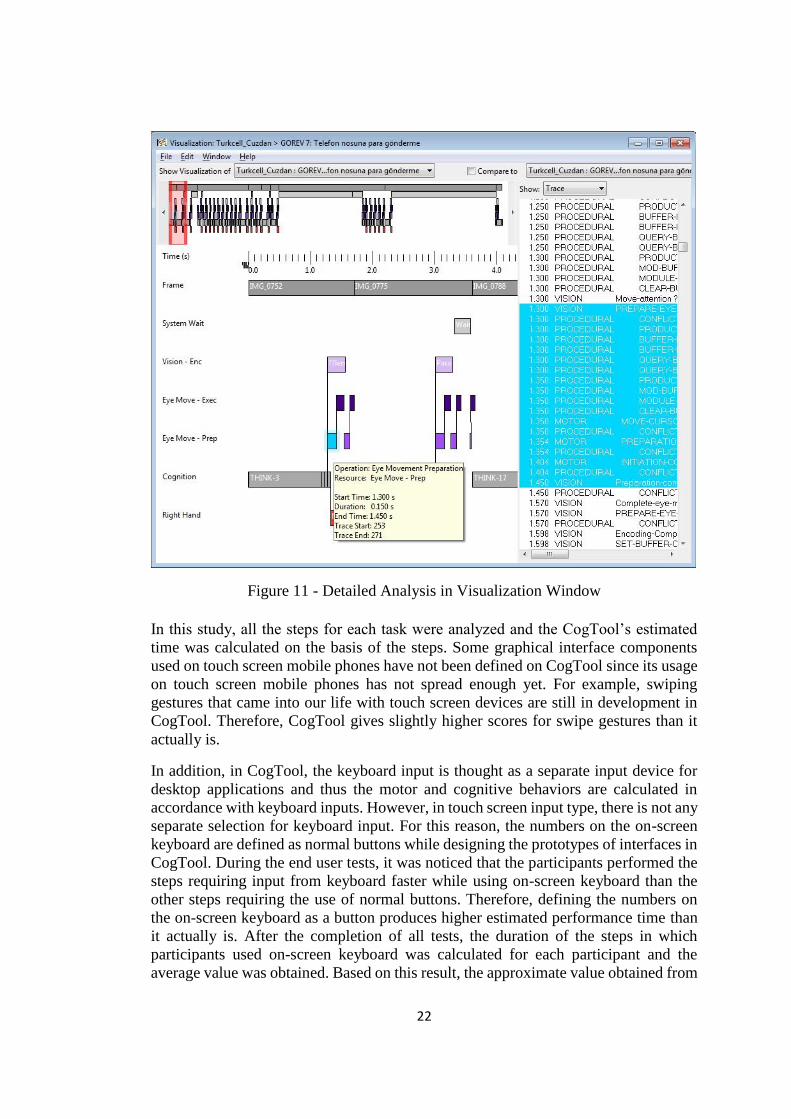
(Figure 12).

21
Figure 10 - CogTool Visualization Window
Furthermore, in visualization menu, the step can be analyzed in more detail by
examining each step of the task with respect to such titles as the system response time,
recognition of related graphical interface components, positioning eye to the
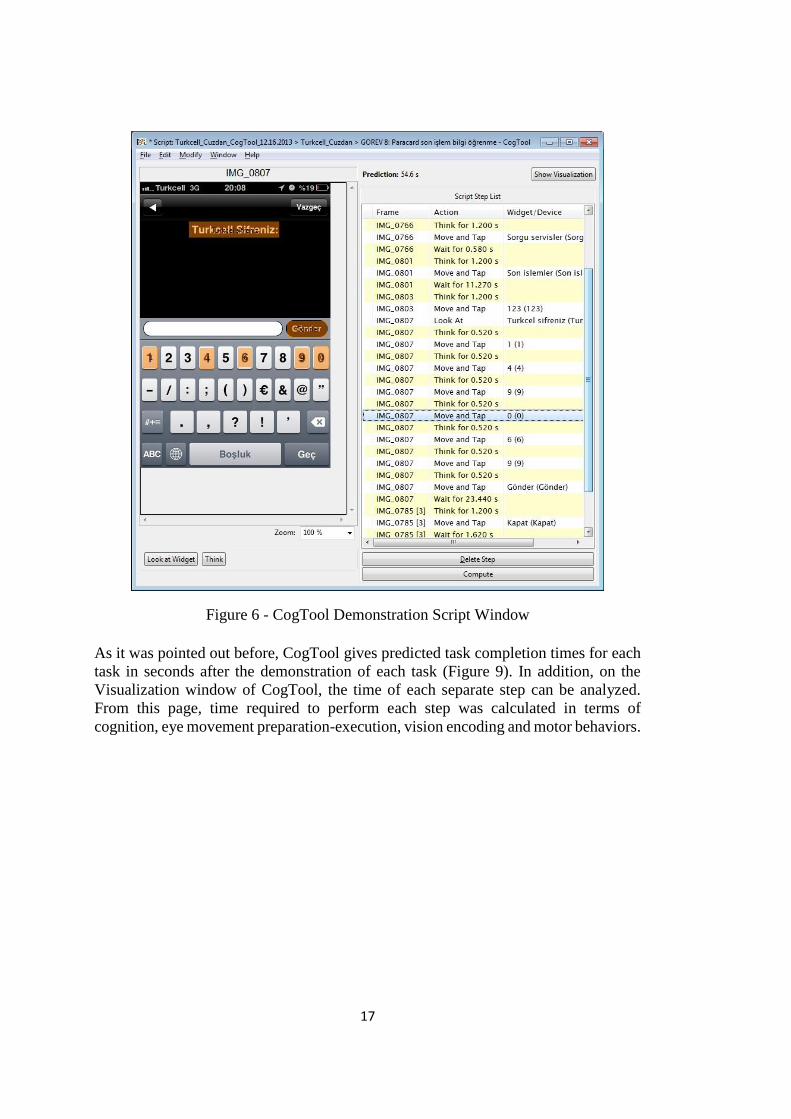
corresponding point and moving hand (Figure 13).
22
Figure 11 - Detailed Analysis in Visualization Window
In this study, all the steps for each task were analyzed and the CogTool’s estimated
time was calculated on the basis of the steps. Some graphical interface components
used on touch screen mobile phones have not been defined on CogTool since its usage
on touch screen mobile phones has not spread enough yet. For example, swiping
gestures that came into our life with touch screen devices are still in development in
CogTool. Therefore, CogTool gives slightly higher scores for swipe gestures than it
actually is.
In addition, in CogTool, the keyboard input is thought as a separate input device for
desktop applications and thus the motor and cognitive behaviors are calculated in
accordance with keyboard inputs. However, in touch screen input type, there is not any
separate selection for keyboard input. For this reason, the numbers on the on-screen
keyboard are defined as normal buttons while designing the prototypes of interfaces in
CogTool. During the end user tests, it was noticed that the participants performed the
steps requiring input from keyboard faster while using on-screen keyboard than the
other steps requiring the use of normal buttons. Therefore, defining the numbers on
the on-screen keyboard as a button produces higher estimated performance time than
it actually is. After the completion of all tests, the duration of the steps in which
participants used on-screen keyboard was calculated for each participant and the
average value was obtained. Based on this result, the approximate value obtained from

23
actual tests was entered into the thinking time on CogTool manually by the researcher
in the steps including the use of on-screen keyboard for such input operations as
entering phone number or password.
3.4 PARTICIPANTS
When selecting the participants for the study, the aim was to create a homogenous
group of people who had not used the mobile application, Turkcell Cüzdan, before,
were adept at using a smartphone and were experience with iOS operating system. 10
participants, including 5 women and 5 men were recruited for the study from the target
audience of the application. The target audience of the application includes the people
who use iPhone for a while and make financial transaction by using their smartphones.
The participants who recruited for this study were graduates of the Faculty of
Engineering and had their Master’s degree.
In order to see whether the technical knowledge of the participants affected the results
of the study, the pilot study was done with 3 participants before the actual tests. It was
observed that the ability to use the iOS operating system and touch screen smartphone
devices have an impact on the results but technical knowledge did not seem to have
such an effect.
Figure 12 - Age Distribution of Participants
The average age of 10 participants, aged between 25 and 33, is 28.6 (Figure 14).
Participants stated that they had used a smartphone for 2 years in average. 90% of the
participants reported that they connect to the Internet with mobile devices every day.
The demographics of the participants, including gender, age, education and the mobile
phone experience, are given below in the Table 1.
0
1
2
3
25 26 28 29 32 33
Fre
qu
ency
Age
24
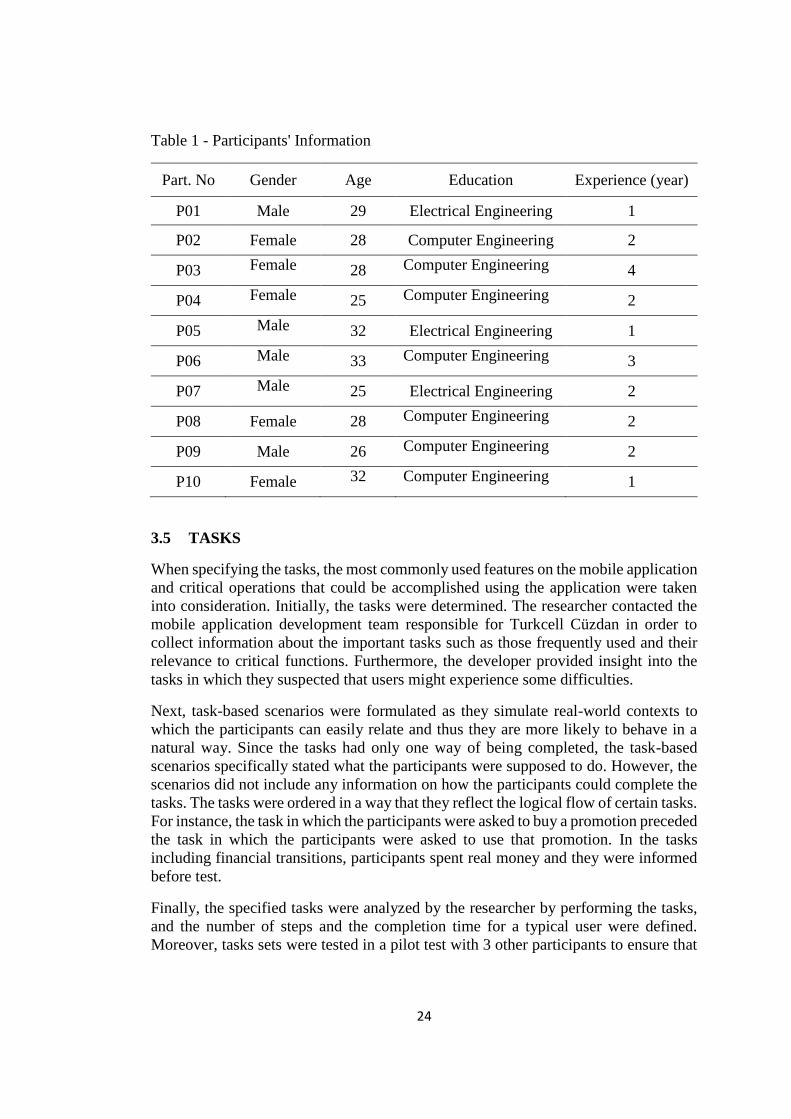
Table 1 - Participants' Information
Part. No Gender Age Education Experience (year)
P01 Male 29 Electrical Engineering 1
P02 Female 28 Computer Engineering 2
P03 Female 28 Computer Engineering 4
P04 Female 25 Computer Engineering 2
P05 Male 32 Electrical Engineering 1
P06 Male 33 Computer Engineering 3
P07 Male 25 Electrical Engineering 2
P08 Female 28 Computer Engineering 2
P09 Male 26 Computer Engineering 2
P10 Female 32
Computer Engineering 1
3.5 TASKS
When specifying the tasks, the most commonly used features on the mobile application
and critical operations that could be accomplished using the application were taken
into consideration. Initially, the tasks were determined. The researcher contacted the
mobile application development team responsible for Turkcell Cüzdan in order to
collect information about the important tasks such as those frequently used and their
relevance to critical functions. Furthermore, the developer provided insight into the
tasks in which they suspected that users might experience some difficulties.
Next, task-based scenarios were formulated as they simulate real-world contexts to
which the participants can easily relate and thus they are more likely to behave in a
natural way. Since the tasks had only one way of being completed, the task-based
scenarios specifically stated what the participants were supposed to do. However, the
scenarios did not include any information on how the participants could complete the
tasks. The tasks were ordered in a way that they reflect the logical flow of certain tasks.
For instance, the task in which the participants were asked to buy a promotion preceded
the task in which the participants were asked to use that promotion. In the tasks
including financial transitions, participants spent real money and they were informed
before test.
Finally, the specified tasks were analyzed by the researcher by performing the tasks,
and the number of steps and the completion time for a typical user were defined.
Moreover, tasks sets were tested in a pilot test with 3 other participants to ensure that
25
they were understandable and the orders of the tasks were meaningful. As a result of
the pilot tests, the tasks sets were improved and prepared for use in end user tests.
The finalized 8 tasks are given below with the help of the images taken by application
interface as well as the explanation of the steps in each task. What actions participants
were supposed to do was marked in red. In addition, the number of steps and the
expected completion time were calculated by the researcher and are presented below.
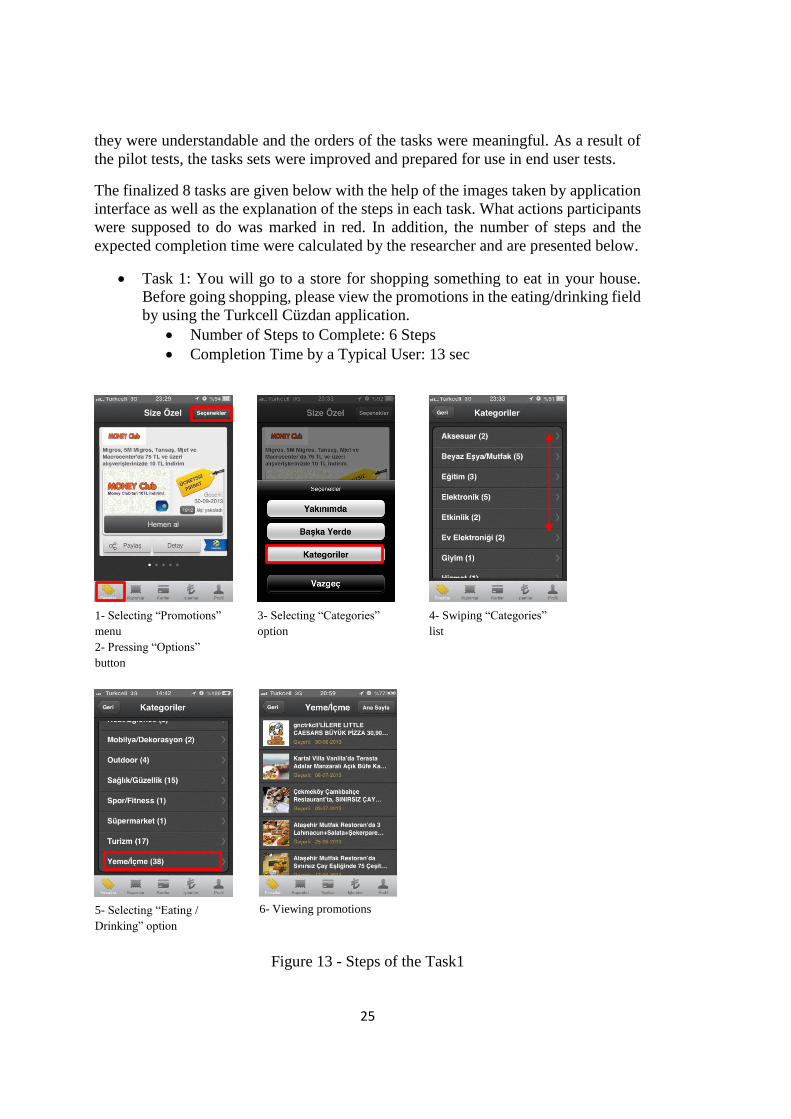
Task 1: You will go to a store for shopping something to eat in your house.
Before going shopping, please view the promotions in the eating/drinking field
by using the Turkcell Cüzdan application.
Number of Steps to Complete: 6 Steps
Completion Time by a Typical User: 13 sec
Figure 13 - Steps of the Task1
1- Selecting “Promotions”
menu
2- Pressing “Options”
button
3- Selecting “Categories”
option
4- Swiping “Categories”
list
5- Selecting “Eating /
Drinking” option
6- Viewing promotions

26
Task 2: You have seen from the application that there are lots of promotions
but you would like to know more about those which are available in the
supermarket close to your home. Please check the application to see if there is
any promotion in the supermarket nearby. If there is, please buy it.
Number of Steps to Complete: 7 Steps
Completion Time by a Typical User: 16 sec
Figure 14 - Steps of the Task2
1- Selecting “Promotions”
menu
2- Pressing “Options”
button
3- Selecting “Nearby”
option
4- Selecting
“Supermarket” option
7- Pressing “Ok” button 6- Pressing “Buy Now”
button
5- Selecting related
promotion

27
Task 3: You have done your shopping and you are waiting for payment. Please
use the promotion you have bought in your supermarket shopping.
Number of Steps to Complete: 3 Steps
Completion Time by a Typical User: 6 sec
Figure 15 - Steps of the Task3
Task 4: You have used all of your money in your GarantiParam card but you
still have money in your Paracard. In order to use your Paracard in your
shopping, you know that you should first prioritize it. Please prioritize your
Paracard so that it could be used primarily among your all cards.
Number of Steps to Complete: 5 Steps
Completion Time by a Typical User: 18 sec
1- Selecting “Coupon”
menu
2- Pressing “Use Now”
button
3- Pressing “Ok” button
2- Pressing on Paracard
3- Pressing “Setting”
button
1- Selecting the
“Paracard”

28
Figure 16 - Steps of the Task4
Task 5: You want to personalize the Turkcell Cüzdan application by creating
your profile. So, please add an existing photo to the application.
Number of Steps to Complete: 6 Steps
Completion Time by a Typical User: 15 sec
5- Pressing “Ok” button
4- Pressing “Prioritize”
button
2- Pressing “Personal
Information” button
3- Selecting the area of
photo
1- Selecting the “Profile”
menu

29
Figure 17 - Steps of the Task5
Task 6: Your mother told you that she had run out of credit in her phone and
that she could not call anyone. Please add 10 TL credits to your mother’s
phone.
Number of steps to Complete: 14 Steps
Completion Time by a Typical User: 65 sec
4- Pressing “Select from a
Library” button
5- Pressing “Select”
button
5- Selecting the photo
2- Pressing the “Add
Credits” icon
3- Pressing the phone
number field
1- Selecting the
“Operations” menu

30
4- Pressing the “+” icon
5- Selecting the contact
6- Selecting the number of
contact
7- Selecting the amount
field
8- Choosing the amount to
be added
9- Pressing the
“Continue” button
10- Pressing the “Accept”
button
11- Entering the card
password
12- Pressing the “Send”
button
31
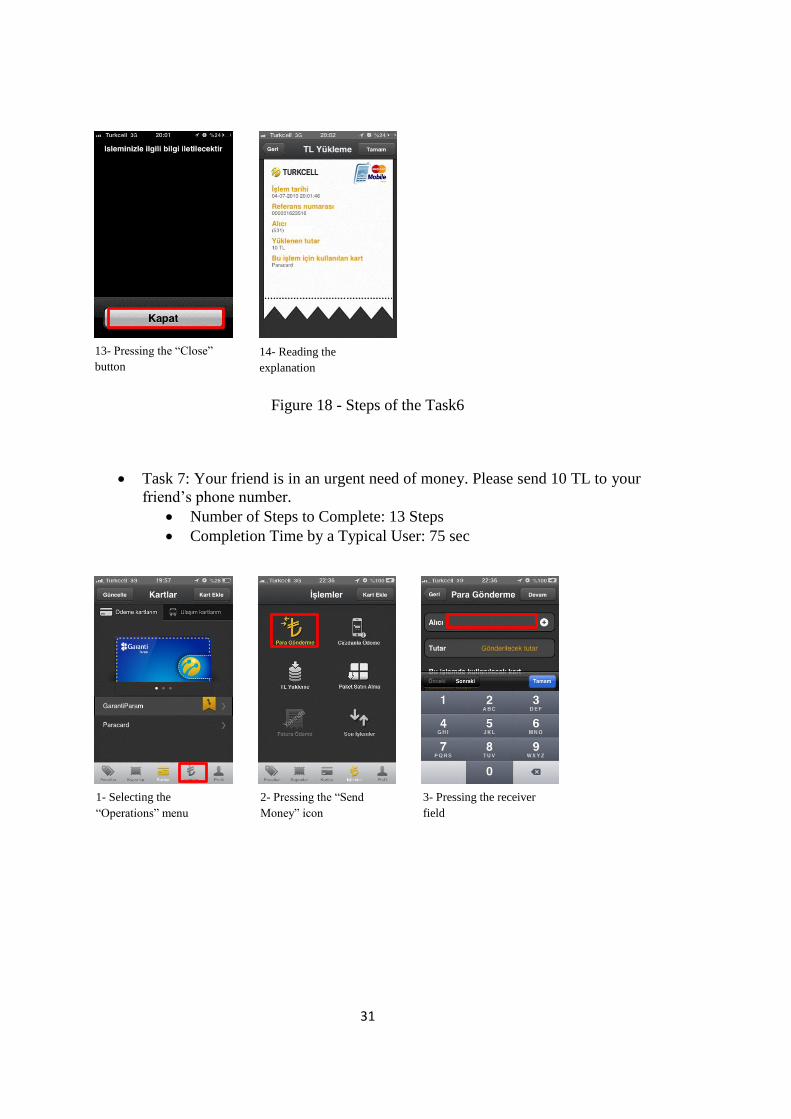
Figure 18 - Steps of the Task6
Task 7: Your friend is in an urgent need of money. Please send 10 TL to your
friend’s phone number.
Number of Steps to Complete: 13 Steps
Completion Time by a Typical User: 75 sec
14- Reading the
explanation
13- Pressing the “Close”
button
2- Pressing the “Send
Money” icon
3- Pressing the receiver
field
1- Selecting the
“Operations” menu

32
4- Entering the phone
number
5- Selecting the
“Amount” field
6- Entering the amount to
be sent
7- Pressing the “OK”
button
8- Pressing the
“Continue” button
9- Pressing the “Accept”
button
10- Entering the card
password
11- Pressing the “Send”
button
12- Pressing the “Close”
button

33
Figure 19 - Steps of the Task7
Task 8: You got confused which card you used for which action. So please
check the last actions of Paracard.
Number of Steps to Complete: 9 Steps
Completion Time by a Typical User: 56 sec
13- Reading the
explanation
2- Pressing on the
Paracard
3- Selecting the “Query
Services” button
1- Selecting the
“Paracard”

34
Figure 20 - Steps of the Task8
5- The opening of on-
screen keyboard
6- Entering Turkcell
password
4- Pressing the “Last
Actions” button
8- Pressing the “Close”
button
9- Reading the last actions
7- Pressing the “Send”
button


35
CHAPTER IV
RESULTS
All results obtained from this thesis study are presented under this chapter. The results
are interpreted under two main headings. The results obtained through CogTool and
skilled user usability tests are presented under “The Comparison of Skilled User
Usability Test and CogTool Results” heading. The results of the questionnaire
administered to the participants after the tests were presented under the “User
Satisfaction Survey” heading.
2.1 THE COMPARISON OF SKILLED USER USABILITY TEST AND
COGTOOL RESULTS
After the analysis, it was seen that the performance result of the skilled users on
usability tests and estimated performance results obtained from CogTool had
approximate values. Analysis results showed that for 8 tasks performed on mobile
application CogTool produced +/- 5 seconds close values to the actual values obtained
from skilled user usability tests. This result confirms that CogTool, which is easy to
use in terms of cost and time, is a suitable method to evaluate the usability of mobile
application interfaces and to use in the early stages of the application development
process. Due to the fact that CogTool can be used to model prototypes when the actual
application interfaces have not been designed yet, and that it gives close results to
actual performance values, it provides a fast and practical method to evaluate the
usability of different design ideas and prototypes during the development stage.
When the tasks are analyzed one by one on the basis of steps, it can be seen that the
results obtained from real users and CogTool differ more greatly than the results of the
total time of a task. One of the possible causes of this difference is that it is not possible
to calculate the thinking time of users through observations during the skilled user
usability tests. For that reason, while making comparisons between these two different
methods’ results, using the total task completion times gives more accurate results.
CogTool application is still under development for touch screen interface devices.
Therefore, the results for the swiping and on-screen keyboard are not satisfactory yet.
When the graphical interface components and transactions for swiping and on-screen
keyboard are added, +/- 5 seconds difference is expected to reduce. It is seen from the
tasks such as Task 3 and Task 4 that did not include these two actions, the deviation

36
value between two different methods’ results is under 1 second. In the tables below,
the results of CogTool for each steps of the tasks, the performance results of skilled
users obtained from usability tests and the comparisons of these two performance
results are given in the “minutes:seconds.split second” format. The differences
between the results were calculated by subtracting the real user performance data from
CogTool results.
As it is seen from the tables, the CogTool gives generally higher scores for
performance data than the actual users’ data. The (+) / (-) signs show the values of the
results. If the result is negative (-) this means that the real users performed the step or
the task in a longer time than CogTool’s estimated value. In the tables, the time for
each separate step in the tasks is given and the total values of these steps are given
under the “Total Time of Steps” row. Also, the total time spent in performing a task is
given under the “Total Time of Task” row. The total time values were calculated by
extracting the starting time of a task from its completion time.
2.1.1 TASK 1- Viewing promotions in the eating/drinking field
Table 1 - CogTool and User Performance Results of the Task1
Step
No Step Description
COGTOOL
Time
(mm:ss.SS)
USER
Time
(mm:ss.SS)
DIFFERENCES
Time
(mm:ss.SS)
Step 1 Selecting “Promotions”
menu 00:01.73 00:01.38 + 00:00.34
Step 2 Pressing “Options” button 00:01.83 00:01.80 + 00:00.03
Step 3 Selecting “Categories”
option 00:01.77 00:01.00 + 00:00.77
Step 4 Swiping “Categories” list 00:03.62 00:01.18 + 00:02.45
Step 5 Selecting
“Eating/Drinking” option 00:01.60 00:00.62 + 00:00.98
Step 6 Viewing of promotions 00:01.63 00:01.91 - 00:00.28
Total Time of Steps 00:12.18 00:07.89 + 00:04.29
Total Time of Task 00:12.61 00:11.93 + 00:00.68
As it is seen from the Table 2, the largest difference between different methods’
results is in the 4th step which includes swiping action. In order to formulate this
move in CogTool, the button-up and button-down actions were used. The use of
these two actions was offered in the forum page of CogTool by Bonnie E. John,
who is one of the creators of CogTool. However, as it is stated in the forum thread,
this method does not fully correspond to the performance data of actual behaviors.
When the steps in CogTool and the skilled user usability tests are analyzed, another
reason for the difference between the results obtained from the two methods is seen.
The users’ grip of the phone and the phone’s display size affect the position of the
user’s finger. Since the iPhone 3GS was used in the tests, the participants began the
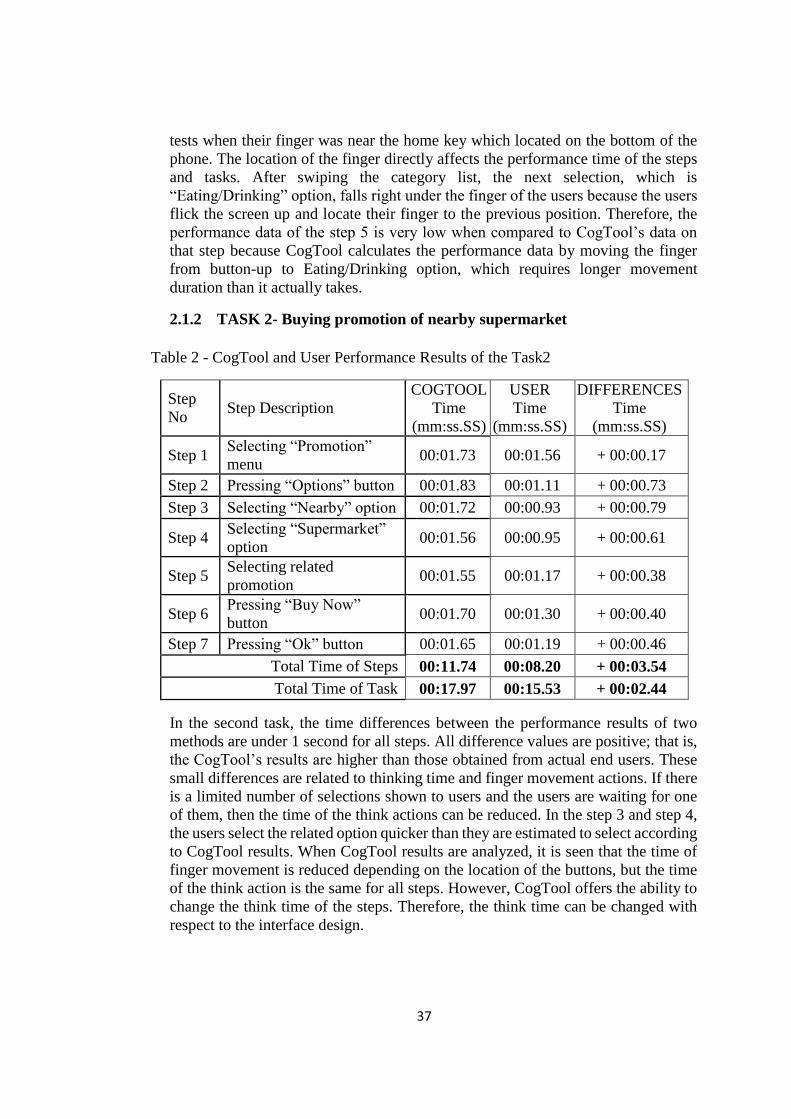
37
tests when their finger was near the home key which located on the bottom of the
phone. The location of the finger directly affects the performance time of the steps
and tasks. After swiping the category list, the next selection, which is
“Eating/Drinking” option, falls right under the finger of the users because the users
flick the screen up and locate their finger to the previous position. Therefore, the
performance data of the step 5 is very low when compared to CogTool’s data on
that step because CogTool calculates the performance data by moving the finger
from button-up to Eating/Drinking option, which requires longer movement
duration than it actually takes.
2.1.2 TASK 2- Buying promotion of nearby supermarket
Table 2 - CogTool and User Performance Results of the Task2
Step
No Step Description
COGTOOL
Time
(mm:ss.SS)
USER
Time
(mm:ss.SS)
DIFFERENCES
Time
(mm:ss.SS)
Step 1 Selecting “Promotion”
menu 00:01.73 00:01.56 + 00:00.17
Step 2 Pressing “Options” button 00:01.83 00:01.11 + 00:00.73
Step 3 Selecting “Nearby” option 00:01.72 00:00.93 + 00:00.79
Step 4 Selecting “Supermarket”
option 00:01.56 00:00.95 + 00:00.61
Step 5 Selecting related
promotion 00:01.55 00:01.17 + 00:00.38
Step 6 Pressing “Buy Now”
button 00:01.70 00:01.30 + 00:00.40
Step 7 Pressing “Ok” button 00:01.65 00:01.19 + 00:00.46
Total Time of Steps 00:11.74 00:08.20 + 00:03.54
Total Time of Task 00:17.97 00:15.53 + 00:02.44
In the second task, the time differences between the performance results of two
methods are under 1 second for all steps. All difference values are positive; that is,
the CogTool’s results are higher than those obtained from actual end users. These
small differences are related to thinking time and finger movement actions. If there
is a limited number of selections shown to users and the users are waiting for one
of them, then the time of the think actions can be reduced. In the step 3 and step 4,
the users select the related option quicker than they are estimated to select according
to CogTool results. When CogTool results are analyzed, it is seen that the time of
finger movement is reduced depending on the location of the buttons, but the time
of the think action is the same for all steps. However, CogTool offers the ability to
change the think time of the steps. Therefore, the think time can be changed with
respect to the interface design.

38
2.1.3 TASK 3- Using the promotion
Table 3 - CogTool and User Performance Results of the Task3
Step
No Step Description
COGTOOL
Time
(mm:ss.SS)
USER
Time
(mm:ss.SS)
DIFFERENCES
Time
(mm:ss.SS)
Step 1 Selecting “Coupon” menu 00:01.78 00:01.70 + 00:00.08
Step 2 Pressing “Use Now”
button 00:01.70 00:01.76 - 00:00.06
Step 3 Pressing “Ok” button 00:01.65 00:01.74 - 00:00.09
Total Time of Steps 00:05.13 00:05.73 - 00:00.23
Total Time of Task 00:06.81 00:07.07 - 00:00.26
Task 3 is the task having the smallest difference between the scores of two methods.
The system response time is quite low in this task and the design of the interfaces
is so simple that there is no distraction on the interface. Users see the coupon on the
screen and touch the "Use it" button after realizing that it is the correct coupon. The
results of the CogTool are quite close to the actual data in each step. The reason
why users’ performance is higher in the steps of this task when compared to other
tasks may be that users need to read a brief explanation shown on coupon and
confirmation window.
2.1.4 TASK 4- Prioritization of Paracard
Table 4 - CogTool and User Performance Results of the Task4
Step
No Step Description
COGTOOL
Time
(mm:ss.SS)
USER
Time
(mm:ss.SS)
DIFFERENCES
Time
(mm:ss.SS)
Step 1 Selecting the “Paracard” 00:01.76 00:02.34 - 00:00.58
Step 2 Pressing on the Paracard 00:01.55 00:01.44 + 00:00.11
Step 3 Pressing “Setting” button 00:01.61 00:01.43 + 00:00.18
Step 4 Pressing “Prioritize”
button 00:01.75 00:01.02 + 00:00.70
Step 5 Pressing “Ok” button 00:01.67 00:00.98 + 00:00.70
Total Time of Steps 00:08.35 00:07.21 + 00:01.13
Total Time of Task 00:18.45 00:17.89 + 00:00.56
In this task, different from the others, the first step’s performance time is higher in
actual users’ test results than CogTool’s estimates. The usability test conducted
with users showed that the participants were confused in the first two steps of this
task. The task required the participants to perform the same action twice but the
participants waited to see the result after the first step. Although the users did this
task for a second time, they were again confused, which led to an increase in the

39
performance data. This difference between two methods’ results shows that if there
are certain logical usability problems in the interface, the CogTool will not discover
those problems based on the estimates. However, in situations like this, CogTool
can be used to compare different interface designs, and consequently, to eliminate
unnecessary steps the users are made to go through.
In addition, if the confirmation page includes only a brief confirmation message,
users can perform the confirmation action very quickly. In some actions like
entering password or closing confirmation window by confirming, users do not
think before performing the action because they automatize this action by doing it
before over and over again. Therefore, in the step 5, the CogTool result can be
reduced by decreasing the think time.
2.1.5 TASK 5- Adding a Profile Photo
Table 5 - CogTool and User Performance Results of the Task5
Step
No Step Description
COGTOOL
Time
(mm:ss.SS)
USER
Time
(mm:ss.SS)
DIFFERENCES
Time
(mm:ss.SS)
Step 1 Selecting the “Profile”
menu 00:01.78 00:01.03 + 00:00.74
Step 2 Pressing “Personal
Information” button 00:01.76 00:01.21 + 00:00.54
Step 3 Selecting the area of photo 00:01.55 00:00.83 + 00:00.72
Step 4 Pressing “Select from a
Library” button 00:01.72 00:00.97 + 00:00.75
Step 5 Selecting the photo 00:01.65 00:01.02 + 00:00.63
Step 6 Pressing “Select” button 00:01.81 00:00.81 + 00:01.00
Total Time of Steps 00:10.27 00:05.88 + 00:04.39
Total Time of Task 00:13.74 00:11.64 + 00:02.10
Adding a photo to the user’s profile page is different from other tasks in the way
the task is complete. In order to add a photo to an application in iPhone, users need
to follow a certain path and this is generally the same for all applications. Therefore,
the participants were familiar with and skilled for this task. This type of actions
which users do by rote should be analyzed carefully and the think time should be
changed in CogTool appropriately. The difference between two methods’ results
may be high because of the discrepancy in the think time resulting from users’
tendency to do certain actions by rote.

40
2.1.6 TASK 6- Adding units to a contact’s account
Table 6 - CogTool and User Performance Results of the Task6
Step
No Step Description
COGTOOL
Time
(mm:ss.SS)
USER
Time
(mm:ss.SS)
DIFFERENCES
Time
(mm:ss.SS)
Step 1 Selecting the “Operations”
menu 00:01.77 00:01.66 + 00:00.11
Step 2 Pressing the “Add Units”
icon 00:01.62 00:02.13 - 00:00.51
Step 3 Pressing the phone number
field 00:01.67 00:01.16 + 00:00.51
Step 4 Pressing the “+” icon 00:01.58 00:01.56 + 00:00.02
Step 5 Selecting the contact 00:01.55 00:01.37 + 00:00.18
Step 6 Selecting the number of
contact 00:01.55 00:00.86 + 00:00.69
Step 7 Selecting the amount field 00:01.55 00:00.98 + 00:00.57
Step 8 Choosing the amount to be
added 00:01.55 00:00.59 + 00:00.96
Step 9 Pressing the “Continue”
button 00:01.60 00:01.56 + 00:00.04
Step 10 Pressing the “Accept”
button 00:01.88 00:01.45 + 00:00.43
Step 11 Entering the card password 00:04.06 00:04.27 - 00:00.21
Step 12 Pressing the “Send” button 00:01.38 00:00.83 + 00:00.55
Step 13 Pressing the “Close” button 00:01.67 00:00.49 + 00:01.18
Step 14 Reading the explanation 00:01.30 00:01.85 - 00:00.55
Total Time of Steps 00:24.73 00:20.76 + 00:03.97
Total Time of Task 01.05.23 01:04.57 + 00:00.66
Although the Task 6 consists of 14 steps, the difference between the results of two
methods is quite low. CogTool uses the location of finger when calculating
movement duration of the finger between two points. It calculates the differences
between two locations of finger in two steps. However, in calculation of the think
time, CogTool does not take into account the complexity of the interface; it just
gives the average think time for the actions. In steps 6-7-8, the graphical interface
components are placed quite close to each other. As a result, CogTool gives lower
performance results for these steps. Think time is another factor to consider for
these steps. When performing the step 6, users are faster to act because there is not
any component in the interface to select. This issue is prevalent for all the steps.
Hence, if there are a limited number of components in the screen, the results
estimated through CogTool can be approximated to those of the actual tests with
users by decreasing the think time in CogTool.

41
In addition, the step 2 has a reverse situation. In this step, the users determine which
action is the correct one and select it among five other actions. In the steps including
decision making process the think time increases for actual users. Consequently,
the think time of these steps should be increased in CogTool, as well.
The other result obtained from comparisons is pertaining to the system wait time.
In Task 6, the system waits for approximately 20 seconds before step 13 and this
gives users some time to think about the next action and place their finger to the
appropriate location. Since users already know the next screen they are waiting for
is the information page, they get ready to press “Close” button. For this reason, the
difference between the performance results for this step is quite high. In order to
decrease the difference between two methods in this type of steps performed right
after system wait is over, the think time should be deleted.
2.1.7 TASK 7- Sending money to the phone number
Table 7 - CogTool and User Performance Results of the Task7
Step
No Step Description
COGTOOL
Time
(mm:ss.SS)
USER
Time
(mm:ss.SS)
DIFFERENCES
Time
(mm:ss.SS)
Step 1 Selecting the “Operations”
menu 00:01.78 00:01.37 + 00:00.41
Step 2 Pressing the “Send Money”
icon 00:01.67 00:01.37 + 00:00.30
Step 3 Pressing the receiver field 00:01.55 00:01.11 + 00:00.44
Step 4 Entering the phone number 00:09.95 00:08.54 + 00:01.41
Step 5 Selecting the “Amount”
field 00:01.72 00:00.67 + 00:01.05
Step 6 Entering the amount to be
sent 00:02.11 00:01.41 + 00:00.70
Step 7 Pressing the “OK” button 00:01.06 00:00.63 + 00:00.43
Step 8 Pressing the “Continue”
button 00:01.78 00:01.08 + 00:00.70
Step 9 Pressing the “Accept”
button 00:01.45 00:01.29 + 00:00.16
Step 10 Entering the card password 00:04.06 00:04.07 - 00:00.01
Step 11 Pressing the “Send” button 00:01.04 00:00.54 + 00:00.50
Step 12 Pressing the “Close” button 00:01.67 00:00.43 + 00:01.24
Step 13 Reading the explanation 00:01.30 00:01.71 - 00:00.41
Total Time of Steps 00:31.14 00:24.23 + 00:06.91
Total Time of Task 01:17.93 01:12.78 + 00:05.15
Task 7 has the largest difference between CogTool’s and actual user’s performance
time. According to the Table 8, the highest scores in the steps 4-12. While modeling

42
these steps including number input through on-screen keyword on CogTool, the
question was asked to one of the creators of CogTool, Bonnie E. John. Based on
her feedback, a button widget was placed on each key. However, the problem in
entering number is that users see the number they will enter next from the paper
given to them by the researcher and thus they do not need to think before acting.
Therefore, in some cases like this think operation should be deleted or changed, as
pointed out by Bonnie E. John. Especially in entering password step the think
operation should be deleted since users are quite skilled at entering their password.
The reason for the large difference in step 12 is the same as step 13 in Task 6. The
difference values are higher in the steps following the system wait.
2.1.8 TASK 8- Checking the last actions of Paracard
Table 8 - CogTool and User Performance Results of the Task8
Step
No Step Description
COGTOOL
Time
(mm:ss.SS)
USER
Time
(mm:ss.SS)
DIFFERENCES
Time
(mm:ss.SS)
Step 1 Selecting the “Paracard” 00:01.76 00:01.44 + 00:00.32
Step 2 Pressing on the Paracard 00:01.55 00:01.34 + 00:00.21
Step 3 Selecting the “Query
Services” button 00:01.55 00:01.35 + 00:00.20
Step 4 Pressing the “Last Actions”
button 00:01.68 00:01.03 + 00:00.65
Step 5 The opening of on-screen
keyboard 00:01.72 00:02.69 - 00:00.97
Step 6 Entering Turkcell password 00:06.06 00:06.23 - 00:00.17
Step 7 Pressing the “Send” button 00:00.89 00:00.83 + 00:00.06
Step 8 Pressing the “Close” button 00:01.67 00:00.44 + 00:01.23
Step 9 Reading the last actions 00:01.30 00:03.92 - 00:02.62
Total Time of Steps 00:18.18 00:19.27 - 00:01.09
Total Time of Task 00:54.58 00:59.58 - 00:05.00
This task is different from others in that the difference between the total times of
the results of two methods is high but negative. This negative difference arose from
steps 5-9. The reason why users performed the step 5 in such a long time is that
they looked at the password given to them in paper during this step and they tried
to keep it mind. These two actions, which are looking password and opening
keyboard, could not be separated from each other easily. Therefore, the time to
complete step 5 is higher in actual end user tests than is it estimated by CogTool.
The biggest difference is seen in step 9. Throughout the tasks, while performing the
steps including reading action, users generally have high performance time. For
reading action, the “look at” operator was used but this operator itself is not
sufficient for the reading action. After the “look at” operator, the think operator
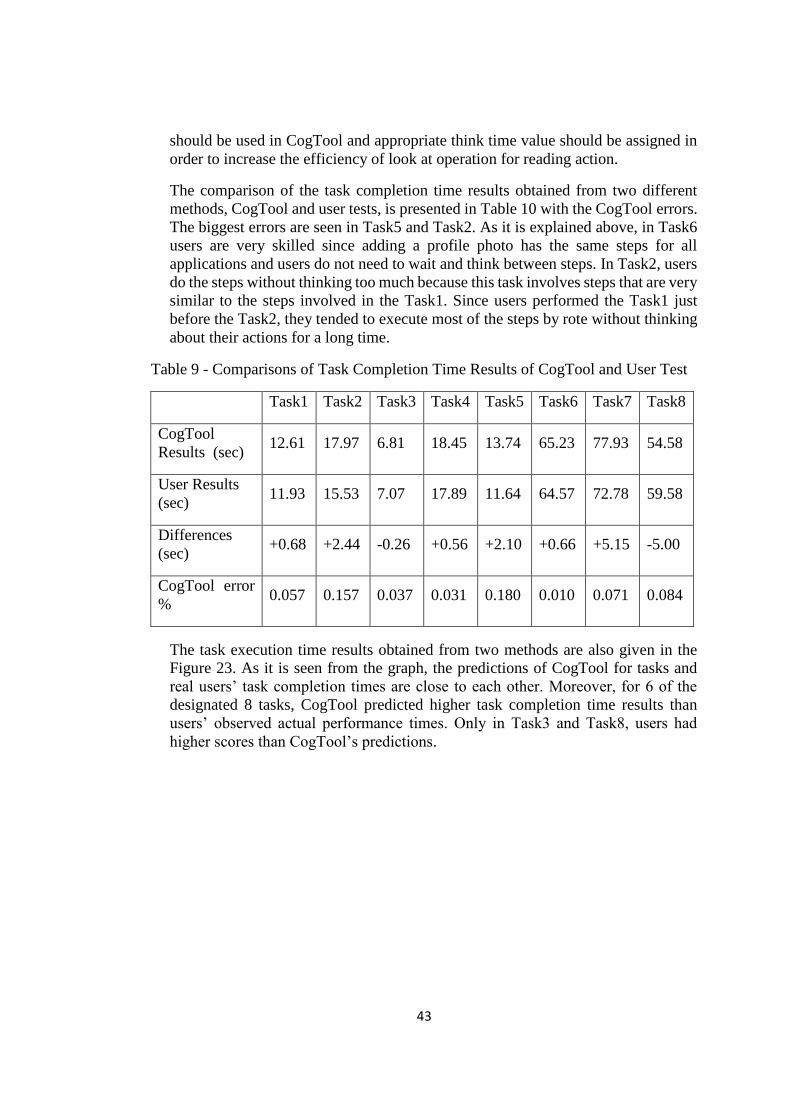
43
should be used in CogTool and appropriate think time value should be assigned in
order to increase the efficiency of look at operation for reading action.
The comparison of the task completion time results obtained from two different
methods, CogTool and user tests, is presented in Table 10 with the CogTool errors.
The biggest errors are seen in Task5 and Task2. As it is explained above, in Task6
users are very skilled since adding a profile photo has the same steps for all
applications and users do not need to wait and think between steps. In Task2, users
do the steps without thinking too much because this task involves steps that are very
similar to the steps involved in the Task1. Since users performed the Task1 just
before the Task2, they tended to execute most of the steps by rote without thinking
about their actions for a long time.
Table 9 - Comparisons of Task Completion Time Results of CogTool and User Test
Task1 Task2 Task3 Task4 Task5 Task6 Task7 Task8
CogTool
Results (sec) 12.61 17.97 6.81 18.45 13.74 65.23 77.93 54.58
User Results
(sec) 11.93 15.53 7.07 17.89 11.64 64.57 72.78 59.58
Differences
(sec) +0.68 +2.44 -0.26 +0.56 +2.10 +0.66 +5.15 -5.00
CogTool error
% 0.057 0.157 0.037 0.031 0.180 0.010 0.071 0.084
The task execution time results obtained from two methods are also given in the
Figure 23. As it is seen from the graph, the predictions of CogTool for tasks and
real users’ task completion times are close to each other. Moreover, for 6 of the
designated 8 tasks, CogTool predicted higher task completion time results than
users’ observed actual performance times. Only in Task3 and Task8, users had
higher scores than CogTool’s predictions.
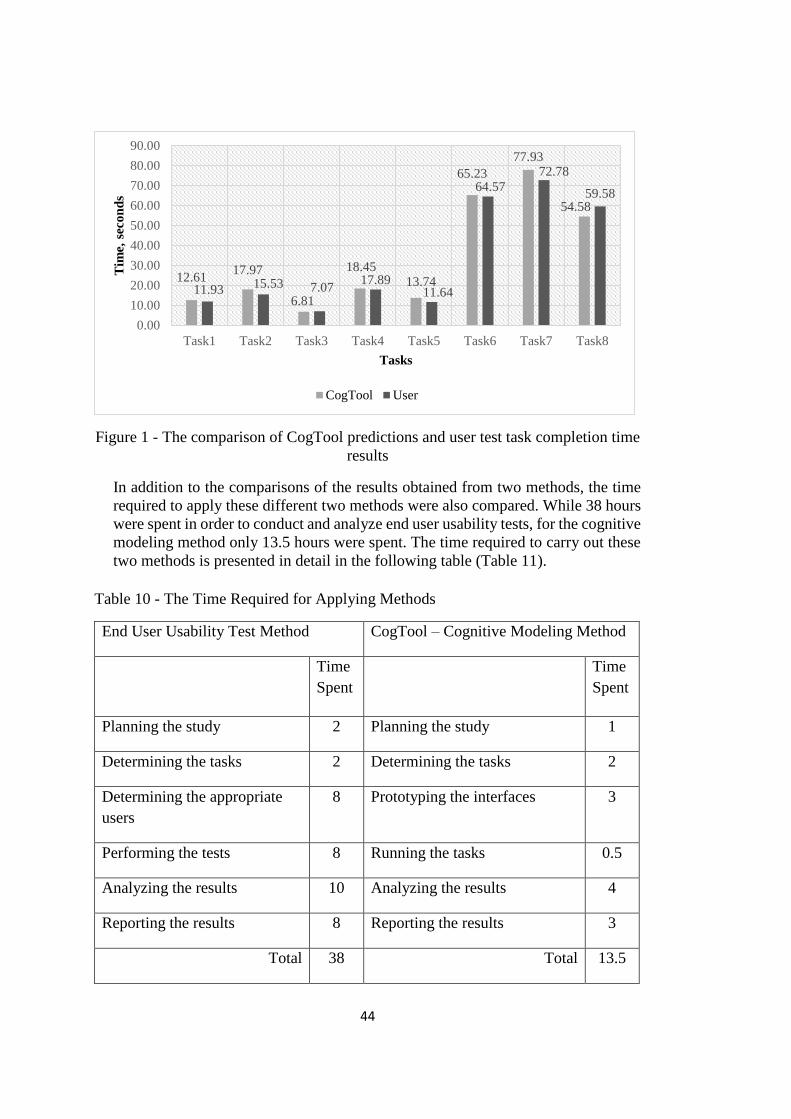
44
Figure 1 - The comparison of CogTool predictions and user test task completion time
results
In addition to the comparisons of the results obtained from two methods, the time
required to apply these different two methods were also compared. While 38 hours
were spent in order to conduct and analyze end user usability tests, for the cognitive
modeling method only 13.5 hours were spent. The time required to carry out these
two methods is presented in detail in the following table (Table 11).
Table 10 - The Time Required for Applying Methods
End User Usability Test Method CogTool – Cognitive Modeling Method
Time
Spent
Time
Spent
Planning the study 2 Planning the study 1
Determining the tasks 2 Determining the tasks 2
Determining the appropriate
users
8 Prototyping the interfaces 3
Performing the tests 8 Running the tasks 0.5
Analyzing the results 10 Analyzing the results 4
Reporting the results 8 Reporting the results 3
Total 38 Total 13.5
12.6117.97
6.81
18.4513.74
65.23
77.93
54.58
11.9315.53 7.07
17.8911.64
64.57
72.78
59.58
0.00
10.00
20.00
30.00
40.00
50.00
60.00
70.00
80.00
90.00
Task1 Task2 Task3 Task4 Task5 Task6 Task7 Task8
Tim
e, s
eco
nd
s
Tasks
CogTool User

45
As it can be seen from the Table 11, conducting usability tests with end users
required almost 3 times more time than the time spent in performing cognitive
modeling method. With the cognitive modeling method, the approximate value of
the actual users’ task completion time on application is gathered. This provides
researchers with information on how much time users will spend in performing the
same tasks on different interface designs. It is possible to evaluate the usability of
prototypes by using CogTool in the very early stages of development even when
the interface has not been designed yet. Thus, the potential usability problems that
might exist in the application can be discovered and fixed at the very beginning of
the application’s development stage.
2.2 USER INTERACTION SATISFACTION QUESTIONNAIRE
In this section, the result of the questionnaire administered to the participants after the
usability tests to find out their satisfaction level about the interface is presented and
evaluated. By using CogTool, it is not possible to learn the satisfaction level of users
directly - only the estimated performance data can be collected with CogTool. Yet,
according to the results of CogTool, if there are tasks involving many steps and taking
a long time, it may be possible to estimate that users will have a low level of
satisfaction on these areas of the application.
In this study, the QUIS questionnaire (The Questionnaire for User Interaction
Satisfaction) was used. The questions were altered in accordance with mobile
application characteristics. The questionnaire distributed to the participants is attached
to Appendix A. In the questionnaire, the participants were asked to rate the application
based on the given criteria on a scale from 1 to 9. The questionnaire consists of 4 main
sections and 39 questions. The sections of the questionnaire are as follows: Overall
Reaction to the Application, Application Interface, Terminology and System
Information, and Learning sections.
2.2.1 Overall Reaction to the Application
In this section, the participants were asked to evaluate the Turkcell Cüzdan
application in a general way. When the score of the 10 participants were analyzed
together, the application got 5.3 out of 9 (58.9 out of 100).
Table 11 - Result of the Overall Reaction to Application Section of the
Questionnaire
Section/Questions Average
(9-scale)
Average
(100-scale)
Overall Reaction to the Application 5.3 58.9
This section included 6 criteria to evaluate the users’ satisfaction. The users rated
their lowest satisfaction level with the application in this section of the
questionnaire. When the scores are analyzed, it is seen that the users found the

46
application dull and rigid. It is hard to deduce the users’ satisfaction level in this
way from the results of CogTool as these pertain to the users’ opinions about the
colors and the page layout of the application.
2.2.2 Application Interface
In this section, of the participants were asked to evaluate the font and size, page
layout, links, images, icons and colors used in interface. The scores of this section
in 9-scale and 100-scale are given in the table below.
Table 12 - Results of Application Interface Section of the Questionnaire
Section/Questions Average
(9-scale)
Average
(100-scale)
Font Size 7.0 77.8
Page Layout 6.6 73.3
Transitions Between Pages 6.9 76.7
Images and Icons 7.1 78.9
Colors 6.6 73.3
Mean 6.8 75.6
In this section, the users evaluated the colors and page layout of the application with
a low score of satisfaction level. In addition, the transitions between pages were
given a low score by the users. By using the estimated performance results from
CogTool, the satisfaction level related with transitions between pages may be
estimated. The number of the steps of a task and the estimated task completion time
can be used to interpret the users’ satisfaction level with the transitions between
pages in the application. If the number of the steps of a task and the estimated
performance time are high, then it is possible to conclude that users will be
dissatisfied with this aspect of the application.
2.2.3 Terminology and System Information
Naming of the page, links and icons are evaluated in this section of the
questionnaire. In addition, the evaluation of the on-screen messages for giving
information about completion action or for making aware users about the error was
done in this section. In addition, feedback messages and error messages raised by
the application on the screen were evaluated in this section. The scores of this
section in 9-scale and 100-scale are given in the table below.

47
Table 13 - Results of Terminology and System Information Section of the QUIS
Section/Questions Average
(9-scale)
Average
(100-scale)
Terms Used 7.1 78.9
Messages that Appear on the Screen 7.2 80.0
Inform Users 6.8 75.6
Error Messages 6.4 71.1
Mean 6.9 76.7
In this section of the questionnaire, the users rated the error messages given by the
application with the lowest score. They stated that error messages did not inform
the users of what they should do. Therefore, the information amount was
insufficient in error messages, according to the users. Moreover, the questions
related with the application’s informing users were rated with a low score by the
users. In this subsection, there are 3 questions about connection time, predictable
consequences of actions and the application’s informing users. User satisfaction
level about this section can also be estimated by using CogTool results. When
prototyping the interactions of the application on CogTool, the system response
time is also considered. If this time is high, it could be concluded that users’
satisfaction level will decrease.
2.2.4 Learning
In the last section, the participants were asked to evaluate how easily they could
learn to operate the application, explore the features of the system, recall and
perform the tasks without wasting time. The scores of this section in 9-scale and
100-scale are given in the table below.
Table 14 - Results of Learning Section of the Questionnaire
Section/Questions Average
(9-scale)
Average
(100-scale)
Learning to Operate System 7.5 83.3
Exploring the Features of the System 7.3 81.1
Recall 8.0 88.9
Performing Task 7.0 77.8
Mean 7.5 83.3
The users rated this section of the questionnaire with the highest score. This means
that the users thought that learning and recalling the actions of application was easy.
It may be possible to reach the same conclusion by using the results obtained from
CogTool. Analyzing the steps of the tasks, the location of the graphical interface
components with similar functions, the ease of learning and recalling the functions
of the application can be interpreted. If similar tasks are performed in similar ways,

48
it can be said that learning the application and recalling its functions will be easy.
CogTool gives estimated performance time for each step. It can be seen from the
CogTool results that similar steps, such as viewing options, include similar
operations and have almost the same performance time results. This result
corresponds to the result of users’ satisfaction level acquired from the
questionnaire.
2.3 SUMMARY OF THE RESULTS
The results of thesis study has been obtained from two different studies. In the first
study CogTool and skilled user usability test results were compared with each other
in terms of task completion time. In the second study, results of the questionnaire
giving participants after usability test were analyzed and interpreted whether users’
satisfaction level is evaluated with cognitive modeling predictions or not. The
results of this thesis are summarized below.
The biggest difference between different methods’ results is in the step
including swiping action.
In some actions like entering password or closing confirmation window by
confirming, users does not think before doing action because they memorize
this action by doing it before number of time. Therefore, the think operation
time is higher according to actual performance time.
In the steps including decision making process the think time increases for
actual users therefore think operation time of CogTool becomes insufficient.
In the steps including reading action users have generally high performance
time. For reading action the look at operator was used but this operator could
not meet the reading action.
Time spending for applying usability test was 38 hours while it was 13.5
hours for using cognitive modeling method.
According to results of questionnaire, users found application dull and rigid.
Satisfaction level of users on this way cannot be deduced with the CogTool
estimation.
Satisfaction level related with transitions between pages may be estimated
by using CogTool results. It is possible to interpret that users will be
dissatisfied with high task execution time, system response time and many
number of steps.
Similarities between the tasks completion ways of similar tasks may
increase satisfaction level of users by making easy to learn navigation on
interface.

49
CHAPTER V
DISCUSSION & CONCLUSION
This chapter presents the discussion of the results obtained through two different
usability methods, which are end user usability tests and cognitive modeling. The
conclusion of the study is also presented in this chapter. Moreover, this chapter
concludes by presenting directions and recommendations for future research as well
as the limitations of this study.
3.1 DISCUSSION
Mobile phones have become an indispensable part of our daily lives with the rapid
developments in technology. Now, a phone is not only a device to make phone calls
or send text messages to someone, but it is also a device including various applications
for business transactions, entertainment, surfing the Internet etc. However, this fast
rise in the number of functions introduced a design challenge for small screens.
Besides, as Dumas and Redish (2004) state, people use products to be productive and
they mark a product “usable” by evaluating it in terms of time required to do what they
want, the number of steps to complete a task and the success they reach by doing what
they think is right. Moreover, users are busy people trying to accomplish what they
want with the minimum amount of effort possible. Therefore, usability is an important
factor for users when they are purchasing a product. There is a growing demand for
user friendly mobile phones because usability provides many benefits that companies
cannot afford to ignore. For example, users need customer support and assistance less
if their phone is intuitive to use and they are willing to use the variety of features and
the services offered by phones. Also, with user-friendly phones, the satisfaction level
of users increases (Jokela, Koivumaa, Pirkola, Salminen & Kantola, 2005).
Consequently, mobile application designers need to focus on their users during the
development process of an application to increase their product’s usability.
As Nielsen (2008) specified, there are various methods to evaluate and improve the
usability of a product. The most commonly used methods to evaluate the usability of
products are user based usability tests, heuristic evaluations and survey methods.
Cognitive modeling, which gives a prediction of task completion times based on
specified operators, is another method used to evaluate the usability of a product. User
50
based usability test method is the most basic and useful one among other methods since
the data are collected directly from real users (Nielsen, 2012). However, conducting
usability tests with end users is costly. This is also true for the heuristic evaluation
method: The greater the number of experts employed to evaluate a product for its
usability is, the greater the number of usability problems identified is. Nevertheless,
the cost of the heuristic evaluations will also increase with the number of usability
experts (Desurvire et al., 1992). Survey is a practical and quick method to gather
subjective data directly from users, but it can reveal fewer usability problems when
compared to other methods (Holzinger, 2005). Additionaly, Cognitive modeling
method has some advantages over other techniques. For instance, it can be conducted
without the implementation of interface and it does not need real users to compute task
execution times. In addition, cognitive modeling method is cheaper to implement, and
it can be used during the initial phases of design and development (Gokam, Devanuj,
Lobo, Gore, Doke & Kimbahune, 2011).
In the literature, there is a myriad of studies investigating the usability of mobile
applications with different methods. Based on the literature review conducted for this
thesis study, in most of the studies, end user usability test method was used, but
cognitive modeling method was not preferred to evaluate the usability of mobile
applications. In addition, during the literature review, the studies using cognitive
modeling methods were investigated. It was seen that 30% of the studies were done by
using CogTool and 26% of were conducted with mobile phones but there is limited
number of study in which cognitive modeling method is used to evaluate the usability
of touch screen mobile phones. There is a study done by Abdulin (2011) in which
CogTool is used to model middle-sized touch screens such as iPad and the results are
compared with the actual users’ results. Nonetheless, the number of the study using
cognitive modeling for 3.5 inches touch screens in the literature is very limited.
The results of this study have been used to answer the following research questions:
RQ1- Does cognitive modeling method yield similar results to those of end user
performance tests in the usability evaluation of touch screen mobile applications?
This study investigated the accuracy of task execution times predicted by CogTool,
which is a cognitive modeling tool, by comparing them with the results obtained from
actual users’ performance on a touch screen smartphone. In this study, 8 goal-specified
tasks were used in end user tests, and the same tasks were modeled and demonstrated
in CogTool. The analysis was done on the basis of the steps. The participants’ actual
performance data, which are video records of the tests, were examined with ELAN
video analysis program step by step. Each step of the tasks was also examined in the
visualization window of CogTool. The results obtained from two methods were
compared on the basis of steps and total execution time. The comparison results are
shown below in the Table 16.

51
Table 15 - The Comparison of CogTool predictions and user test task completion time
results
Task1 Task2 Task3 Task4 Task5 Task6 Task7 Task8
CogTool
Results (sec) 12.61 17.97 6.81 18.45 13.74 65.23 77.93 54.58
User Results
(sec) 11.93 15.53 7.07 17.89 11.64 64.57 72.78 59.58
Differences
(sec) +0.68 +2.44 -0.26 +0.56 +2.10 +0.66 +5.15 -5.00
CogTool error
% 0.057 0.157 0.037 0.031 0.180 0.010 0.071 0.084
The results of this study indicated that CogTool prediction error for mobile application
interfaces on touch screens is less than 20%. As it is seen in the table, there are large
differences between CogTool errors on the basis of tasks. Task2 and Task5 have the
largest CogTool error value. The error values for other tasks are less than 5%. This
result suggests that the tasks including steps with which users are highly experienced
have the highest prediction errors. By decreasing or removing think operator from this
type of tasks, the accuracy of the prediction can be increased. When CogTool think
operator time in Task2 is reduced to half; that is 0.6 sec in, CogTool’s prediction time
decreases to 15.00 sec from 17.97 sec. and prediction error decreases to 0,034 from
0,157. The way Task2 is completed is very similar to that of the Task1, which users
completed just before the Task2. Therefore they do not need to wait between actions.
When the think operator is modified in the same fashion for the Task5, the prediction
error decreases to 0.077 from 0.180. This result complies with the result of a study in
the literature which found out that CogTool could accurately predict task execution
time with less than 8% error on handheld devices (Luo, 2005).
The results of this study show that CogTool gives generally higher predictions than
observed user performance data on touch screen phones. This result is in agreement
with the study conducted by Abdulin (2011), using CogTool to model middle-sized
touch screen devices. That study also supports that CogTool gives higher task
execution time predictions on touch screen devices. In that study, the prediction error
was less than 2%. However, the CogTool prediction error was found to be higher in
the present study and in the other study done by Luo (2005) by using small-sized touch
screen. These results indicate that CogTool’s prediction’s accuracy reduces with
decreasing size of touch screen devices.
According to these results, the answer to the research question is positive: cognitive
modeling method gives similar results with end user performance results in usability
evaluation of touch screen mobile applications. However, the results show that user
behaviors should be analyzed carefully and the time of the think operation in CogTool
should be altered accordingly. It should be decreased or removed when the task is a
task the users perform frequently and thus know very well, such as entering their
52
password. It should be increased when the users need to compare or select among
several choices.
RQ2- To what extent is cognitive modeling method suitable to evaluate the
performance aspect of usability on touch screen mobile applications?
The results of this study showed that cognitive modeling method produced good
estimates of skilled users’ performance time on touch screen mobile devices. Earlier
studies conducted by Abdulin (2011) and Luo (2005) have also similar results
regarding the accuracy of cognitive modeling method on touch screen mobile devices.
However, with the developments in touch screen technology, new concepts have come
to our lives, such as swiping. The CogTool does not have any actions or graphical
interface components to correspond to this gesture. New actions and graphical
interface components should be added to cognitive modeling method to meet the
requirements for new gestures introduced to our lives with the advent of touch screen
devices.
In addition, the satisfaction questionnaire was administered to the participants after the
usability tests and the results of this questionnaire were given by associating them with
the CogTool results. The results of this study show that with the CogTool results, it is
possible to measure some factors affecting satisfaction to some certain extent. The long
completion time for the steps, tasks and system wait time point to a low satisfaction
level with the application since users easily get bored when the time required to
complete a task increases. Also, the similarities between the ways similar tasks are
completed make it easier to learn the application and thus increase the satisfaction
level.
These results indicate that cognitive modeling gives useful results for the usability
evaluation of touch screen mobile devices. However, as John (1995) stated CogTool
gives skilled users’ performance prediction. Skilled users are expected to perform tasks
without pausing to think what they will do; they are expected to have already mastered
the specified tasks. Therefore, CogTool should be used in suitable situations. If the
system is for novice users who will see application for the first time and need to search
around what they will do next, then the cognitive modeling is not an appropriate
method.
Furthermore, according to John (2011) cognitive modeling has been generally used to
compare alternative interface design quantitatively; not to explore usability problems
or make design recommendations. Nevertheless, different from other modeling
methods, CogTool produces a timeline from which modeler can analyze what a user
would see, think, and do to perform a task on a user interface. Therefore, the timeline
produced by CogTool can be used to analyze an interface in terms of its usability.
Due to the fact that CogTool gives accurate estimates on touch screen mobile devices
except some special cases such as swiping, and that it is possible to evaluate some
factors affecting user satisfaction with CogTool, the answer to the research question 2
53
is: cognitive modeling can be used for the usability evaluation of touch screen mobile
interfaces. However, the usage purpose of the interface, user profile and tasks should
be appropriate to be tested with cognitive modeling.
RQ3- What is the optimum usability method that can guide the development of
touch screen mobile applications?
As John et al. (2004) assert, CogTool has an advantage over end user testing method
in terms of time and cost. During this study, it was observed that user testing required
almost 3 times more time than performing cognitive modeling method. This result is
in agreement with the study conducted by Nielsen and Phillips (1993) in which
cost/benefit analyses were done for five different usability methods. The two of the
methods were cognitive modeling and user testing methods. The cost results was
calculated by estimating hourly cost of various types of staff such as usability
specialist, research assistant etc. Nielsen and Phillips (1993) also found that user
testing was 2.8 times as expensive as the cognitive modeling, which is one of the
cheapest usability methods. The other study which explores the cost and benefits of
predictive human performance modeling revealed that CogTool is less costly to learn
and apply even for people who do not have any psychological background, which
decreases the cost even more (John & Jastrzembski, 2010).
In addition, cognitive modeling is a beneficial method for early evaluation of user
interface designs (Jastrzembski & Charness, 2007). It is possible to use CogTool even
when only the prototypes of the interface have been designed. For this reason,
developers can use CogTool before the actual implementation of the user interface
only with their design ideas. A study conducted for assessing the usability of real world
software development in IBM shows that the quantitative results of CogTool allow
researchers to take into account the usability issues in the development process
(Bellamy, John & Kogan, 2011). User testing still seems to be the best method for
getting direct information from users but it is difficult to apply this method before an
interface has been designed and implemented. Moreover, this study shows that
cognitive modeling gives estimation of user performance with less than 8% error rate
when think operation is modified according to user behavior on touch screen mobile
interfaces. Also, cognitive modeling is better than user testing in terms of cost
efficiency and it is possible to use CogTool before an interface has been designed and
implemented. Therefore, based on these results, it can be said that cognitive modeling
method is the optimum usability method to be used during the development stage of
touch screen mobile interfaces.
3.2 CONCLUSION
The results of this study indicate that CogTool can be used to evaluate the usability of
small-sized touch screen mobile application interfaces. CogTool prediction error value
in measuring users’ performance was less than 20% but, with the modification
suggested in this study, this error rate was reduced to 8%. Based on these results,
CogTool prediction error can be minimized by assigning appropriate time value to the
think operation after the demonstration of the tasks. In addition, the results of this study
54
reveal that CogTool’s think operation time is high for the users using small-sized touch
screen phones except the steps including decision-making among several choices.
Moreover, this study shows that CogTool falls short of providing tools and elements
for such new concepts as swiping that were introduced to our lives with touch screen
devices. In CogTool button up-down features are used for swiping but this does not
fully meet the interaction requirements for the swiping action. A new implementation
is required for the swiping action in CogTool. Also, if there is information or
explanation users have to read to execute a specified task, the time of the think
operation should be increased or reading action should be added to the CogTool. The
current actions of the CogTool do not correctly reflect the reading process.
This study also shows that performing cognitive modeling on CogTool is easier than
performing user testing. In order to evaluate the usability of touch screen mobile
application interfaces with CogTool, in this study, 13.5 hours were spent while 38
hours were required to conduct the end user usability tests. After an hour of practice,
CogTool can be used by people who do not have any experience with cognitive
modeling. To be able to interpret the results of CogTool, modelers do not need to have
a background in psychology. Therefore, the designers and programmers can use
CogTool easily to model their user interfaces in order to see how much time is required
by users to accomplish a task or to compare different design ideas. CogTool can be
used in the early stages of user interface design processes since there is no need to have
a fully functional interface implemented: even prototypes can be modeled and
evaluated in terms of usability on CogTool.
This study also reveals that CogTool can be used to measure user satisfaction to some
extent by predicting some factors affecting the level of user satisfaction. As the
execution time of a task increases, users get bored, and this leads to a decrease in user
satisfaction level. What is more, the similarities between the ways similar tasks are
completed make it easy for users to learn how to navigate through the interface and
thus increase the user satisfaction level.
3.3 CONTRIBUTION OF THE STUDY
In the past, mobile phones were used to make phone calls, send text messages, etc;
however, with the advancements in mobile technology, mobile phones have morphed
into smartphones with various capabilities that were once deemed impossible, making
them an inseparable part of our everyday lives. Moreover, human computer interfaces
are being made more and more tactile: touch screen technology is being rigorously
applied to such interfaces. Therefore, there is an increasing demand for increasing the
usability of such mobile interfaces and designing user-friendly interfaces in order for
manufacturers to compete with others in the market as it is highly acknowledged that
usability is an important factor for uses while purchasing a product. To evaluate the
usability of interfaces, there are various methods, including end user testing, heuristic
evaluations, survey methods and cognitive modeling. Of all these methods, cognitive
modeling is regarded as the easiest one to use and it requires less resources and
expertise when compared to the other methods. Hence, the accuracy of the predictions

55
produced by cognitive modeling for the usability evaluation of touch screen mobile
phone interfaces should be investigated.
This study contributes to the Human Computer Interaction literature by explaining the
accuracy of the predictions of cognitive modeling on touch screen mobile devices. The
findings of this study show that CogTool, as a cognitive modeling method, can be used
to evaluate the usability of the interfaces of touch screen mobile devices as long as the
think operator is modified appropriately. Also, the study shows how easy CogTool is
to use to model mobile interfaces. These results can aid researchers and mobile
application developers in deciding which methods should be used to evaluate the
usability of mobile application under certain circumstances.
3.4 LIMITATION AND FURTHER RESEARCH
There are several limitations of this study. The first limitation of the study is related
with the users’ experience with the mobile application used in the study. CogTool
gives the skilled users’ task execution predictions. In order to make the participants
skilled users’ of the mobile application, they were asked to perform the same tasks
twice with 10 minutes interval and their performance results in the second trials were
used for comparisons with CogTool’s results. However, this might not suffice to safely
assume that the participants became skilled users of the mobile application in their
second trial. Therefore, it is recommended that further studies consider training the
participants before the study so that they have the opportunity to use and explore the
application for a longer time.
The second limitation of this study is with regards to the setting in which user tests
were conducted. The user tests were done in a usability laboratory, but the mobile
nature of mobile phones gives users the ability to use their phones on the go. Thus, it
is recommended that further studies conduct these user tests in the field where users
have mobility.
The final limitation is related with the order of the tasks. The tasks were given to users
in the order they were described in the scenarios but this brought about some negative
effects: users performed similar tasks by rote or without thinking before acting.
Therefore, it is recommended that future studies present the tasks to the users in mixed
order to eliminate potential order effects.
Further studies can be conducted with CogTool to model two design ideas for touch
screen applications and results can be compared with actual user performances. Also,
eye-tracking can be used in further studies to compare the usability issues obtained
from CogTool and eye tracking results.


56
REFERENCES
Abdulin, E. (2011, May). Using the keystroke-level model for designing user
interface on middle-sized touch screens. In Proceedings of the 2011 annual
conference extended abstracts on Human Factors in Computing Systems, (pp. 673-
686). Vancouver, BC, Canada.
Adio, O. D. (2013). Assessing the accuracy of task time prediction of an emerging
human performance modeling software – Cogtool (Unpublished master's thesis).
Louisiana State University, USA.
Anderson, J. R., Bothell, D., Byrne, M. D., Douglass, S., Lebiere, C., & Qin, Y.
(2004). An Integrated Theory of the Mind. Psychological Review, 111(4), 1036-
1060. doi: 10.1037/0033-295X.111.4.1036
Bellamy, R., John, B. E., & Kogan, S. (2011, May). Deploying CogTool:
Integrating quantitative usability assessment into real-world software development.
In Proceeding of the 33rd International Conference on Software Engineering, (pp.
691-700). New York, NY, USA.
Crystal, A., & Ellington, B. (2004, August). Task analysis and human-computer
interaction: approaches, techniques, and levels of analysis. In Proceedings of the
Tenth Americas Conference on Information Systems (p. 391). New York, NY, USA.
Çağıltay, K. (2011). İnsan Bilgisayar Etkileşimi ve Kullanılabilirlik Mühendisliği:
Teoriden Pratiğe. Ankara: ODTU Yayıncılık.
Deloitte. (2012). The State of the Global Mobile Consumer, Connectivity is Core.
Retrieved from
http://www2.deloitte.com/content/dam/Deloitte/global/Documents/Technology-
Media-Telecommunications/dttl_TMT_MobileConsumer_Final_171212.pdf
Desurvire, H., Kondziela, J., & Atwood, M. E. (1992, May). What is gained and
lost when using methods other than empirical testing. In Posters and short talks of
the 1992 SIGCHI conference on Human factors in computing systems (pp. 125-
126). New York, NY, USA.
57
Dumas, J. S., & Redish, J. C. (1999). A practical guide to usability testing. Exeter
UK: Intellect Books.
Heinath, M. & Urbas, L. (2007, September). Simplifying the Development of
Cognitive Models using a Pattern-based Modeling. In Proceeding of 10th
IFAC/IFIP/IFORS/IEA Symposium on Analysis, Design, and Evaluation of Human-
Machine Systems. Seoul, Korea.
Holzinger, A. (2005). Usability Engineering Methods for Software Developers.
Communication of the ACM. 48(1), 71-74.
International Organization for Standardization. (1998). ISO 9241-11: Ergonomic
Requirements for Office Work with Visual Display Terminals (VDTs): Part 11:
Guidance on Usability.
iSuppli. (2009). Touch-Screen Interfaces Continue to Drive Growth in Signage &
Professional Markets. Retrieved from http://www.isuppli.com/Abstract/Touch-
Screen-Interfaces-Continue-to-Drive-Growth-in-Signage-and-Professional-
Applications.pdf
Jastrzembski, T. S., & Charness, N. (2007). The Model Human Processor and the
older adult: parameter estimation and validation within a mobile phone task.
Journal of experimental psychology: applied, 13(4), 224-248.
Jeffries, R., & Desurvire, H. (1992). Usability testing vs. heuristic evaluation: was
there a contest?. ACM SIGCHI Bulletin, 24(4), 39-41.
John, B. E. (1995). Why GOMS?. Interactions, 2(4), 80–89.
John, B. E., & Kieras, D. E. (1996). Using GOMS for User Interface Design and
Evaluation: Which Technique?. ACM Transactions on Computer-Human
Interaction, 3(4), 287-319.
John, B. E., Prevas, K., Salvucci, D. D., & Koedinger, K. (2004, April). Predictive
human performance modeling made easy. In Proceedings of the SIGCHI
conference on Human factors in computing systems (pp. 455-462). New York, NY,
USA.

58
John, B. E., & Suzuki, S. (2009). Toward Cognitive Modelling for Predicting
Usability. In Proceedings of HCI International 2009 (pp. 267-276). San Diego, CA.
USA.
John, B. E. (2010). CogTool: Predictive Human Performance Modeling by
Demonstration. In Proceedings of the 19th Conference on Behaviour
Representation in Modeling and Simulation (pp. 83-84). Charleston, SC, USA.
John, B. E., & Jastrzembski, T. S. (2010, August). Exploration of costs and benefits
of predictive human performance modeling for design. In Proceedings of the 10th
International Conference on Cognitive Modeling (pp. 115-120). Philadelphia, PA,
USA.
John, B. E. (2011, May). Using predictive human performance models to inspire
and support UI design recommendations. In Proceedings of the SIGCHI Conference
on Human Factors in Computing Systems (pp. 983-986). Vancouver, BC, Canada.
Jokela, T., Koivumaa, J., Pirkola, J., Salminen, P., & Kantola, N. (2006). Methods
for quantitative usability requirements: a case study on the development of the user
interface of a mobile phone. Personal and Ubiquitous computing, 10(6), 345-355.
Kirakowski, J. (2000). Questionnaires in usability engineering. Human Factors
Research Group, Cork, Ireland.
Li, H., Liu, Y., Liu, J., Wang, X., Li, Y., & Rau, P.P (2010, April). Extended KLM
for Mobile Phone Interaction: A User Study Result. In CHI'10 Extended Abstracts
on Human Factors in Computing Systems (pp. 3517-3522). Atlanta, Georgia, USA.
Luo, L., & John, B. E. (2005, April). Predicting task execution time on handheld
devices using the keystroke-level model. In CHI'05 extended abstracts on Human
factors in computing systems (pp. 1605-1608). Portland, OR, USA.
Nielsen, J., & Phillips, V. L. (1993, May). Estimating the relative usability of two
interfaces: heuristic, formal, and empirical methods compared. In Proceedings of
the INTERACT'93 conference (pp. 214-221). Amsterdam, Netherlands.
Nielsen, J. (2005). Authentic Behavior in User Testing. Retrieved from
http://www.nngroup.com/articles/authentic-behavior-in-user-testing/
59
Nielsen, J. (2008). When to Use Which User Experience Research Methods.
Retrieved from http://www.nngroup.com/articles/which-ux-research-methods/
Nielsen, J. (2011), Defer Secondary Content When Writing for Mobile Users, from
http://www.useit.com/alertbox/mobile-content.html
Nielsen, J. (2011). Mobile Usability Update. Retrieved from
http://www.nngroup.com/articles/mobile-usability-update/
Nielsen, J. (2011). Mobile Content Is Twice as Difficult. Retrieved from
http://www.nngroup.com/articles/mobile-content-is-twice-as-difficult/
Nielsen, J. (2012). Usability 101: Introduction to Usability. Retrieved from
http://www.nngroup.com/articles/usability-101-introduction-to-usability/
Nielsen, J. (2012). How Many Test Users in a Usability Study. Retrieved from
http://www.nngroup.com/articles/how-many-test-users/
Rubin J. (1994). Handbook of Usability Testing: How to Plan, Design, and Conduct
Effective Tests. USA: John Wiley & Sons.
60
APPENDICES
APPENDIX A: Demographic Information Form (In Turkish)
KATILIMCI VERİLERİ
Katılımcı No:_________
Yaş: ______
Cinsiyet: Kadın: ___ Erkek ___
Eğitim: İlköğretim: __ Lise: __ Üniversite: __ Yüksek Lisans:__ Doktora:__ Diğer:_____
Öğrenim görmekte olduğunuz ya da mezun olduğunuz bölüm: ____________
Mesleğiniz:___________
Bilgisayar kullanma becerinizi nasıl tanımlıyorsunuz?
Kötü__ Ortalama__ İyi__ Çok iyi__ Diğer__________
Akıllı telefon kullanma becerinizi nasıl tanımlıyorsunuz?
Kötü__ Ortalama__ İyi__ Çok iyi__ Diğer__________
Yaklaşık ne kadar süredir akıllı telefon kullanıyorsunuz? _____

61
APPENDIX B: User Interaction Satisfaction Questionnaire - QUIS (In Turkish)
BÖLÜM 1 : Sistem Tecrübesi
1. Turkcell Cüzdan uygulamasını ne kadar sıklıkla kullanıyorsunuz?
Hiç kullanmadım__ Haftada bir__ Haftada birkaç kere__ Günde 1 defa__ Günde bir defadan
fazla__
BÖLÜM 2 : Genel Kullanıcı Tepkileri
Turkcell Cüzdan uygulaması kullanımından edindiğiniz izlenimleri yansıtan en uygun sayıyı
yuvarlak içine alınız. İlgili Değil = ID
2.1 Turkcell Cüzdan uygulaması hakkındaki
genel düşünceler
berbat
muhteşem
1 2 3 4 5 6 7 8 9 ID
2.2 tatmin edici değil tatmin edici
1 2 3 4 5 6 7 8 9 ID
2.3 sıkıcı motive edici
1 2 3 4 5 6 7 8 9 ID
2.4 zor kolay
1 2 3 4 5 6 7 8 9 ID
2.5 uygulama yeterince güçlü değil uygulama yeterince güçlü
1 2 3 4 5 6 7 8 9 ID
2.6 katı esnek
1 2 3 4 5 6 7 8 9 ID

62
BÖLÜM 3: Turkcell Cüzdan uygulamasının görünüşü
3.1 Ekrandaki karakterlerin okunması zor kolay
1 2 3 4 5 6 7 8 9 ID
3.1.1 Karakterlerin görüntüsü bulanık net
1 2 3 4 5 6 7 8 9 ID
3.1.2 Yazı tipi (font) okunaksız okunaklı
1 2 3 4 5 6 7 8 9 ID
3.2 Arayüz bileşenlerinin düzeni çok yardımcıydı hiç bir zaman her zaman
1 2 3 4 5 6 7 8 9 ID
3.2.1 Arayüzde görüntülenen bilgi miktarı
yetersiz
yeterli
1 2 3 4 5 6 7 8 9 ID
3.2.2 Bilginin ekranda yerleşimi mantıksız mantıklı
1 2 3 4 5 6 7 8 9 ID
3.3 Birbirini takip eden sayfalar kafa karıştırıcı düzenli
1 2 3 4 5 6 7 8 9 ID
3.3.1 Bağlantılar tıklandığında karşılaşılacak tahmin edilebilir değil tahmin edilebilir
arayüz (bir sonraki ekran görüntüsü) 1 2 3 4 5 6 7 8 9 ID
3.3.2 Birbirini takip eden arayüzlerde bir önceki imkansız kolay
arayüze dönmek 1 2 3 4 5 6 7 8 9 ID
3.3.3 Görevlerde istenilen bilgiye ulaşmak için karmaşık basit
izlenen yol 1 2 3 4 5 6 7 8 9 ID
3.4 Hareketsiz resimlerin ve fotoğrafların kalitesi kötü iyi
1 2 3 4 5 6 7 8 9 ID
3.4.1 Resimler ve fotoğraflar belirsiz belirgin
1 2 3 4 5 6 7 8 9 ID
3.4.2 Resim ya da fotoğrafların parlaklığı
bulanık
parlak
1 2 3 4 5 6 7 8 9 ID
3.5 Kullanılan renkler doğal değil doğal
1 2 3 4 5 6 7 8 9 ID
3.5.1 Var olan renklerin miktarı yetersiz yeterli
1 2 3 4 5 6 7 8 9 ID
Turkcell Cüzdan uygulamasının görünüşü hakkındaki görüşlerinizi lütfen aşağıdaki boş alana yazınız:
__________________________________________________________________________________
__________________________________________________________________________________
__________________________________________________________________________________
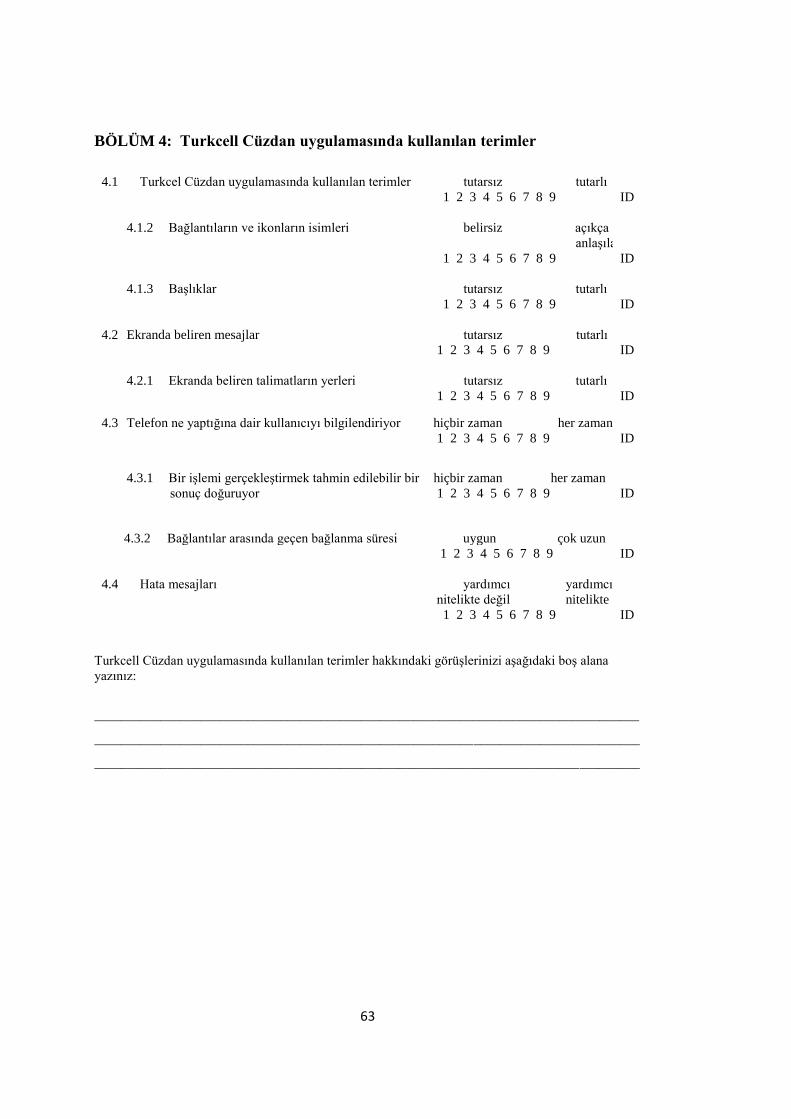
63
BÖLÜM 4: Turkcell Cüzdan uygulamasında kullanılan terimler
4.1 Turkcel Cüzdan uygulamasında kullanılan terimler tutarsız tutarlı
1 2 3 4 5 6 7 8 9 ID
4.1.2 Bağlantıların ve ikonların isimleri belirsiz açıkça
anlaşılabilir
1 2 3 4 5 6 7 8 9 ID
4.1.3 Başlıklar tutarsız tutarlı
1 2 3 4 5 6 7 8 9 ID
4.2 Ekranda beliren mesajlar tutarsız tutarlı
1 2 3 4 5 6 7 8 9 ID
4.2.1 Ekranda beliren talimatların yerleri tutarsız tutarlı
1 2 3 4 5 6 7 8 9 ID
4.3 Telefon ne yaptığına dair kullanıcıyı bilgilendiriyor hiçbir zaman her zaman
1 2 3 4 5 6 7 8 9 ID
4.3.1 Bir işlemi gerçekleştirmek tahmin edilebilir bir hiçbir zaman her zaman
sonuç doğuruyor 1 2 3 4 5 6 7 8 9 ID
5. 4.3.2 Bağlantılar arasında geçen bağlanma süresi uygun çok uzun
1 2 3 4 5 6 7 8 9 ID
4.4 Hata mesajları yardımcı
nitelikte değil
yardımcı
nitelikte
1 2 3 4 5 6 7 8 9 ID
Turkcell Cüzdan uygulamasında kullanılan terimler hakkındaki görüşlerinizi aşağıdaki boş alana
yazınız:
__________________________________________________________________________________
__________________________________________________________________________________
__________________________________________________________________________________

64
BÖLÜM 5: Sistem Kullanımını Öğrenme
5.1 Uygulamada gezinmeyi (navigation) öğrenmek zor kolay
1 2 3 4 5 6 7 8 9 ID
5.1.1 Başlangıç aşamasındaki öğrenme zor kolay
1 2 3 4 5 6 7 8 9 ID
5.1.2 Uygulamayı kullanmayı öğrenme zamanı kısa uzun
1 2 3 4 5 6 7 8 9 ID
5.2 Deneme yanılma yoluyla uygulamanın zor kolay
özelliklerini keşfetmek 1 2 3 4 5 6 7 8 9 ID
5.2.1 Uygulama özelliklerinin keşfi riskli güvenli
1 2 3 4 5 6 7 8 9 ID
5.2.2 Yeni özelliklerin keşfedilmesi zor kolay
1 2 3 4 5 6 7 8 9 ID
5.3 Kullanılan fonksiyonların kullanım zor kolay
şekillerini hatırlamak 1 2 3 4 5 6 7 8 9 ID
5.4 Verilen görevler doğrudan yerine asla as asla her zaman
getirilebiliyordu (oyalama olmadan) 1 2 3 4 5 6 7 8 9 ID
5.4.1 Yapılacak her iş için kat edilmesi çok fazla uygun sayıda
gereken aşamaların (adım) sayısı 1 2 3 4 5 6 7 8 9 ID
5.4.2 Bir işi bitirmek için takip edilen asla her zaman
adımlar mantıklı bir sırada 1 2 3 4 5 6 7 8 9 ID
Sistemin öğrenimi ile ilgili görüşlerinizi aşağıdaki boş alana yazınız:
__________________________________________________________________________________
__________________________________________________________________________________
__________________________________________________________________________________
__________________________________________________________________________________

65
APPENDIX C: Gönüllü Katılım Formu (In Turkish)
Bu çalışma, ODTÜ Bilişim Sistemleri Bölümü Yüksek Lisans öğrencisi Nihan OCAK
tarafından Prof. Dr. Kürşat ÇAĞILTAY danışmanlığında, ODTÜ’de yürütülen bir tez
çalışmasıdır. Çalışmanın amacı, kullanılabilirlik araştırma yöntemlerinden biri olan bilişsel
modelleme yönteminin mobil uygulamalar üzerinde etkinliğini gerçek kullanıcılardan gelen
sonuçlarla karşılaştırarak ortaya çıkarmaktır. Çalışmaya katılım tamamen gönüllülük
temelinde olmalıdır. Çalışma sırasında, sizden gerçekleştirmenizi istediğimiz görevleri mobil
uygulama üzerinde uygularken el hareketleriniz ve sesiniz performans sonuçlarını çıkarmak
için kayıt altına alınacaktır. Yapılacak bu son kullanıcı kullanılabilirlik testi ve sonrasında size
verilecek olan memnuniyet anketinde sizden kimlik belirleyici hiçbir bilgi istenmemektedir.
Ayrıca cevaplarınız tamamen gizli tutulacak ve sadece araştırmacılar tarafından
değerlendirilecek olup; elde edilecek bilgiler bilimsel yayımlarda kullanılacaktır.
Son kullanıcı kullanılabilirlik testi ve test sonrası uygulanacak memnuniyet anketi genel olarak
kişisel rahatsızlık verecek durum, görev ve sorular içermemektedir. Ancak, katılım sırasında
ortamdan, görevlerden, sorulardan ya da herhangi başka bir nedenden ötürü kendinizi rahatsız
hissederseniz çalışmayı yarıda bırakıp çıkmakta serbestsiniz. Böyle bir durumda çalışma
sorumlusuna çalışmayı tamamlamadığınızı söylemek yeterli olacaktır. Çalışma sonunda, bu
çalışmayla ilgili sorularınız cevaplanacaktır. Bu çalışmaya katıldığınız için şimdiden teşekkür
ederiz.
Çalışma hakkında daha fazla bilgi almak için Bilişim Sistemleri Bölümü öğrencisi Nihan
OCAK (Bilgi İşlem Daire Başkanlığı 109 Nolu Oda (Köprü Kat), ODTÜ, 06800; Tel: 0312
210 33 57 E-posta: [email protected] ) ile iletişim kurabilirsiniz.
Bu çalışmaya tamamen gönüllü olarak katılıyorum ve istediğim zaman yarıda kesip
çıkabileceğimi biliyorum. Verdiğim bilgilerin bilimsel amaçlı yayımlarda kullanılmasını
kabul ediyorum. (Formu doldurup imzaladıktan sonra uygulayıcıya geri veriniz).
İsim Soyad Tarih İmza
----/----/-----

66
APPENDIX D: Katılım Sonrası Bilgi Formu (In Turkish)
Bu çalışma Enformatik Enstitüsü Bilişim Sistemleri öğrencisi Nihan OCAK tarafından
yürütülmekte olan bir tez çalışmasıdır. Bu çalışmada, mobil uygulamalar üzerinde son
kullanıcı kullanılabilirlik testi ve bilişsel modelleme yöntemlerinin sonuçları karşılaştırmalı
olarak sunularak bu yöntemlerin mobil uygulamalar üzerindeki etkinlikleri incelenecektir.
Son kullanıcı kullanılabilirlik testi, kullanıcılar test edilen ürünü verilen görevler
doğrultusunda kullanırken gözlemlenerek veri toplanması yöntemiyle gerçekleştirilmektedir.
Bu yöntemle gerçek kullanıcılardan ürünü nasıl kullandıkları ile ilgili direk bilgi almak
mümkün olduğundan kullanılabilirlik araştırmalarında kullanılan en basit ve verimli metot
olarak görülmektedir. Ancak, son kullanıcılarla test yapmak testi planlamak, görevleri
belirlemek, uygun kullanıcıların belirlenerek ayarlanması, kullanıcılarla testin
gerçekleştirilmesi, sonuçların analiz edilmesi ve raporlama gibi uzun zaman ve fazla kaynak
gerektiren adımları gerektirmektedir. Çalışmada kullanılan diğer metot olan bilişsel
modelleme metodu ise son kullanıcı kullanılabilirlik testlerine oranla daha az zaman ve kaynak
gerektirmektedir. Bilişsel modelleme, insanların bilişsel süreçlerini anlama ve tahmin etme
yaklaşımıdır. İnsan gibi düşünen, davranan, hatalar yapan bir model tasarlamak, test ve tasarım
karşılaştırmaları için hız ve bütçe tasarrufu açısından önemli görülmektedir. Bilişsel
modelleme yöntemini kullanarak kolay bir şekilde kullanıcı arayüzlerini analiz etmeye
yarayan, farklı çalışma prensiplerine sahip birkaç araç geliştirilmiştir. Bu çalışmada kullanılan
bu araçlardan biri de Carnegie Mellon Üniversitesi tarafından geliştirilen CogTool
uygulamasıdır. Bu çalışmada, katılımcılarla uygulanan görevler aynı uygulama üzerinde
CogTool kullanılarak da test edilecek ve mobil bir uygulama üzerinde bilişsel modelleme
yönteminin etkinliği gerçek kullanıcı sonuçlarıyla karşılaştırılarak test edilecektir.
Bu çalışmadan alınacak ilk verilerin Aralık 2013 sonunda elde edilmesi amaçlanmaktadır.
Elde edilen bilgiler sadece bilimsel araştırma ve yazılarda kullanılacaktır. Çalışmanın
sonuçlarını öğrenmek ya da bu araştırma hakkında daha fazla bilgi almak için aşağıdaki
isimlere başvurabilirsiniz. Bu araştırmaya katıldığınız için tekrar çok teşekkür ederiz.
Nihan OCAK (ODTÜ BIDB Oda: 109; Tel: 210 3357; E-posta: [email protected])
Prof. Dr. Kürşat ÇAĞILTAY (ODTÜ BOTE; Oda: 19; Tel: 210 3683; E-posta:
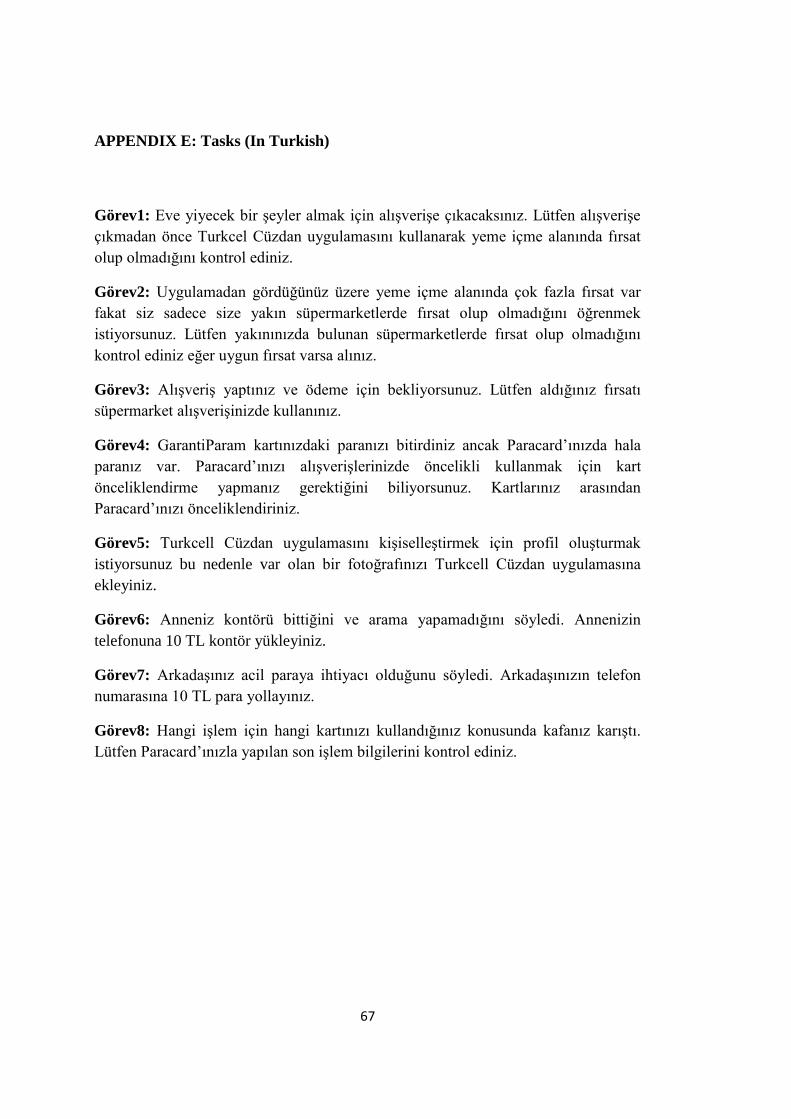
67
APPENDIX E: Tasks (In Turkish)
Görev1: Eve yiyecek bir şeyler almak için alışverişe çıkacaksınız. Lütfen alışverişe
çıkmadan önce Turkcel Cüzdan uygulamasını kullanarak yeme içme alanında fırsat
olup olmadığını kontrol ediniz.
Görev2: Uygulamadan gördüğünüz üzere yeme içme alanında çok fazla fırsat var
fakat siz sadece size yakın süpermarketlerde fırsat olup olmadığını öğrenmek
istiyorsunuz. Lütfen yakınınızda bulunan süpermarketlerde fırsat olup olmadığını
kontrol ediniz eğer uygun fırsat varsa alınız.
Görev3: Alışveriş yaptınız ve ödeme için bekliyorsunuz. Lütfen aldığınız fırsatı
süpermarket alışverişinizde kullanınız.
Görev4: GarantiParam kartınızdaki paranızı bitirdiniz ancak Paracard’ınızda hala
paranız var. Paracard’ınızı alışverişlerinizde öncelikli kullanmak için kart
önceliklendirme yapmanız gerektiğini biliyorsunuz. Kartlarınız arasından
Paracard’ınızı önceliklendiriniz.
Görev5: Turkcell Cüzdan uygulamasını kişiselleştirmek için profil oluşturmak
istiyorsunuz bu nedenle var olan bir fotoğrafınızı Turkcell Cüzdan uygulamasına
ekleyiniz.
Görev6: Anneniz kontörü bittiğini ve arama yapamadığını söyledi. Annenizin
telefonuna 10 TL kontör yükleyiniz.
Görev7: Arkadaşınız acil paraya ihtiyacı olduğunu söyledi. Arkadaşınızın telefon
numarasına 10 TL para yollayınız.
Görev8: Hangi işlem için hangi kartınızı kullandığınız konusunda kafanız karıştı.
Lütfen Paracard’ınızla yapılan son işlem bilgilerini kontrol ediniz.
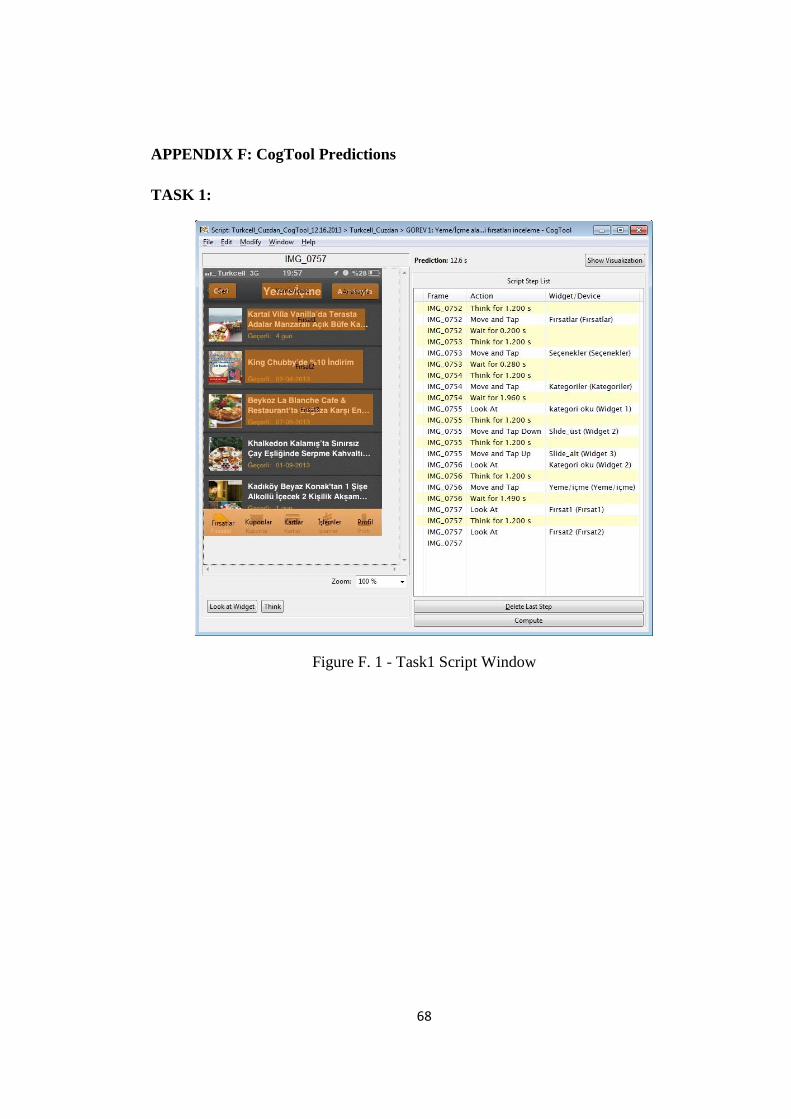
68
APPENDIX F: CogTool Predictions
TASK 1:
Figure F. 1 - Task1 Script Window

69
Figure F. 2 - Task1 Visualization Window

70
TASK 2:
Figure F. 3 - Task2 Script Window

71
Figure F. 4 - Task2 Visualization Window
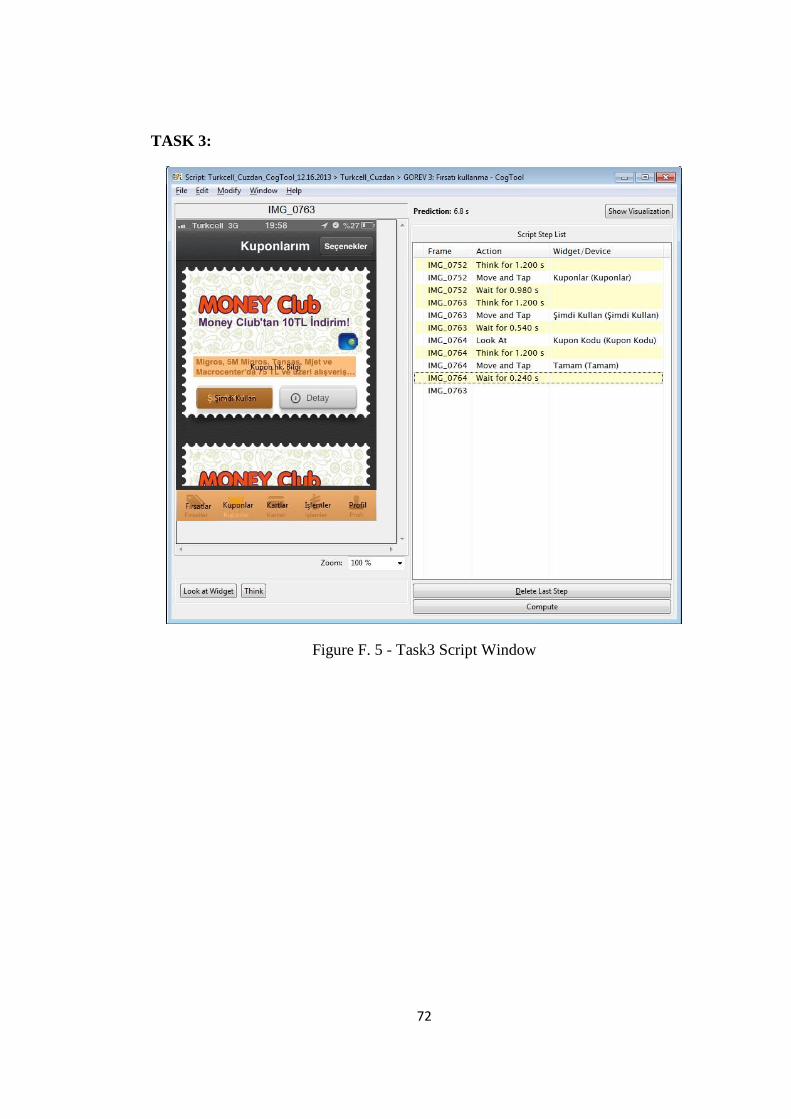
72
TASK 3:
Figure F. 5 - Task3 Script Window
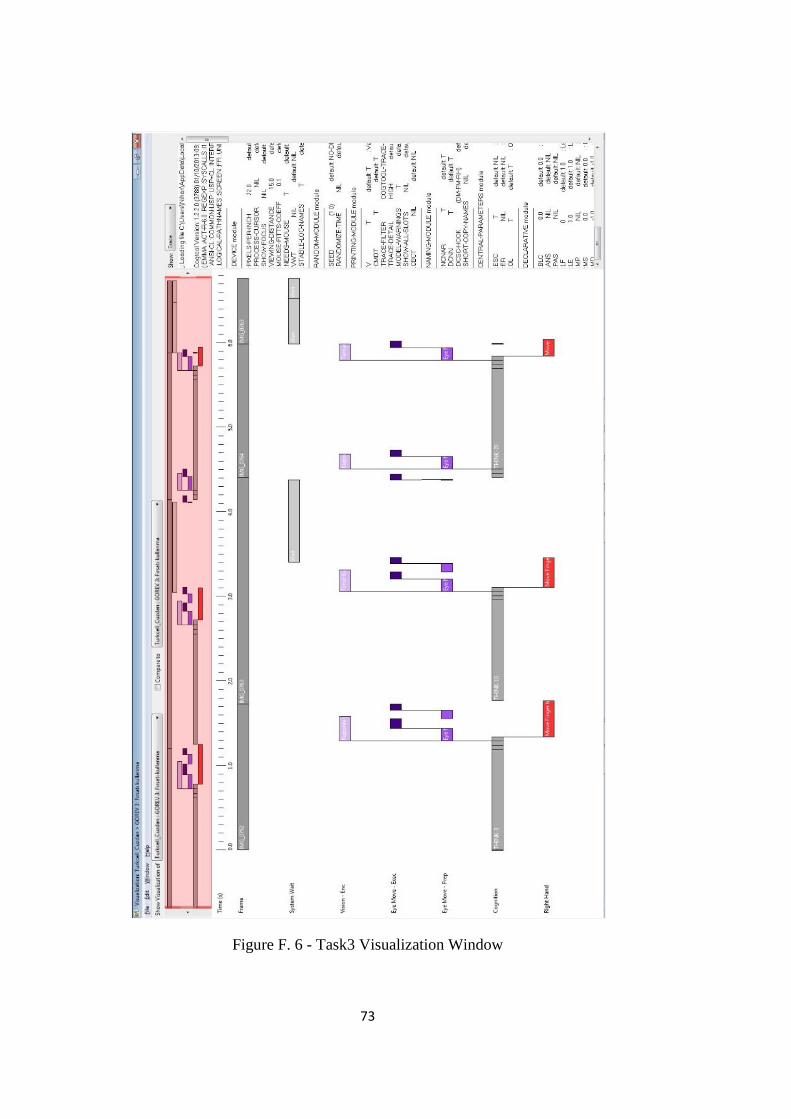
73
Figure F. 6 - Task3 Visualization Window

74
TASK 4:
Figure F. 7 - Task4 Script Window

75
Figure F. 8 - Task4 Visualization Window

76
TASK 5:
Figure F. 9 - Task5 Script Window

77
Figure F. 10 - Task5 Visualization Window
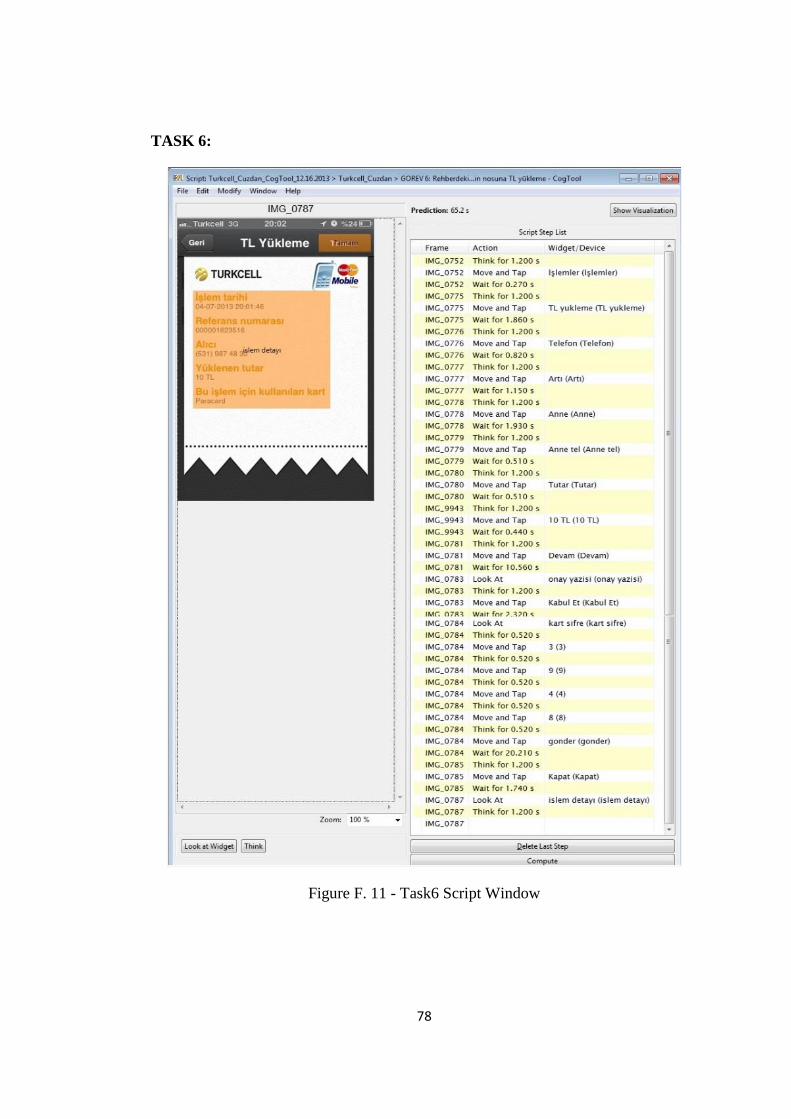
78
TASK 6:
Figure F. 11 - Task6 Script Window
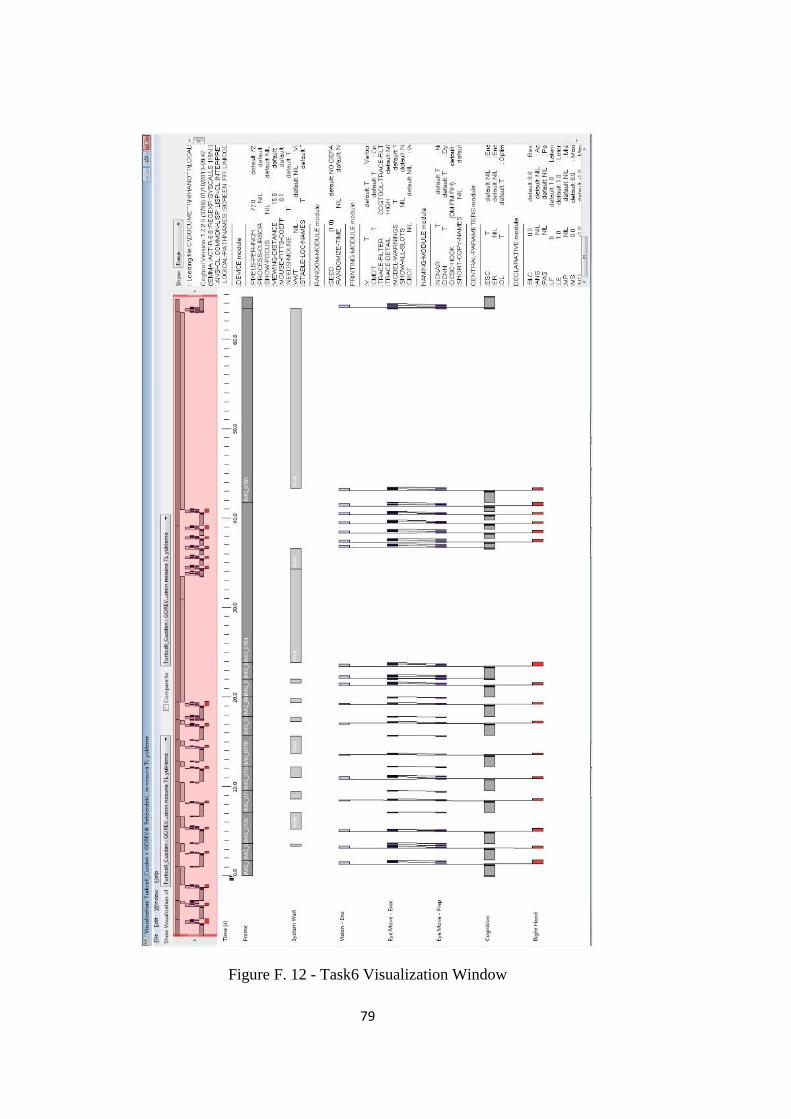
79
Figure F. 12 - Task6 Visualization Window

80
TASK 7:
Figure F. 13 - Task7 Script Window

81
Figure F. 14 - Task7 Visualization Window

82
TASK 8:
Figure F. 15 - Task8 Script Window
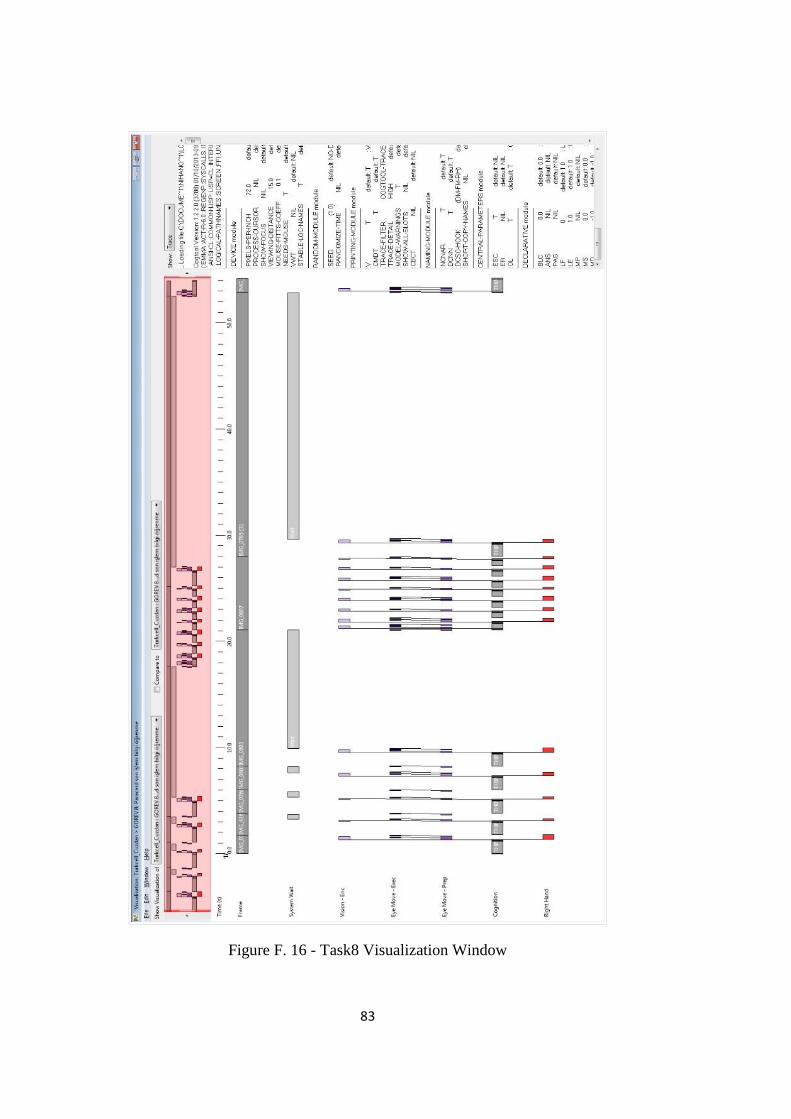
83
Figure F. 16 - Task8 Visualization Window

84
APPENDIX G: Detailed User Test Data
TASK 1:
Table G. 1 - User test results for task 1
Tasks Task 1
Users P 01 P 02 P 03 P 04
Start Finish Time Start Finish Time Start Finish Time Start Finish Time
Step 1 00:01.49 00:02.14 00:00.65 00:26.68 00:27.43 00:00.75 00:13.83 00:14.58 00:00.75 00:05.20 00:07.22 00:02.02
Step 2 00:02.41 00:03.22 00:00.81 00:27.93 00:30.78 00:02.85 00:15.12 00:16.88 00:01.76 00:07.66 00:08.75 00:01.09
Step 3 00:03.70 00:05.02 00:01.32 00:31.22 00:32.51 00:01.29 00:17.36 00:18.20 00:00.84 00:09.22 00:10.31 00:01.09
Step 4 00:06.98 00:08.98 00:02.00 00:33.46 00:35.02 00:01.56 00:20.75 00:22.48 00:01.73 00:11.19 00:12.34 00:01.15
Step 5 00:09.05 00:09.73 00:00.68 00:35.05 00:35.80 00:00.75 00:22.81 00:23.32 00:00.51 00:12.54 00:12.78 00:00.24
Step 6 00:11.46 00:12.78 00:01.32 00:37.36 00:39.02 00:01.66 00:25.29 00:27.53 00:02.24 00:15.09 00:18.00 00:02.91
Tasks Task 1
Users P 05 P 06 P 07 P 08
Start Finish Time Start Finish Time Start Finish Time Start Finish Time
Step 1 00:07.83 00:09.53 00:01.70 00:09.22 00:10.14 00:00.92 00:06.27 00:07.12 00:00.85 00:04.71 00:06.85 00:02.14
Step 2 00:09.80 00:11.46 00:01.66 00:10.37 00:12.44 00:02.07 00:07.63 00:09.15 00:01.52 00:07.12 00:08.61 00:01.49
Step 3 00:11.93 00:12.64 00:00.71 00:12.88 00:13.90 00:01.02 00:09.93 00:10.78 00:00.85 00:09.19 00:09.97 00:00.78
Step 4 00:13.42 00:14.17 00:00.75 00:14.85 00:15.71 00:00.86 00:11.90 00:13.12 00:01.22 00:10.68 00:11.73 00:01.05
Step 5 00:14.41 00:14.85 00:00.44 00:26.17 00:26.98 00:00.81 00:13.22 00:13.93 00:00.71 00:11.66 00:12.51 00:00.85
Step 6 00:17.09 00:18.24 00:01.15 00:28.51 00:30.58 00:02.07 00:15.76 00:18.41 00:02.65 00:14.24 00:16.41 00:02.17
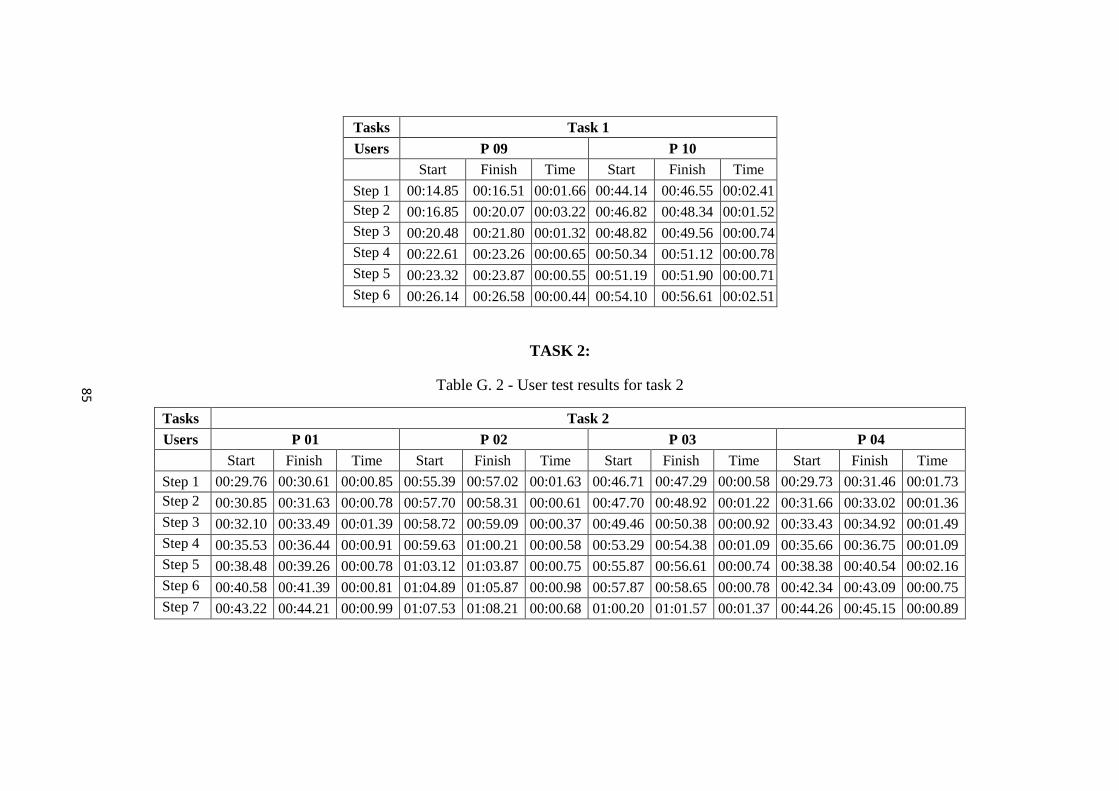
85
Tasks Task 1
Users P 09 P 10
Start Finish Time Start Finish Time
Step 1 00:14.85 00:16.51 00:01.66 00:44.14 00:46.55 00:02.41
Step 2 00:16.85 00:20.07 00:03.22 00:46.82 00:48.34 00:01.52
Step 3 00:20.48 00:21.80 00:01.32 00:48.82 00:49.56 00:00.74
Step 4 00:22.61 00:23.26 00:00.65 00:50.34 00:51.12 00:00.78
Step 5 00:23.32 00:23.87 00:00.55 00:51.19 00:51.90 00:00.71
Step 6 00:26.14 00:26.58 00:00.44 00:54.10 00:56.61 00:02.51
TASK 2:
Table G. 2 - User test results for task 2
Tasks Task 2
Users P 01 P 02 P 03 P 04
Start Finish Time Start Finish Time Start Finish Time Start Finish Time
Step 1 00:29.76 00:30.61 00:00.85 00:55.39 00:57.02 00:01.63 00:46.71 00:47.29 00:00.58 00:29.73 00:31.46 00:01.73
Step 2 00:30.85 00:31.63 00:00.78 00:57.70 00:58.31 00:00.61 00:47.70 00:48.92 00:01.22 00:31.66 00:33.02 00:01.36
Step 3 00:32.10 00:33.49 00:01.39 00:58.72 00:59.09 00:00.37 00:49.46 00:50.38 00:00.92 00:33.43 00:34.92 00:01.49
Step 4 00:35.53 00:36.44 00:00.91 00:59.63 01:00.21 00:00.58 00:53.29 00:54.38 00:01.09 00:35.66 00:36.75 00:01.09
Step 5 00:38.48 00:39.26 00:00.78 01:03.12 01:03.87 00:00.75 00:55.87 00:56.61 00:00.74 00:38.38 00:40.54 00:02.16
Step 6 00:40.58 00:41.39 00:00.81 01:04.89 01:05.87 00:00.98 00:57.87 00:58.65 00:00.78 00:42.34 00:43.09 00:00.75
Step 7 00:43.22 00:44.21 00:00.99 01:07.53 01:08.21 00:00.68 01:00.20 01:01.57 00:01.37 00:44.26 00:45.15 00:00.89

86
Tasks Task 2
Users P 09 P 10
Start Finish Time Start Finish Time
Step 1 00:38.54 00:40.95 00:02.41 01:03.73 01:05.66 00:01.93
Step 2 00:41.26 00:42.07 00:00.81 01:05.94 01:07.43 00:01.49
Step 3 00:42.48 00:43.22 00:00.74 01:07.83 01:08.61 00:00.78
Step 4 00:44.00 00:44.51 00:00.51 01:09.36 01:09.90 00:00.54
Step 5 00:46.58 00:47.43 00:00.85 01:12.14 01:13.02 00:00.88
Step 6 00:48.31 00:49.19 00:00.88 01:13.87 01:18.61 00:04.74
Step 7 00:50.99 00:52.71 00:01.72 01:22.34 01:23.39 00:01.05
Tasks Task 2
Users P 05 P 06 P 07 P 08
Start Finish Time Start Finish Time Start Finish Time Start Finish Time
Step 1 00:02.00 00:03.76 00:01.76 07:57.16 07:58.72 00:01.56 00:30.41 00:31.29 00:00.88 00:36.51 00:38.75 00:02.24
Step 2 00:09.56 00:11.70 00:02.14 07:59.30 08:00.21 00:00.91 00:31.56 00:32.48 00:00.92 00:39.09 00:39.90 00:00.81
Step 3 00:12.14 00:12.98 00:00.84 08:01.89 08:03.08 00:01.19 00:32.92 00:33.80 00:00.88 00:40.34 00:41.02 00:00.68
Step 4 00:13.83 00:15.42 00:01.59 08:06.98 08:08.37 00:01.39 00:34.58 00:35.19 00:00.61 00:41.93 00:43.09 00:01.16
Step 5 00:17.76 00:18.65 00:00.89 08:09.76 08:12.43 00:02.67 00:37.22 00:38.21 00:00.99 00:45.26 00:46.24 00:00.98
Step 6 00:19.87 00:21.09 00:01.22 08:12.68 08:13.49 00:00.81 00:40.00 00:40.85 00:00.85 00:47.29 00:48.51 00:01.22
Step 7 00:22.75 00:23.87 00:01.12 08:14.18 08:15.09 00:00.91 00:42.48 00:44.44 00:01.96 00:50.41 00:51.60 00:01.19
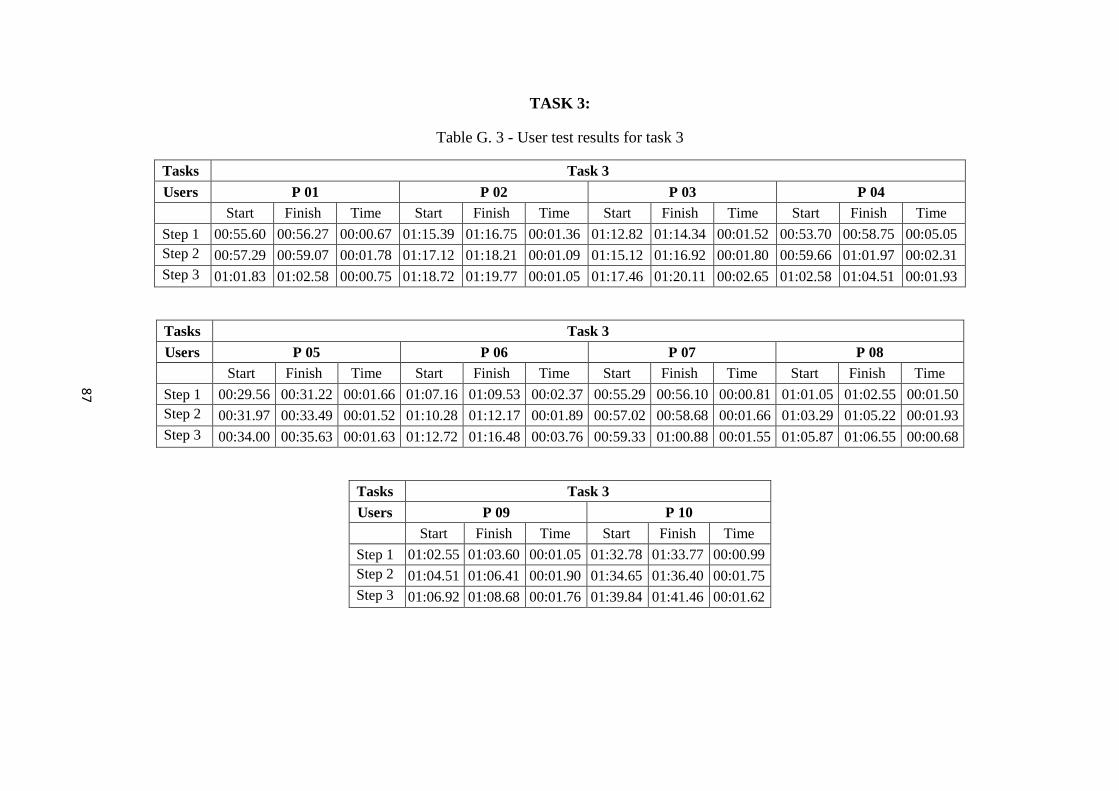
87
TASK 3:
Table G. 3 - User test results for task 3
Tasks Task 3
Users P 01 P 02 P 03 P 04
Start Finish Time Start Finish Time Start Finish Time Start Finish Time
Step 1 00:55.60 00:56.27 00:00.67 01:15.39 01:16.75 00:01.36 01:12.82 01:14.34 00:01.52 00:53.70 00:58.75 00:05.05
Step 2 00:57.29 00:59.07 00:01.78 01:17.12 01:18.21 00:01.09 01:15.12 01:16.92 00:01.80 00:59.66 01:01.97 00:02.31
Step 3 01:01.83 01:02.58 00:00.75 01:18.72 01:19.77 00:01.05 01:17.46 01:20.11 00:02.65 01:02.58 01:04.51 00:01.93
Tasks Task 3
Users P 05 P 06 P 07 P 08
Start Finish Time Start Finish Time Start Finish Time Start Finish Time
Step 1 00:29.56 00:31.22 00:01.66 01:07.16 01:09.53 00:02.37 00:55.29 00:56.10 00:00.81 01:01.05 01:02.55 00:01.50
Step 2 00:31.97 00:33.49 00:01.52 01:10.28 01:12.17 00:01.89 00:57.02 00:58.68 00:01.66 01:03.29 01:05.22 00:01.93
Step 3 00:34.00 00:35.63 00:01.63 01:12.72 01:16.48 00:03.76 00:59.33 01:00.88 00:01.55 01:05.87 01:06.55 00:00.68
Tasks Task 3
Users P 09 P 10
Start Finish Time Start Finish Time
Step 1 01:02.55 01:03.60 00:01.05 01:32.78 01:33.77 00:00.99
Step 2 01:04.51 01:06.41 00:01.90 01:34.65 01:36.40 00:01.75
Step 3 01:06.92 01:08.68 00:01.76 01:39.84 01:41.46 00:01.62

88
TASK 4:
Table G. 4 - User test results for task 4
Tasks Task 4
Users P 01 P 02 P 03 P 04
Start Finish Time Start Finish Time Start Finish Time Start Finish Time
Step 1 01:13.43 01:15.77 00:02.34 02:06.19 02:09.20 00:03.01 01:27.11 01:29.63 00:02.52 01:13.55 01:16.31 00:02.76
Step 2 01:16.00 01:17.16 00:01.16 02:10.24 02:16.21 00:05.97 01:30.45 01:30.99 00:00.54 01:17.26 01:17.50 00:00.24
Step 3 01:17.73 01:18.65 00:00.92 02:16.75 02:18.45 00:01.70 01:31.56 01:32.45 00:00.89 01:18.04 01:18.92 00:00.88
Step 4 01:19.36 01:20.58 00:01.22 02:19.19 02:20.04 00:00.85 01:33.16 01:34.55 00:01.39 01:19.60 01:20.68 00:01.08
Step 5 01:30.48 01:31.40 00:00.92 02:23.60 02:24.92 00:01.32 01:42.11 01:43.26 00:01.15 01:30.41 01:31.43 00:01.02
Tasks Task 4
Users P 05 P 06 P 07 P 08
Start Finish Time Start Finish Time Start Finish Time Start Finish Time
Step 1 00:40.48 00:42.85 00:02.37 01:23.18 01:26.00 02:02.82 01:07.97 01:10.01 00:02.04 01:20.11 01:22.17 00:02.06
Step 2 00:42.85 00:43.97 00:01.12 01:26.89 01:27.80 00:00.91 01:11.63 01:13.12 00:01.49 01:22.55 01:23.26 00:00.71
Step 3 00:44.51 00:45.60 00:01.09 01:28.34 01:32.01 00:03.67 01:13.73 01:15.22 00:01.49 01:23.87 01:25.94 00:02.07
Step 4 00:46.24 00:47.12 00:00.88 01:32.78 01:33.80 00:01.02 01:15.97 01:16.82 00:00.85 01:26.55 01:27.56 00:01.01
Step 5 00:56.04 00:56.78 00:00.74 01:41.04 01:42.23 00:01.19 01:25.33 01:26.17 00:00.84 01:35.97 01:37.09 00:01.12
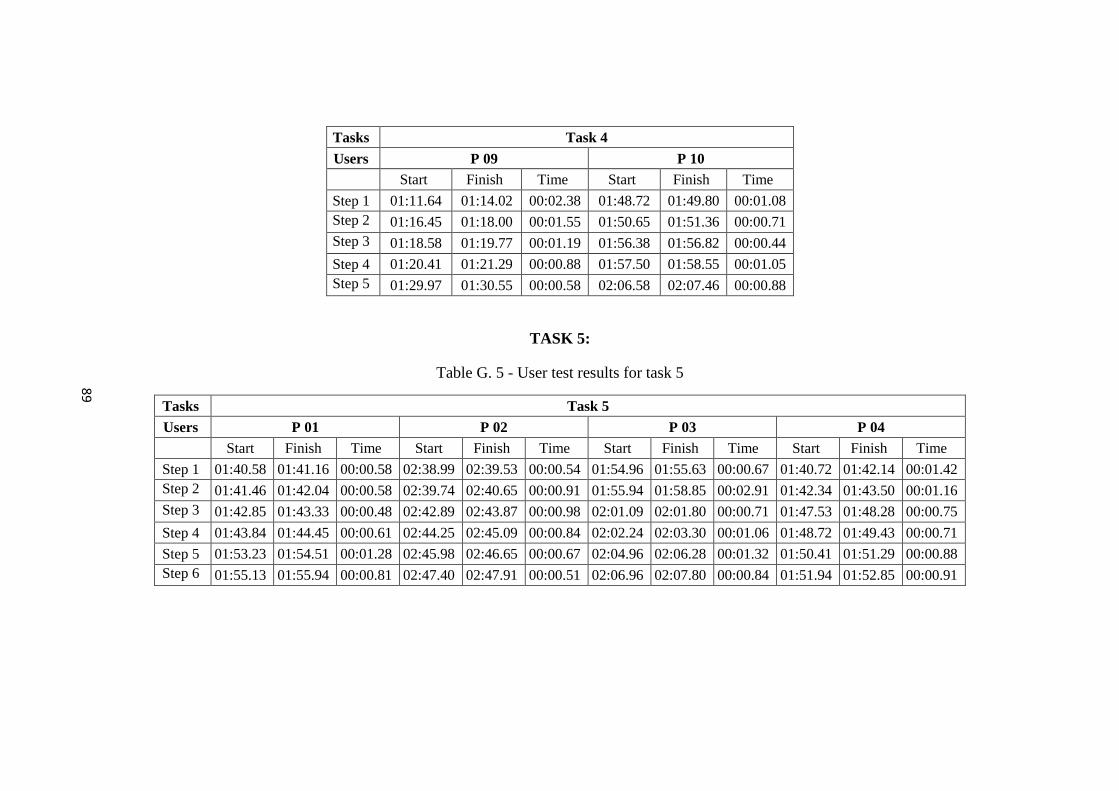
89
Tasks Task 4
Users P 09 P 10
Start Finish Time Start Finish Time
Step 1 01:11.64 01:14.02 00:02.38 01:48.72 01:49.80 00:01.08
Step 2 01:16.45 01:18.00 00:01.55 01:50.65 01:51.36 00:00.71
Step 3 01:18.58 01:19.77 00:01.19 01:56.38 01:56.82 00:00.44
Step 4 01:20.41 01:21.29 00:00.88 01:57.50 01:58.55 00:01.05
Step 5 01:29.97 01:30.55 00:00.58 02:06.58 02:07.46 00:00.88
TASK 5:
Table G. 5 - User test results for task 5
Tasks Task 5
Users P 01 P 02 P 03 P 04
Start Finish Time Start Finish Time Start Finish Time Start Finish Time
Step 1 01:40.58 01:41.16 00:00.58 02:38.99 02:39.53 00:00.54 01:54.96 01:55.63 00:00.67 01:40.72 01:42.14 00:01.42
Step 2 01:41.46 01:42.04 00:00.58 02:39.74 02:40.65 00:00.91 01:55.94 01:58.85 00:02.91 01:42.34 01:43.50 00:01.16
Step 3 01:42.85 01:43.33 00:00.48 02:42.89 02:43.87 00:00.98 02:01.09 02:01.80 00:00.71 01:47.53 01:48.28 00:00.75
Step 4 01:43.84 01:44.45 00:00.61 02:44.25 02:45.09 00:00.84 02:02.24 02:03.30 00:01.06 01:48.72 01:49.43 00:00.71
Step 5 01:53.23 01:54.51 00:01.28 02:45.98 02:46.65 00:00.67 02:04.96 02:06.28 00:01.32 01:50.41 01:51.29 00:00.88
Step 6 01:55.13 01:55.94 00:00.81 02:47.40 02:47.91 00:00.51 02:06.96 02:07.80 00:00.84 01:51.94 01:52.85 00:00.91

90
Tasks Task 5
Users P 05 P 06 P 07 P 08
Start Finish Time Start Finish Time Start Finish Time Start Finish Time
Step 1 01:04.82 01:05.73 00:00.91 01:51.94 01:53.40 00:01.46 01:35.43 01:36.14 00:00.71 01:43.87 01:45.02 00:01.15
Step 2 01:05.97 01:06.99 00:01.02 01:53.60 01:54.75 00:01.15 01:36.45 01:37.53 00:01.08 01:45.23 01:46.11 00:00.88
Step 3 01:09.43 01:10.14 00:00.71 01:55.50 01:56.38 00:00.88 01:40.24 01:41.12 00:00.88 01:47.36 01:48.07 00:00.71
Step 4 01:10.58 01:11.87 00:01.29 01:57.26 01:58.75 00:01.49 01:49.40 01:49.90 00:00.50 01:53.94 01:54.58 00:00.64
Step 5 01:12.58 01:13.39 00:00.81 01:59.60 02:01.36 00:01.76 01:51.53 01:52.01 00:00.48 01:55.46 01:56.31 00:00.85
Step 6 01:14.04 01:15.09 00:01.05 02:01.97 02:02.96 00:00.99 01:52.72 01:53.33 00:00.61 01:56.99 01:57.46 00:00.47
Tasks Task 5
Users P 09 P 10
Start Finish Time Start Finish Time
Step 1 01:42.38 01:43.80 00:01.42 02:16.28 02:17.74 00:01.46
Step 2 01:44.04 01:44.85 00:00.81 02:17.94 02:19.57 00:01.63
Step 3 01:45.70 01:46.62 00:00.92 02:20.35 02:21.67 00:01.32
Step 4 01:47.53 01:48.79 00:01.26 02:22.69 02:24.01 00:01.32
Step 5 01:49.70 01:50.41 00:00.71 02:24.99 02:26.42 00:01.43
Step 6 01:51.12 01:51.90 00:00.78 02:27.06 02:28.21 00:01.15

91
TASK 6:
Table G. 6 - User test results for task 6
Tasks Task 6
Users P 01 P 02 P 03 P 04
Start Finish Time Start Finish Time Start Finish Time Start Finish Time
Step 1 02:05.36 02:06.69 00:01.33 02:53.84 02:59.06 00:05.22 02:23.70 02:24.38 00:00.68 02:01.80 02:02.85 00:01.05
Step 2 02:06.96 02:09.63 00:02.67 02:59.54 03:00.48 00:00.94 02:24.65 02:28.96 00:04.31 02:03.16 02:04.89 00:01.73
Step 3 02:11.57 02:12.96 00:01.39 03:20.82 03:21.77 00:00.95 02:30.82 02:32.14 00:01.32 02:06.65 02:07.33 00:00.68
Step 4 02:14.18 02:15.67 00:01.49 03:22.38 03:28.86 00:06.48 02:32.96 02:33.26 00:00.30 02:08.62 02:08.96 00:00.34
Step 5 02:16.82 02:17.40 00:00.58 03:29.88 03:31.44 00:01.56 02:34.35 02:34.86 00:00.51 02:10.04 02:10.75 00:00.71
Step 6 02:19.40 02:20.18 00:00.78 03:32.52 03:33.54 00:01.02 02:36.28 02:37.13 00:00.85 02:12.11 02:13.67 00:01.56
Step 7 02:20.72 02:21.57 00:00.85 03:34.15 03:35.20 00:01.05 02:37.70 02:38.52 00:00.82 02:14.21 02:15.23 00:01.02
Step 8 02:22.18 02:22.75 00:00.57 03:35.81 03:36.42 00:00.61 02:39.20 02:39.74 00:00.54 02:15.80 02:16.52 00:00.72
Step 9 02:23.19 02:25.74 00:02.55 03:36.93 03:37.54 00:00.61 02:40.28 02:42.79 00:02.51 02:17.09 02:18.52 00:01.43
Step 10 02:36.18 02:37.33 00:01.15 03:48.18 03:49.88 00:01.70 02:52.59 02:53.64 00:01.05 02:28.52 02:30.31 00:01.79
Step 11 02:39.20 02:44.42 00:05.22 03:53.67 03:57.91 00:04.24 02:55.06 02:58.93 00:03.87 02:33.33 02:37.50 00:04.17
Step 12 02:44.65 02:45.03 00:00.38 03:58.05 03:58.32 00:00.27 02:59.06 02:59.74 00:00.68 02:37.70 02:38.82 00:01.12
Step 13 02:46.59 02:47.11 00:00.52 03:59.81 04:00.12 00:00.31 03:00.17 03:00.59 00:00.42 02:39.71 02:40.15 00:00.44
Step 14 03:06.18 03:07.74 00:01.56 04:17.98 04:19.44 00:01.46 03:17.43 03:19.81 00:02.38 03:06.94 03:08.59 00:01.65
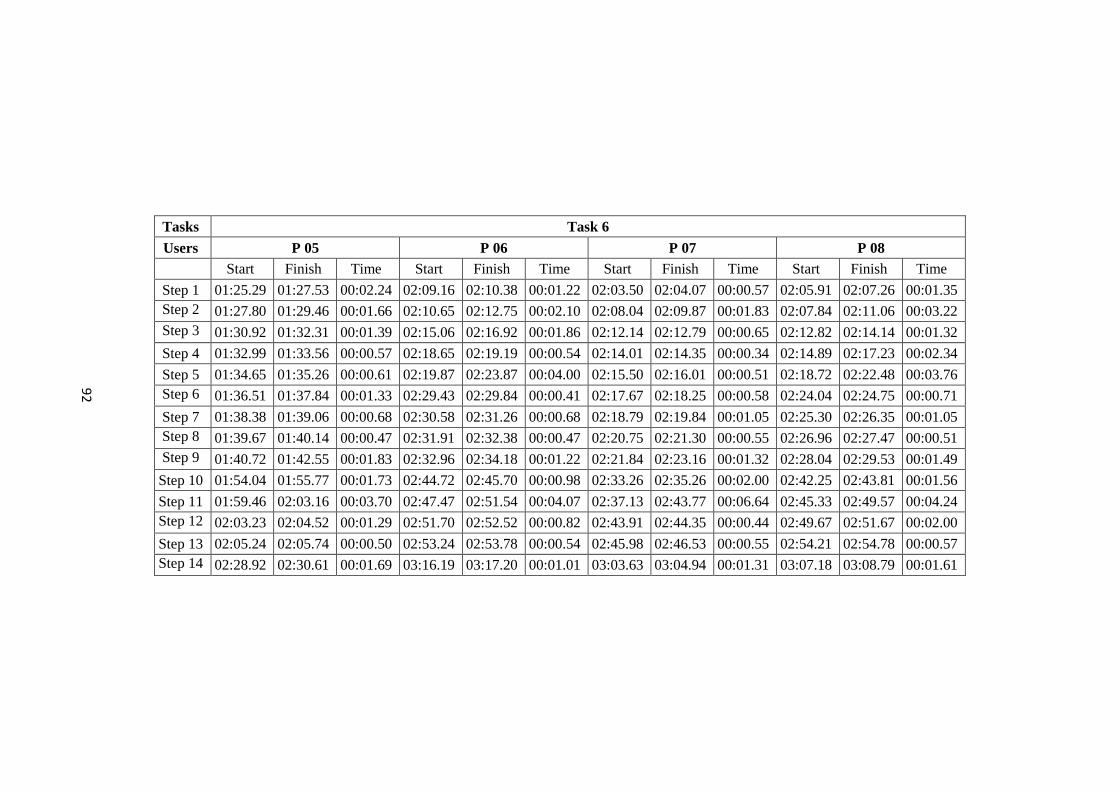
92
Tasks Task 6
Users P 05 P 06 P 07 P 08
Start Finish Time Start Finish Time Start Finish Time Start Finish Time
Step 1 01:25.29 01:27.53 00:02.24 02:09.16 02:10.38 00:01.22 02:03.50 02:04.07 00:00.57 02:05.91 02:07.26 00:01.35
Step 2 01:27.80 01:29.46 00:01.66 02:10.65 02:12.75 00:02.10 02:08.04 02:09.87 00:01.83 02:07.84 02:11.06 00:03.22
Step 3 01:30.92 01:32.31 00:01.39 02:15.06 02:16.92 00:01.86 02:12.14 02:12.79 00:00.65 02:12.82 02:14.14 00:01.32
Step 4 01:32.99 01:33.56 00:00.57 02:18.65 02:19.19 00:00.54 02:14.01 02:14.35 00:00.34 02:14.89 02:17.23 00:02.34
Step 5 01:34.65 01:35.26 00:00.61 02:19.87 02:23.87 00:04.00 02:15.50 02:16.01 00:00.51 02:18.72 02:22.48 00:03.76
Step 6 01:36.51 01:37.84 00:01.33 02:29.43 02:29.84 00:00.41 02:17.67 02:18.25 00:00.58 02:24.04 02:24.75 00:00.71
Step 7 01:38.38 01:39.06 00:00.68 02:30.58 02:31.26 00:00.68 02:18.79 02:19.84 00:01.05 02:25.30 02:26.35 00:01.05
Step 8 01:39.67 01:40.14 00:00.47 02:31.91 02:32.38 00:00.47 02:20.75 02:21.30 00:00.55 02:26.96 02:27.47 00:00.51
Step 9 01:40.72 01:42.55 00:01.83 02:32.96 02:34.18 00:01.22 02:21.84 02:23.16 00:01.32 02:28.04 02:29.53 00:01.49
Step 10 01:54.04 01:55.77 00:01.73 02:44.72 02:45.70 00:00.98 02:33.26 02:35.26 00:02.00 02:42.25 02:43.81 00:01.56
Step 11 01:59.46 02:03.16 00:03.70 02:47.47 02:51.54 00:04.07 02:37.13 02:43.77 00:06.64 02:45.33 02:49.57 00:04.24
Step 12 02:03.23 02:04.52 00:01.29 02:51.70 02:52.52 00:00.82 02:43.91 02:44.35 00:00.44 02:49.67 02:51.67 00:02.00
Step 13 02:05.24 02:05.74 00:00.50 02:53.24 02:53.78 00:00.54 02:45.98 02:46.53 00:00.55 02:54.21 02:54.78 00:00.57
Step 14 02:28.92 02:30.61 00:01.69 03:16.19 03:17.20 00:01.01 03:03.63 03:04.94 00:01.31 03:07.18 03:08.79 00:01.61
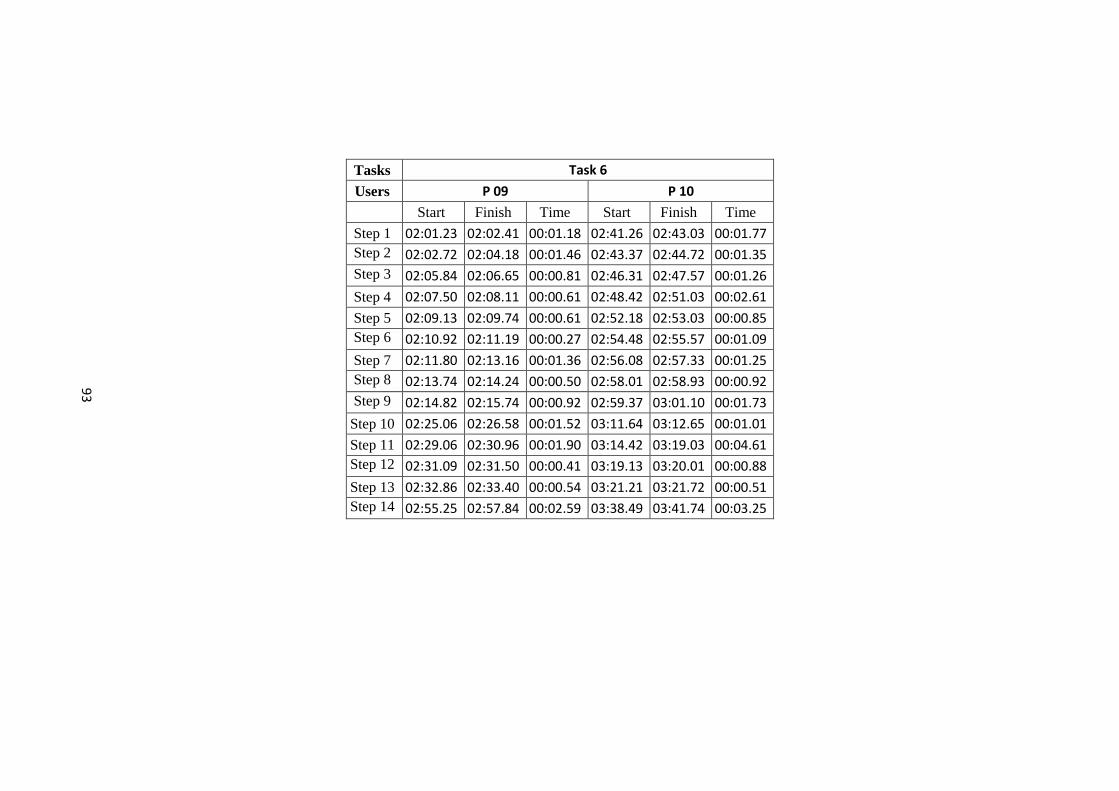
93
Tasks Task 6
Users P 09 P 10
Start Finish Time Start Finish Time
Step 1 02:01.23 02:02.41 00:01.18 02:41.26 02:43.03 00:01.77
Step 2 02:02.72 02:04.18 00:01.46 02:43.37 02:44.72 00:01.35
Step 3 02:05.84 02:06.65 00:00.81 02:46.31 02:47.57 00:01.26
Step 4 02:07.50 02:08.11 00:00.61 02:48.42 02:51.03 00:02.61
Step 5 02:09.13 02:09.74 00:00.61 02:52.18 02:53.03 00:00.85
Step 6 02:10.92 02:11.19 00:00.27 02:54.48 02:55.57 00:01.09
Step 7 02:11.80 02:13.16 00:01.36 02:56.08 02:57.33 00:01.25
Step 8 02:13.74 02:14.24 00:00.50 02:58.01 02:58.93 00:00.92
Step 9 02:14.82 02:15.74 00:00.92 02:59.37 03:01.10 00:01.73
Step 10 02:25.06 02:26.58 00:01.52 03:11.64 03:12.65 00:01.01
Step 11 02:29.06 02:30.96 00:01.90 03:14.42 03:19.03 00:04.61
Step 12 02:31.09 02:31.50 00:00.41 03:19.13 03:20.01 00:00.88
Step 13 02:32.86 02:33.40 00:00.54 03:21.21 03:21.72 00:00.51
Step 14 02:55.25 02:57.84 00:02.59 03:38.49 03:41.74 00:03.25
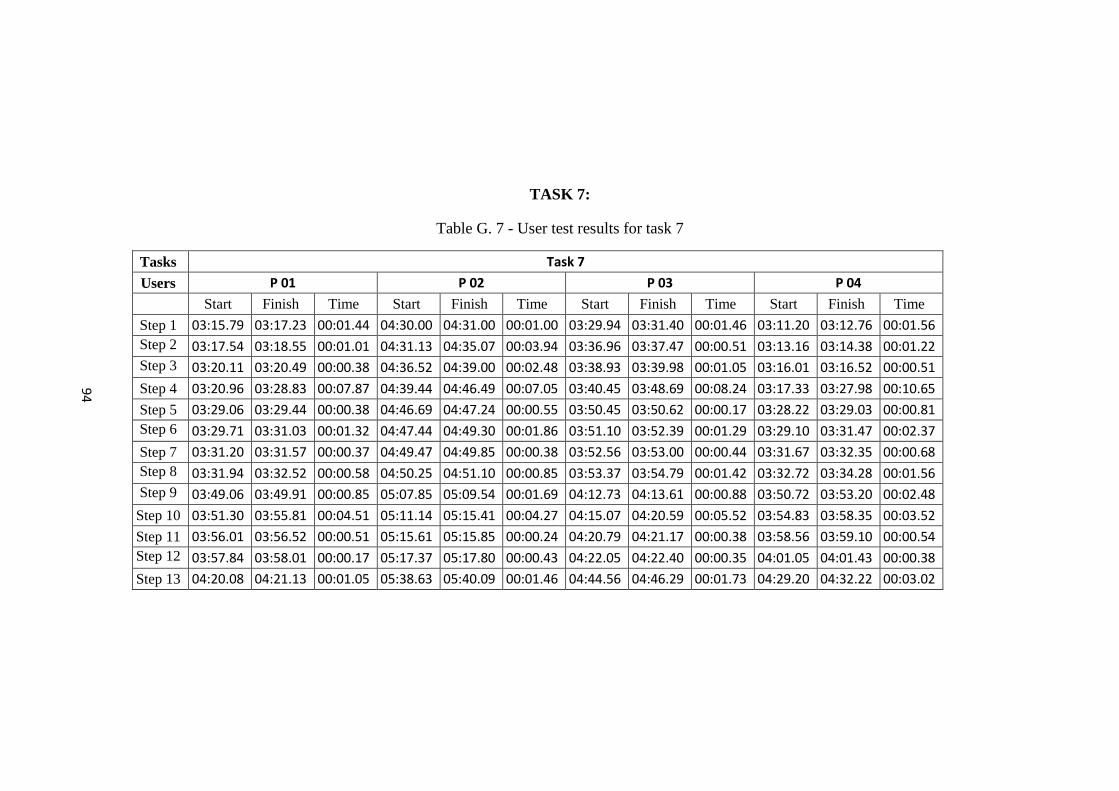
94
TASK 7:
Table G. 7 - User test results for task 7
Tasks Task 7
Users P 01 P 02 P 03 P 04
Start Finish Time Start Finish Time Start Finish Time Start Finish Time
Step 1 03:15.79 03:17.23 00:01.44 04:30.00 04:31.00 00:01.00 03:29.94 03:31.40 00:01.46 03:11.20 03:12.76 00:01.56
Step 2 03:17.54 03:18.55 00:01.01 04:31.13 04:35.07 00:03.94 03:36.96 03:37.47 00:00.51 03:13.16 03:14.38 00:01.22
Step 3 03:20.11 03:20.49 00:00.38 04:36.52 04:39.00 00:02.48 03:38.93 03:39.98 00:01.05 03:16.01 03:16.52 00:00.51
Step 4 03:20.96 03:28.83 00:07.87 04:39.44 04:46.49 00:07.05 03:40.45 03:48.69 00:08.24 03:17.33 03:27.98 00:10.65
Step 5 03:29.06 03:29.44 00:00.38 04:46.69 04:47.24 00:00.55 03:50.45 03:50.62 00:00.17 03:28.22 03:29.03 00:00.81
Step 6 03:29.71 03:31.03 00:01.32 04:47.44 04:49.30 00:01.86 03:51.10 03:52.39 00:01.29 03:29.10 03:31.47 00:02.37
Step 7 03:31.20 03:31.57 00:00.37 04:49.47 04:49.85 00:00.38 03:52.56 03:53.00 00:00.44 03:31.67 03:32.35 00:00.68
Step 8 03:31.94 03:32.52 00:00.58 04:50.25 04:51.10 00:00.85 03:53.37 03:54.79 00:01.42 03:32.72 03:34.28 00:01.56
Step 9 03:49.06 03:49.91 00:00.85 05:07.85 05:09.54 00:01.69 04:12.73 04:13.61 00:00.88 03:50.72 03:53.20 00:02.48
Step 10 03:51.30 03:55.81 00:04.51 05:11.14 05:15.41 00:04.27 04:15.07 04:20.59 00:05.52 03:54.83 03:58.35 00:03.52
Step 11 03:56.01 03:56.52 00:00.51 05:15.61 05:15.85 00:00.24 04:20.79 04:21.17 00:00.38 03:58.56 03:59.10 00:00.54
Step 12 03:57.84 03:58.01 00:00.17 05:17.37 05:17.80 00:00.43 04:22.05 04:22.40 00:00.35 04:01.05 04:01.43 00:00.38
Step 13 04:20.08 04:21.13 00:01.05 05:38.63 05:40.09 00:01.46 04:44.56 04:46.29 00:01.73 04:29.20 04:32.22 00:03.02

95
Tasks Task 7
Users P 05 P 06 P 07 P 08
Start Finish Time Start Finish Time Start Finish Time Start Finish Time
Step 1 02:33.67 02:35.70 00:02.03 03:19.98 03:22.45 00:02.47 04:13.17 04:13.84 00:00.67 03:23.84 03:24.72 00:00.88
Step 2 02:36.04 02:38.38 00:02.34 03:22.76 03:23.84 00:01.08 04:14.22 04:15.20 00:00.98 03:24.96 03:25.67 00:00.71
Step 3 02:40.25 02:41.06 00:00.81 03:25.37 03:26.52 00:01.15 04:17.03 04:19.47 00:02.44 03:27.23 03:28.05 00:00.82
Step 4 02:41.57 02:48.99 00:07.42 03:26.99 03:35.81 00:08.82 04:19.91 04:30.56 00:10.65 03:28.69 03:35.77 00:07.08
Step 5 02:49.16 02:49.67 00:00.51 03:36.05 03:36.89 00:00.84 04:30.73 04:31.20 00:00.47 03:35.88 03:36.59 00:00.71
Step 6 02:49.98 02:51.16 00:01.18 03:37.13 03:37.94 00:00.81 04:31.44 04:32.56 00:01.12 03:36.83 03:38.72 00:01.89
Step 7 02:51.26 02:52.48 00:01.22 03:38.18 03:38.96 00:00.78 04:32.69 04:33.41 00:00.72 03:39.00 03:39.47 00:00.47
Step 8 02:52.82 02:53.70 00:00.88 03:39.33 03:40.96 00:01.63 04:33.81 04:34.63 00:00.82 03:39.84 03:40.86 00:01.02
Step 9 03:11.81 03:13.10 00:01.29 05:50.80 05:52.39 00:01.59 05:41.24 05:42.46 00:01.22 03:57.37 03:58.66 00:01.29
Step 10 03:14.62 03:17.50 00:02.88 05:55.17 05:57.38 00:02.21 05:43.92 05:48.39 00:04.47 04:07.78 04:11.03 00:03.25
Step 11 03:17.64 03:18.52 00:00.88 05:57.58 05:58.29 00:00.71 05:48.49 05:49.00 00:00.51 04:11.10 04:11.44 00:00.34
Step 12 03:17.65 03:18.12 00:00.47 05:59.30 06:00.01 00:00.71 05:49.50 05:49.98 00:00.48 04:12.90 04:13.34 00:00.44
Step 13 03:46.25 03:48.01 00:01.76 06:19.45 06:21.14 00:01.69 06:17.30 06:19.31 00:02.01 04:34.91 04:36.62 00:01.71

96
Tasks Task 7
Users P 09 P 10
Start Finish Time Start Finish Time
Step 1 03:04.62 03:05.10 00:00.48 03:51.20 03:52.93 00:01.73
Step 2 03:05.33 03:06.21 00:00.88 03:53.20 03:54.22 00:01.02
Step 3 03:07.84 03:08.42 00:00.58 03:56.35 03:57.27 00:00.92
Step 4 03:08.86 03:16.42 00:07.56 03:58.18 04:08.25 00:10.07
Step 5 03:16.52 03:17.30 00:00.78 04:08.42 04:09.91 00:01.49
Step 6 03:17.57 03:18.42 00:00.85 04:10.18 04:11.57 00:01.39
Step 7 03:18.49 03:18.96 00:00.47 04:11.84 04:12.62 00:00.78
Step 8 03:19.44 03:20.18 00:00.74 04:12.96 04:14.25 00:01.29
Step 9 03:38.15 03:39.03 00:00.88 04:31.91 04:32.69 00:00.78
Step 10 03:40.45 03:45.33 00:04.88 04:34.32 04:39.51 00:05.19
Step 11 03:45.37 03:46.08 00:00.71 04:39.61 04:40.22 00:00.61
Step 12 03:47.40 03:47.84 00:00.44 04:41.32 04:41.71 00:00.39
Step 13 04:16.79 04:18.05 00:01.26 05:02.66 05:04.09 00:01.43
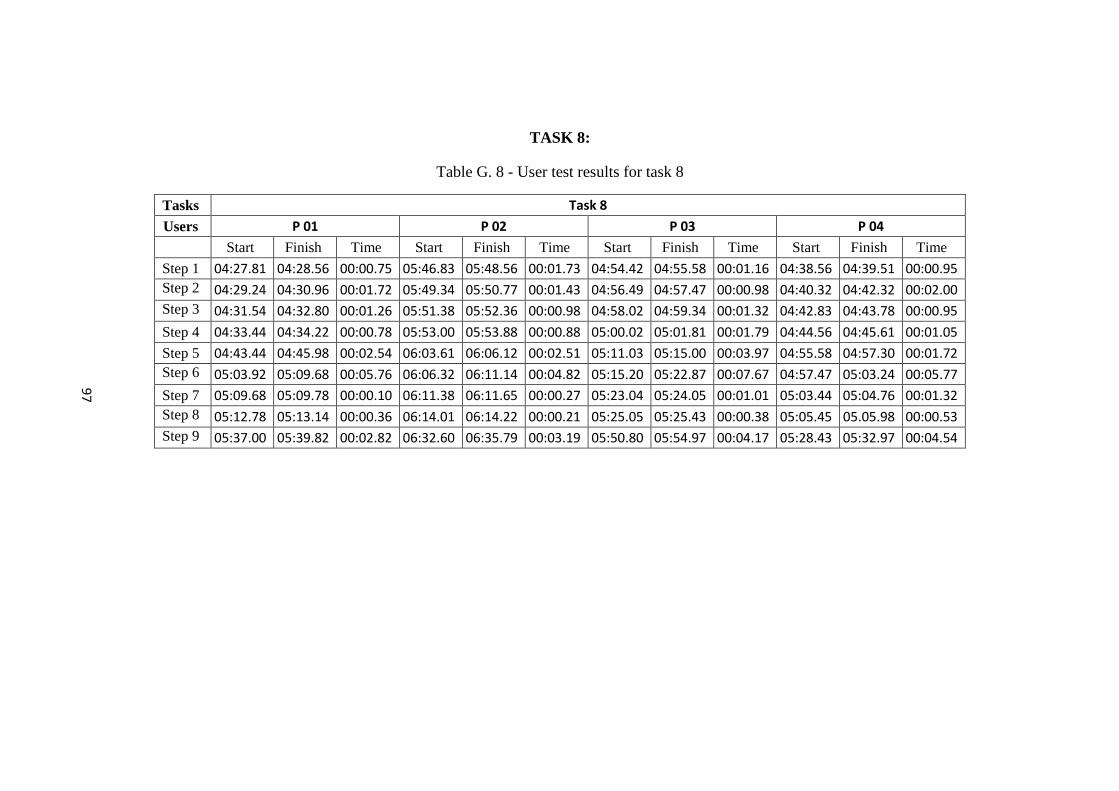
97
TASK 8:
Table G. 8 - User test results for task 8
Tasks Task 8
Users P 01 P 02 P 03 P 04
Start Finish Time Start Finish Time Start Finish Time Start Finish Time
Step 1 04:27.81 04:28.56 00:00.75 05:46.83 05:48.56 00:01.73 04:54.42 04:55.58 00:01.16 04:38.56 04:39.51 00:00.95
Step 2 04:29.24 04:30.96 00:01.72 05:49.34 05:50.77 00:01.43 04:56.49 04:57.47 00:00.98 04:40.32 04:42.32 00:02.00
Step 3 04:31.54 04:32.80 00:01.26 05:51.38 05:52.36 00:00.98 04:58.02 04:59.34 00:01.32 04:42.83 04:43.78 00:00.95
Step 4 04:33.44 04:34.22 00:00.78 05:53.00 05:53.88 00:00.88 05:00.02 05:01.81 00:01.79 04:44.56 04:45.61 00:01.05
Step 5 04:43.44 04:45.98 00:02.54 06:03.61 06:06.12 00:02.51 05:11.03 05:15.00 00:03.97 04:55.58 04:57.30 00:01.72
Step 6 05:03.92 05:09.68 00:05.76 06:06.32 06:11.14 00:04.82 05:15.20 05:22.87 00:07.67 04:57.47 05:03.24 00:05.77
Step 7 05:09.68 05:09.78 00:00.10 06:11.38 06:11.65 00:00.27 05:23.04 05:24.05 00:01.01 05:03.44 05:04.76 00:01.32
Step 8 05:12.78 05:13.14 00:00.36 06:14.01 06:14.22 00:00.21 05:25.05 05:25.43 00:00.38 05:05.45 05.05.98 00:00.53
Step 9 05:37.00 05:39.82 00:02.82 06:32.60 06:35.79 00:03.19 05:50.80 05:54.97 00:04.17 05:28.43 05:32.97 00:04.54

98
Tasks Task 8
Users P 05 P 06 P 07 P 08
Start Finish Time Start Finish Time Start Finish Time Start Finish Time
Step 1 03:51.74 03:53.27 00:01.53 06:25.31 06:26.09 00:00.78 06:27.17 06:28.12 00:00.95 05:34.36 05:37.41 00:03.05
Step 2 03:54.05 03:55.27 00:01.22 06:26.90 06:29.68 00:02.78 06:29.01 06:29.99 00:00.98 05:37.88 05:38.63 00:00.75
Step 3 03:57.81 03:59.95 00:02.14 06:30.26 06:32.16 00:01.90 06:30.56 06:31.65 00:01.09 05:39.21 05:40.66 00:01.45
Step 4 04:00.56 04:01.81 00:01.25 06:32.70 06:33.45 00:00.75 06:32.26 06:33.01 00:00.75 05:41.24 05:42.05 00:00.81
Step 5 04:11.68 04:14.79 00:03.11 06:43.11 06:44.53 00:01.42 06:53.82 06:55.68 00:01.86 05:53.04 05:56.26 00:03.22
Step 6 04:15.10 04:21.30 00:06.20 06:44.63 06:53.24 00:08.61 06:55.85 07:02.70 00:06.85 05:56.49 05:59.58 00:03.09
Step 7 04:21.51 04:22.32 00:00.81 06:53.48 06:54.53 00:01.05 07:02.80 07:04.36 00:01.56 05:59.61 05:59.88 00:00.27
Step 8 04:23.52 04:23.99 00:00.47 06:55.49 06:55.89 00:00.40 07:05.81 07:06.18 00:00.37 06:01.54 06:01.97 00:00.43
Step 9 04:51.34 04:56.12 00:04.78 07:13.21 07:18.16 00:04.95 07:26.57 07:32.20 00:05.63 06:31.55 06:33.94 00:02.39

99
Tasks Task 8
Users P 09 P 10
Start Finish Time Start Finish Time
Step 1 04:27.54 04:29.34 00:01.80 05:10.29 05:11.98 00:01.69
Step 2 04:30.15 04:30.66 00:00.51 05:12.83 05:13.81 00:00.98
Step 3 04:31.20 04:32.35 00:01.15 05:14.32 05:15.58 00:01.26
Step 4 04:32.90 04:33.88 00:00.98 05:16.09 05:17.34 00:01.25
Step 5 04:45.37 04:48.32 00:02.95 05:27.00 05:30.60 00:03.60
Step 6 04:48.52 04:55.30 00:06.78 05:30.66 05:37.41 00:06.75
Step 7 04:55.47 04:55.71 00:00.24 05:37.61 05:39.24 00:01.63
Step 8 04:58.30 04:59.07 00:00.77 05:40.34 05:40.78 00:00.44
Step 9 05:23.24 05:27.44 00:04.20 06:05.78 06:08.39 00:02.61

RB‐SA01/F01 Rev:0 26.10.2011
TEZ FOTOKOPİ İZİN FORMU
ENSTİTÜ
Fen Bilimleri Enstitüsü
Sosyal Bilimler Enstitüsü
Uygulamalı Matematik Enstitüsü
Enformatik Enstitüsü
Deniz Bilimleri Enstitüsü
YAZARIN
Soyadı : ................................................................................................................................... Adı : ..................................................................................................................................... Bölümü : .................................................................................................................................
TEZİN ADI (İngilizce) : ............................................................................................................... .................................................................................................................................................. .................................................................................................................................................. .................................................................................................................................................. ..................................................................................................................................................
TEZİN TÜRÜ : Yüksek Lisans Doktora
1. Tezimin tamamı dünya çapında erişime açılsın ve kaynak gösterilmek şartıyla tezimin bir kısmı veya tamamının fotokopisi alınsın.
2. Tezimin tamamı yalnızca Orta Doğu Teknik Üniversitesi kullancılarının erişimine açılsın. (Bu
seçenekle tezinizin fotokopisi ya da elektronik kopyası Kütüphane aracılığı ile ODTÜ dışına dağıtılmayacaktır.)
3. Tezim bir (1) yıl süreyle erişime kapalı olsun. (Bu seçenekle tezinizin fotokopisi ya da
elektronik kopyası Kütüphane aracılığı ile ODTÜ dışına dağıtılmayacaktır.)
Yazarın imzası ............................ Tarih .............................