comparison of different methods for determination of amino ... · comparison of different methods...
TRANSCRIPT

Comparison of Different Methods for
Determination of Amino Acids Contents
in Food and Feed
Y. Zhang and J.M. Sido
(National Corn-to-Ethanol Research Center,, Edwardsville, IL)
S.N. Daniels
(Applied Biosystems, Framingham, MA)
R. Dickerson and L. Reimann
(Eurofins US in Des Moines,Des Moines, Iowa)
H. Hewitson and T.E. Wheat
(Waters Corporation, Milford, MA)
L. Novotny
(Olson Biochemistry Labs, South Dakota State University, Brookings SD)
J. Reuther, S. Ruiz and F. Sudradjat
(Eurofins Central Analytical Laboratories,Metairie, Louisiana)
K. Sjogren
(Minnesota Valley Testing Laboratories, New Ulm, MN)

Analytical Methods Used
• HPLC – ion exchange with ninhydrin post-column derivatization (3 labs)
• HPLC – ion exchange with o-phthaldialdehyde post-column derivatization (1 lab)
• HPLC – pre-column derivatization (ACCQ-Fluor Reagent Kit) with FLD (1 lab)
• UPLC – pre-column derivatization (6-aminoquinolyl-N-hydroxysuccinimidyl carbamate) (2 labs)
• LC/MS/MS – pre-column derivatization (iTRAQ™ reagent, an amine reactive compound) (2 labs).

Amino Acid Round Robin Design
• 15 amino acids:
Alanine, arginine, aspartic acid, glycine, glutamic acid, histidine, isoleucine, leucine, lysine,
phenylalanine, proline, serine, threonine, tyrosine and valine
• Seven samples:
1 amino acid hydrolysate standard (NIST)
1 peanut butter (NIST)
5 DDGS hydrolysates (triplicate and 2 NIST-STD spiked hydrolysates)
• Performance Criteria:
Precision (DDGS hydrolysate triplicate)
Accuracy (amino acid hydrolysate standard from NIST, food hydrolysate from NIST, DDGS hydrolysate spiked with NIST standard)

Amino Acid Round Robin Design(AOCS)
15 amino acids:
Alanine, arginine, aspartic acid, glycine, glutamic acid, histidine, isoleucine, leucine, lysine, phenylalanine, proline, serine, threonine, tyrosine and valine
Five samples:
soybean, soybean meal, swine diet, poultry diet and BSA
Test Methods:
GC/MS/MS (1 lab)
UPLC – pre-column derivatization (6-aminoquinolyl-N-hydroxysuccinimidyl
carbamate) (2 labs)
Test Scheme:
Test each sample three times a week in 5 consecutive weeks

Data Evaluation
• Variation by individual methods
• Variation by individual amino acids
• Variation by individual labs
• Variation by sample matrix

Amino Acid Round Robin Studies
Precision

Precision (RSD, %)(Based on DDGS hydrolysate triplicate)
HPLC-POSUPLC-PRE LCMSMS-PREHPLC-PRE
0
2
4
6
8
10
12
14
Lab
B
Lab
C
Lab
G
Lab
E
Lab
J
Lab
H
Lab I Lab
D
Pre
cisi
on
(R
SD
, %
)
Asp
Thr
Ser
Glu
Pro
Gly
Ala
Val
Isl
Leu
Tyr
Phe
Lys
His
Arg

Precision (RSD, %)(Based on DDGS hydrolysate triplicate)
Methods Lab 1 Lab 2 Lab 3 Mean(of all labs)
HPLC
Post–Column
Deriv.
1.9*( 0.3)
2.4( 0.7)
1.1( 0.5)
1.8( 0.7)
UPLC
Pre-Column
Deriv.
3.5( 1.3)
0.6( 0.1)
2.1( 2.1)
LC/MS/MS
Pre-Column
Deriv.
2.1( 1.4)
4.9( 1.2)
3.5( 2.0)
HPLC
Pre-Column
Deriv.
8 8
* Mean of 15 amino acids

Precision (RSD, %)(Soy bean sample, tested in 5-week period, mean of 15 data points)
0.0
0.5
1.0
1.5
2.0
2.5
3.0
3.5
4.0
Lab 1 Lab 2 Lab 3
Pre
cis
ion
(R
SD
, %
)
Asp
Thr
Ser
Glu
Pro
Gly
Ala
Val
Isl
Leu
Tyr
Phe
Lys
His
Arg
UPLC-PREGC-MS-MS

Precision (RSD, %)(Soy bean sample, tested in 5-week period, mean of 15 data points)
Methods Lab 1 Lab 2 Mean(of all labs)
GC-MS-MS 1.6*( 0.5)
1.6( 0.5)
UPLC
Pre-Column
Deriv.
1.6( 0.9)
0.8( 0.7)
1.2( 0.5)
* Mean of 15 amino acids

Summary on Precision
• Precision is method dependent: HPLC post–column derivatization has the best performance (RSD < 2%) and HPLC pre-column derivatization has the highest RSD.
• Most methods investigated show satisfying precision for within batch and between batch runs.
• More data points needed to produce statistically sound conclusion.

Amino Acid Round Robin Study
Accuracy

Accuracy (Recovery, %)(Based on NIST amino acid hydrolysate standard)
80
90
100
110
120
130
140
Lab B Lab C Lab G Lab E Lab J Lab H Lab I Lab D
Ac
cu
rac
y (
Re
co
ve
ry, %
)
Asp
T hr
Ser
Gl u
Pr o
Gl y
A l a
Val
Isl
Leu
T yr
Phe
Lys
Hi s
Ar g
HPLC-POS UPLC-PRE LCMSMS-PRE HPLC-PRE

Accuracy (Recovery, %)(Based on NIST amino acid hydrolysate standard)
Methods Lab 1 Lab 2 Lab 3 Mean(of all labs)
HPLC
Post–Column Deriv.
98*( 8)
104( 8)
105( 8)
102( 3)
UPLC
Pre-Column Deriv.
96( 9)
105( 7)
100( 6)
LC/MS/MS
Pre-Column Deriv.
93( 5)
107( 8)
100( 10)
HPLC
Pre-Column Deriv.
105 105
* Mean of 15 amino acids

Amino Acid Contents in DDGS Hydrolysate
0.0
10.0
20.0
30.0
40.0
50.0
60.0
70.0
Lab
B
Lab
C
Lab
G
Lab E Lab J Lab
H
Lab I Lab
D
Am
ino
Acid
Co
nte
nt
in D
DG
S H
yd
roly
sate
(u
g / m
l)
Asp
Thr
Ser
Glu
Pro
Gly
Ala
Val
Isl
Leu
Tyr
Phe
Lys
His
Arg
HPLC-POS UPLC-PRE LCMSMS-PRE HPLC-PRE
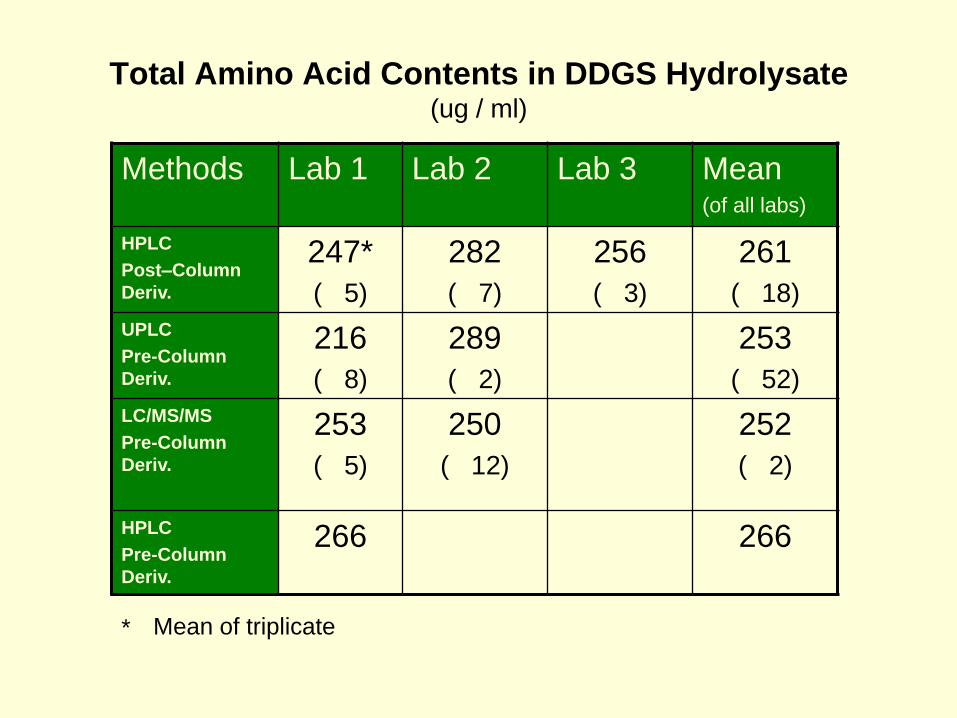
Total Amino Acid Contents in DDGS Hydrolysate(ug / ml)
Methods Lab 1 Lab 2 Lab 3 Mean(of all labs)
HPLC
Post–Column
Deriv.
247*
( 5)
282
( 7)
256
( 3)
261
( 18)
UPLC
Pre-Column
Deriv.
216
( 8)
289
( 2)
253
( 52)
LC/MS/MS
Pre-Column
Deriv.
253
( 5)
250
( 12)
252
( 2)
HPLC
Pre-Column
Deriv.
266 266
* Mean of triplicate

Accuracy (Recovery, %)(DDGS hydrolysate spiked I)
65
75
85
95
105
115
125
135
145
Lab B Lab C Lab G Lab E Lab J Lab H Lab I Lab D
Accu
racy (
Reco
very
, %
)
Asp
Thr
Ser
Glu
Pro
Gly
Ala
Val
Isl
Leu
Tyr
Phe
Lys
His
Arg
HPLC-POS UPLC-PRE LCMSMS-PRE HPLC-PRE

Accuracy (Recovery, %)(DDGS hydrolysate spiked I)
Methods Lab 1 Lab 2 Lab 3 Mean(of all labs)
HPLC
Post–Column Deriv.
105*( 5)
94( 8)
102( 7)
101( 6)
UPLC
Pre-Column Deriv.
115( 4)
99( 6)
107( 11)
LC/MS/MS
Pre-Column Deriv.
102( 3)
98( 13)
100( 2)
HPLC
Pre-Column Deriv.
114 114
* Mean of 15 amino acids

Accuracy (Recovery, %)(DDGS hydrolysate spiked II)
65
75
85
95
105
115
125
135
145
155
Lab B Lab C Lab G Lab E Lab J Lab H Lab I Lab D
Acc
ura
cy (
Rec
ove
ry,
%)
Asp
Thr
Ser
Glu
Pro
Gly
Ala
Val
Isl
Leu
Tyr
Phe
Lys
His
Arg
HPLC-POS UPLC-PRE LCMSMS-PRE HPLC-PRE

Accuracy (Recovery, %)(DDGS hydrolysate spiked II)
Methods Lab 1 Lab 2 Lab 3 Mean(of all labs)
HPLC
Post–Column Deriv.
103*( 5)
100( 8)
100( 8)
101( 2)
UPLC
Pre-Column Deriv.
106( 5)
97( 8)
101( 6)
LC/MS/MS
Pre-Column Deriv.
102( 6)
98( 17)
100( 3)
HPLC
Pre-Column Deriv.
93 93
* Mean of 15 amino acids

Summary on Accuracy
(in testing hydrolysate)
• The three methods: HPLC post–column, UPLC
and LC/MS/MS give similar performance,
which have 100% recovery for most amino
acids, with the HPLC post–column method
being the most consistent.
• Except for LC/MS/MS, all the other methods
have higher than 120% recovery for histidine.
• More data points needed to produce
statistically sound conclusion.

Amino Acid Round Robin Studies
(Based on food and feed samples)

Accuracy (Recovery, %)(Peanut Butter Standard, NIST)
75
85
95
105
115
125
135
145
155
165
175
Lab
B
Lab
C
Lab
G
Lab
E
Lab
J
Lab
H
Lab
I
Lab
D
Ac
cu
rac
y (
RS
D, %
)Asp
Thr
Ser
Glu
Pro
Gly
Ala
Val
Isl
Leu
Tyr
Phe
Lys
His
Arg
HPLC-POS UPLC-PRE LCMSMS-PRE HPLC-PRE

Record of Accuracy(Recovery, %, based on NIST Peanut Butter)
Methods Lab 1 Lab 2 Lab 3 Mean(of all labs)
HPLC
Post–Column Deriv. 105 *( 8)
114( 17)
106( 12)
108( 5)
UPLC
Pre-Column Deriv. 98( 8)
120( 7)
98( 16)
LC/MS/MS
Pre-Column Deriv. 101( 9)
99( 6)
100( 1)
HPLC
Pre-Column Deriv. 102 102
* Mean of 15 amino acids

Amino Acid Contents in Soybean
UPLC-PREGC-MS-MS
1.00
1.50
2.00
2.50
3.00
3.50
4.00
Lab 1 Lab 2 Lab 3
Am
ino
Ac
id C
on
ten
t (%
, w
t/w
t, a
s r
ec
.)
Asp
Thr
Ser
Glu
Pro
Gly
Ala
Val
Isl
Leu
Tyr
Phe
Lys
His
Arg

Total Amino Acid Contents in Soy Bean
(wt/wt, %, as-rec.)
Methods Lab 1 Lab 2 Mean(of all labs)
GC-MS-MS 45.6*( 0.5)
45.6
UPLC
Pre-Column
Deriv.
41.7( 0.5)
45.6( 0.2)
43.6
( 2.7)
* Mean of 15 runs

Comparison on other Factors
Methods Run Time
(minutes)
Price
($)
HPLC
Post–Column Deriv.60 180
UPLC
Pre-Column Deriv.10 100
LC/MS/MS
Pre-Column Deriv.24 200
HPLC
Pre-Column Deriv.40 250

Summary on Accuracy
in testing food and feed
• The three methods: HPLC post–column,
UPLC and LC/MS/MS give similar
performance, which have 100% recovery
for most amino acids, with the HPLC
post–column method being the most
consistent.
• More data points needed to produce
statistically sound conclusion.