comparison of fiber length analyzers - usda forest service · comparison of fiber length analyzers...
TRANSCRIPT
Comparison of Fiber Length Analyzers
Don Guay Nancy Ross Sutherland Walter Rantanen Assistant Professor Supervisory General Engineer Group Leader Paper Science Department USDA FS Forest Products Laboratory Integrated Paper Services, Inc. UW-Stevens Point One Gifford Pinchot Drive 101 West Edison Ave, Suite 250 Stevens Point, WI 54481 Madison, WI 53726 Appleton, WI 54915
Nicole Malandri Aimee Stephens Kathleen Mattingly Forest Products Technologist Forest Products Technologist Associate Scientist USDA FS Forest Products Laboratory USDA FS Forest Products Laboratory Integrated Paper Services, Inc. One Gifford Pinchot Drive One Gifford Pinchot Drive 101 West Edison Ave, Suite 250 Madison, WI 53726 Madison, WI 53726 Appleton, WI 54915
Matt Schneider Paper Science Student UW-Stevens Point Stevens Point, WI 54481
ABSTRACT
In recent years, several fiber new fiber length analyzers have been developed and brought to market. The new instruments provide faster measurements and the capability of both laboratory and on-line analysis. Do the various fiber analyzers provide the same length, coarseness, width, and fines measurements for a given fiber sample? This paper provides a comparison of fiber length analyzers over a range of fiber types.
Integrated Paper Services, Inc., the USDA FS Forest Products Laboratory, and the Paper Science Department at UW-Stevens Point evaluated six distinct pulp samples using the FS-200, Fibermaster, MorFi, Fiber Lab, FQA (Fiber Quality Analyzer) and HI Res FQA analyzers. Each optical fiber length instrument studied provides repeatable measurements for fiber length, coarseness, width, and fines. However, there were measurement differences between the instruments. Given the fact that the various instruments have unique hardware and software, these measurement differences were expected. Fiber length, width, and coarseness, and fines measurements generally correlate well between instruments indicating that calibration between instruments is possible. Fines measurements do not correlate between the MorFi and the other instruments because the MorFi measures and reports fines on a different basis.
INTRODUCTION
The science of optical fiber length analyzers has changed significantly during the past few years. Instrument manufacturers have brought several new or re-designed fiber length analyzers to market. The new instruments have been designed to provide fast, reliable on-line and off-line fiber analysis results. Since the newer instruments also include information such as width, kink, curl, and data on other fiber properties, these instruments are also commonly referred to fiber morphology analyzers. The goal of this work was to explore measurement differences between the various optical fiber length instruments. Integrated Paper Services (IPS), Inc., the USDA FS Forest Products Laboratory (FPL), and the Paper Science Department at UW-Stevens Point evaluated identical samples using the FS-200, Fibermaster, MorFi, Fiber Lab, and FQA (Fiber Quality Analyzer) analyzers. A group in Europe recently completed a similar study (1). However, this study did not include the FQA which is a very common instrument in North America. As our research continues we intend to include the Kajaani FS-300 instrument as well.

EXPERIMENTAL
Ten replicates of six different pulp samples were analyzed on five optical fiber length analyzers for comparison. The six pulp samples chosen provide a range of short to long fiber sources. Each lab ran ten replicates of each pulp sample to investigate the repeatability of each instrument. Researchers at UW-Stevens Point carried out the Kajaani FS-200 and Fiber Lab measurements. Packaging Corporation of America at the Tomahawk, Wisconsin mill, provided access to the Fiber Lab. Integrated Paper Services, Inc. performed the MorFi and Fibermaster analyses. The USDA FS Forest Products Laboratory in Madison, WI analyzed the pulp samples using the FQA and the HiRes FQA. An upgrade to FPL’s FQA to the high resolution FQA (HiRes FQA) was completed after samples were run on the FQA. As an added experimental factor, the Forest Products Laboratory also analyzed each sample with the HiRes FQA using the same settings used on the FQA before the upgrade.
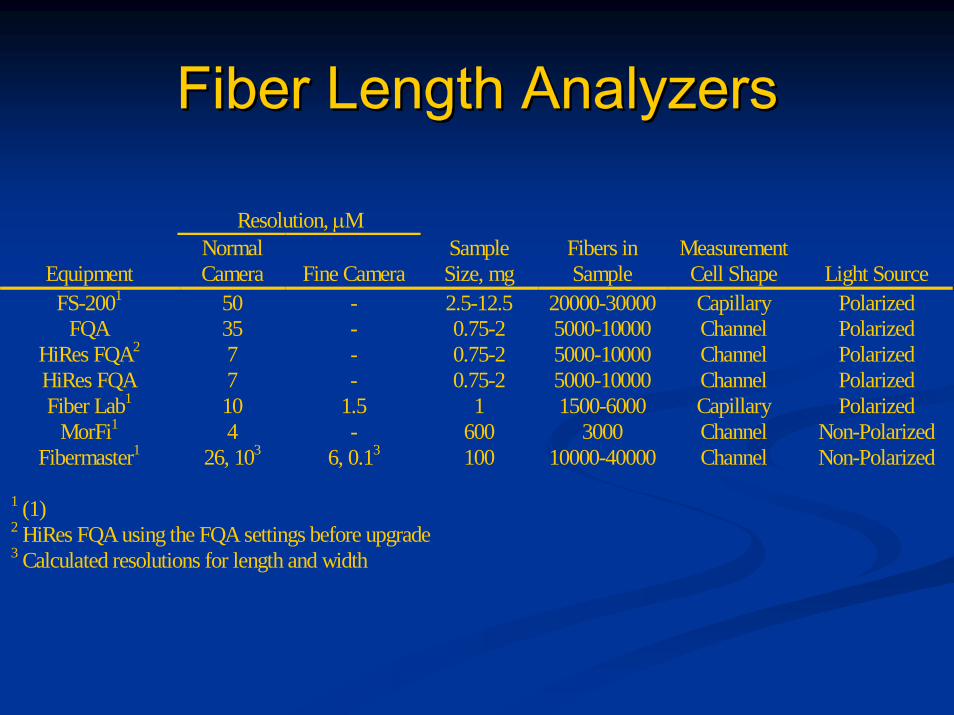
Each fiber length analyzer evaluated during this project has distinctive design characteristics including resolution, sample size, number of cameras and light source. Table I summarizes the major design differences between the instruments.
Table I – Fiber Length Analyzer Design Characteristics
Resolution, µM Normal
Equipment Camera Fine Camera FS-2001 50 -
FQA 35 -HiRes FQA2 7 -HiRes FQA 7 -Fiber Lab1 10 1.5
MorFi1 4 -Fibermaster1 26, 103 6, 0.13
Sample Fibers in Measurement Size, mg Sample Cell Shape Light Source 2.5-12.5 20000-30000 Capillary Polarized 0.75-2 5000-10000 Channel Polarized 0.75-2 5000-10000 Channel Polarized 0.75-2 5000-10000 Channel Polarized
1 1500-6000 Capillary Polarized 600 3000 Channel Non-Polarized
100 10000-40000 Channel Non-Polarized
1 (1)2 HiRes FQA using the FQA settings before upgrade 3 Calculated resolutions for length and width
Table II lists each of the six pulp types analyzed during this project. Each laboratory initially prepared the six pulpsamples for measurement using the same procedure. 24 OD gram samples of each pulp were disintegrated in a standard British Disintegrator at the temperature and number of revolutions listed in Table II. After disintegration,each lab followed the equipment manufacturer specifications for the final preparation to analyze each sample.
Table II – Pulp Samples and Preparation
Pulp Disintegration Number of Number Pulp Description Temperature Revolutions
1 Recycled Market Pulp 23oC 6,000 2 Paprican Standard Reference Pulp – Unbleached Softwood Kraft 23oC 9,000 3 Softwood High Alpha Pulp 23oC 6,000 4 Softwood CTMP Pulp 90oC 30,000 5 NIST Reference Pulp – HWBK Eucalyptus 23oC 6,000 6 HWBK – Maple 23oC 3,000
RESULTS
Fiber Length
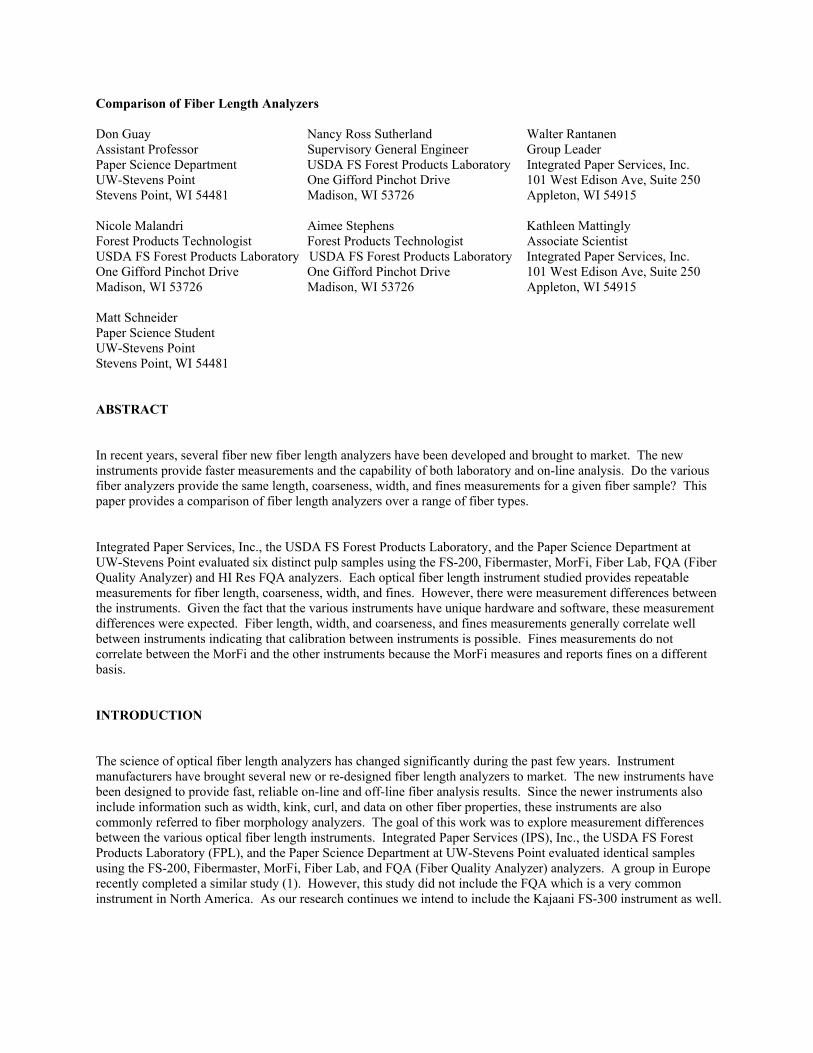
The original function of optical fiber length analyzers was measuring fiber length. The two fiber length measurements that all of the instruments have in common are arithmetic and length weighted fiber lengths. Arithmetic average fiber length is the sum of all of the individual fiber lengths divided by the total number of fibers measured (2,3). Figure 1 shows the arithmetic average fiber lengths measured for all 6 pulp samples by the various instruments.
The data in Figure 1 demonstrates clear differences in the arithmetic fiber length measurements between the different analyzers. The MorFi measurements provided the longest arithmetic average fiber length for each sample by an average of 39%. The MorFi value for the softwood high alpha pulp average arithmetic length seems to be unusually large compared to the other instruments. The HiRes FQA instrument arithmetic average lengths were shorter than the lengths measured by the FQA and the HiRes FQA with low resolution settings by an average of 24%. The Fibermaster correlated with the HiRes FQA instrument on all but one sample. FS-200, Fiber Lab, and FQA arithmetic average fiber lengths were in relative agreement for all samples.
Figure 1 - Arithmetic Fiber Length
1.6
1.4
1.2
1
0.8
0.6
0.4
0.2 1 2 3 4 5 6
Ari
thm
etic
Fib
er L
engt
h (m
m)
Kajaani FS-200
FQA
HiRes FQA (FQA Settings) HiRes FQA
Fiber Lab
MorFi
Fibermaster
Sample Number
A Statistical analysis using the Tukey procedure for comparison of means using α=0.05 was used to compare the average arithmetic fiber lengths. This procedure allows the comparison of pairs of means in a study with more than two means (4). Tukey analysis of the arithmetic fiber length results places the fiber length analyzers into three groups. The MorFi is statistically higher than the other instruments. The FS-200, Fiber Lab, FQA, and HiRes FQA (using the FQA settings before upgrade) are statistically equivalent. The Fibermaster and HiRes FQA are statistically similar but lower than the other instruments.

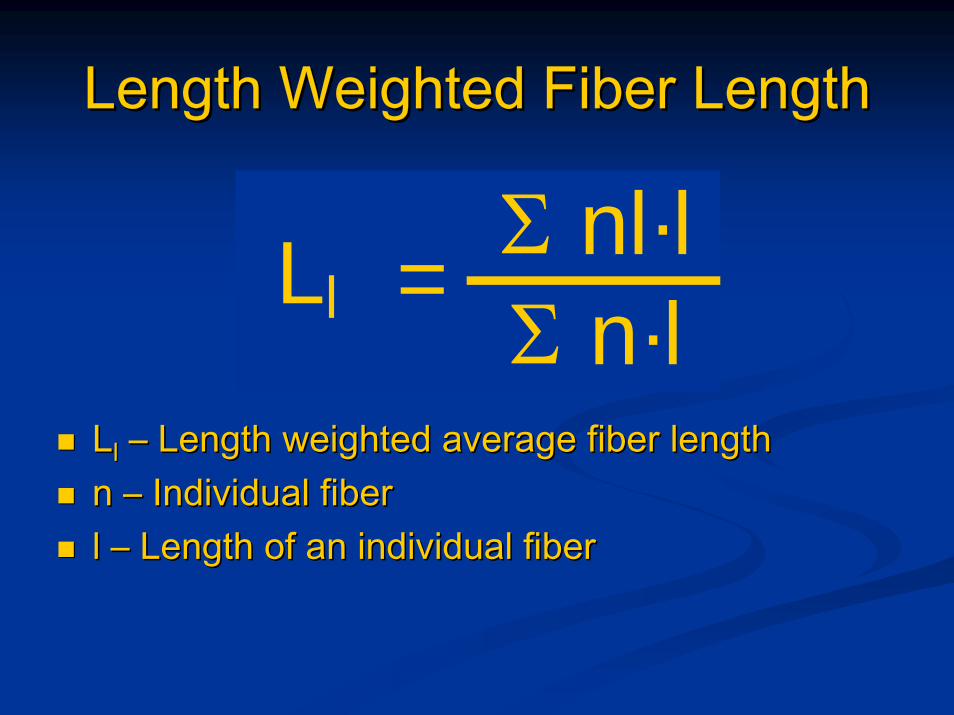
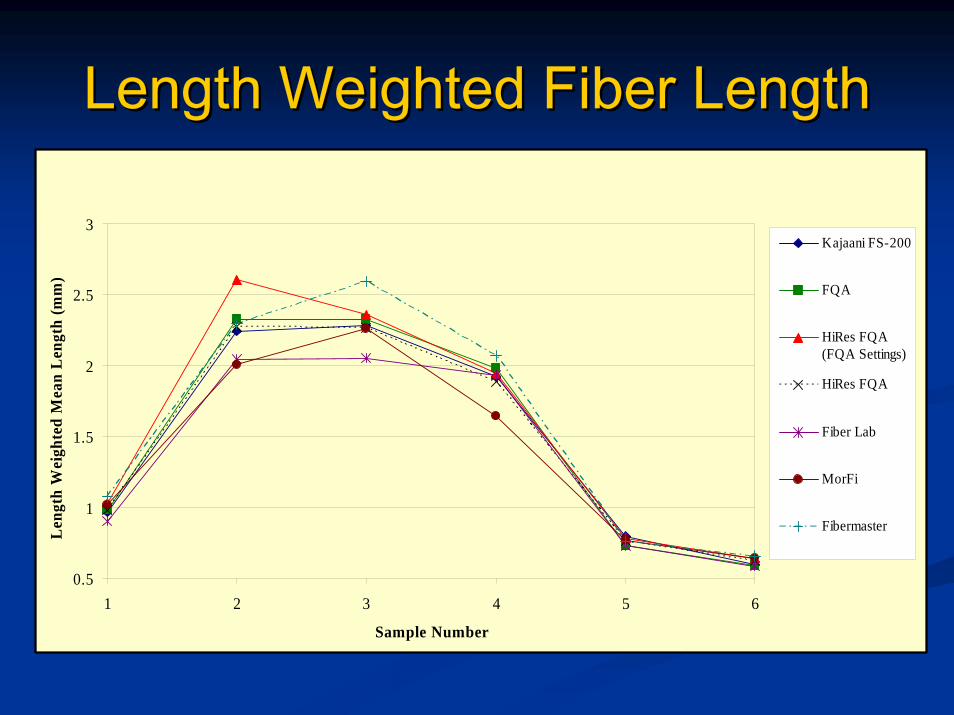
The paper industry frequently discusses fiber length in terms of length weighted average. Length weighted average fiber length is calculated as the sum of individual fiber lengths squared divided by the sum of the individual fiber lengths (2,3). Figure 2 shows the average length weighted fiber lengths measured on each pulp sample by the various instruments.
Figure 2 – Length Weighted Fiber Length
3
2.5
2
1.5
1
0.5
Len
gth
Wei
ghte
d M
ean
Len
gth
(mm
)
FQA
)
MorFi
Kajaani FS-200
HiRes FQA (FQA Settings
HiRes FQA
Fiber Lab
Fibermaster
1 2 3 4 5 6
Sample Number
The length weighted average fiber lengths show relative agreement between all of the instruments for all of the samples. The level of agreement is best for pulp samples with shorter fiber lengths. Tukey analysis results show that the Fibermaster is statistically higher than the other instruments. The FS-200 and FQA (All variations) length weighted lengths are equivalent. The MorFi and Fiber Lab lengths are statistically equivalent but lower than the other instruments.
Fiber Width
All of the newly designed instruments have the ability to measure fiber width. The data in Figure 3 shows the MorFi and Fibermaster measured higher fiber widths than the FQA and Fiber Lab by an average of 20%. We believe that the difference in width measurements could result from polarized versus non-polarized light sources. Tukey analysis confirms that the MorFi and Fibermaster width results are statistically equivalent but higher than the HIRes FQA and Fiber Lab measured widths which are also statistically similar.

Figure 3 – Average Fiber Width
40
35
30
25
20
15
10
Fibe
r W
idth
(mm
)
HiRes FQA (FQA Settings)
HiRes FQA
Fiber Lab
MorFi
Fibermaster
1 2 3 4 5 6
Sample Number
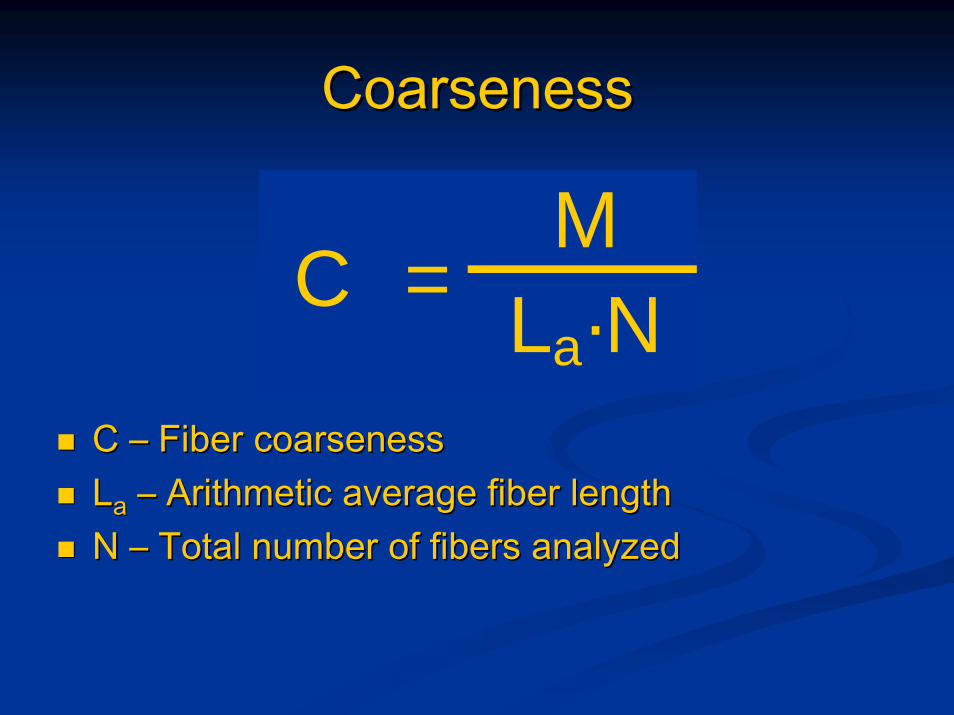
Coarseness
Coarseness is a measure of milligrams of fiber per meter of fiber length. Figure 4 shows the coarseness measurements for each pulp sample by the various fiber length analyzers.
Figure 4 – Coarseness
0
Coa
rsen
ess (
mg/
m)
)
0.05
0.1
0.15
0.2
0.25
0.3
0.35
0.4
Kajaani FS-200
FQA
HiRes FQA (FQA Settings
HiRes FQA
Fiber Lab
MorFi
Fibermaster
1 2 3 4 5 6
Sample Number

The FS-200 and Fiber Lab coarseness values read higher than the other instruments by an average of 23%. This difference is probably due to manufacturer differences since Metso manufactures both the FS-200 and Fiber Lab. Operator differences could also be a factor since one lab completed the testing with the FS-200 and Fiber Lab.
Tukey analysis shows that the FS-200 and Fiber Lab coarseness values are statistically equivalent and higher than the other instruments. This result is not unusual given that one instrument manufacturer builds both instruments. The MorFi, Fibermaster, and FQA coarseness values are similar.
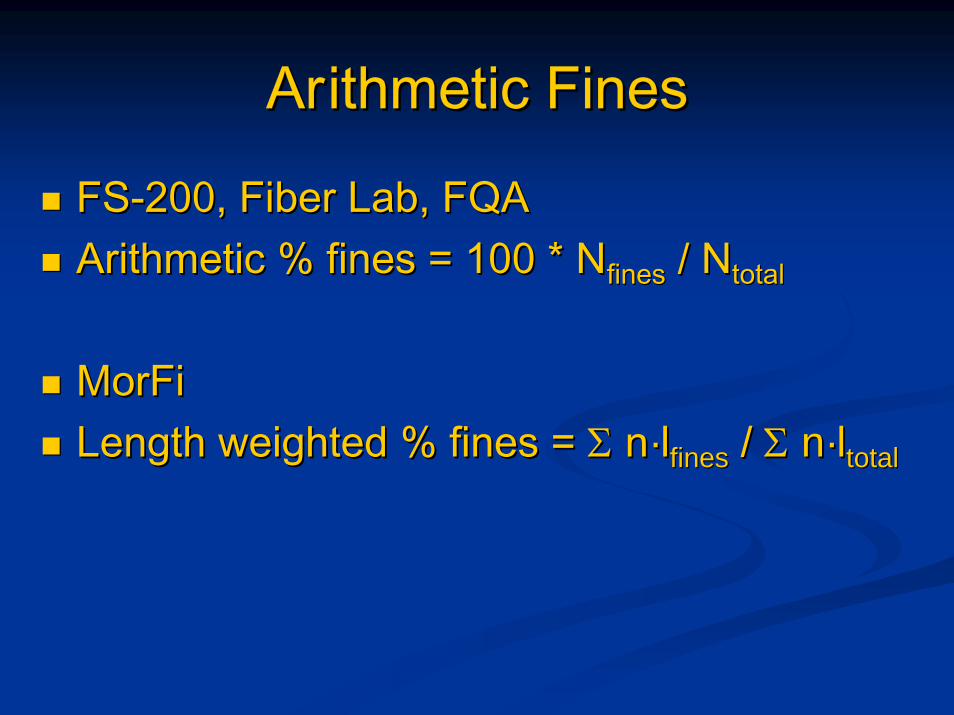
Fines
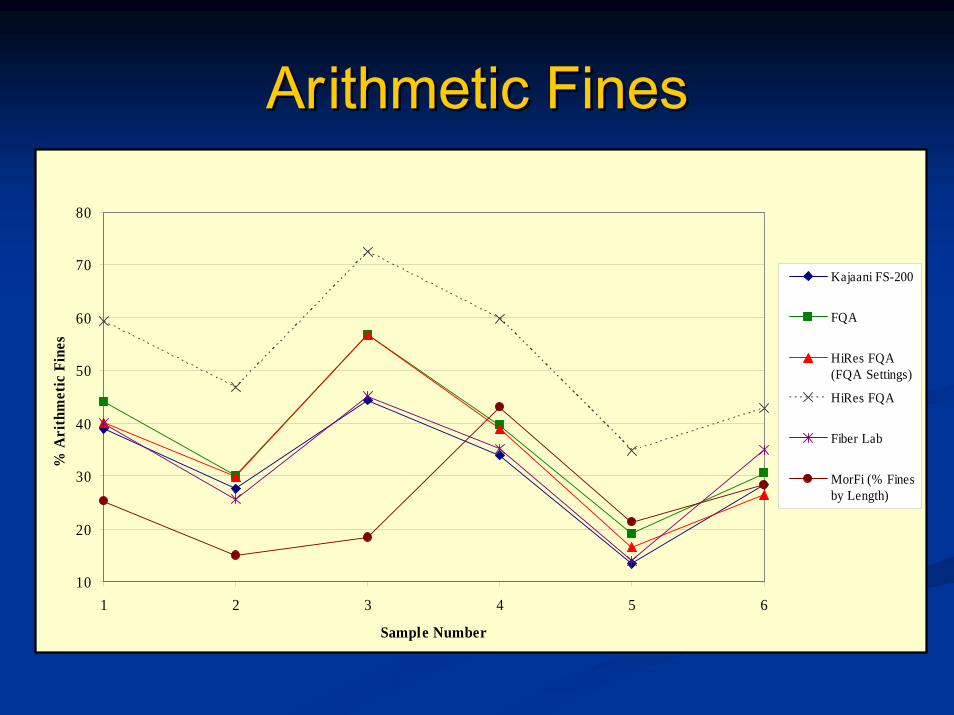
Optical fiber length analyzers typically define fines as objects that are less than 0.20 mm in length and report fines as a total percentage of fiber based on an arithmetic basis or length weighted basis. The percentage of fines on an arithmetic basis is the number of fines divided by the total number of fibers (fines included) multiplied by 100. The percentage of fines on a length weighted basis is the sum of the fines length divided by the total length of fibers and fines in the sample. The Kajaani FS-200 and FQA report the percentage of fines based on an arithmetic basis and length weighted basis. The Fiber Lab calculates the percentage of fines as an arithmetic percentage. The Fibermaster reports fines as a percentage on a length weighted basis. The MorFi reports fines as a percentage of total fiber length or total fiber area. Figure 5 shows the arithmetic fines data for the various pulp samples taken from the FS-200, FQA, and Fiber Lab. Figure 5 also includes the % fines by length data from the MorFi.
Figure 5 – Arithmetic Fines
10
20
30
40
50
60
70
80
% A
rith
met
ic F
ines
FQA
HiRes FQA )
HiRes FQA
Kajaani FS-200
(FQA Settings
Fiber Lab
MorFi (% Fines by Length)
1 2 3 4 5 6
Sample Number
The HiRes FQA measured the highest percentage of fines on all of the samples by an average of 64%. The HiRes FQA and the MorFi are the only two high resolution instruments that report arithmetic fines. However, a direct comparison between the MorFi and the FQA is not possible since the MorFi does not calculate arithmetic fines.
Since the HiRes FQA can detect smaller particles, one would expect it to calculate a higher percentage of fines than the FS-200, Fiber Lab, and FQA. The run by HiRes FQA using the original FQA settings before the upgrade
%L
engt
h W
eigh
ted
Fine
smeasured a similar level of fines as the FQA which confirms the increase in fines is attributable to increase in instrument resolution.
Tukey analysis of the arithmetic fines data shows that the HiRes FQA is statistically higher than all of the other instruments. The FS-200, Fiber Lab, Fibermaster, FQA and Hi Res FQA (using FQA settings before upgrade are all statistically equivalent. The MorFi values are lower than the other instruments but it reports fines as a percentage of total length.
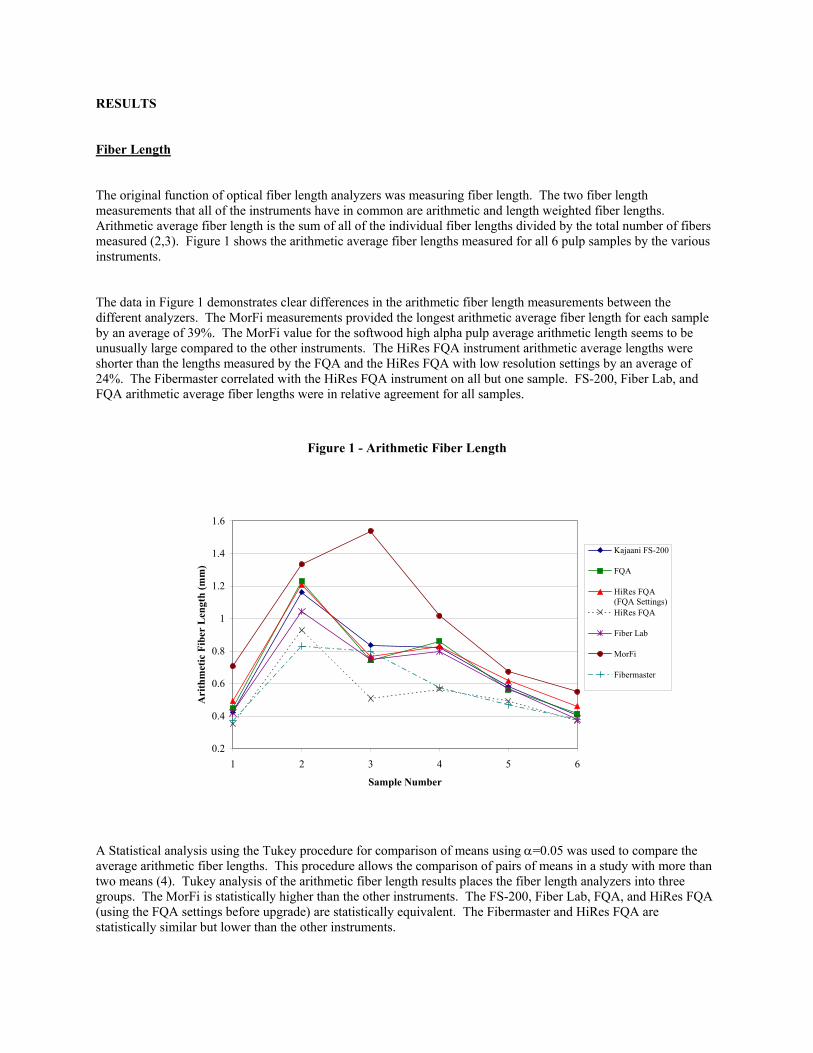
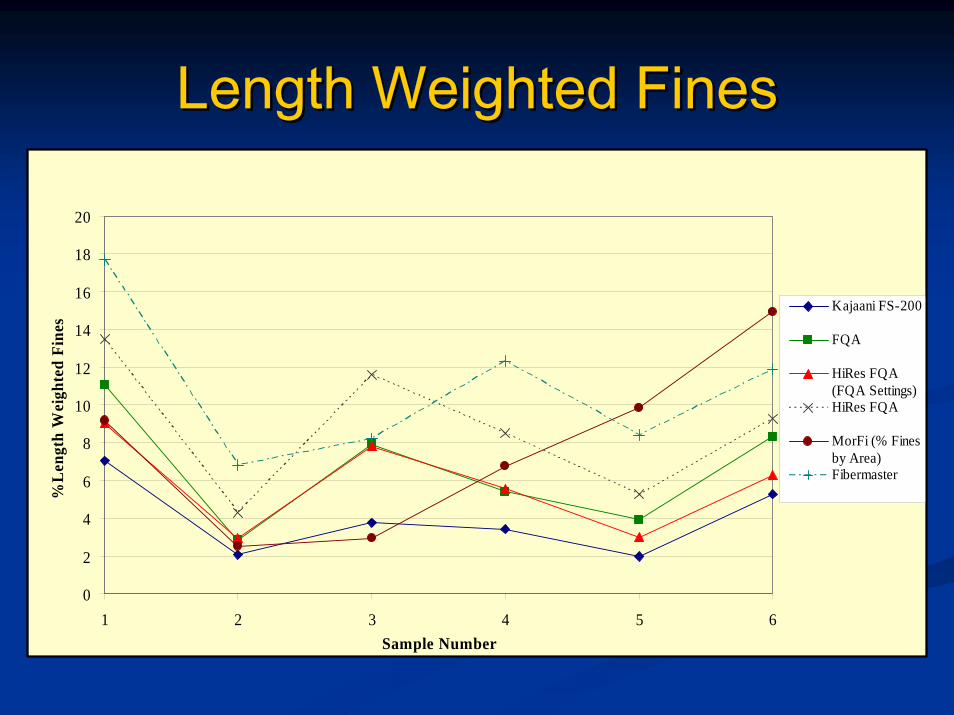
Most of the optical analyzers also report fines as a length weighted percentage. The percentage of fines is the sum of the number of fines in each fines length class multiplied by the average class length divided by the total fiber length in the sample. The MorFi reports fines as a percentage of the total fiber area. Figure 6 shows the length weighted fines data for the various pulp samples taken from the FS-200, FQA, and Fibermaster. Figure 6 also includes the % fines by area data from the MorFi.
Figure 6 – Length Weighted Fines
20
18
16
14
12
10
8
6
4
2
0
1 2 3 4 5 6
FQA
Kajaani FS-200
HiRes FQA (FQA Settings) HiRes FQA
MorFi (% Fines by Area) Fibermaster
Sample Number
Length weighted fines results showed the least amount of agreement for all of the fiber properties discussed in this paper. Tukey analysis shows that none of the instruments report statistically equivalent length weighted fines with the exception of the FQA and HiRes FQA (using FQA settings before upgrade). The MorFi fines percent by area does not correlate to the length weighted fines reported by the other instruments.

Repeatability
Repeatability is a measure of a test’s ability to provide the same value from one test to another for the same sample. In the case of optical fiber length analyzers, repeatability is dependent on the instrument, sample, and operator. The calculation for repeatability is 2.77 times the sample standard deviation divided by the square root of the number of replicates. Since the number of replicates in this study was 10 for every sample, we can compare the repeatability of each instrument by studying the standard deviation for each measurement. Table III shows the standard deviations for each measurement discussed in this paper.
Table III – Measurement Standard Deviations
Measurement Standard Deviations
Arithmetic Equipment Length
FS-200 0.017 FQA 0.016
HiRes FQA1 0.024 HiRes FQA 0.021 Fiber Lab 0.029
MorFi 0.013 Fibermaster 0.023
Length Weighted
Length Width Coarseness 0.036 - 0.012 0.022 - 0.006 0.030 0.233 0.003 0.032 0.233 0.003 0.041 0.360 0.021 0.021 0.157 0.008 0.028 0.188 0.020
1 used FQA settings before upgrade
None of the measurement standard deviations suggest that one instrument is clearly more repeatable than another. The FQA coarseness measurements have low variability, but its coarseness procedure is different than the other instruments. Before measuring coarseness on the FQA, the operator prepares a 1 gram handsheet. During handsheet preparation, the operator rinses the handsheet 10 times in the handsheet mold. This effectively reduces the amount of fines present in the sample. The data in Table III suggests that this sample preparation technique lowers the variability of the coarseness measurements.
CONCLUSIONS
The results of this study and previous research show that the optical fiber length analyzers available on the market today do not provide the same values on common pulp samples (1). Measurement differences between instruments are expected given the known differences in hardware and mostly likely software in each instrument design. However, most of the data discussed in this paper suggests that the optical fiber length analyzers evaluated during this study correlate fairly well indicating that calibration between instruments is possible.
ACKNOWLEDGMENTS
The authors are grateful to Packaging Corporation for granting access to the Fiber Lab at their Tomahawk, WI mill. We also wish to thank Daniel Gerhardt at the USDA FS Forest Products Laboratory for performing Tukey comparisons of our data.

REFERENCES
1. Turunen, M., Le Ny, C., Tienvieri, T., and Niinimaki, J., “Comparison of Fiber Morphology Analyzers”, APPITA Journal, 58(1) pp. 28-32(2005).
2. Ring, G. J. F., and Bacon, A. J., “Multiple Component Analysis of Fiber Length Distributions”, TAPPI Journal, 78(7), pp. 224-231(1997).
3. Robertson, G., Olson, J., Allen, P., Chan, B. and Seth, R., “Measurement of Fiber Length, Coarseness, and Shape with the Fiber Quality Analyzer”, TAPPI Journal, 82(10), pp. 93-98(1999).
4. Devore, J., and Farnum, N., Applied Statistics for Engineers and Scientists, Second Edition, Brooks/Cole Publishing, Belmont, CA, 2005, pp. 417-420.

Comparison of Fiber
Don Guay
Comparison of Fiber Length AnalyzersLength Analyzers
Don Guay Nancy Ross Sutherland Walter RantanenNancy Ross Sutherland Walter RantanenMatt SchneiderMatt Schneider Aimee StephensAimee Stephens Kathleen Mattingly Kathleen Mattingly UWSPUWSP Nicole Malandri Nicole Malandri Integrated Paper ServicesIntegrated Paper Services
Forest Products LaboratoryForest Products Laboratory

Fiber Quality Analyzer (FQA)Fiber Quality Analyzer (FQA)
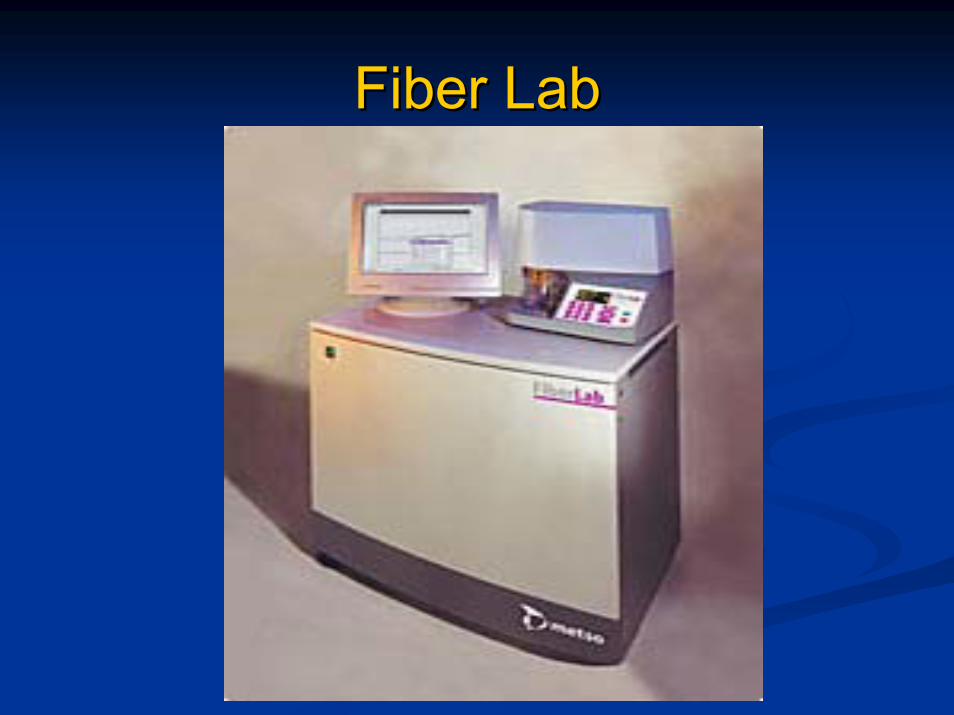
Fiber LabFiber Lab
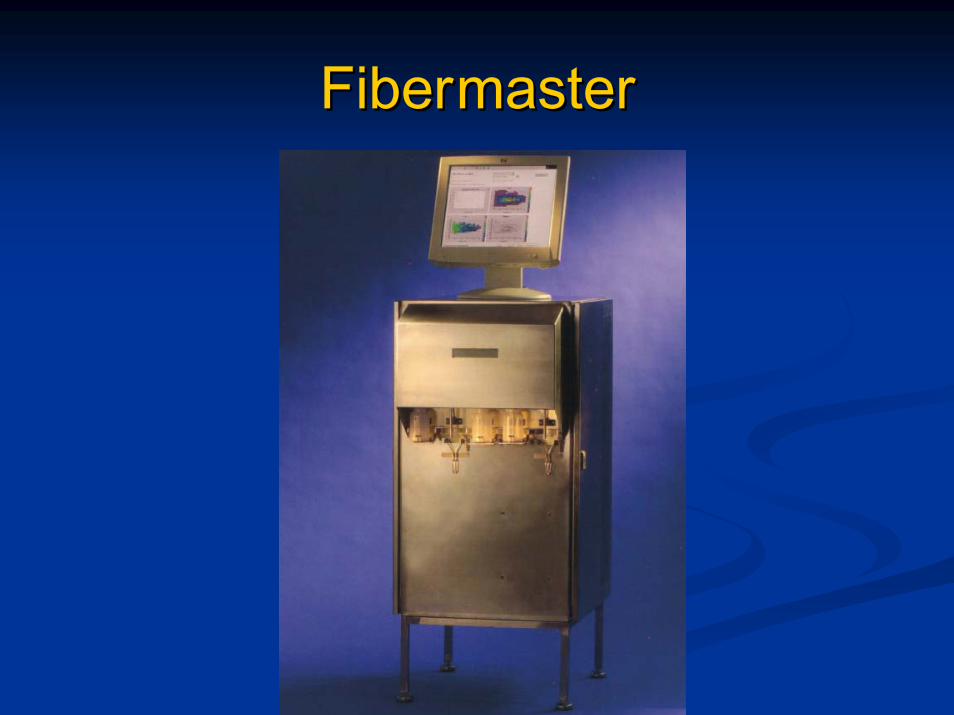
FiberFibermastermaster

MorFiMorFi
Fiber Length AnalyzersFiber Length Analyzers
Resolution, µM
Equipment Normal Camera Fine Camera
Sample Size, mg
Fibers in Sample
Measurement Cell Shape Light Source
FS-2001 50 - 2.5-12.5 20000-30000 Capillary Polarized FQA 35 - 0.75-2 5000-10000 Channel Polarized
HiRes FQA2 7 - 0.75-2 5000-10000 Channel Polarized HiRes FQA 7 - 0.75-2 5000-10000 Channel Polarized Fiber Lab1 10 1.5 1 1500-6000 Capillary Polarized
MorFi1 4 - 600 3000 Channel Non-Polarized Fibermaster1 26, 103 6, 0.13 100 10000-40000 Channel Non-Polarized
1 (1) 2 HiRes FQA using the FQA settings before upgrade 3 Calculated resolutions for length and width

Sample PreparationSample Preparation
Pulp Number Pulp Description
Disintegration Temperature
Number of Revolutions
1 Recycled Market Pulp 23oC 6,000 2 Paprican Standard Reference Pulp – Unbleached Softwood Kraft 23oC 9,000 3 Softwood High Alpha Pulp 23oC 6,000 4 Softwood CTMP Pulp 90oC 30,000 5 NIST Reference Pulp – HWBK Eucalyptus 23oC 6,000 6 HWBK – Maple 23oC 3,000

Arithmetic Fiber LengthArithmetic Fiber Length
Σ n·l Σ n·lΣ n N
La = =
LLaa –– Arithmetic average fiber lengthArithmetic average fiber lengthn n –– Individual fiberIndividual fiberl l –– Length of an individual fiberLength of an individual fiberN N –– Total number of fibers analyzedTotal number of fibers analyzed

Arithmetic Fiber LengthArithmetic Fiber Length
0.2
0.4
0.6
0.8
1
1.2
1.4
1.6
1 2 3 4 5 6
Sample Number
Ari
thm
etic
Fib
er L
engt
h (m
m)
Kajaani FS-200
FQA
HiRes FQA(FQA Settings)HiRes FQA
Fiber Lab
MorFi
Fibermaster
Length Weighted Fiber LengthLength Weighted Fiber Length
Σ nl·lΣ n·l=Ll
LLll –– Length weighted average fiber lengthLength weighted average fiber lengthn n –– Individual fiberIndividual fiberl l –– Length of an individual fiberLength of an individual fiber
Length Weighted Fiber LengthLength Weighted Fiber Length
0.5
1
1.5
2
2.5
3
1 2 3 4 5 6
Sample Number
Len
gth
Wei
ghte
d M
ean
Len
gth
(mm
)
Kajaani FS-200
FQA
HiRes FQA(FQA Settings)
HiRes FQA
Fiber Lab
MorFi
Fibermaster

Fiber WidthFiber Width
10
15
20
25
30
35
40
1 2 3 4 5 6
Sample Number
Fibe
r W
idth
(mm
)
HiRes FQA(FQA Settings)
HiRes FQA
Fiber Lab
MorFi
Fibermaster
CoarsenessCoarseness
MLa·N
C =
C C –– Fiber coarsenessFiber coarsenessLLaa –– Arithmetic average fiber lengthArithmetic average fiber lengthN N –– Total number of fibers analyzedTotal number of fibers analyzed

CoarsenessCoarseness
0
0.05
0.1
0.15
0.2
0.25
0.3
0.35
0.4
1 2 3 4 5 6
Sample Number
Coa
rsen
ess
(mg/
m)
Kajaani FS-200
FQA
HiRes FQA(FQA Settings)HiRes FQA
Fiber Lab
MorFi
Fibermaster
ArArithmetic Finesithmetic Fines
FSFS--200, Fiber Lab, FQA200, Fiber Lab, FQAArithmetic % fines = 100 * NArithmetic % fines = 100 * Nfinesfines / N/ Ntotaltotal
MorFiMorFiLength weighted % fines = Length weighted % fines = ΣΣ nn··llfinesfines / / ΣΣ nn··lltotaltotal
ArArithmetic Finesithmetic Fines
10
20
30
40
50
60
70
80
1 2 3 4 5 6
Sample Number
% A
rith
met
ic F
ines
Kajaani FS-200
FQA
HiRes FQA(FQA Settings)
HiRes FQA
Fiber Lab
MorFi (% Finesby Length)

Length Weighted FinesLength Weighted Fines
FSFS--200, Fibermaster, FQA200, Fibermaster, FQALength weighted % fines = Length weighted % fines = ΣΣ nn··llfinesfines / / ΣΣ nn··lltotaltotal
MorFiMorFiArea weighted % fines = Area weighted % fines = ΣΣ nn··AAfinesfines / / ΣΣ nn··AAtotaltotal
Length Weighted FinesLength Weighted Fines
0
2
4
6
8
10
12
14
16
18
20
1 2 3 4 5 6Sample Number
%L
engt
h W
eigh
ted
Fine
s
Kajaani FS-200
FQA
HiRes FQA(FQA Settings)HiRes FQA
MorFi (% Finesby Area)Fibermaster

InstrInstrument Repeatabilityument RepeatabilityMeasurement Standard Deviations
Equipment Arithmetic
Length
Length Weighted
Length Width Coarseness FS-200 0.017 0.036 - 0.012 FQA 0.016 0.022 - 0.006
HiRes FQA1 0.024 0.030 0.233 0.003 HiRes FQA 0.021 0.032 0.233 0.003 Fiber Lab 0.029 0.041 0.360 0.021
MorFi 0.013 0.021 0.157 0.008 Fibermaster 0.023 0.028 0.188 0.020
1 used FQA settings before upgrade
AcknowledgmentsAcknowledgments
PCA Tomahawk MillPCA Tomahawk MillDaniel GerhardtDaniel Gerhardt
In: 2005 TAPPI Practical Papermaking Conference Proceedings; CD-ROM, ISBN: 1595100946