comparison of force control capabilities (fccs) in...
TRANSCRIPT
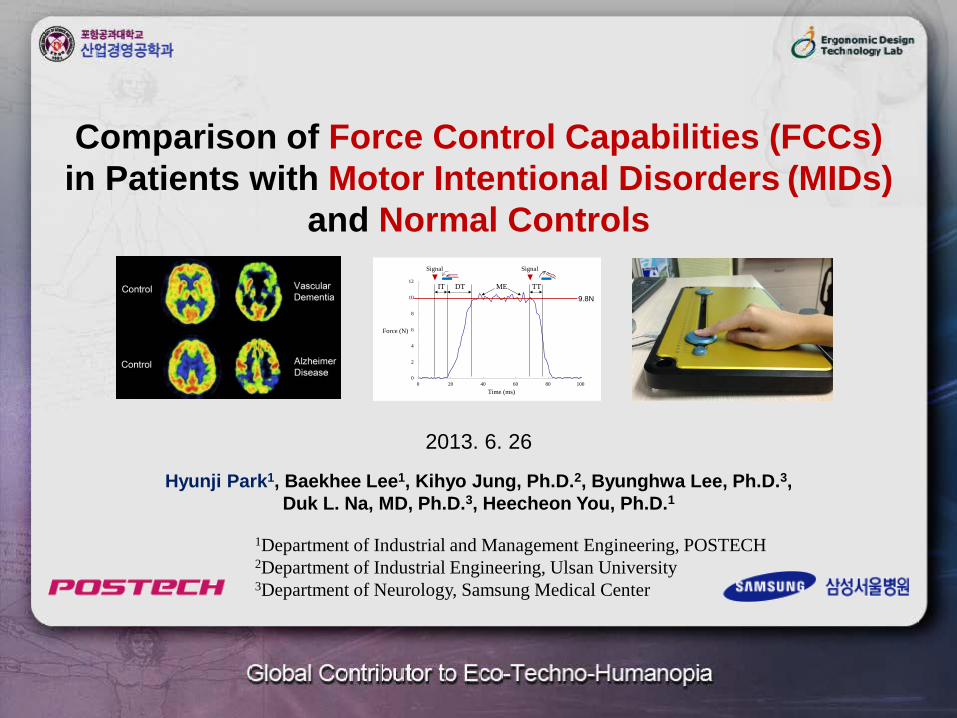
2013. 6. 26
Comparison of Force Control Capabilities (FCCs)in Patients with Motor Intentional Disorders (MIDs)
and Normal Controls
Hyunji Park1, Baekhee Lee1, Kihyo Jung, Ph.D.2, Byunghwa Lee, Ph.D.3, Duk L. Na, MD, Ph.D.3, Heecheon You, Ph.D.1
1Department of Industrial and Management Engineering, POSTECH2Department of Industrial Engineering, Ulsan University3Department of Neurology, Samsung Medical Center
0
2
4
6
8
10
12
0 20 40 60 80 100
Force (N)
Time (ms)
9.8NIT DT ME TT
Signal Signal
0
2
4
6
8
10
12
0 20 40 60 80 100
Force (N)
Time (ms)
9.8NIT DT ME TT
Signal Signal

AGENDA
Introduction
• Background
• Objective of the Study
Research Protocol
Results
1) Effects of Age, Gender, and Hand on normal FCCs
2) Comparison of FCCs bwn. MIDs & Normal Controls
3) Diagnostic Model for MIDs
Discussion

⇒ Important to detect MIDs in the early stage because MIDs are initial symptoms of brain-
damaged disorders
MIDs: Clinical Significance
Causes of decrease in motor skills (Holvia et al., 2012; Ward et al., 2003)
Internal factors: age ↑, skeletal muscle mass ↓, muscle strength ↓, cognitive ability ↓
External factor: brain damage
Motor intentional disorders (MIDs) Definition: Motor disorders that disrupt volitional movements (Seo et al., 2009)
Etiology: Damage in the premotor region, mainly appeared in brain-damaged patients
(e.g., vascular dementia, Parkinson’s disease, stroke) (Weintraub, 2008; Hong, 2010)
Symptom: Force control capabilities (FCC) ↓ motor skills ↓ (Seo et al., 2010)
frontal lobe
premotor region
3
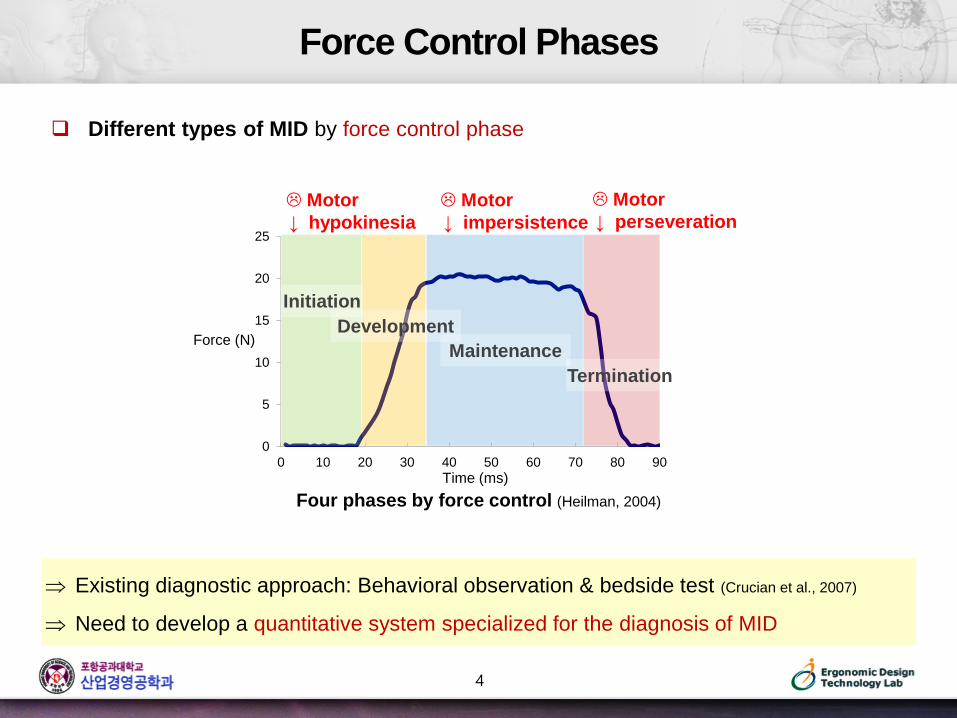
Different types of MID by force control phase
Force Control Phases
⇒ Existing diagnostic approach: Behavioral observation & bedside test (Crucian et al., 2007)
⇒ Need to develop a quantitative system specialized for the diagnosis of MID
0
5
10
15
20
25
0 10 20 30 40 50 60 70 80 90
Force (N)
Time (ms)
Motor↓ hypokinesia
Motor↓ impersistence
Motor↓ perseveration
DevelopmentMaintenance
Termination
Initiation
Four phases by force control (Heilman, 2004)
4

Existing Studies on FCC
Mainly focused on force initiation and maintenance phases
Age effect on reaction time (Der and Deary, 2006)
Age and target force effects on force fluctuation (Vinoth et al., 2001)
⇒ Lack of studies on development and termination phases of FCC
⇒ Need to analyze FCC according to four force control phases
MenWomen
Rea
ctio
n Ti
me
(mse
c)
20 30 40 50 60 70 80
5

Research Objective
Comparison of Motor Skills
between Patients with MIDs and Normal Controls
by Evaluating Finger Force Control Capabilities (FCCs)
1. Analysis of FCCs in normal controls by force control phase
2. Comparison of MID patients with normal controls
3. Development of a diagnostic model for early screening of MIDs
6

Research Protocol
S1. System development ▪ H/W: Finger Touch (FT) system
▪ S/W: force evaluation interface
S2. Experiment ▪ Participants: 360 normal controls (20 ~ 70s)
▪ Evaluation of finger FCCs using FT system
S4. Diagnostic model development ▪ Binary logistic regression
▪ ROC-curve analysis
S3. Analysis ▪ Age, gender, and hand effects on FCC
▪ Patients (aMCI, svMCI, SVaD) vs. controls
7
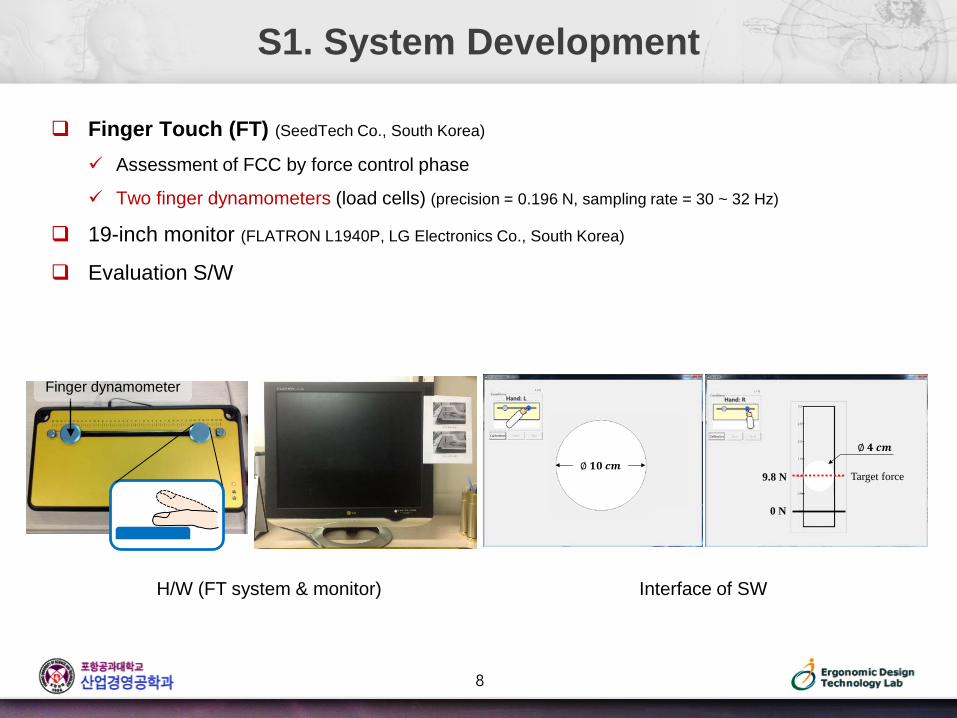
S1. System Development
Finger Touch (FT) (SeedTech Co., South Korea)
Assessment of FCC by force control phase
Two finger dynamometers (load cells) (precision = 0.196 N, sampling rate = 30 ~ 32 Hz)
19-inch monitor (FLATRON L1940P, LG Electronics Co., South Korea)
Evaluation S/W
Finger dynamometer
H/W (FT system & monitor)
9.8 N
0 N
Target force
Hand: L Hand: R
Interface of SW
8

S2. Experiment: Design
Participants: 360 normal controls (30 males & 30 females from each of age strata 20s to 70s)
Three-factor mixed-subjects designs
Independent variables
1) Age (b-s-f): 20s ~ 70s
2) Gender (b-s-f): male, female
3) Hand (w-s-f): left, right 8 trials for each hand and force control phase
Dependent variables
Initiation time (IT; msec)
Development time (DT; msec)
Maintenance error (ME; mN)
Termination time (TT; msec)
Layout of FT system (e.g., test condition = left-hand & left-side)
Screen
Fingerdynamometer
15 cm
50 cm
70 cm
1 / 7
9
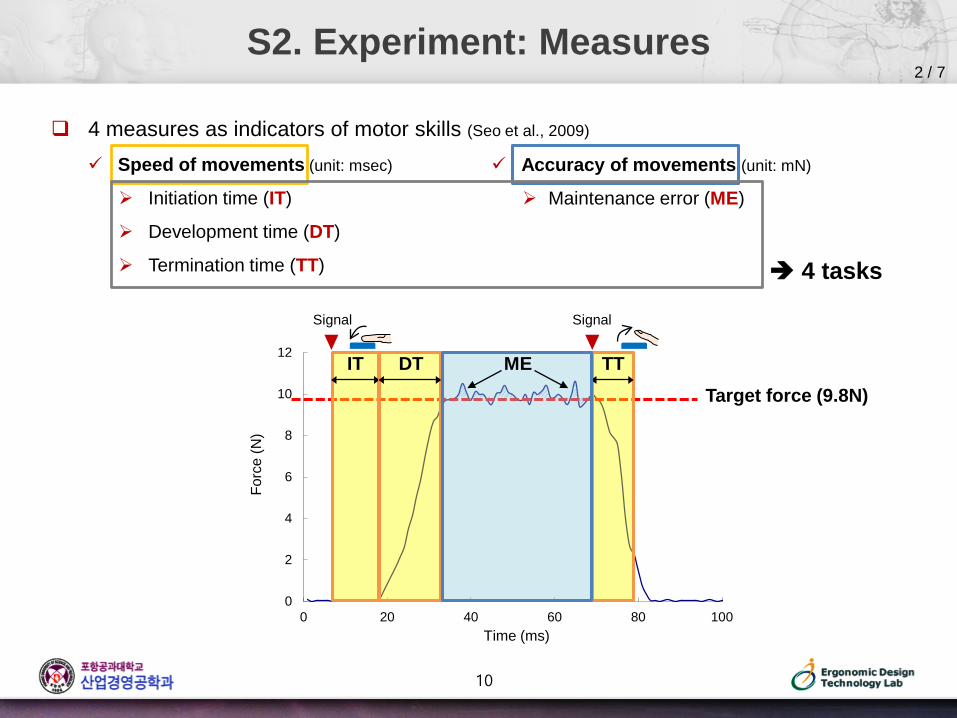
4 measures as indicators of motor skills (Seo et al., 2009)
Speed of movements (unit: msec)
Initiation time (IT)
Development time (DT)
Termination time (TT)
S2. Experiment: Measures
Accuracy of movements (unit: mN)
Maintenance error (ME)
0
2
4
6
8
10
12
0 20 40 60 80 100
Forc
e (N
)
Time (ms)
Target force (9.8N)
Signal Signal
IT DT TTME
4 tasks
2 / 7
10
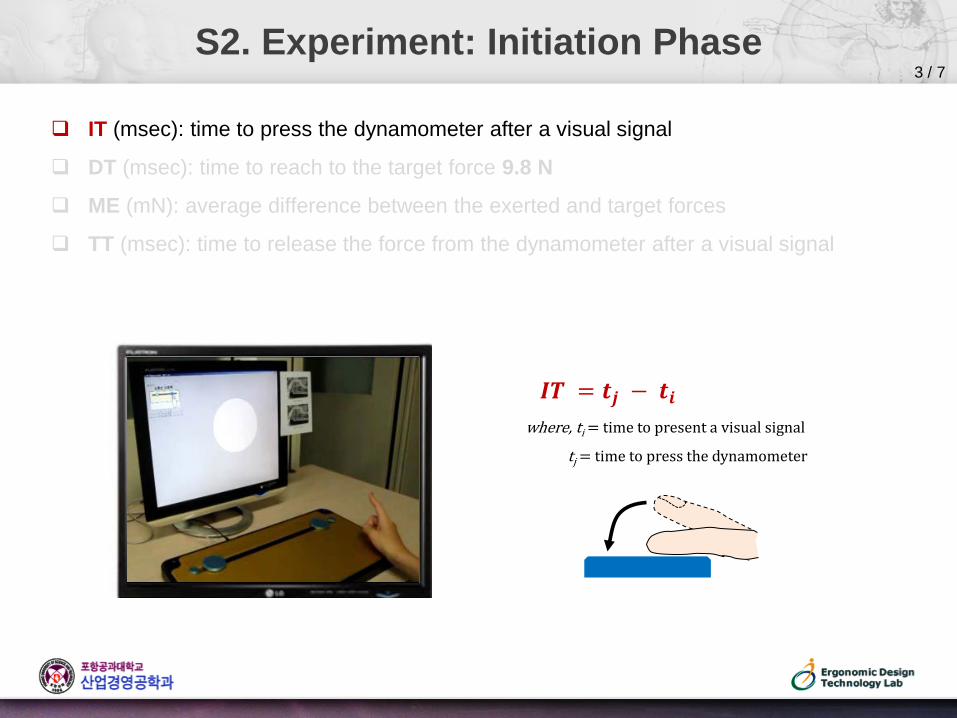
S2. Experiment: Initiation Phase
IT (msec): time to press the dynamometer after a visual signal
DT (msec): time to reach to the target force 9.8 N
ME (mN): average difference between the exerted and target forces
TT (msec): time to release the force from the dynamometer after a visual signal
Signal display
𝑰𝑰𝑰𝑰 = 𝒕𝒕𝒋𝒋 − 𝒕𝒕𝒊𝒊where, ti = time to present a visual signal
tj = time to press the dynamometer
3 / 7

S2. Experiment: Development Phase
IT (msec): reaction time to press the dynamometer after a visual signal
DT (msec): time to reach to the target force 9.8 N
ME (mN): average difference between the exerted and target forces
TT (msec): time to release the force from the dynamometer after a visual signal
Targetforce
𝑫𝑫𝑰𝑰 = 𝒕𝒕𝒋𝒋 − 𝒕𝒕𝒊𝒊where, ti = time to press the dynamometer
tj = time to reach 9.8 N
4 / 7

S2. Experiment: Maintenance Phase
IT (msec): reaction time to press the dynamometer after a visual singal
DT (msec): time to reach to the target force 9.8 N
ME (mN): average difference between the exerted and target forces
TT (msec): time to release the force from the dynamometer after a visual signal
“Keep press the button at 9.8N for 10 sec”
Targetforce
𝑴𝑴𝑬𝑬 =∑𝒊𝒊=𝟎𝟎𝟏𝟏𝟎𝟎𝟎𝟎𝟎𝟎𝟎𝟎 𝒇𝒇𝒊𝒊 − 𝟗𝟗.𝟖𝟖 𝑵𝑵
𝟏𝟏𝟎𝟎𝟎𝟎𝟎𝟎𝟎𝟎where, fi = finger force at measurement i
5 / 7

S2. Experiment: Termination Phase
IT (msec): time to press the dynamometer after a visual signal
DT (msec): time to reach to the target force 9.8 N
ME (mN): average difference between the exerted and target forces
TT (msec): time to release the force from the dynamometer after a visual signal
Targetforce
𝑰𝑰𝑰𝑰 = 𝒕𝒕𝒋𝒋 − 𝒕𝒕𝒊𝒊where, ti = time to present a visual signal
tj = time to release the force from the dynamometer
6 / 7
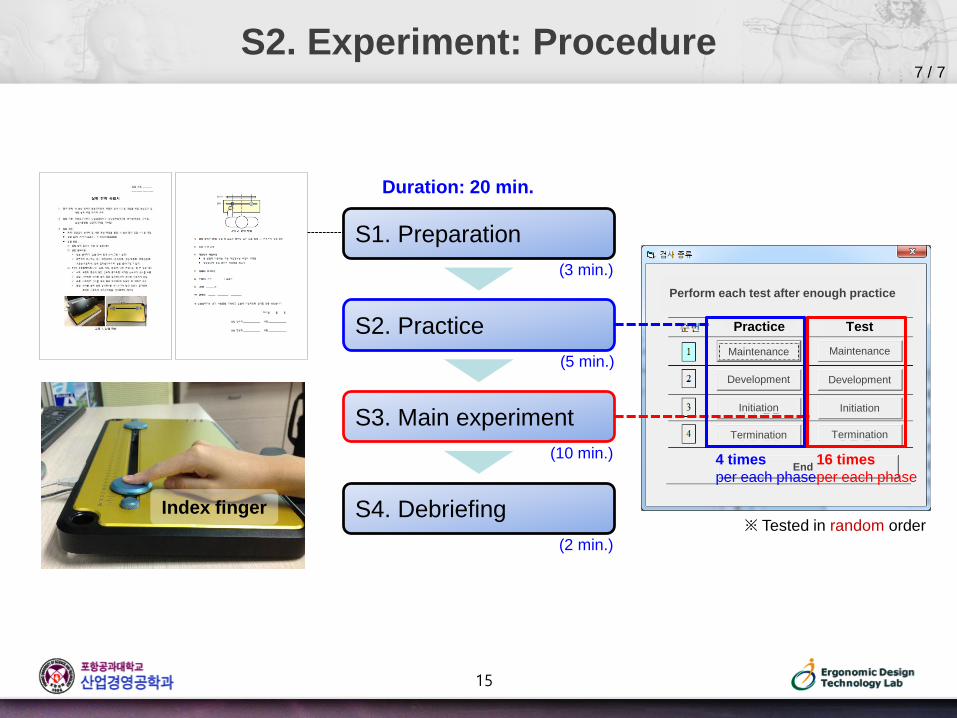
S2. Experiment: Procedure
S1. Preparation
S2. Practice
S3. Main experiment
S4. Debriefing
(3 min.)
(5 min.)
(10 min.)
(2 min.)
Duration: 20 min.
※ Tested in random orderIndex finger
7 / 7
Practice Test
Maintenance Maintenance
Development
Initiation
Termination
Development
Initiation
Termination
End4 times per each phase
16 times per each phase
Perform each test after enough practice
15

S3. Result: Effects of Age, Gender, Hand on FCCs
Age, gender, and hand effects on FCCs of normal controls
1 / 3
Initiation time (IT) Development time (DT) Maintenance error (ME) Termination time (TT)
Age (A) < .001 < .001 < .001 < .001
Gender (G) .009 .012 < .001 .003
Hand (H) .803 .008 .644 .032
A × G < .001 .314 < .001 .379
A × H .064 .756 .227 .515
G × H .310 .667 .705 .242
A × G × H .768 .851 .336 .568
NormalizedFCC
※ Shaded area: p < .001
⇒ All phases: Age ↑ FCC ↓⇒ Degree of motor skill decrease: ME > IT ≈ DT ≈ TT
0
50
100
150
200
250
20 ~30s
40 ~50s
60s 70s0
50
100
150
200
250
20 ~30s
40 ~50s
60s 70s0
50
100
150
200
250
20 ~30s
40 ~50s
60s 70s0
50
100
150
200
250
20 ~30s
40 ~50s
60s 70s
MaleFemale
16

S3. Result: Speed of Normal Controls
Age effect: age ↑ IT, DT, TT ↑(IT: F[5, 344] = 18.40, p < .001*; DT: F[5, 347] = 5.77, p < .001*; TT: F[5, 341] = 19.08, p < .001*)
2 / 3
※ MD = mean difference
Initiation (IT) Development (DT) Termination (TT)
A A A B B C
0
100
200
300
400
20s 30s 40s 50s 60s 70s
A A A A A B
0
100
200
300
400
20s 30s 40s 50s 60s 70s
A A B B C D
0
100
200
300
400
20s 30s 40s 50s 60s 70sAge group
Tim
e (m
sec)
MD = 27 msecMD = 55 msec MD = 102 msec
⇒ IT, DT, and TT of age 70s: 1.2 ~ 1.3 times ↑ than those of younger adults
1.2 times
1.2 times
1.3 timesYounger adults
17
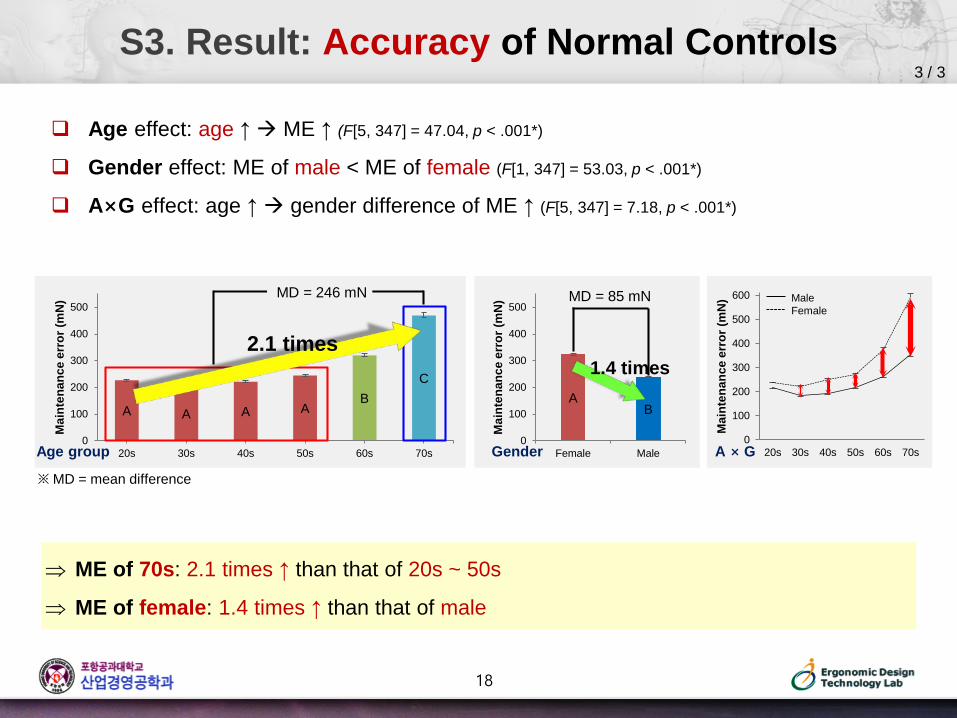
S3. Result: Accuracy of Normal Controls
Age effect: age ↑ ME ↑ (F[5, 347] = 47.04, p < .001*)
Gender effect: ME of male < ME of female (F[1, 347] = 53.03, p < .001*)
A×G effect: age ↑ gender difference of ME ↑ (F[5, 347] = 7.18, p < .001*)
3 / 3
※ MD = mean difference
⇒ ME of 70s: 2.1 times ↑ than that of 20s ~ 50s
⇒ ME of female: 1.4 times ↑ than that of male
A A A AB
C
0
100
200
300
400
500
20s 30s 40s 50s 60s 70s
Mai
nten
ance
err
or (m
N) MD = 246 mN
AB
0
100
200
300
400
500
Female Male
Mai
nten
ance
err
or (m
N) MD = 85 mN
GenderAge group0
100
200
300
400
500
600
20s 30s 40s 50s 60s 70s
Mai
nten
ance
err
or (m
N) Male
Female
2.1 times1.4 times
A × G
18
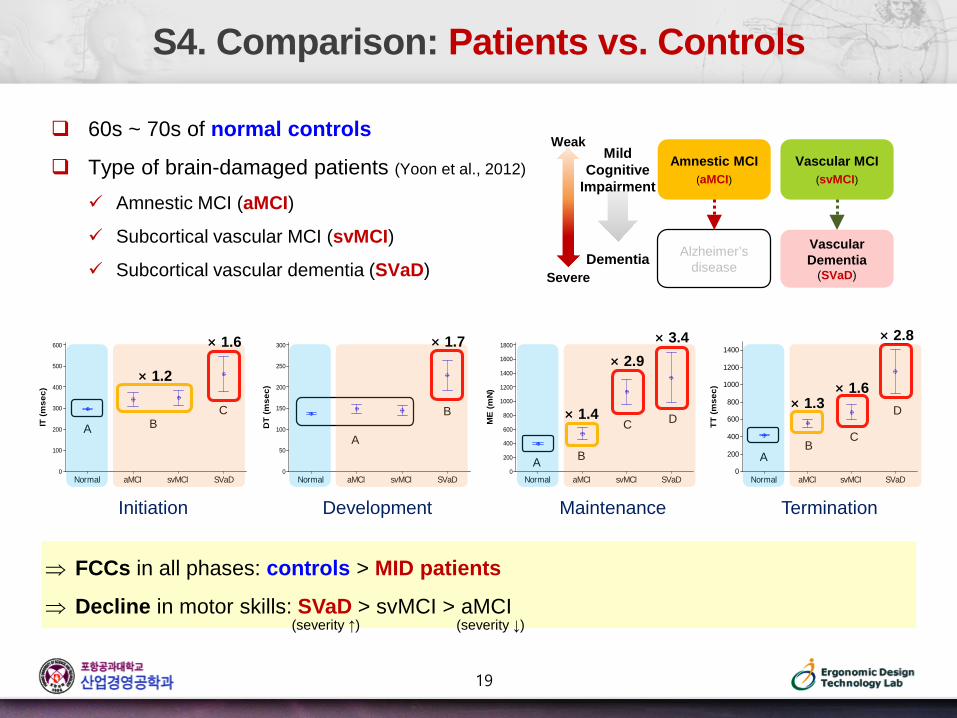
60s ~ 70s of normal controls
Type of brain-damaged patients (Yoon et al., 2012)
Amnestic MCI (aMCI)
Subcortical vascular MCI (svMCI)
Subcortical vascular dementia (SVaD)
S4. Comparison: Patients vs. Controls
⇒ FCCs in all phases: controls > MID patients
⇒ Decline in motor skills: SVaD > svMCI > aMCI
Dementia
Amnestic MCI(aMCI)
Vascular MCI(svMCI)
Alzheimer’sdisease
VascularDementia
(SVaD)Severe
WeakMild
CognitiveImpairment
Initiation Development Maintenance Termination
IT (m
sec)
SVaDsvMCIaMCINormal
600
500
400
300
200
100
0
A BC
DT
(mse
c)
SVaDsvMCIaMCINormal
300
250
200
150
100
50
0
A
B
ME
(mN)
SVaDsvMCIaMCINormal
1800
1600
1400
1200
1000
800
600
400
200
0A B
C D TT (m
sec)
SVaDsvMCIaMCINormal
1400
1200
1000
800
600
400
200
0A
BC
D
× 1.6 × 1.7× 2.9
× 3.4
× 1.6
× 2.8
(severity ↑) (severity ↓)
× 1.2
× 1.4× 1.3
19
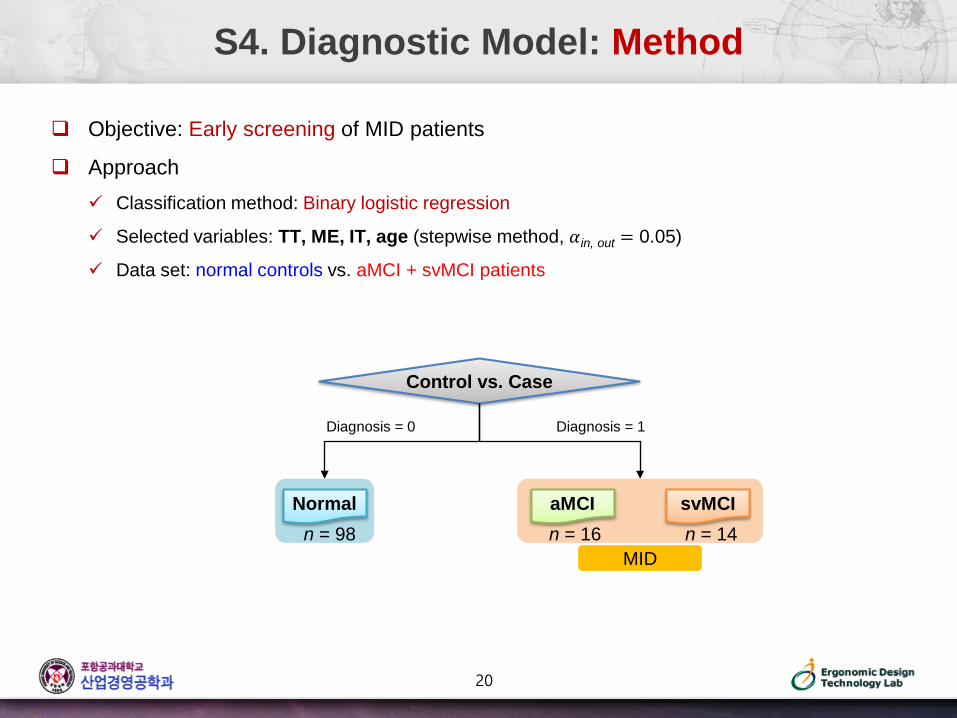
Objective: Early screening of MID patients
Approach Classification method: Binary logistic regression
Selected variables: TT, ME, IT, age (stepwise method, 𝛼𝛼in, out = 0.05)
Data set: normal controls vs. aMCI + svMCI patients
S4. Diagnostic Model: Method
Control vs. Case
Diagnosis = 0
Normal aMCI svMCI
MID
Diagnosis = 1
n = 98 n = 16 n = 14
20

Comparison of performance according to cut-off threshold
S4. Diagnostic Model: Performance
0.0
0.1
0.2
0.3
0.4
0.5
0.6
0.7
0.8
0.9
1.0
0.0 0.2 0.4 0.6 0.8 1.0
sens
itivi
ty
1 – specificity
Cut-off = 0.21
Cut-off = 0.12
No. Cut-off Confusion matrixPerformance (%)
Sensitivity Specificity Accuracy
1 0.12 93.3 69.4 75.0
2 0.21 76.7 81.6 80.5
3 0.43 70.0 98.0 91.4
n = 128Actual
Normal Patient
Predicted
Normal 68 2Patient 30 28
n = 128Actual
Normal Patient
Predicted
Normal 80 7
Patient 18 23
n = 128Actual
Normal Patient
Predicted
Normal 96 9
Patient 2 21
Cut-off = 0.43
⇒ Maximize sensitivity (> 90%) for early screening of MID
21

Assessment of FCCs: comparison of MID patients (aMCI, svMCI, SVaD) with normal
controls by force control phase (initiation, development, maintenance, termination) Decrease in motor skills according to severity: SVaD > svMCI > aMCI
⇒ ME, TT: Discriminant factors contribute to distinguish MID patients and controls
Diagnostic model development for early screening of MID(Sensitivity for MCI = 93%, sensitivity for SVaD = 100%, specificity = 69%, accuracy = 75%)
⇒ Useful for MID diagnosis in the early stage
Discussion
100
130
160
190
220
250
20s ~ 30s 40s ~ 50s 60s 70s
Nor
mal
ized
val
ue
Motor skills of controls and patientsAge effect on motor skills for normal controls
100
150
200
250
300
350
Normal aMCI svMCI SVaD
Nor
mal
ized
val
ue
ME > TT > DT ≈ ITME > TT > DT ≈ IT
MEME
TT
TT
DT ITDTIT
22

Q & A
Thank you for your attention!
23