comparison of global & indian telecom
TRANSCRIPT
PRESENTED BY:
FAIZAN MAIRAJ & FAHAD RIYAZ

GLOBAL TELECOMMUNICATION
INDUSTRY
The analyst firm has issued a report that indicates the global
telecom analytics market could reach a whopping $4,296.6
MILLION by 2019, which will be up from $975.2 MILLION
by the end of this year. The Markets and Markets’ report sets
out to define and analyze the market based on various software
applications, hardware types, service types, and user types, while
also forecasting future market growth and identifying
opportunities, hurdles, and trends.

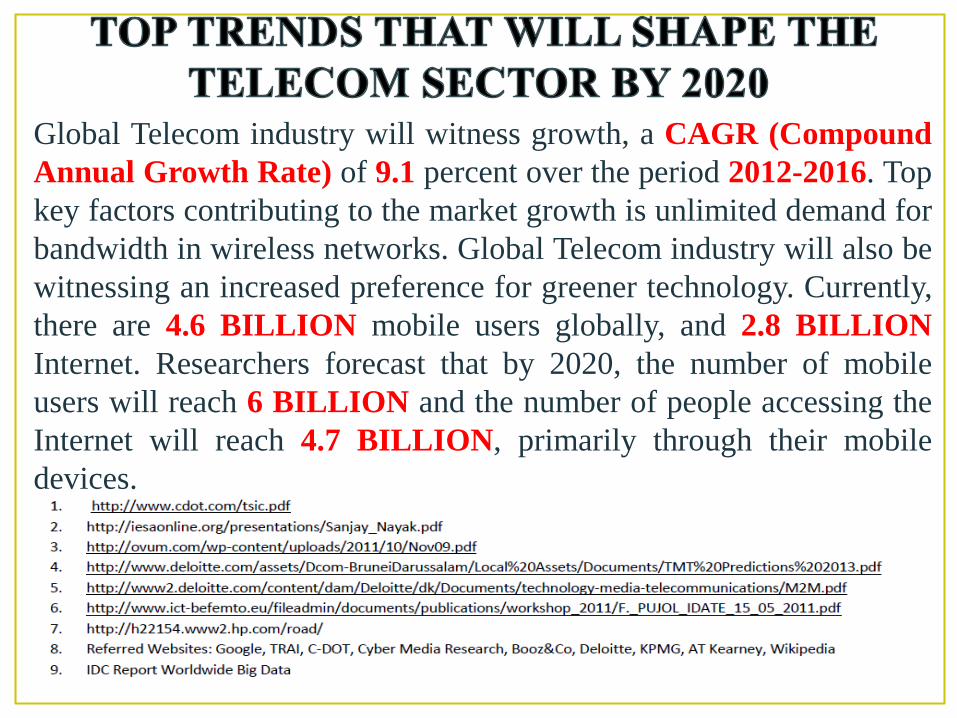
Global Telecom industry will witness growth, a CAGR (Compound
Annual Growth Rate) of 9.1 percent over the period 2012-2016. Top
key factors contributing to the market growth is unlimited demand for
bandwidth in wireless networks. Global Telecom industry will also be
witnessing an increased preference for greener technology. Currently,
there are 4.6 BILLION mobile users globally, and 2.8 BILLION
Internet. Researchers forecast that by 2020, the number of mobile
users will reach 6 BILLION and the number of people accessing the
Internet will reach 4.7 BILLION, primarily through their mobile
devices.
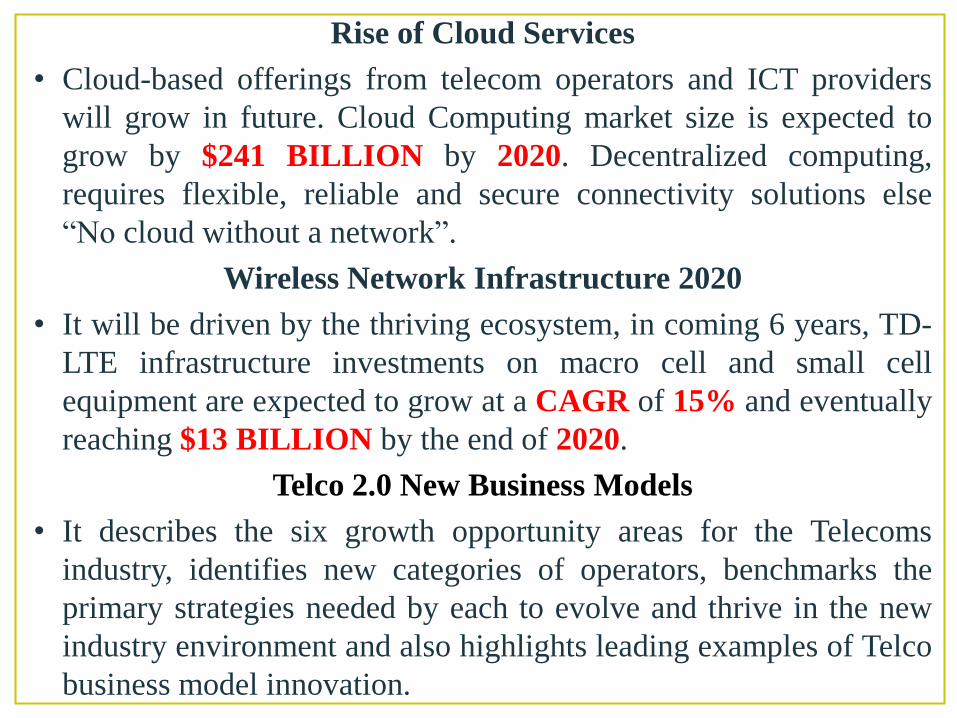
Rise of Cloud Services
• Cloud-based offerings from telecom operators and ICT providers
will grow in future. Cloud Computing market size is expected to
grow by $241 BILLION by 2020. Decentralized computing,
requires flexible, reliable and secure connectivity solutions else
“No cloud without a network”.
Wireless Network Infrastructure 2020
• It will be driven by the thriving ecosystem, in coming 6 years, TD-
LTE infrastructure investments on macro cell and small cell
equipment are expected to grow at a CAGR of 15% and eventually
reaching $13 BILLION by the end of 2020.
Telco 2.0 New Business Models
• It describes the six growth opportunity areas for the Telecoms
industry, identifies new categories of operators, benchmarks the
primary strategies needed by each to evolve and thrive in the new
industry environment and also highlights leading examples of Telco
business model innovation.
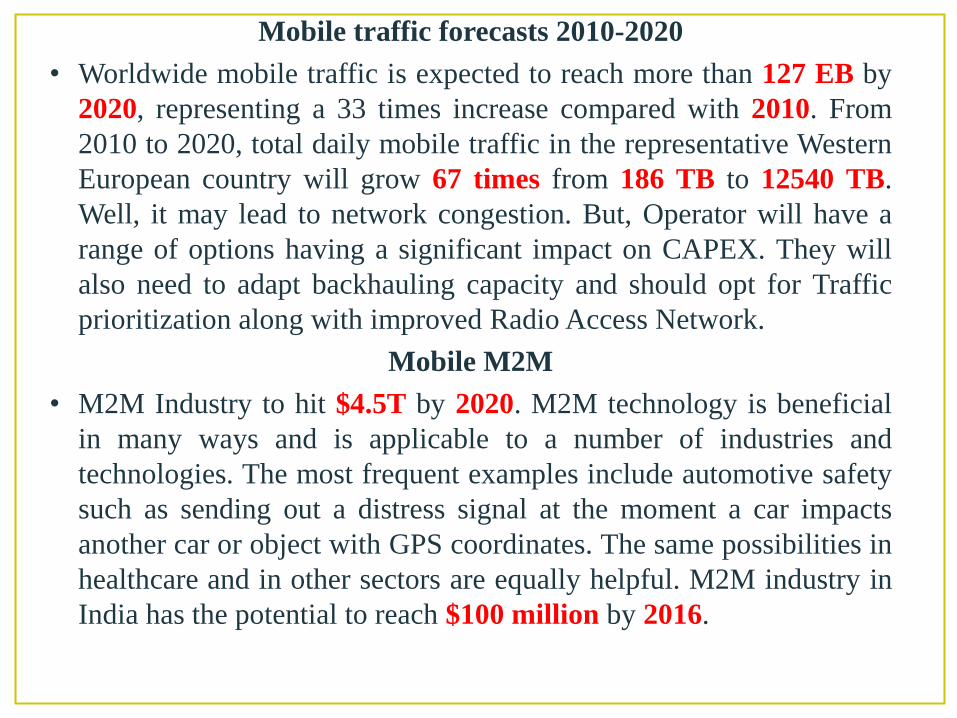
Mobile traffic forecasts 2010-2020
• Worldwide mobile traffic is expected to reach more than 127 EB by
2020, representing a 33 times increase compared with 2010. From
2010 to 2020, total daily mobile traffic in the representative Western
European country will grow 67 times from 186 TB to 12540 TB.
Well, it may lead to network congestion. But, Operator will have a
range of options having a significant impact on CAPEX. They will
also need to adapt backhauling capacity and should opt for Traffic
prioritization along with improved Radio Access Network.
Mobile M2M
• M2M Industry to hit $4.5T by 2020. M2M technology is beneficial
in many ways and is applicable to a number of industries and
technologies. The most frequent examples include automotive safety
such as sending out a distress signal at the moment a car impacts
another car or object with GPS coordinates. The same possibilities in
healthcare and in other sectors are equally helpful. M2M industry in
India has the potential to reach $100 million by 2016.
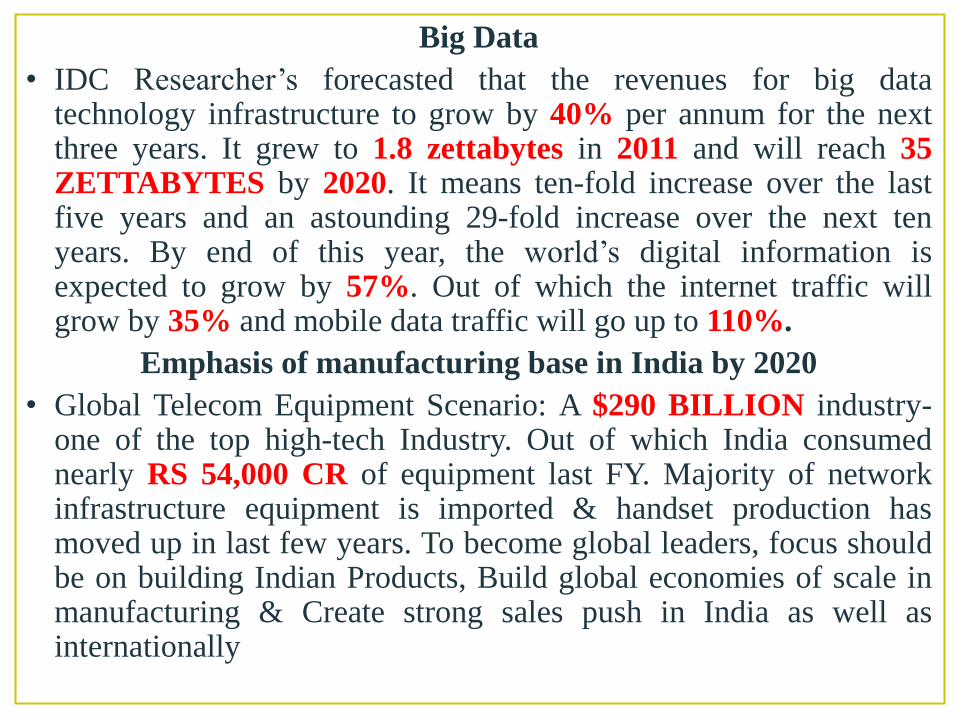
Big Data
• IDC Researcher’s forecasted that the revenues for big datatechnology infrastructure to grow by 40% per annum for the nextthree years. It grew to 1.8 zettabytes in 2011 and will reach 35ZETTABYTES by 2020. It means ten-fold increase over the lastfive years and an astounding 29-fold increase over the next tenyears. By end of this year, the world’s digital information isexpected to grow by 57%. Out of which the internet traffic willgrow by 35% and mobile data traffic will go up to 110%.
Emphasis of manufacturing base in India by 2020
• Global Telecom Equipment Scenario: A $290 BILLION industry-one of the top high-tech Industry. Out of which India consumednearly RS 54,000 CR of equipment last FY. Majority of networkinfrastructure equipment is imported & handset production hasmoved up in last few years. To become global leaders, focus shouldbe on building Indian Products, Build global economies of scale inmanufacturing & Create strong sales push in India as well asinternationally
INDIAN TELECOMMUNICATION
INDUSTRY
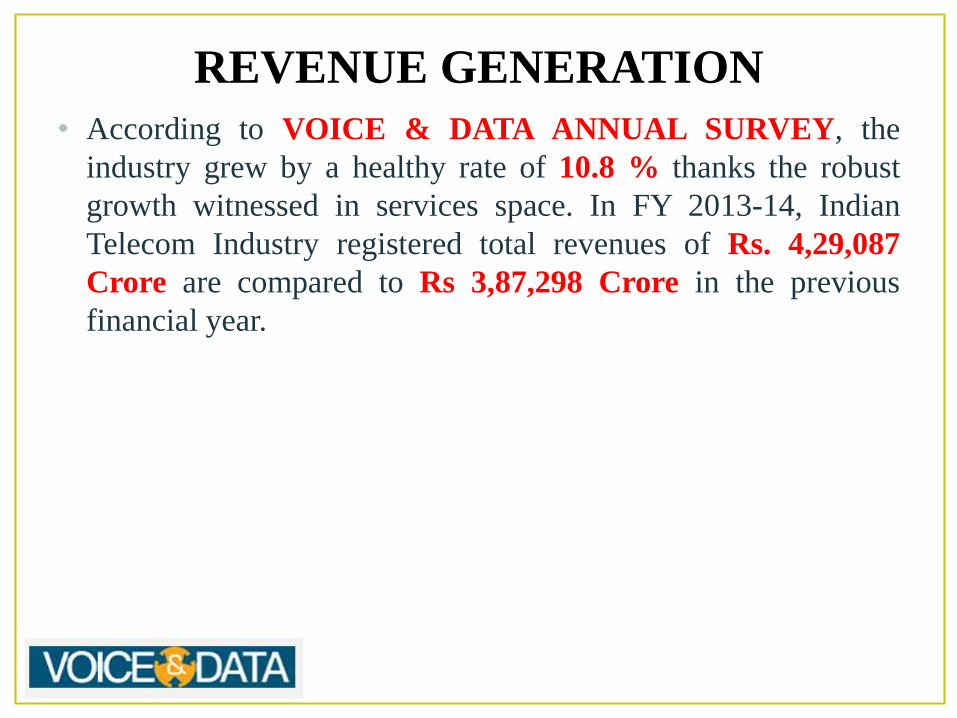
REVENUE GENERATION
• According to VOICE & DATA ANNUAL SURVEY, the
industry grew by a healthy rate of 10.8 % thanks the robust
growth witnessed in services space. In FY 2013-14, Indian
Telecom Industry registered total revenues of Rs. 4,29,087
Crore are compared to Rs 3,87,298 Crore in the previous
financial year.

FUTURE TRENDS
• According to the estimates of the consulting firm,
RANDSTAD INDIA, the sector is going to be responsible for
generation of 40 LAKH direct and indirect jobs over the next 5
years. This is owing to the government’s efforts to increase
penetration in rural areas along with the growth in the
smartphone numbers and internet usage.

The number of telephone subscribers in India increased from 951.84
MILLION at the end of August, 2014 to 957.61 MILLION at the
end of September, 2014, thereby showing a monthly growth rate of
0.61%.
NUMBER OF USERS
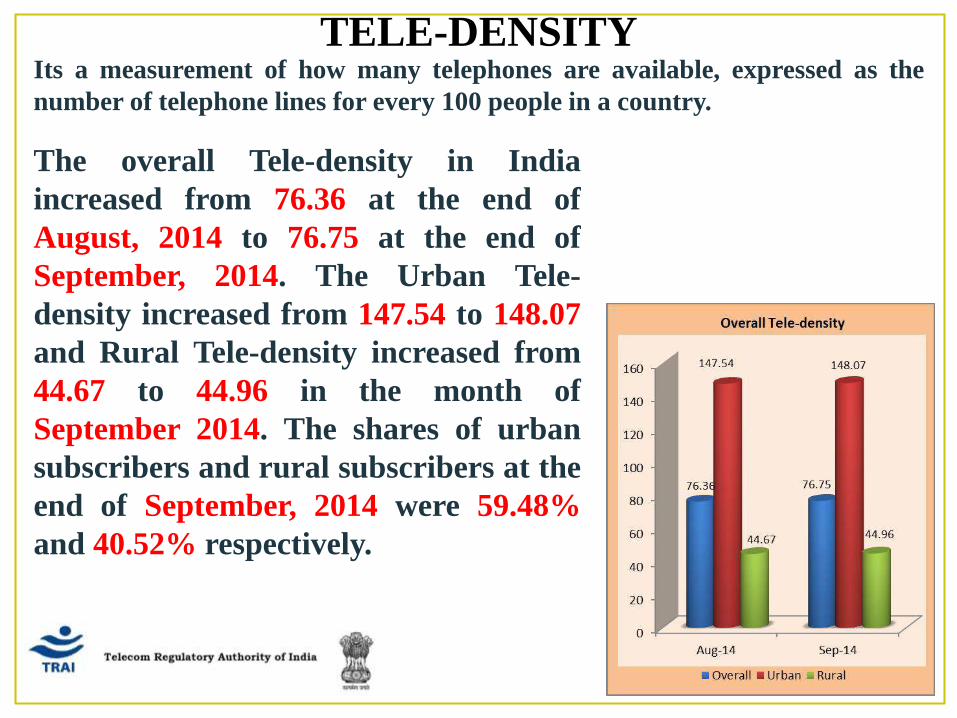
The overall Tele-density in India
increased from 76.36 at the end of
August, 2014 to 76.75 at the end of
September, 2014. The Urban Tele-
density increased from 147.54 to 148.07
and Rural Tele-density increased from
44.67 to 44.96 in the month of
September 2014. The shares of urban
subscribers and rural subscribers at the
end of September, 2014 were 59.48%
and 40.52% respectively.
TELE-DENSITYIts a measurement of how many telephones are available, expressed as the
number of telephone lines for every 100 people in a country.

OVERALL TELE-DENSITY (CIRCLE/STATE WISE)
AS ON 30TH SEPTEMBER, 2014

ACCESS SERVICE PROVIDER-WISE MARKET
SHARES IN THE WIRELESS SUBSCRIBERS AS
ON 30TH SEPTEMBER, 2014

Porter’s Five Forces

THREAT OF NEW ENTRANTS
• Ownership of a telecom
license
• Finance
THREAT OF SUBSTITUTES
• Cable TV direct lines,
broadband services
POWER OF SUPPLIERS
• Less power
• Talented managers & engineers
POWER OF BUYERS
• Increased choice high
bargaining power
• Switching costs individual &
large business customers.
RIVARLY AMONG EXISTING FIRMS WITHIN AN INDUSTRY
• Usage of phone,
competition is high
• Price
• Value added services
• Profitability low

WHAT IS SERVICES MARKETING
TRIANGLE?The marketing and selling of services requires a special set of tactics
and priorities compared with selling physical products. The service
marketing triangle breaks the marketing tasks of your business down
into three types. As a service business, you must market both to your
employees so they understand the focus of your business and to your
customers so they do more business with you.

INTERNAL MARKETING
• Internal marketing is the side of the triangle between your
organization and your employees who provide your services
to customers. Marketing issues include adequate training on
the services to be delivered and customer satisfaction service
techniques. Internal marketing requires you to be involved with
your employees and let them know the goals and even
problems facing the business.

EXTERNAL MARKETING
• External marketing goes from your business organization out
to customers. This is the traditional form of business
marketing, showing customers how the services provided by
your business benefit them. External marketing includes
advertising, your website and your company's social media
efforts.

INTERACTIVE MARKETING
• The side of the triangle between your employees and
customers is called interactive marketing. This form of
marketing revolves around how your employees deliver the
services your company provides. The goal is to have highly
satisfied customers who become long-term, repeat customers.
Also known as MOMENT OF TRUTH.