comparison of immunologic assays for detecting immune
TRANSCRIPT
CLINICAL AND VACCINE IMMUNOLOGY, Sept. 2010, p. 1452–1459 Vol. 17, No. 91556-6811/10/$12.00 doi:10.1128/CVI.00498-09Copyright © 2010, American Society for Microbiology. All Rights Reserved.
Comparison of Immunologic Assays for Detecting Immune Responsesin HIV Immunotherapeutic Studies: AIDS Clinical Trials
Group Trial A5181�
Bernard J. C. Macatangay,1* Lu Zheng,2 Charles R. Rinaldo,3 Alan L. Landay,4 Richard B. Pollard,5Savita Pahwa,6 Michael M. Lederman,7 and R. Pat Bucy8
Division of Infectious Diseases, University of Pittsburgh School of Medicine, Pittsburgh, Pennsylvania1; Statistical and Data Analysis Center,Harvard School of Public Health, Boston, Massachusetts2; Department of Infectious Diseases and Microbiology, University of
Pittsburgh Graduate School of Public Health, Pittsburgh, Pennsylvania3; Department of Immunology and Microbiology,Rush University Medical Center, Chicago, Illinois4; Division of Infectious Diseases, University of
California—Davis Medical Center, Sacramento, California5; Department of Microbiology andImmunology, University of Miami School of Medicine, Miami, Florida6; Division ofInfectious Diseases, Case Western Reserve University, University Hospitals/Case Medical Center,
Cleveland, Ohio7; and Department of Pathology, University ofAlabama at Birmingham, Birmingham, Alabama8
Received 6 December 2009/Returned for modification 13 January 2010/Accepted 29 June 2010
This study was designed to evaluate which of several T-cell-specific, immune response assays are the mostrelevant in measuring the key characteristics of an effective immune response to HIV-1. Using 5 HIV-1 antigensas stimulants, we assessed lymphocyte proliferation, supernatant gamma interferon (IFN-�) cytokine produc-tion (CP), single-cell IFN-� production by enzyme-linked immunospot (ELISPOT) assay, with and withoutEpstein-Barr virus-transformed B-lymphoblastoid cell lines (B-LCLs), and intracellular cytokine production(ICC) for IFN-� and interleukin 2 (IL-2) by flow cytometry. We used these to compare specimens fromHIV-1-infected subjects who were virally suppressed with a stable antiretroviral therapy (ART) regimen (groupA) with specimens from subjects not on ART but with HIV-1 viremia of <3,000 copies/ml (group B). Thelymphocyte proliferation assay (LPA) did not significantly differentiate between the two groups. Using freshperipheral blood mononuclear cells (PBMCs), the CP and ELISPOT assays for IFN-� detected the greatestdifferences between the two groups, specific for three of the five HIV-1 antigens, whereas significant differenceswere seen only in response to one antigen when cryopreserved cells were used. The strongest correlations wereseen between the CP and ELISPOT assays. The ELISPOT B-LCL assay showed a cell concentration-dependentincrease in IFN-� production compared to that shown by the standard ELISPOT assay but did not differentiatebetween the groups. In the ICC assay, greater numbers of IFN-�-producing T cells were seen in group B, andlittle or no detectable IL-2 production was seen in both groups. These studies highlight complexities ofimmunologic monitoring of T-cell responses in multisite clinical trials in HIV infection and outline consider-ations for optimizing these efforts.
During acute HIV-1 infection, a potent T-cell immune re-sponse is generated soon after the peak of viremia and con-tinues until such time as a steady state is reached amongimmune control, viral replication, and availability of targets(12). The mechanism(s) by which HIV-infected individualscome to a steady-state viremia within several months of initialinfection is a central issue in HIV disease pathogenesis. Thereis a wide variation in the steady-state level among individuals,with rare patients able to control viral replication at levelsassociated with slow disease progression. It is hypothesizedthat the T-cell-mediated immune response helps determine thelevel of viremia in patients who are not on antiretroviral drugsand is therefore a fundamental measure of viral control (6–8).Since persistent antigen stimulation is thought to be necessaryto maintain a continuous level of effector function, one might
predict that removal of antigen, such as in the setting of potentantiretroviral therapy (ART), would result in a coordinateddecrease in T-cell effector activity. In these cases, exogenousviral antigens could be used as immunogens to increase themagnitude of the antiviral immune response (11, 13, 14, 23).
There are many obstacles to the implementation of such atherapeutic strategy. One of these is devising a panel of im-munologic readouts predictive of an effective antiviral immuneresponse that could control HIV replication. Another chal-lenge is to utilize antigens for in vitro testing that are suffi-ciently reflective of the sequence diversity of the circulatingvirus for each subject. Finally, the analytical characteristics ofour current assays have not been directly compared acrossmultiple laboratories. Given the urgency of developing an ef-fective vaccine and methods to evaluate vaccine activity, theAIDS Clinical Trials Group (ACTG) implemented this studyto evaluate current assays that may inform the optimal moni-toring of a therapeutic immunization trial. Results of this studymay then be used by investigators in evaluating which vaccinecandidates are effective and should continue to be studiedfurther in clinical trials.
* Corresponding author. Mailing address: Division of Infectious Dis-eases/HIV/AIDS Unit, University of Pittsburgh School of Medicine, Suite510, Keystone Building, 3520 Fifth Ave., Pittsburgh, PA 15213. Phone:(412) 383-1272. Fax: (412) 383-2900. E-mail: [email protected].
� Published ahead of print on 14 July 2010.
1452
on January 3, 2019 by guesthttp://cvi.asm
.org/D
ownloaded from

We designed these studies to ask which of the commonlyused T-cell-specific immune response assays are the most rel-evant in measuring the key characteristics of an effective im-mune response by evaluating their ability to distinguish be-tween two HIV-1-infected populations. As a surrogate cohortfor subjects with “vaccine”-induced immunologic control ofHIV replication, subjects who maintained low plasma HIVlevels (�3,000 copies/ml over at least 6 months in the absenceof ART) were chosen for examination. We enrolled chronicallyHIV-1-infected subjects maintained on a stable ART regimenwith undetectable plasma virus levels for at least 9 months tobe the comparison group, in which we expected to see lessrobust immune responses. We also characterized the relationsbetween results using fresh and cryopreserved specimens andthe correlation between the assays studied.
Our results showed evidence that the cytokine production(CP) and enzyme-linked immunospot (ELISPOT) assays couldreliably distinguish between effective and less effective immuneresponses. However, the variations between the assay runs andbetween fresh and frozen cell analyses are larger than has beencommonly realized.
MATERIALS AND METHODS
Study design and population. This was a stratified observational study con-ducted by the Immunology Specialty Laboratories (ISLs) of the AIDS ClinicalTrials Group (ACTG), protocol A5181, in which blood samples were obtainedfrom HIV-1-infected study participants at entry, week 12, and week 24 forplasma HIV-1 RNA and CD4�/CD8� T-cell count and for multiple immuno-logic assays designed to measure HIV-1 antigen-specific T-cell function. Localreview boards in each study site approved the study, and written informedconsent was obtained prior to enrollment. Study participants were stratified intotwo groups upon entry. Group A consisted of adult HIV-1-positive subjects whohad effective control of HIV-1 replication (i.e., �75 copies/ml) with the sameantiretroviral regimen for at least 9 months prior to study entry. Subjects in thisgroup continued taking their current antiretroviral regimen for the entire6-month follow-up. Group B consisted of adult HIV-1-infected patients who hadnot been on any antiretroviral drugs for 6 months prior to study entry but had aplasma HIV-1 RNA viral level of �3,000 copies/ml within the 6 months prior toentry. Participants in both groups also had a CD4� T-cell count greater than 300cells/mm3 within 6 months prior to study entry. Exclusion criteria includedpregnancy or breast-feeding and any history of an AIDS-defining opportunisticinfection. Medical history was obtained during screening to determine if theparticipants had any diseases that may reflect altered immunologic status. Eachof the 6 ACTG sites enrolled 9 subjects, 5 for group A and 4 for group B.Subjects participated in the study for a maximum of 6 months, with no additionalfollow-up required.
Cryopreserved and fresh peripheral blood mononuclear cells (PBMCs) wereused in the immunologic assays. PBMC isolation and cryopreservation were doneusing standard operating procedures utilized in Division of AIDS network pro-tocols as described in the HIV/AIDS Network Coordination website at http://www.hanc.info/labs/Pages/PBMCSOP.aspx. All sites assessed the percent andabsolute count of CD4� and CD8� cells by flow cytometry at entry and at weeks12 and 24. Each of the six study sites performed three conventional assays, i.e.,the lymphocyte proliferation assay (LPA), ELISPOT assay for gamma interferon(IFN-�), and supernatant cytokine production of IFN-� detected by enzymeimmunoassay (EIA). Week 12 responses from these assays were used to analyzedifferences using fresh and cryopreserved specimens. In addition, additionalassays were performed in selected laboratories. These were intracellular cytokinestaining by flow cytometry (ICC-flow, also termed the intracellular cytokinestaining [ICS] assay) and the ELISPOT assay with autologous Epstein-Barr virus(EBV)-transformed B-lymphoblastoid cell lines (B-LCLs) as antigen-presentingcells (APCs) (ELISPOT B-LCL).
Immunologic assays. A combination of any of five HIV-1 antigens togetherwith corresponding negative and positive controls was used for each of the assaystested. These HIV-1 antigens were HIV-1 MN Aldrithiol-inactivated virions(final concentration, 5.8 �g/ml; J. Lifson, Frederick, MD), Gag peptide pool (7515-mer Gag peptides overlapping by 11; p17 [aa 11 to 48, 71 to 107], p17-to-p24
transition, p24 [aa 133 to 363], p15 [aa 364 to 493]; SynPep, Dublin, CA; 1�g/well), PEN peptide pool (45 15-mer Pol peptides [aa 311 to 345, 356 to 370,398 to 434, 448 to 474, 496 to 538, 547 to 561, 571 to 612, 640 to 695], 24 15-merEnv peptides [gp120 aa 1 to 15, 31 to 61, 103 to 129, 192 to 217, 237 to 261, 298to 321, 369 to 391, 416 to 430], and 20 15-mer Nef peptides [68 to 146, 175 to198], all overlapping by 11 peptides; SynPep, Dublin, CA; 1 �g per well), re-combinant HIV-1 p24 protein (aa 241 to 255, 245 to 259, 249 to 263, 329 to 343,333 to 347, 337 to 351; Protein Sciences, Meriden, CT; 1 �g/well), and a vacciniavirus construct expressing env, gag, and pol (vHIV; multiplicity of infection[MOI], 0.2) (where aa stands for amino acid). Positive controls were staphylo-coccus enterotoxin B (SEB) superantigen (10 �g/ml), pokeweed mitogen (PWM;0.1 �g/ml), tetanus toxoid (TT; 1 limit of flocculation unit [LFU]/ml), andCandida albicans (10 �g/ml); negative controls were mock recombinant antigen(for the HIV-1 p24; 1 �g/well), vLacZ (vaccinia virus vector control; MOI, 0.2),and CEMx174 cell extract (5.8 �g/ml; HIV-1 MN control).
For the LPA, the ACTG consensus method was utilized. One hundred thou-sand PBMCs (fresh for weeks 0 and 24 and thawed and fresh for week 12) wereplaced in each well of a 96-well plate and were cocultured with SEB, PWM, TT,Candida albicans, and the following HIV-1 antigens: the Gag peptide pool, thePEN peptide pool, HIV-1 MN and a control, and HIV-1 p24 antigen and acontrol. The cells were allowed to proliferate for 6 days at 37°C in a 5% CO2
humidified incubator. On day 6, the plates were pulsed with 25 �l/well of [3H]thy-midine (1 �Ci/well; NEN Life Science Products, Boston, MA). After 6 h, cellswere harvested on glass fiber filters using a cell harvester. The amount ofradioactivity incorporated into DNA was measured in a scintillation counter. Theresults are reported as stimulation indices (SI � counts per minute experimental/counts per minute background unstimulated).
The CP assay for production of IFN-� was done using the same antigens usedfor the LPA plus vHIV. Cryopreserved PBMCs were used at weeks 0 and 24,while both fresh and cryopreserved cells were used at week 12. One millionPBMCs were cocultured with Gag and PEN peptide pools, p24 antigen, HIV-1MN, or vHIV in a 96-well plate at 37°C in a 5% CO2 humidified incubator for48 h. From each well, 150 �l of supernatant was obtained and placed in aseparate, labeled 96-well plate and stored at �20°C. All supernatants wereshipped to the University of Alabama laboratory, and the enzyme immunoassay(EIA) was performed in a single batch.
The ACTG consensus method was also used for the ELISPOT assay. This wasperformed on both fresh and frozen PBMCs at week 12 and on frozen cells atweeks 0 and 24. Using sterile techniques in a biological hood, 96-well ELISPOTplates were coated with mouse anti-human IFN-� (1-D1K; 100 �l/well of 5-�g/mlsolution; Mabtech, Sweden) and incubated overnight at 4°C. The plates werethen washed four times in sterile phosphate-buffered saline (PBS) and blockedwith 200 �l of sterile RPMI 1640-10% fetal calf serum (FCS) (Gemini Bio-Products, West Sacramento, CA). Three cell concentrations were prepared inRPMI 1640-10% FCS, i.e., 3 � 106, 1 � 106, and 3 � 105 cells/ml, and wereadded to the wells (at 100 �l/well to deliver final concentrations of 3 � 105, 1 �105, and 0.3 � 105 cells/well in duplicate) after decanting the blocking medium.Stimulants (SEB, p24, Gag and PEN peptide pools, HIV-1 MN, and vHIV andcontrols) were added to the appropriate wells at a final culture volume of 125�l/well. The plates were then incubated in a 5% CO2 incubator for 18 h at 37°C.After overnight incubation, the plates were washed three times with PBS andthree times with PBS-0.05% Tween 20 (number BP337-50; Fisher Scientific,Pittsburgh, PA). They were then washed twice with distilled H2O to lyse residualcells. Biotinylated detecting antibody was added to each well (1 �l/ml of mouseanti-human IFN-� biotinylated monoclonal antibody [MAb]; 100 �l/well), incu-bated at room temperature (RT) for 3 h, and washed four times with PBS-0.05%Tween 20, with a 5-min soak in PBS-0.05% Tween 20 during the third wash.Enzyme-avidin conjugate diluted in 1% FCS-PBS (ABC-horseradish peroxidase[HRP]; 100 �l/well) was added, and the plates were incubated for 1 h at RT andthen washed four times in the same manner as was described earlier. Diamino-benzidine solution (D-0426 at 100 �l/well; Sigma, St. Louis, MO) was added toeach well and incubated for 5 min at RT. Plates were washed with tap water threetimes and were then air dried overnight. Spots were counted the following daywith an automated ELISPOT reader system. Background was subtracted fromresults in the stimulated wells. For the ELISPOT B-LCL assay (performed onlyin the Pittsburgh ISL on both fresh and frozen cells at weeks 12 and 24), antigens(10 �l/well at 100 �g/ml solution) were loaded into autologous B-LCLs andcocultured with the PBMCs for 2 h at 37°C, as in the antigen-stimulation systems(17). Controls for this assay included medium alone and SEB.
For the ICC assay, fresh and cryopreserved cells were stimulated with threeHIV-1 antigens: the Gag and PEN peptide pools and the HIV-1 p24 antigen. Cellsuspension (160 �l; final concentration, 1 � 106 cells) was dispensed to desig-nated wells of a 96-well round-bottom plate. The HIV-1 antigens were added to
VOL. 17, 2010 IMMUNE RESPONSES IN HIV IMMUNOTHERAPEUTIC STUDIES 1453
on January 3, 2019 by guesthttp://cvi.asm
.org/D
ownloaded from
the corresponding wells (40 �l/well), and the plates were incubated at 37°C in a5% CO2 humidified incubator for an hour. Brefeldin A solution (20 �l at 500�g/ml; BD, Franklin Lakes, NJ; 10 �l/106 cells) was added to each culture andwas incubated for an additional 5 h. After the cells were harvested and washed,they were incubated with FACS permeabilizing solution (BD, Franklin Lakes,NJ; 10� solution diluted 1:10 with deionized water) for 10 min at RT andsubsequently washed prior to staining. For each stimulant, 3 sets of 0.3 � 106
PBMCs were stained with three different cocktails of labeled MAb (20 �l; BD,Franklin Lakes, NJ): isotype control MAbs, anti-interleukin 2 (IL-2)-fluoresceinisothiocyanate (FITC) plus anti-CD69-phycoerythrin (PE) plus anti-CD4-PerCP(peridinin chlorophyll protein)-Cy5.5 plus anti-CD3-APC MAbs, and anti-IFN-�-FITC plus anti-CD69-PE plus anti-CD4-PerCP-Cy5.5 plus anti-CD3-APCMAbs. Samples were incubated at RT for 30 min in the dark and then washedtwice before adding 200 �l of 1% paraformaldehyde in PBS. The sampleswere then stored at 4°C in the dark prior to flow cytometric analysis. Thesamples were analyzed using four-color flow cytometry. At least 50,000 lym-phocyte events were acquired and recorded per tube. A template report formthat runs under BD CellQuest software was used to analyze the list mode dataand calculate the indices for analysis.
Statistical analysis. Differences in each assay between the two groups weretested using the Wilcoxon rank sum test. Correlations between two differenttypes of assays or between fresh and cryopreserved PBMCs used in the sameassay were assessed using rank-based Spearman correlation coefficients. Allavailable data at each time point were included in the analyses. With a samplesize of 30 subjects in group A and 24 in group B, the study was expected to havea 94% power to detect a 0.75 log10 shift (e.g., 2 SI to 11.05 SI for LPA responses,4 spot-forming cells [SFC]/105 cells to 22.10 SFC/105 cells for ELISPOT re-sponses, or 20 ng/ml to 1,105 ng/ml for CP responses) in the distribution of agiven assay result on a given type of specimen between the two groups with a typeI error of 0.05. Reported P values are two-sided at the 5% level and unadjustedfor multiple testing. Comparisons and correlations with a P value of �0.05 areconsidered statistically significant.
RESULTS
Group demographics. Fifty-four subjects were enrolled, 30in group A and 24 in group B. Differences between the baselinedemographic information of the two groups were not statisti-cally significant (Table 1). The median age was 43 years. Me-dian CD4 counts were 682 and 776 cells/mm3 for groups A andB, respectively. Two subjects from group A had plasma viralloads �50 copies/ml (97 and 1,170 copies/ml) at entry. Forgroup B, the median plasma viral load was 165 copies/ml, with25th and 75th percentiles being 50 and 1,110 copies/ml, respec-tively. None of the subjects were lost to follow-up.
T-cell reactivity in the two groups of subjects assessed by theLP, CP, and ELISPOT assays. We performed 3 conventionalassays for anti-HIV-1 T-cell-specific immunologic function,i.e., the LPA (at entry and weeks 12 and 24 on fresh PBMCsand at week 12 on cryopreserved PBMCs), the CP assay (atweek 12 on fresh PBMCs and at entry and weeks 12 and 24 oncryopreserved PBMCs), and the ELISPOT assay (same as forthe CP assay). Our initial analysis suggested no discerniblevariability within each of these assays at the three differenttime points using the same type of PBMCs, and in order toeffectively summarize and present data, results from the threetime points using the same type of PBMCs were averaged usingthe geometric mean for further analysis of each assay. Al-though there were no subjects lost to follow-up, we were un-able to obtain some specimens, and certain samples were clas-sified as technical failures due to inadequate positive-controlresponses and were excluded from the analyses. A technicalfailure was defined for each of the assays as follows: for theLPA, an SEB response of SI � 10; for the CP assay, an SEBresponse of �10,000 ng/ml IFN-�; for the ELISPOT assay, anSEB response of �100 spot-forming units (SFU)/105 cells; for
the ICC-flow assay, fewer than 10 CD8� CD69� IFN-� cellsper 50,000 cells examined in the sample stimulated with SEB.
We examined LPA responses to inactivated HIV-1, to bothHIV-1 peptide pools, and to recombinant HIV-1 p24 antigenin fresh PBMC samples at all time points and on cryopreservedPBMCs at week 12. The HIV-1 peptide pools should stimulateboth CD8� and CD4� T cells, whereas the whole proteinshould predominately activate CD4� T cells. The results showthat the PBMCs from both groups of subjects had proliferativeresponses to the HIV-1 antigens, with the greatest responses towhole inactivated HIV-1 MN and to p24 Gag (Fig. 1a). Al-though there were higher levels of T-cell proliferative re-sponses for group B subjects than for group A to all four typesof HIV-1 antigens using fresh PBMCs, these differences werenot significant. Similarly, there were no significant differencesobserved between the groups when using cryopreserved spec-imens (Fig. 1b).
We assessed PBMC supernatants by EIA (CP) for produc-tion of IFN-� in response to the same 4 HIV-1 antigens as inthe LPA, as well as to vHIV. Fresh specimens were used fromweek 12 only, while cryopreserved cells were used for all timepoints. Fresh PBMCs from group B produced more IFN-�than group A PBMCs in response to HIV-1 MN and the twoHIV-1 peptide pools (Fig. 1a). Indeed, fresh PBMCs fromgroup A produced detectable median IFN-� in response toHIV-1 MN only. When cryopreserved PBMC samples wereused, greater IFN-� levels were produced in group B than in
TABLE 1. Baseline demographics of the A5181 study groups(P � not significant)
Demographics
Valuea
Total(n � 54)
Group A(n � 30)
Group B(n � 24)
AgeMedianb 43 42 4318–29 3 (6) 2 (7) 1 (4)30–39 15 (28) 9 (30) 6 (25)40–49 22 (41) 13 (43) 9 (38)50–59 12 (22) 5 (17) 7 (29)Over 60 2 (4) 1 (3) 1 (4)
GenderMale 41 (76) 25 (93) 16 (67)Female 13 (24) 5 (17) 8 (33)
Race/ethnicityWhite 30 (56) 17 (57) 13 (54)Black 20 (37) 10 (33) 10 (42)Hispanic 4 (7) 3 (10) 1 (4)
CD4 countc
Median 736 682 776Q1, Q3 557, 887 549, 851 598, 918
RNA entry�50 copies/ml 35 (65) 28 (93) 7 (29)�50 copies/ml 19 (35) 2 (7) 17 (71)Median (Q1, Q3)d 165 (50, 1,110)
a Values are the numbers of patients (percentages) except where otherwisenoted.
b Values are the median ages in years.c Values are the numbers of CD4 cells/mm3.d Q values are median HIV-1 RNA expressed in copies per milliliter.
1454 MACATANGAY ET AL. CLIN. VACCINE IMMUNOL.
on January 3, 2019 by guesthttp://cvi.asm
.org/D
ownloaded from
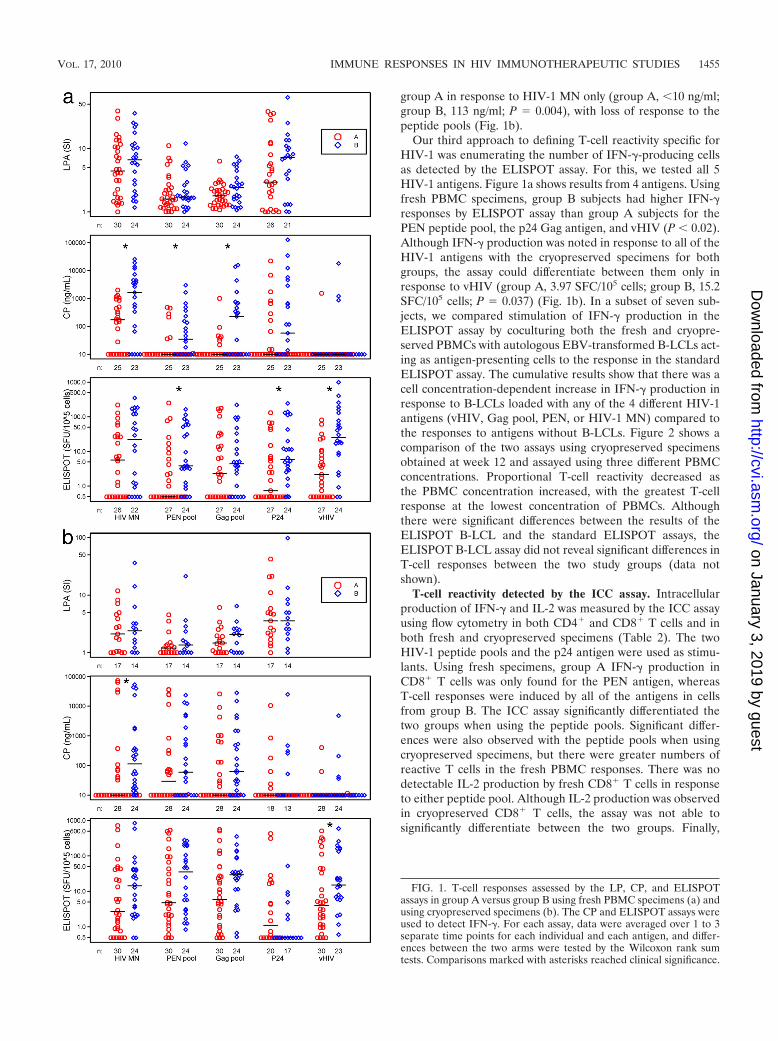
group A in response to HIV-1 MN only (group A, �10 ng/ml;group B, 113 ng/ml; P � 0.004), with loss of response to thepeptide pools (Fig. 1b).
Our third approach to defining T-cell reactivity specific forHIV-1 was enumerating the number of IFN-�-producing cellsas detected by the ELISPOT assay. For this, we tested all 5HIV-1 antigens. Figure 1a shows results from 4 antigens. Usingfresh PBMC specimens, group B subjects had higher IFN-�responses by ELISPOT assay than group A subjects for thePEN peptide pool, the p24 Gag antigen, and vHIV (P � 0.02).Although IFN-� production was noted in response to all of theHIV-1 antigens with the cryopreserved specimens for bothgroups, the assay could differentiate between them only inresponse to vHIV (group A, 3.97 SFC/105 cells; group B, 15.2SFC/105 cells; P � 0.037) (Fig. 1b). In a subset of seven sub-jects, we compared stimulation of IFN-� production in theELISPOT assay by coculturing both the fresh and cryopre-served PBMCs with autologous EBV-transformed B-LCLs act-ing as antigen-presenting cells to the response in the standardELISPOT assay. The cumulative results show that there was acell concentration-dependent increase in IFN-� production inresponse to B-LCLs loaded with any of the 4 different HIV-1antigens (vHIV, Gag pool, PEN, or HIV-1 MN) compared tothe responses to antigens without B-LCLs. Figure 2 shows acomparison of the two assays using cryopreserved specimensobtained at week 12 and assayed using three different PBMCconcentrations. Proportional T-cell reactivity decreased asthe PBMC concentration increased, with the greatest T-cellresponse at the lowest concentration of PBMCs. Althoughthere were significant differences between the results of theELISPOT B-LCL and the standard ELISPOT assays, theELISPOT B-LCL assay did not reveal significant differences inT-cell responses between the two study groups (data notshown).
T-cell reactivity detected by the ICC assay. Intracellularproduction of IFN-� and IL-2 was measured by the ICC assayusing flow cytometry in both CD4� and CD8� T cells and inboth fresh and cryopreserved specimens (Table 2). The twoHIV-1 peptide pools and the p24 antigen were used as stimu-lants. Using fresh specimens, group A IFN-� production inCD8� T cells was only found for the PEN antigen, whereasT-cell responses were induced by all of the antigens in cellsfrom group B. The ICC assay significantly differentiated thetwo groups when using the peptide pools. Significant differ-ences were also observed with the peptide pools when usingcryopreserved specimens, but there were greater numbers ofreactive T cells in the fresh PBMC responses. There was nodetectable IL-2 production by fresh CD8� T cells in responseto either peptide pool. Although IL-2 production was observedin cryopreserved CD8� T cells, the assay was not able tosignificantly differentiate between the two groups. Finally,
FIG. 1. T-cell responses assessed by the LP, CP, and ELISPOTassays in group A versus group B using fresh PBMC specimens (a) andusing cryopreserved specimens (b). The CP and ELISPOT assays wereused to detect IFN-�. For each assay, data were averaged over 1 to 3separate time points for each individual and each antigen, and differ-ences between the two arms were tested by the Wilcoxon rank sumtests. Comparisons marked with asterisks reached clinical significance.
VOL. 17, 2010 IMMUNE RESPONSES IN HIV IMMUNOTHERAPEUTIC STUDIES 1455
on January 3, 2019 by guesthttp://cvi.asm
.org/D
ownloaded from

there was little or no detectable IL-2 and IFN-� production byfresh or cryopreserved CD4� T cells in response to any of theantigens in group A or B. Where some positive responses wereseen, the assay was not able to significantly differentiate be-tween the two groups (Table 2).
Correlations between assays. Correlations were assessed be-tween the LP, CP, and ELISPOT assays (Table 3). A modestcorrelation was seen between the ELISPOT assay and theLPA for both fresh and cryopreserved PBMC samples inresponse to HIV-1 MN (r � 0.37, P � 0.01 and r � 0.43, P �0.02, respectively). Similar correlations were noted betweenthe ELISPOT and the CP assays in response to HIV-1 MN(r � 0.39, P � 0.01 and r � 0.53, P � 0.001 for fresh andcryopreserved PBMCs, respectively). Greater correlationswere also observed between the ELISPOT and CP responsesfor cryopreserved PBMCs when stimulated with the Gagand PEN peptide pools (r � 0.60, P � 0.001 and r � 0.68,P � 0.001, respectively). Modest correlations were alsonoted between the ICC and ELISPOT assays when using thep24 antigen (r � 0.49, P � 0.006) (Fig. 3) and between the
ICC and CP assays when using the PEN peptide pool (r �0.39, P � 0.038) (Fig. 3).
The HIV-1 antigen-specific T-cell responses of fresh andcryopreserved PBMC samples were examined for correlationsat week 12 using the three assays. In the LPA, significantcorrelations were observed between responses of fresh andcryopreserved samples when using HIV-1 MN and the Gagpeptide pool. Of the HIV-1 antigens used in the CP assay, onlythe response to vHIV was found to have a significant correla-tion in fresh and cryopreserved samples. In the ELISPOTassay, significant albeit marginal correlations between freshand cryopreserved PBMC samples were found for responses toHIV-1 MN and the Gag peptide pool. A stronger correlationwas seen when the stimulant used was vHIV (r � 0.6, P �0.001) (Fig. 4).
DISCUSSION
As immunotherapeutic strategies for HIV-1 infection arecontinuously being developed, so are the techniques for assess-
FIG. 2. Median ELISPOT B-LCL and standard ELISPOT responses in week 12 cryopreserved PBMC samples (n � 7; n � 6 in all 3 � 105-cellconcentrations). ELISPOT B-LCL points with asterisks indicate statistically significant differences compared to results from the standardELISPOT assay.
1456 MACATANGAY ET AL. CLIN. VACCINE IMMUNOL.
on January 3, 2019 by guesthttp://cvi.asm
.org/D
ownloaded from

ing their immunologic activities. In HIV-1 immune-based ther-apy trials, the standard assays have included the ELISPOT, LP,CP, and ICC assays. Of these, the ELISPOT assay has beenconsidered the gold standard in a number of vaccine trialsbecause of its sensitivity and extensive validation (18, 20).However, although the ELISPOT assay is more sensitive thanthe ICC assay, the latter has the advantage of simultaneouslyidentifying production of many different cytokines, chemo-kines, and cytotoxic factors (26).
The rationale for this study was to compare T-cell reactivityusing different, highly controlled immunologic assays in orderto determine which of these commonly used assays is the mostrelevant in measuring an effective immune response to HIV.Our data suggested that no single assay showed clear-cut dif-
ferences between the study groups for all of the HIV-1 anti-gens. Among the four assays tested, the LPA did not differen-tiate between the two groups with any of the HIV antigenstested. Use of fresh or cryopreserved specimens did not makea difference. Despite not being able to differentiate betweenthe two groups, lymphocyte proliferation was observed with allthe antigens tested. The inability to distinguish between thetwo groups may be because the LPA has been shown to detectT-cell immunity whether the immune response is low or robust,whereas IFN-� secretion detected by the ELISPOT assay wasaccurate in assessing a robust T-cell response (15).
The CP assay detected the most number of differences be-tween the two groups of study subjects, indicating that thissimple EIA for IFN-� on cell culture supernatants may be
TABLE 2. Expression of IFN-� and IL-2 in groups A and B as measured by intracellular cytokine staining by flow cytometrya
Assay PBMC prep Group(no. of samples)
Median antigenic stimulus for:
Gag pool PEN pool p24
ICC-flow IFN-� CD8� Fresh A (17) �5 6.3 �5Fresh B (14) 23.2 33.9 8.7P value 0.048 0.019 0.14Cryopreserved A (11) 5.5 21.9 �5Cryopreserved B (10) 196.7 112.5 �5P value 0.036 0.042 0.31
ICC-flow IL-2 CD8� Fresh A (17) �5 �5 �5Fresh B (14) �5 �5 20.7P value 0.61 0.80 0.36Cryopreserved A (11) 42.7 30.8 �5Cryopreserved B (10) 58.6 33.6 33.0P value 0.47 0.76 0.07
ICC-flow IFN-� CD4� Fresh A (17) �5 �5 �5Fresh B (14) �5 �5 11.4P value 0.31 1.0 0.25Cryopreserved A (11) 23.7 �5 �5Cryopreserved B (10) 23.9 11.5 9.2P value 0.82 0.52 0.67
ICC-flow IL-2 CD4� Fresh A (17) �5 �5 �5Fresh B (14) �5 10.4 6.2P value 0.66 0.70 0.60Cryopreserved A (11) 49.9 18.3 �5Cryopreserved B (10) 27.1 11.9 79.7P value 0.63 0.97 0.29
a For each assay, data were averaged over 1 to 3 separate time points for each individual and each antigen, and medians are for the two arms tested for differencesby the Wilcoxon rank sum tests. Comparisons that reached statistical significance are in bold.
TABLE 3. Correlation between the ELISPOT and the LP and CP assaysa
Antigen
Correlation between ELISPOT and:
LPA CP assay
Fresh samples Cryopreserved samples Fresh samples Cryopreserved samples
n r (P value) n r (P value) n r (P value) n r (P value)
HIV-1 MN 48 0.37 (0.010) 31 0.43 (0.016) 43 0.39 (0.010) 52 0.53 (<0.001)Gag pool 51 �0.18 (0.21) 31 �0.07 (0.70) 45 0.003 (0.98) 52 0.60 (<0.001)PEN pool 51 �0.15 (0.29) 31 0.37 (0.38) 45 0.11 (0.49) 52 0.68 (<0.001)p24 44 0.03 (0.050) 24 0.28 (0.18) 45 �0.03 (0.85) 30 0.04 (0.98)vHIV Not done Not done 45 0.05 (0.74) 51 0.11 (0.45)vLacZ Not done Not done 42 �0.08 (0.61) 44 0.11 (0.49)
a Correlations in bold indicate statistical significance using rank-based Spearman correlations.
VOL. 17, 2010 IMMUNE RESPONSES IN HIV IMMUNOTHERAPEUTIC STUDIES 1457
on January 3, 2019 by guesthttp://cvi.asm
.org/D
ownloaded from

adequate in distinguishing between endogenous immune con-trol of HIV replication and its absence. The ELISPOT assaydetected as many differences as the CP assay but in response todifferent HIV-1 antigens. As the ELISPOT assay has beenstandardized and is sensitive to low-frequency responses, aslow as 25 IFN-�-producing cells per million (25), results of thisassay still prove to be useful readouts of immunologic control.However, it is important to consider that results of previousstudies have shown that the ELISPOT assay for IFN-� pro-duction does not necessarily correlate with viral control (1, 27),hence the need for other assays that would better predictimmune control of HIV.
The use of B-LCLs as antigen-presenting cells for theELISPOT assay also yielded interesting results. Although thisassay did not show significant differences between the groups,there was an increase in the numbers of IFN-�-producing cellsin this system compared to results using the standard ELISPOTassay in response to most of the HIV-1 antigens. This has beenfound in previous studies wherein the use of B-LCLs yieldedhigher numbers of HIV-1-specific cytotoxic T lymphocyte(CTL) and IFN-�-producing cells (10, 17). Due to the presenceof EBV and the relatively high background responses to theB-LCL assay, current approaches to enhance the magnitude ofT-cell reactivity in vitro include using autologous dendritic cells(16, 22) and nontransformed B cells (28) as antigen-presentingcells or an extension of the incubation period in the ELISPOTassay (9). It is important to note that the ELISPOT B-LCLassay was conducted in only a subset of patients (n � 7), whichcould possibly explain why, statistically, it was not able todistinguish between the two groups.
Although the ICC assay was able to differentiate between the twogroups only when using the peptide pools, it was able to do so in bothfresh and cryopreserved specimens, unlike the CP and ELISPOT
assays, where the ability to distinguish between the groups was de-creased when cryopreserved specimens were used. Our results con-firm previously published findings which found that in flow cytom-etry, peptides were more effective in stimulating responses in bothfresh and cryopreserved than whole-protein antigens (21). More-over, previous studies have suggested that using 15-mer peptidesoverlapping by 11 amino acids can effectively stimulate responses inboth CD4� and CD8� T cells (19, 21). Our results showed that evenif we were able to show T-cell responses in both CD4� and CD8� Tcells using these types of peptides, it was only in the CD8� T cellsthat the ICS was able to distinguish between the two groups. Secre-tion of IL-2 did not distinguish between the two groups. Moreover,CD8� IL-2 secretion was lower than CD8� IFN-� secretion. Thiscould be due to CD8� T-cell dysfunction or depletion as a conse-quence of sustained HIV replication. IL-2 production is lost early inthe transition into viral persistence (5). Indeed, in chronic viral in-fections, there is a hierarchical loss of effector cytokines, with IL-2secretion as the first to go and IFN-� the last (29). The advantage ofusing flow cytometry is its ability to combine multiple parameters inevaluating T-cell function. As recent studies have shown that aneffective HIV-1 response is characterized by the presence of a poly-functional (i.e., secreting two or more immune mediators) CD8�
T-cell response to the virus (2, 4, 24), multiparameter flow cytometrycould have a better role in evaluating HIV immunotherapeutic strat-egies.
Since multiple sites are necessary for large studies, such as thoseneeded to explore the utility of prophylactic vaccines, the use ofcryopreserved PBMCs permits centralized analyses of samples inthese multisite trials. In the ELISPOT and CP assays, the ability todetect a difference between the two groups was decreased whencryopreserved specimens were used. Indeed, in the study by Best etal. (3), IFN-� release as detected by enzyme-linked immunosorbentassay (ELISA) was lower in samples that were cryopreserved thanthat in fresh samples. Specimen processing may be a factor contrib-
FIG. 4. Correlations between fresh and cryopreserved PBMCs inthe ELISPOT assay (rank-based Spearman correlation).
FIG. 3. Correlation between the ICC-flow assay for IFN-� (sum ofIFN-�-producing CD4� and CD8� T cells) versus the ELISPOT andCP assays using fresh PBMCs (rank-based Spearman correlation).
1458 MACATANGAY ET AL. CLIN. VACCINE IMMUNOL.
on January 3, 2019 by guesthttp://cvi.asm
.org/D
ownloaded from

uting to the disparity. As such, strict quality control in cryopreserva-tion and thawing is necessary. Although participating sites in theACTG follow the same procedures in processing specimens for allnetwork protocols, laboratory performance must be regularly evalu-ated to ensure strict adherence and uniformity among laboratoryprocessing sites. As with frozen specimens, the use of fresh samplesalso requires strict processing guidelines. In protocols with multiplestudy sites, proper and efficient shipping procedures must be in placeif real-time assays are to be done. In ICC-flow assays, the samenumber of statistically significant comparisons was observed with theuse of fresh and frozen samples.
In conclusion, we found that both the CP and ELISPOT assayswere able to discriminate in vitro immune responses associated withendogenous control of HIV replication from those that were not.However, the wide variation between the assays studied provides acautionary note to the use of multiple laboratories to monitor resultsof HIV immunotherapeutic vaccine trials, specifically those whichuse in vitro assays of T-cell function as primary endpoints. The basicsof specimen handling, cryopreservation, and thawing should also beemphasized, as they will necessarily affect the performance and reli-ability of these assays. Quality control of immunologic techniquesshould be performed regularly in order to validate these tests, allow-ing them to be used in large-scale immunotherapeutic studies.
ACKNOWLEDGMENTS
The project described was supported by the following grants fromthe National Institute of Allergy and Infectious Diseases:U01AI068636, SDMC grant AI68634, ACTG grants AI69477,AI27675, AI73961, AI69494, AI69501, AI68638, AI069471,AI038858, AI069452, AI69450, AI54907, and RR25780.
We gratefully acknowledge the study volunteers and the A5181study sites and site staff, particularly Margaret Fischl and LeslieThompson (University of Miami School of Medicine), Sharon Riddler,Carol Oriss, Xiao-Li Huang, and Nancy Connolly (University of Pitts-burgh), Kathleen Medvik and Dominic Dorazio (Case Western Re-serve University), Allan Tenorio and Janet Rindells (Rush UniversityMedical Center), Xiao-Dong Li (UC Davis), Karen Savage and DanaGreen (University of Alabama Therapeutics), and Graham Ray andMonica Carten (University of Colorado Hospital).
The content is solely the responsibility of the authors and does notnecessarily represent the official views of the National Institute ofAllergy and Infectious Diseases or the National Institutes of Health.
REFERENCES
1. Addo, M. M., X. G. Yu, A. Rathod, D. Cohen, R. L. Elridge, D. Strick, M. N.Johnston, C. Corcoran, A. G. Wurcel, C. A. Fitzpatrick, M. E. Feeney, W. R.Rodriguez, N. Basgoz, R. Draenert, D. R. Stone, C. Brander, P. J. Goulder, E. S.Rosenberg, M. Altfeld, and B. D. Walker. 2003. Comprehensive epitope analysisof human immunodeficiency virus type 1 (HIV-1)-specific T-cell responses di-rected against the entire expressed HIV-1 genome demonstrate broadly di-rected responses, but no correlation to viral load. J. Virol. 77:2081–2092.
2. Baker, B. M., B. L. Block, A. C. Rothchild, and B. D. Walker. 2009. Elitecontrol of HIV infection: implications for vaccine design. Expert Opin. Biol.Ther. 9:55–69.
3. Best, A., G. Hidalgo, K. Mitchell, and J. R. Yannelli. 2007. Issues concerningthe large scale cryopreservation of peripheral blood mononuclear cells(PBMC) for immunotherapy trials. Cryobiology 54:294–297.
4. Betts, M. R., M. C. Nason, S. M. West, S. C. De Rosa, S. A. Migueles, J.Abraham, M. M. Lederman, J. M. Benito, P. A. Goepfert, M. Connors, M.Roederer, and R. A. Koup. 2006. HIV nonprogressors preferentially main-tain highly functional HIV-specific CD8� T cells. Blood 107:4781–4789.
5. Brooks, D. G., L. Teyoton, M. B. Oldstone, and D. B. McGavern. 2005.Intrinsic functional dysregulation of CD4 T cells occurs rapidly followingpersistent viral infection. J. Virol. 79:10514–10527.
6. Bucy, R. P. 1999. Immune clearance of HIV type 1 replication-active cells: amodel of two patterns of steady state HIV infection. AIDS Res. Hum.Retroviruses 15:223–227.
7. Bucy, R. P. 2001. Viral and cellular dynamics in HIV disease. Curr. Infect.Dis. Rep. 3:295–301.
8. Bucy, R. P., and J. M. Kilby. 2001. Perspectives on inducing efficient immunecontrol of HIV-1 replication—a new goal for HIV therapeutics? AIDS15(Suppl. 2):S36–S42.
9. Calarota, S. A., A. Foli, R. Maserati, F. Baldanti, S. Paolucci, M. A. Young,C. M. Tsoukas, J. Lisziewicz, and F. Lori. 2008. HIV-1-specific T cell pre-cursors with high proliferative capacity correlate with low viremia and highCD4 counts in untreated individuals. J. Immunol. 180:5907–5915.
10. Connick, E., R. L. Schlichtemeier, M. B. Purner, K. M. Schneider, D. M.Anderson, S. MaWhinney, T. B. Campbell, D. R. Kuritzkes, J. M. Douglas,Jr., F. N. Judson, and R. T. Schooley. 2001. Relationship between humanimmunodeficiency virus type 1 (HIV-1)-specific memory cytotoxic T lympho-cytes and virus load after recent HIV-1 seroconversion. J. Infect. Dis. 184:1465–1469.
11. Connolly, N. C., T. L. Whiteside, C. Wilson, V. Kondragunta, C. R. Rinaldo,and S. A. Riddler. 2008. Therapeutic immunization with human immunode-ficiency virus type 1 (HIV-1) peptide-loaded dendritic cells is safe and in-duces immunogenicity in HIV-1-infected individuals. Clin. Vaccine Immu-nol. 15:284–292.
12. Deeks, S. G., and B. D. Walker. 2007. Human immunodeficiency virus con-trollers: mechanisms of durable virus control in the absence of antiretroviraltherapy. Immunity 27:406–416.
13. Endsley, A. N., N. N. Salama, and R. J. Ho. 2008. Combining drug andimmune therapy: a potential solution to drug resistance and challenges ofHIV vaccines? Curr. HIV Res. 6:401–410.
14. Fuse, S., M. J. Molloy, and E. J. Usherwood. 2008. Immune responses againstpersistent viral infections: possible avenues for immunotherapeutic interven-tions. Crit. Rev. Immunol. 28:159–183.
15. Goodell, V., C. dela Rosa, M. Slota, B. McLeod, and M. L. Disis. 2007. Sensi-tivity and specificity of tritiated thymidine incorporation and ELISPOT assays inidentifying antigen specific T cell immune responses. BMC Immunol. 8:21.
16. Huang, X. L., Z. Fan, L. Borowski, and C. R. Rinaldo. 2008. Maturation ofdendritic cells for enhanced activation of anti-HIV-1 CD8(�) T cell immu-nity. J. Leukoc. Biol. 83:1530–1540.
17. Huang, X. L., Z. Fan, J. Liebmann, and C. Rinaldo. 1995. Detection ofhuman immunodeficiency virus type 1-specific memory cytotoxic T lympho-cytes in freshly donated and frozen-thawed peripheral blood mononuclearcells. Clin. Diagn. Lab. Immunol. 2:678–684.
18. Janetzki, S., S. Schaed, N. E. Blachere, L. Ben-Porat, A. N. Houghton, andK. S. Panageas. 2004. Evaluation of ELISPOT assays: influence of methodand operator on variability of results. J. Immunol. Methods 291:175–183.
19. Kiecker, F., M. Streitz, G. Cherepnev, H. D. Volk, R. Volkmer-Engert, and F.Kern. 2004. Analysis of antigen-specific T-cell responses with synthetic pep-tides—what kind of peptide for which purpose? Hum. Immunol. 65:523–536.
20. Kutscher, S., C. J. Dembek, S. Allgayer, S. Heltai, B. Stadibauer, P. Biswas, S.Nozza, G. Tambussi, J. R. Bogner, H. J. Stellbrink, F. D. Goebel, P. Lusso, M.Tinelli, G. Poli, F. Erfle, H. Pohla, M. Mainati, and A. Cosma. 2008. Theintracellular detection of MIP-1beta enhances the capacity to detect IFN-gamma mediated HIV-1-specific CD8 T-cell responses in a flow cytometricsetting providing a sensitive alternative to the ELISPOT. AIDS Res. Ther. 5:22.
21. Maecker, H. T., H. S. Dunn, M. A. Suni, E. Khatamzas, C. J. Pitcher, T.Bunde, N. Persaud, W. Trigona, T. M. Fu, E. Sinclair, B. M. Bredt, J. M.McCune, V. C. Maino, F. Kern, and L. J. Picker. 2001. Use of overlappingpeptide mixtures as antigens for cytokine flow cytometry. J. Immunol. Meth-ods 255:27–40.
22. Rinaldo, C. R. 2009. Dendritic cell-based human immunodeficiency virusvaccine. J. Intern. Med. 265:138–158.
23. Routy, J. P., M. R. Boulassel, B. Yassine-Diab, C. Nicolette, D. Healey, R.Jain, O. Yegorov, I. Tcherepanova, T. Monesmith, L. Finke, and R. P.Sekaly. 2010. Immunologic activity and safety of autologous HIV RNA-electroporated dendritic cells in HIV-1 infected patients receiving antiret-roviral therapy. Clin. Immunol. 134:140–147.
24. Seder, R. A., P. A. Darrah, and M. Roederer. 2008. T-cell quality in memory andprotection: implications for vaccine design. Nat. Rev. Immunol. 8:247–258.
25. Streeck, H., N. Frahm, and B. D. Walker. 2009. The role of IFN-gammaELISPOT assay in HIV vaccine research. Nat. Protoc. 4:461–469.
26. Tobery, T. W., S. A. Dubey, K. Anderson, D. C. Freed, K. S. Cox, J. Lin, M. T.Prokop, K. J. Sykes, R. Mogg, D. V. Mehrotra, T. M. Fu, D. R. Casimiro, andJ. W. Shiver. 2006. A comparison of standard immunogenicity assays formonitoring HIV type 1 gag-specific T cell responses in Ad5 HIV type 1 gagvaccinated human subjects. AIDS Res. Hum. Retroviruses 22:1081–1090.
27. Valentine, L. E., S. M. Piaskowski, E. G. Rakasz, N. L. Henry, N. A. Wilson, andD. I. Watkins. 2008. Recognition of escape variants in ELISPOT does notalways predict CD8� T-cell recognition of simian immunodeficiency virus-in-fected cells expressing the same variant sequences. J. Virol. 82:575–581.
28. von Bergwelt-Baildon, M., A. Shimabukuro-Vornhagen, A. Popov, et al. 2006.CD40-activated B cells express full lymph node homing triad and induce T-cellchemotaxis: potential as cellular adjuvants. Blood 107:2786–2789.
29. Wherry, E. J., J. N. Blattman, K. Murali-Krishna, R. van der Most, and R.Ahmed. 2003. Viral persistence alters CD8 T-cell immunodominance andtissue distribution and results in distinct stages of functional impairment.J. Virol. 77:4911–4927.
VOL. 17, 2010 IMMUNE RESPONSES IN HIV IMMUNOTHERAPEUTIC STUDIES 1459
on January 3, 2019 by guesthttp://cvi.asm
.org/D
ownloaded from