comparison of laboratory and field density of asphalt...
TRANSCRIPT

277 Technology Parkway • Auburn, AL 36830
NCAT Report 91-01
COMPARISON OF LABORATORYAND FIELD DENSITY OF ASPHALTMIXTURES
By
E.R. BrownStephen A. Cross
January 1991
Paper presented at the Annual Meeting of the Transportation ResearchBoard, Washington, DC, January 1991

COMPARISON OF LABORATORY AND FIELD DENSITY OF ASPHALTMIXTURES
By
E.R. BrownDirector
National Center for Asphalt TechnologyAuburn University, Alabama
Stephen A. CrossAssistant Professor
University of Kansas
NCAT Report 91-01
January 1991

i
DISCLAIMER
The contents of this report reflect the views of the authors who are solely responsible forthe facts and the accuracy of the data presented herein. The contents do not necessarily reflectthe official views and policies of the National Center for Asphalt Technology of AuburnUniversity. This report does not constitute a standard, specification, or regulation.
ii
ABSTRACT
The objective of this paper is to investigate the relationships between the measured density of themixture obtained in the mix design, during quality control of the mixture (laboratory compactionof field produced mix), after initial compaction (cores obtained after construction and beforetraffic), the final or ultimate density obtained from pavement cores after densification by trafficand the density of recompacted samples. Primary concern is the relationship between densityafter traffic, mix design density and density of laboratory compacted samples duringconstruction. Eighteen different pavements were sampled from six states. Thirteen of thepavements were experiencing premature rutting and five of the pavements were performingsatisfactorily. Construction history including mix design data, quality control and/or qualityassurance data, traffic data and laboratory data of the physical properties of the pavement coreswere analyzed from each site. The results show that in-place air void contents below 3% greatlyincrease the probability of premature rutting and the in-place unit weights of the pavements aftertraffic usually exceed the mix design unit weight resulting in low air voids and hence prematurerutting.

Brown & Cross
1
COMPARISON OF LABORATORY AND FIELD DENSITY OF ASPHALT MIXTURES
E.R. Brown and Stephen A. Cross
I. INTRODUCTION
Density or in-place unit weight is an important component of a properly designed andconstructed asphalt pavement. Selection of the proper compaction level during the mix designphase is critical for proper pavement performance. The Asphalt Institute in MS-2 (1)recommends that the mix design density should closely approach the maximum density obtainedin the pavement under traffic. The Marshall mix design method as originally developed by theUS Army Corps of Engineers at the Waterways Experiment Station (2), in the late 1940s, wasbased on evaluation of samples compacted to a relative density that approximated that densitydeveloped by a number of repetitions of a selected aircraft. The original method called forcompacting samples to 50 blows per side for tire pressures up to 100 psi and 75 blows per sidefor pressures over 100 psi. Over the years the Marshall method has been adapted to highway usewith 50 blows per side being utilized for medium traffic and 75 blows per side being utilized forheavy traffic (l).
In recent years, studies have been made that show typical truck tire pressures are approaching120 psi (3) and that higher truck tire pressures and increased truck traffic has led to an increasein premature rutting (4). The problem could very well be that the mix design density is beingexceeded by the in-place density. This excess density in the field results in low in-place airvoids. The relationship between low air voids and rutting is well established in the literature (5,6, 7).
The objective of this paper is to investigate the relationships between the measured density of themixture obtained in the mix design, during quality control of the mixture (laboratory compactionof field produced mix), after initial field compaction (cores obtained after construction andbefore traffic), the final or ultimate density obtained from pavement cores after densification bytraffic and the density of recompacted samples. Primary concern is the relationship betweendensity after traffic, mix design density and density of laboratory compacted samples duringconstruction.
Eighteen pavements were selected for study out of the 30 pavements sampled as a part ofNCAT’s rutting study. The eighteen pavements were all of the pavements where traffic data, mixdensity data and quality control and/or quality assurance data were available. Thirteen of the 18pavements had experienced premature rutting. The ages of these rutted pavements ranged fromone to six years at the time of sampling. Five of the 18 pavements were identified by the variousstates as performing satisfactorily (Sites 4, 8, 10, 18 and 24). These five pavements ranged in agefrom five to 16 years at the time of sampling.
II. TEST PLAN
The overall test plan for the rutting study is shown in Figure 1. A complete listing of the overalltest plan can be found in the report by Brown and Cross (5). The field testing consisted ofobtaining 4-inch and 6-inch diameter cores, rut depth measurements and, in a majority of therutted pavements, viewing the pavement layers in a trench cut across the traffic lane. In general,11 to 12 4-inch and 6-inch diameter cores were obtained on 1-foot intervals across the trafficlane at each site. The 4-inch cores were saved for further testing while the 6-inch cores weretested and the relevant results reported herein.

Brown & Cross
2
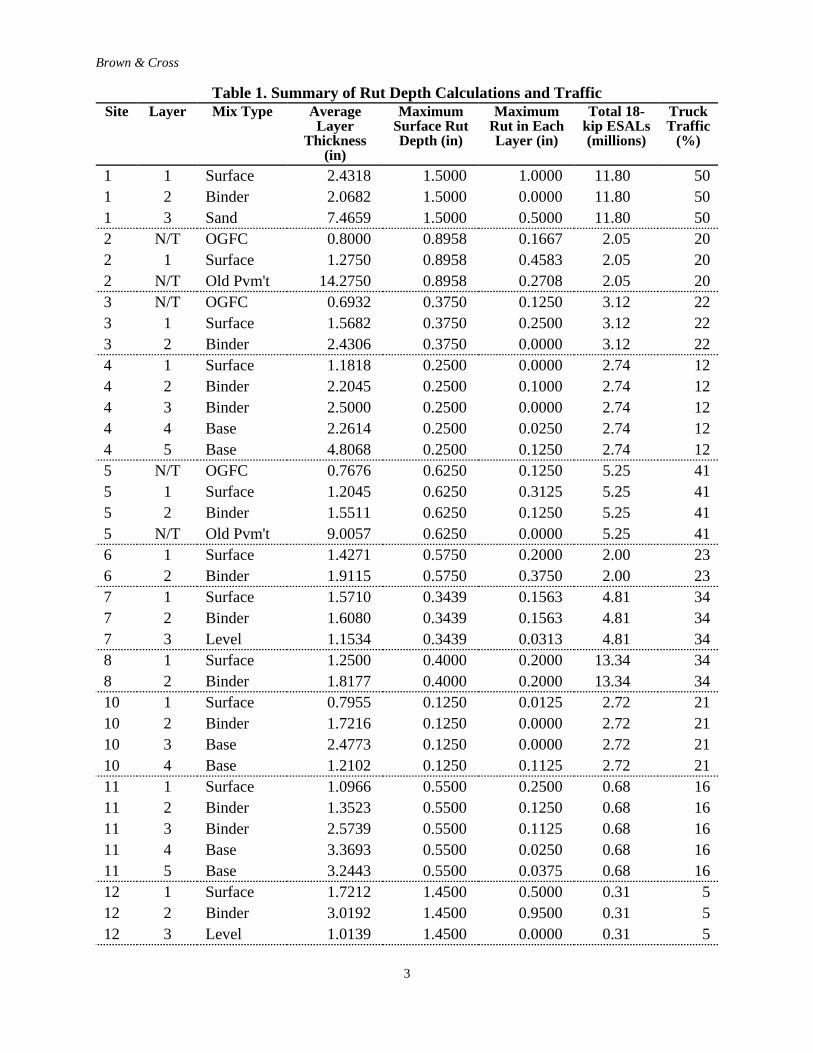
Rut depth measurements were obtained using a 12 foot elevated straight edge to establish ahorizontal reference line. The distance from the straight edge to the pavement surface was thenrecorded to the nearest 1/16 inch at 1-foot intervals over the core locations. Rut depthmeasurements at each core location along with measurements of each core allowed thedetermination of the relative elevation of each pavement layer. The maximum rut depth at thesurface was determined by measuring the vertical distance between a straight line connectinghigh points on opposite sides of the rut and the low point near the middle of the rut. Rut depthsalong with the traffic information are shown in Table 1.
Tests were conducted in the laboratory to characterize the material and mixture properties. The6-inch diameter cores were first measured to determine the layer thickness of each core. Next,the cores were sawed into their respective pavement layers and the bulk specific gravitydetermined (ASTM D2726) for each layer. The bulk specific gravities were evaluated across thepavement lane for each layer to determine the average in-place unit weight and the standarddeviation of the measured unit weights. This data was utilized to determine the 80th percentilein-place density. Two cores were then selected and the maximum theoretical specific gravitydetermined (ASTM D204 1). From the average maximum theoretical specific gravity, theaverage and 20th percentile in-place air void contents were determined. Previous research atNCAT (5) has shown the 20th and 80th percentiles to be reasonable to use to compare in-placeair voids and density after traffic to air voids and density of recompacted samples. The two coreswere then extracted to determine the asphalt content (ASTM D2172).
Figure 1. Overall Test Plan
Brown & Cross
3
Table 1. Summary of Rut Depth Calculations and TrafficSite Layer Mix Type Average
LayerThickness
(in)
MaximumSurface RutDepth (in)
MaximumRut in EachLayer (in)
Total 18-kip ESALs(millions)
TruckTraffic
(%)
1 1 Surface 2.4318 1.5000 1.0000 11.80 501 2 Binder 2.0682 1.5000 0.0000 11.80 501 3 Sand 7.4659 1.5000 0.5000 11.80 502 N/T OGFC 0.8000 0.8958 0.1667 2.05 202 1 Surface 1.2750 0.8958 0.4583 2.05 202 N/T Old Pvm't 14.2750 0.8958 0.2708 2.05 203 N/T OGFC 0.6932 0.3750 0.1250 3.12 223 1 Surface 1.5682 0.3750 0.2500 3.12 223 2 Binder 2.4306 0.3750 0.0000 3.12 224 1 Surface 1.1818 0.2500 0.0000 2.74 124 2 Binder 2.2045 0.2500 0.1000 2.74 124 3 Binder 2.5000 0.2500 0.0000 2.74 124 4 Base 2.2614 0.2500 0.0250 2.74 124 5 Base 4.8068 0.2500 0.1250 2.74 125 N/T OGFC 0.7676 0.6250 0.1250 5.25 415 1 Surface 1.2045 0.6250 0.3125 5.25 415 2 Binder 1.5511 0.6250 0.1250 5.25 415 N/T Old Pvm't 9.0057 0.6250 0.0000 5.25 416 1 Surface 1.4271 0.5750 0.2000 2.00 236 2 Binder 1.9115 0.5750 0.3750 2.00 237 1 Surface 1.5710 0.3439 0.1563 4.81 347 2 Binder 1.6080 0.3439 0.1563 4.81 347 3 Level 1.1534 0.3439 0.0313 4.81 348 1 Surface 1.2500 0.4000 0.2000 13.34 348 2 Binder 1.8177 0.4000 0.2000 13.34 3410 1 Surface 0.7955 0.1250 0.0125 2.72 2110 2 Binder 1.7216 0.1250 0.0000 2.72 2110 3 Base 2.4773 0.1250 0.0000 2.72 2110 4 Base 1.2102 0.1250 0.1125 2.72 2111 1 Surface 1.0966 0.5500 0.2500 0.68 1611 2 Binder 1.3523 0.5500 0.1250 0.68 1611 3 Binder 2.5739 0.5500 0.1125 0.68 1611 4 Base 3.3693 0.5500 0.0250 0.68 1611 5 Base 3.2443 0.5500 0.0375 0.68 1612 1 Surface 1.7212 1.4500 0.5000 0.31 512 2 Binder 3.0192 1.4500 0.9500 0.31 512 3 Level 1.0139 1.4500 0.0000 0.31 5
Brown & Cross
4
Table 1. Summary of Rut Depth Calculations and Traffic (Continued)Site Layer Mix Type Average
LayerThickness
(in)
MaximumSurface RutDepth (in)
MaximumRut in EachLayer (in)
Total 18-kip ESALs(millions)
TruckTraffic
(%)
12 3 Level 1.0139 1.4500 0.0000 0.31 513 1 Surface 1.5962 1.6563 0.8125 0.30 1213 2 Binder 2.4896 1.6563 0.8438 0.30 1218 N/T OGFC 0.8580 0.2000 0.0000 1.55 2118 1 Surface 1.7898 0.2000 0.1500 1.55 2118 2 Surface 2.1136 0.2000 0.0500 1.55 2118 N/T Old Sur 1.8281 0.2000 0.0000 1.55 2119 1 Surface 1.5280 0.3900 0.2250 0.26 319 2 Surface 1.7216 0.3900 0.0125 0.26 319 3 Binder 2.7500 0.3900 0.1525 0.26 320 N/T OGFC 0.8409 0.3167 0.0417 0.38 1920 1 Surface 1.4091 0.3167 0.0000 0.38 1920 2 Surface 2.1932 0.3167 0.2750 0.38 1920 N/T Old Sur 5.7273 0.3167 0.0000 0.38 1922 1 Surface 2.0375 0.5000 0.3250 4.40 5022 2 Binder 2.7938 0.5000 0.1750 4.40 5023 1 Surface 1.4205 0.5858 0.3024 3.30 4023 2 Binder 1.4432 0.5858 0.1667 3.30 4023 N/T Old Sur 2.0208 0.5858 0.1167 3.30 4024 1 Surface 1.2750 0.3150 0.0712 5.30 924 2 Binder 2.6438 0.3150 0.2437 5.30 9
N/T = Not Tested
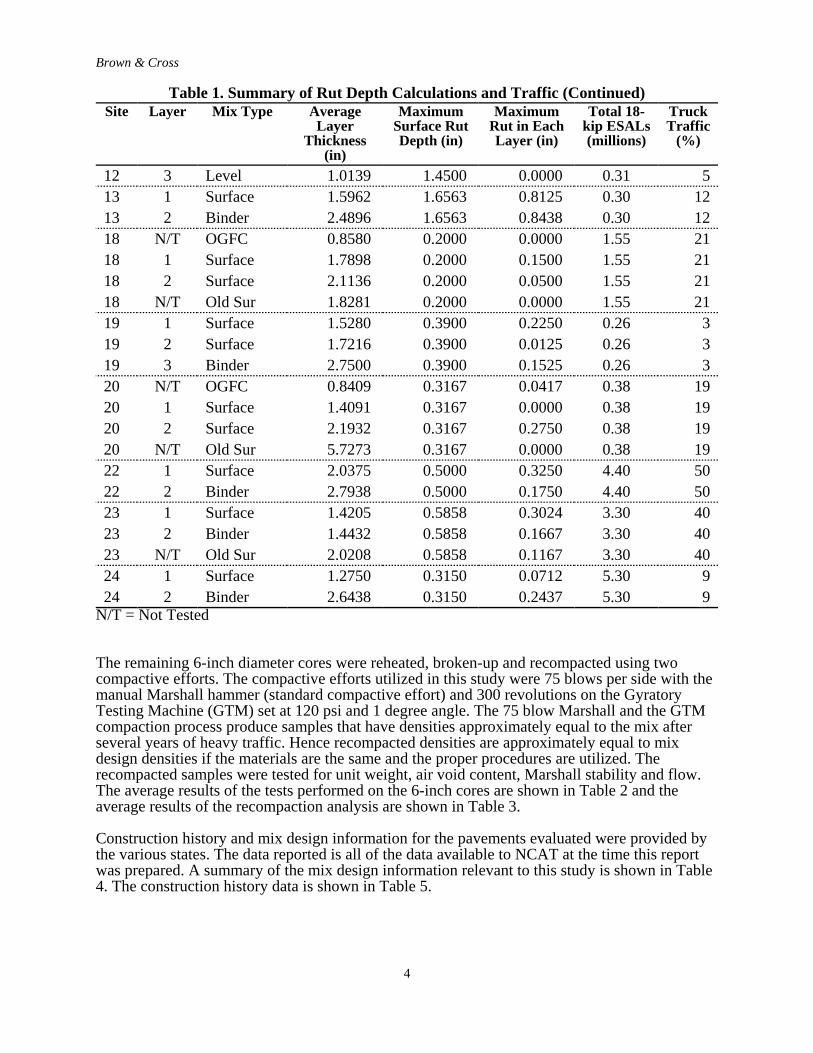
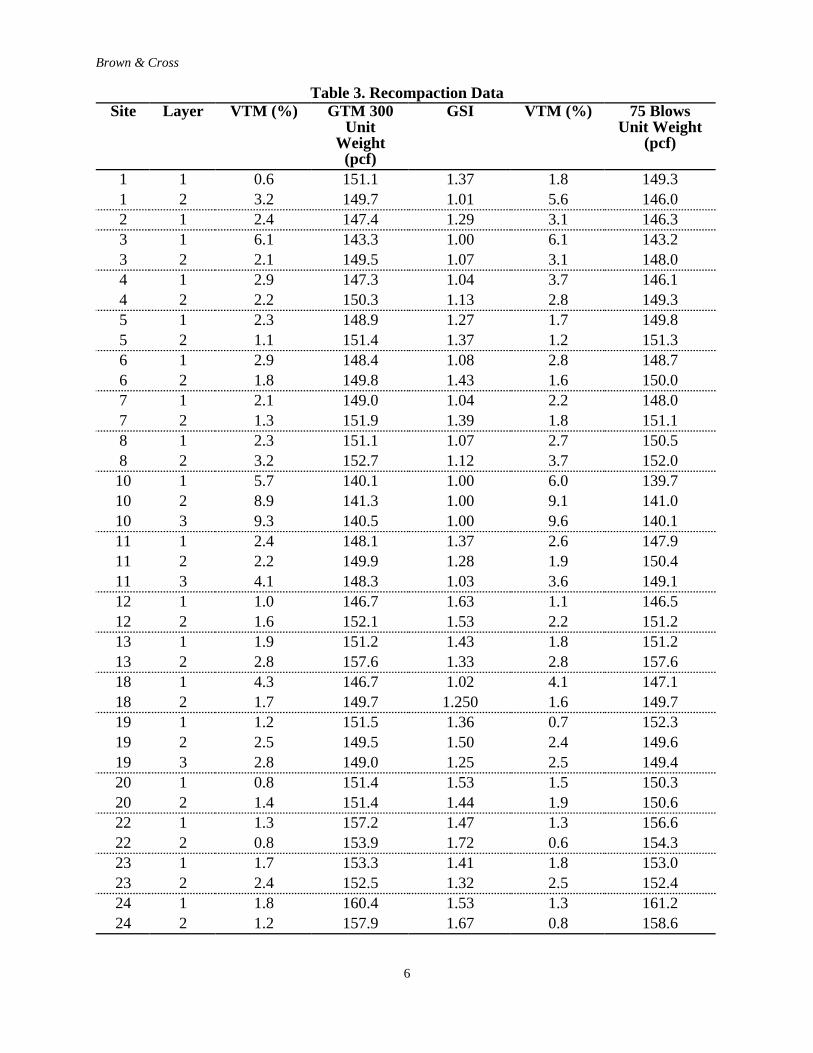
The remaining 6-inch diameter cores were reheated, broken-up and recompacted using twocompactive efforts. The compactive efforts utilized in this study were 75 blows per side with themanual Marshall hammer (standard compactive effort) and 300 revolutions on the GyratoryTesting Machine (GTM) set at 120 psi and 1 degree angle. The 75 blow Marshall and the GTMcompaction process produce samples that have densities approximately equal to the mix afterseveral years of heavy traffic. Hence recompacted densities are approximately equal to mixdesign densities if the materials are the same and the proper procedures are utilized. Therecompacted samples were tested for unit weight, air void content, Marshall stability and flow.The average results of the tests performed on the 6-inch cores are shown in Table 2 and theaverage results of the recompaction analysis are shown in Table 3.
Construction history and mix design information for the pavements evaluated were provided bythe various states. The data reported is all of the data available to NCAT at the time this reportwas prepared. A summary of the mix design information relevant to this study is shown in Table4. The construction history data is shown in Table 5.

Brown & Cross
5
Table 2. In-Place Data (NCAT Cores)Site Layer Asphalt
Content(%)
VTM Avg(%)
VTM 20th
Percentile(%)
UnitWeight
Avg (pcf)
Unit WeightBoth
Percentile(%)
1 1 7.8 1.5 0.7 150.1 151.21 2 4.0 2.3 0.9 151.1 153.22 1 6.0 4.0 3.6 144.9 145.63 1 5.2 6.3 5.7 142.9 143.93 2 4.8 3.9 3.3 147.0 148.04 1 5.6 4.3 3.1 145.3 147.14 2 4.3 3.6 3.2 148.1 148.85 1 6.8 3.8 3.1 146.6 147.75 2 6.5 3.6 2.8 147.6 148.86 1 4.8 5.4 4.6 144.7 146.06 2 5.4 4.0 3.4 146.4 147.37 1 5.3 33.2 2.2 147.3 148.97 2 4.7 3.8 3.1 148.1 149.18 1 4.5 3.2 2.1 149.7 151.48 2 4.2 4.0 3.0 151.4 153.110 1 6.8 6.1 5.1 139.5 141.010 2 4.3 11.6 10.9 137.2 138.210 3 4.5 13.0 12.5 134.7 135.511 1 6.3 4.1 2.7 145.6 147.711 2 5.2 4.1 2.4 147.0 149.611 3 4.4 10.0 8.5 139.2 141.412 1 6.5 1.9 1.3 145.3 146.212 2 5.0 4.7 3.6 147.4 149.013 1 6.2 4.9 3.5 146.6 148.713 2 4.1 8.3 6.4 148.7 151.918 1 4.3 6.9 5.2 142.8 145.518 2 4.7 5.2 4.0 144.2 146.019 1 5.7 1.4 0.9 151.1 151.919 2 5.3 3.7 4.2 146.8 147.619 3 5.1 6.0 6.9 142.7 144.020 1 5.6 2.1 1.8 149.3 149.720 2 5.2 3.6 2.5 148.1 149.722 1 5.2 2.0 1.5 155.4 156.222 2 5.9 2.2 1.9 151.8 152.323 1 5.0 2.7 1.8 151.6 153.023 2 5.0 4.3 3.7 149.5 150.424 1 6.3 2.8 1.4 158.8 161.124 2 4.5 2.0 1.5 156.7 157.5
Brown & Cross
6
Table 3. Recompaction DataSite Layer VTM (%) GTM 300
UnitWeight
(pcf)
GSI VTM (%) 75 BlowsUnit Weight
(pcf)
1 1 0.6 151.1 1.37 1.8 149.31 2 3.2 149.7 1.01 5.6 146.02 1 2.4 147.4 1.29 3.1 146.33 1 6.1 143.3 1.00 6.1 143.23 2 2.1 149.5 1.07 3.1 148.04 1 2.9 147.3 1.04 3.7 146.14 2 2.2 150.3 1.13 2.8 149.35 1 2.3 148.9 1.27 1.7 149.85 2 1.1 151.4 1.37 1.2 151.36 1 2.9 148.4 1.08 2.8 148.76 2 1.8 149.8 1.43 1.6 150.07 1 2.1 149.0 1.04 2.2 148.07 2 1.3 151.9 1.39 1.8 151.18 1 2.3 151.1 1.07 2.7 150.58 2 3.2 152.7 1.12 3.7 152.010 1 5.7 140.1 1.00 6.0 139.710 2 8.9 141.3 1.00 9.1 141.010 3 9.3 140.5 1.00 9.6 140.111 1 2.4 148.1 1.37 2.6 147.911 2 2.2 149.9 1.28 1.9 150.411 3 4.1 148.3 1.03 3.6 149.112 1 1.0 146.7 1.63 1.1 146.512 2 1.6 152.1 1.53 2.2 151.213 1 1.9 151.2 1.43 1.8 151.213 2 2.8 157.6 1.33 2.8 157.618 1 4.3 146.7 1.02 4.1 147.118 2 1.7 149.7 1.250 1.6 149.719 1 1.2 151.5 1.36 0.7 152.319 2 2.5 149.5 1.50 2.4 149.619 3 2.8 149.0 1.25 2.5 149.420 1 0.8 151.4 1.53 1.5 150.320 2 1.4 151.4 1.44 1.9 150.622 1 1.3 157.2 1.47 1.3 156.622 2 0.8 153.9 1.72 0.6 154.323 1 1.7 153.3 1.41 1.8 153.023 2 2.4 152.5 1.32 2.5 152.424 1 1.8 160.4 1.53 1.3 161.224 2 1.2 157.9 1.67 0.8 158.6
Brown & Cross
7
Table 4. Mix Design DataSieve Size
Site Layer AsphaltContent
(%)
VTM(%)
UnitWeight
(pcf)
BlowsPerSide
3/4 1/2 3/8 #4 #8 #16 #30 #50 #100 #200
(Percent Passing)1 1 6.3 6.0 141.1 50 100 97 90 67 56 -- 35 -- 14 6.02 1 5.8 5.4 143.7 50 100 98 93 68 57 -- 34 -- 10 5.03 1 5.4 3.9 145.5 50 100 98 93 70 52 -- 35 -- 7 4.03 2 4.2 -- -- 50 96 78 -- 41 32 -- -- -- -- --4 1 6.0 5.4 144.4 50 100 98 90 68 56 -- 29 -- 11 6.04 2 4.8 3.2 150.5 50 85 68 -- 43 35 -- -- -- -- --5 1 6.2 3.8 145.8 50 100 98 94 68 54 -- 33 -- 13 6.05 2 5.2 3.6 149.8 50 95 70 -- 40 32 -- -- -- -- --6 1 4.8 4.2 146.3 50 100 99 90 60 44 34 25 10 7 5.66 2 5.3 3.2 147.3 50 100 99 84 57 41 32 24 9 6 5.07 1 5.0 4.1 147.2 50 100 99 89 70 58 48 36 18 8 6.07 2 4.8 3.5 148.1 50 100 95 90 67 49 37 28 13 6 4.78 1 4.8 5.4 147.4 50 100 99 88 60 45 36 23 13 8 5.88 2 4.3 6.8 148.3 50 100 98 90 78 61 51 40 26 14 8.610 1 7.0 7.3 135.4 50 100 100 99 73 63 49 33 19 10 2.010 2 6.5 5.9 139.9 50 100 90 84 69 52 33 17 8 5 3.011 1 6.5 4.1 142.7 50 100 100 96 71 53 40 24 16 11 8.011 2 4.4 7.4 142.9 50 100 96 87 67 52 34 24 16 10 6.011 3 3.5 5.1 142.9 50 98 90 84 71 58 41 27 18 12 8.0

Brown & Cross
8
Table 4. Mix Design Data (Continued)Sieve Size
Site Layer AsphaltContent
(%)
VTM(%)
UnitWeight
(pcf)
BlowsPerSide
3/4 1/2 3/8 #4 #8 #16 #30 #50 #100 #200
(Percent Passing)12 1 6.5 3.0 144.3 75 100 100 92 62 42 31 25 17 9 5.012 2 4.8 3.2 150.4 75 77 64 53 37 25 20 18 12 6 4.013 1 6.4 3.1 148.9 75 100 100 92 65 45 26 16 10 9 5.013 2 4.3 3.8 153.2 75 73 63 54 44 30 17 10 7 5 4.018 1 5.8 3.5 147.7 50 100 93 79 53 39 28 22 14 9 6.118 2 5.8 3.5 147.7 50 100 93 79 53 39 28 22 14 9 6.119 1 6.4 3.5 146.3 50 100 88 78 55 38 27 21 14 10 6.219 2 6.0 4.8 145.0 50 100 84 72 54 44 35 28 18 10 5.220 1 5.8 3.6 146.4 50 100 89 75 53 38 28 21 14 10 5.920 2 5.8 3.6 146.4 50 100 89 75 53 38 28 21 14 10 5.922 1 5.8 2.6 152.6 50 100 97 84 55 42 -- -- 19 -- 7.622 2 6.7 2.7 151.1 50 100 98 88 61 46 -- -- 15 -- 6.923 1 5.3 3.5 150.8 50 100 97 81 51 37 -- -- 18 -- 7.923 2 6.0 2.6 150.7 50 99 -- 68 -- 47 -- -- 16 -- 6.924 1 6.7 2.1 159.9 50 100 100 100 99 80 54 36 26 20 15.224 2 4.5 2.4 156.4 50 -- 84 -- 53 40 -- -- 16 -- 9.8
-- = Data not available
Brown & Cross
9
Table 5. Quality Control DataSite Layer Asphalt
ContentAvg (%)
Initial In-Place VTAvg (%)
Initial In-Place Avg
Unit Weight(pcf)
LabCompactedVTM Avg
(%)
LabCompacted
Avg UnitWeight (pcf)
1 1 6.1 --- --- --- ---1 2 --- --- --- --- ---2 1 5.8 --- --- 3.6 ---3 1 5.4 --- --- 4.5 144.93 2 --- --- --- --- ---4 1 6.0 --- --- --- ---4 2 4.8 --- --- ---5 1 6.2 --- --- 3.8 145.15 2 5.2 --- --- --- ---6 1 5.2 8.0 141.6 --- ---6 2 5.3 5.8 144.1 --- ---7 1 5.2 6.9 142.2 --- ---7 2 4.7 6.4 142.7 --- ---8 1 4.8 --- --- --- ---8 2 --- --- --- --- ---10 1 --- --- --- --- ---10 2 --- --- --- --- ---10 3 --- --- --- --- ---11 1 5.5 --- --- 1.3 149.111 2 5.5 --- --- 3.6 147.711 3 --- --- --- --- ---12 1 6.4 4.7 141.4 --- ---12 2 4.7 4.7 149.0 --- ---13 1 6.1 6.1 143.8 --- ---13 2 4.3 4.5 152.1 --- ---18 1 5.8 5.6 144.3 3.53 147.718 2 6.1 5.6 144.3 3.48 147.7019 1 --- 6.7 143.0 --- ---19 2 --- 7.4 142.3 --- ---19 3 --- 7.4 142.3 --- ---20 1 5.7 3.7 146.7 2.56 148.8820 2 5.8 3.7 146.7 2.48 148.6922 1 --- --- --- --- ---22 2 --- --- --- --- ---23 1 --- --- --- --- ---23 2 --- --- --- --- ---24 1 --- --- --- --- ---24 2 --- --- --- --- ---
--- = Data not available

Brown & Cross
10
III.ANALYSIS OF TEST RESULTS
Design of asphalt mixtures by the Marshall method is based on the assumption that thelaboratory compacted test samples will approximate the density of the mixture in service afterseveral years of traffic. If the mix design density is too low, rutting could develop as a result oflow air voids due to pavement densification under traffic. The purpose of this study was toevaluate the physical characteristics of asphalt pavements, mainly density and air voids, duringthe various stages of the pavement’s life and relate these characteristics to rutting. The stagesinvestigated were mix design, construction, after construction and before traffic, after traffic andrecompacted in the laboratory. An attempt was made to relate the rut depth of the pavement tothe density and void properties of the mixtures. However, there is some scatter in the data andthis scatter is caused by several factors. Some of the major factors contributing to the scatter inthe data include the varying amounts of traffic, the different aggregate properties of the mixturesand the temperature of the pavement surface when traffic was first applied. These factors werenot addressed in this report. To help alleviate the problem of different traffic loadings on thevarious layers of pavements, the analysis was performed on mixtures of the same layer in thepavement structure. In addition, only data from original pavement layers or the latest overlayswere utilized in the analysis. This was done to remove the effects of various surface preparationtechniques such as milling prior to overlaying on the relationship between rut depth and mixtureproperties. Open graded friction courses were present on five (Sites 2, 3, 5, 18 & 20) of theeighteen pavements selected for analysis. The friction courses were not evaluated due to theirporous nature and their small effect on rutting.
Air Voids and Rutting
Figure 2 shows the relationship between air voids recompacted to 75 blows per side with themanual Marshall hammer and the total rut depth at the surface expressed as rut depth per squareroot of million equivalent 18-kip single axle loads (ESALs) for the mixtures in layer 1. Ananalysis of rutted pavements has shown that rut depth divided by the square root of millionESA.LS is a good way to quantify rate of rutting. A rate of rutting of less than 2 x 10⁻⁴ inches persquare root of total ESALs has been shown as a good separation between good and poorperforming pavements (8). There is enough scatter in the data to make the correlations poor (R-square = 0.12). However, the correlation does show a trend of lower recompacted air voidsassociated with higher rut depths and higher traffic. The same plot is shown in Figure 3 for thelayer 1 mixtures recompacted on the GTM. The R-square value is nearly identical to the 75 blowsamples and the same trend is evident. It can be seen that the rut depth generally increases with adecrease in recompacted air void content. The relationship between air voids and rutting is welldocumented in the literature (5, 6, 7).
Figures 2 and 3 do show an important relationship between recompacted air void content and theprobability of rutting. For the layer 1 mixtures shown in Figure 2 the chance of having a rate ofrutting greater than 0.20 inches per square root million ESALs is 69% (9 of 13) if the 75 blowrecompacted air voids are 3.0%. Only one of the five sites with air voids above 3.0% had a rateof rutting significantly above 0.2 and this site had a recompacted air void content onIy slightlygreater than 3.0%. The layer 1 mixtures recompacted in the GTM show similar results with 67%(10 of 15) of the sites having rut depths greater than 0.20 inches per square root million ESALswith less than 3.0% air voids and none of the sites with a rate of rutting significantly greater than0.2 with recompacted air voids greater than 3.0%. From this data it can be seen that mixturesshould be designed to have air voids above 3.0% and preferably around 4.0%.

Brown & Cross
11
Figure 3. GTM Recompacted Air Void Content vs.Maximum Surface Rut Depth ÷ Square Root of Traffic
in Million ESALs
Figure 2. 75-Blow Recompacted Air Void Content vs.Maximum Surface Rut Depth ÷ Square Root of Traffic
in Million ESALs

Brown & Cross
12
Pavement Densification and Traffic
Figures 4 and 5 show the relationship between traffic, expressed as total equivalent 18-kip singleaxle loads in millions, and pavement densification expressed as air voids. The air void content isthe 20th percentile in-place air void content of the pavement at the time of sampling. The trafficis the total estimated equivalent 18-kip wheel loads applied to the original pavement or the lastoverlay for overlaid pavements. The figures show a trend for a reduction in air voids, orpavement densification, with an increase in traffic.
A straight line regression analysis was used to deelop the correlations between densification andtraffic. The relationship is poor with an R square of 0.08 for layer 1 and 0.11 for layer 2 (Figure4 & 5). A good correlation however would mean that traffic alone and not mix propertiescontrolled rutting.
Figure 4. Traffic vs. 20th Percentile In-Place Air Void Content for Layer 1Mixtures

Brown & Cross
13
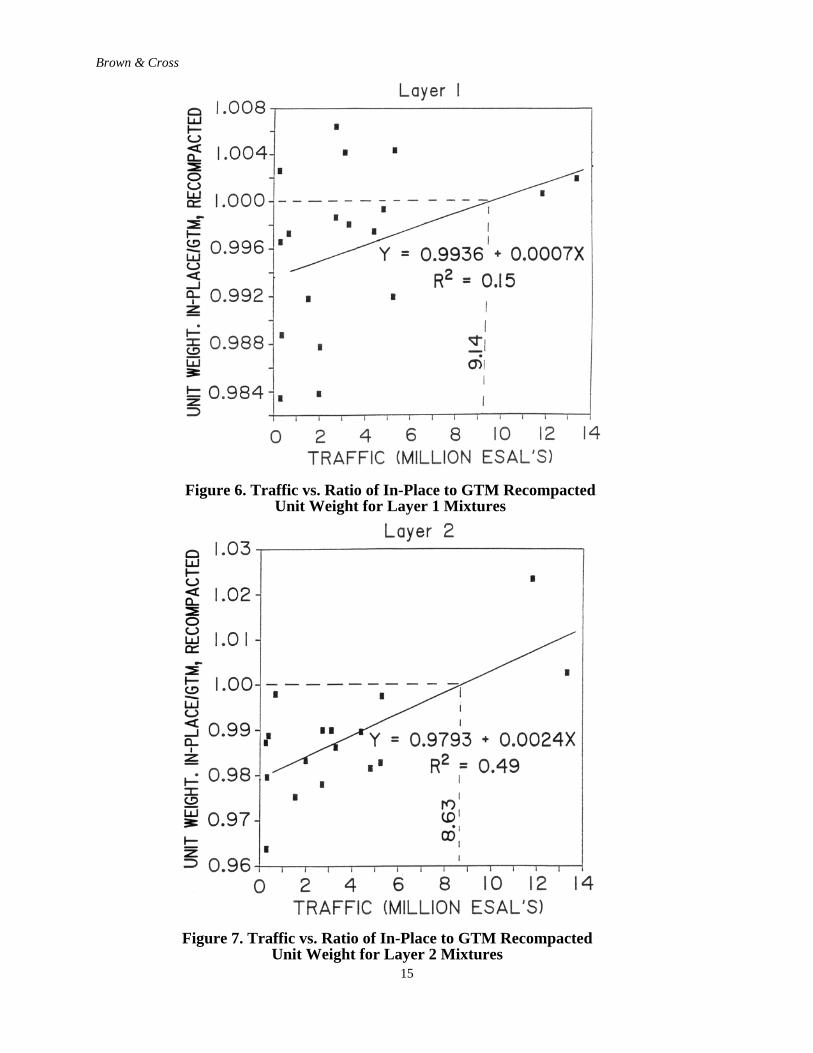
A somewhat more useful methodology for investigating the relationship between traffic andpavement densification is to utilize both the in-place data and the recompaction data. By dividingthe in-place unit weight by the recompacted unit weight an idea of the relative amount ofdensification obtained for a particular mixture can be established. By plotting this value againstthe traffic an estimate of the amount of traffic necessary to reach the recompacted density can bemade. The pavement layers were recompacted using both the GTM and the manual Marshallhammer with 75 blows per side. The data shows that 75-blow compaction (for recompactedsamples) produces a density equal to that expected after 5.4 million ESALs for the top layer andequal to that expected after 6.3 million ESALs for the second layer. The data also shows that theGTM compaction produces a density equal to that expected after 9.1 million ESALs for the toplayer and after 8.63 million ESALs for the second layer. The data for both the GTM and 75-blowrecompacted samples are shown in Table 3 and the results of the plots in Figures 6-9.
Figure 5. Traffic vs. 20th Percentile In-Place Air Void Content for Layer 2Mixtures

Brown & Cross
14
Brown & Cross
15
Figure 6. Traffic vs. Ratio of In-Place to GTM RecompactedUnit Weight for Layer 1 Mixtures
Figure 7. Traffic vs. Ratio of In-Place to GTM RecompactedUnit Weight for Layer 2 Mixtures

Brown & Cross
16
Figure 8. Traffic vs. Ratio of In-Place to 75 Blow RecompactedUnit Weight for Layer 1 Mixtures
Figure 9. Traffic vs. Ratio of In-Place to 75 BlowRecompacted Unit Weight for Layer 2 Mixtures
Brown & Cross
17
Mix Design, In-Place and QC/QA Mix Properties
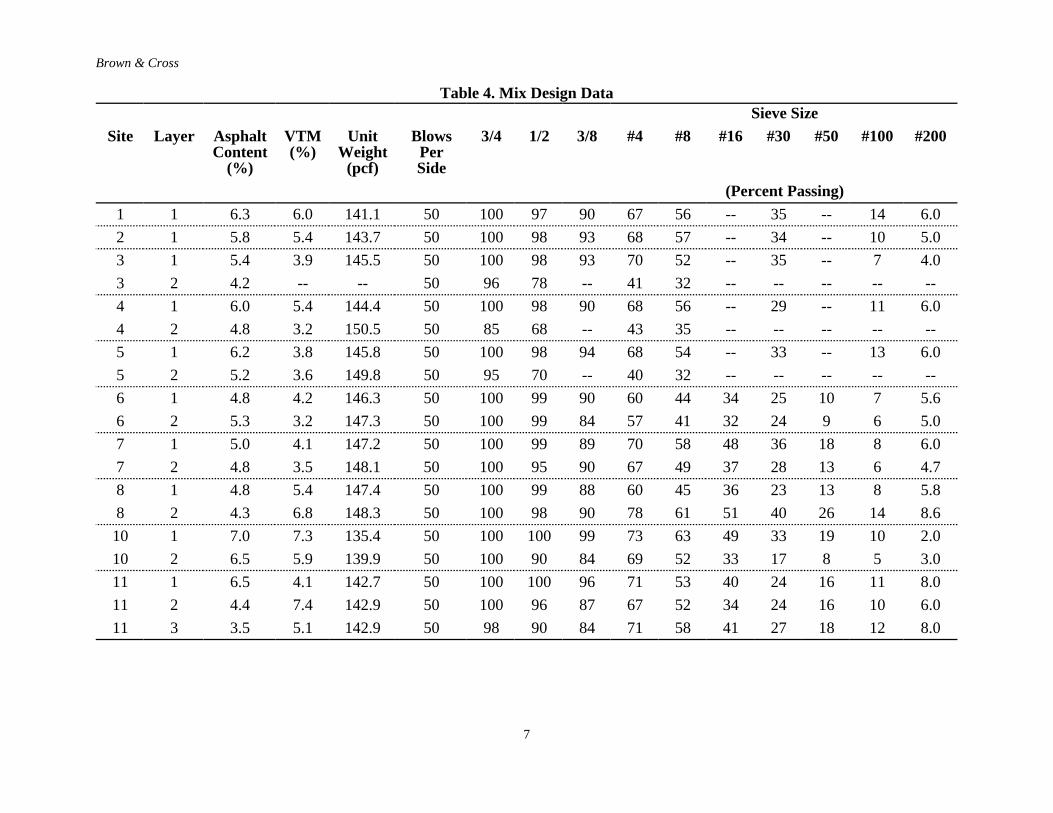
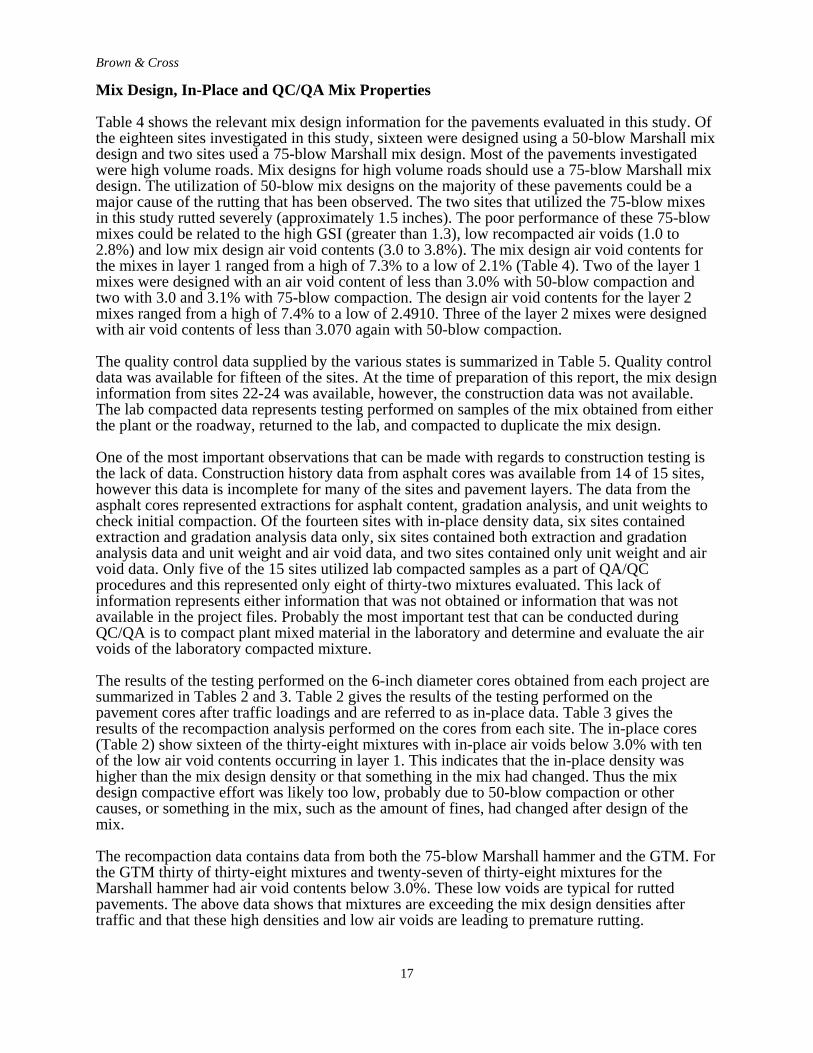
Table 4 shows the relevant mix design information for the pavements evaluated in this study. Ofthe eighteen sites investigated in this study, sixteen were designed using a 50-blow Marshall mixdesign and two sites used a 75-blow Marshall mix design. Most of the pavements investigatedwere high volume roads. Mix designs for high volume roads should use a 75-blow Marshall mixdesign. The utilization of 50-blow mix designs on the majority of these pavements could be amajor cause of the rutting that has been observed. The two sites that utilized the 75-blow mixesin this study rutted severely (approximately 1.5 inches). The poor performance of these 75-blowmixes could be related to the high GSI (greater than 1.3), low recompacted air voids (1.0 to2.8%) and low mix design air void contents (3.0 to 3.8%). The mix design air void contents forthe mixes in layer 1 ranged from a high of 7.3% to a low of 2.1% (Table 4). Two of the layer 1mixes were designed with an air void content of less than 3.0% with 50-blow compaction andtwo with 3.0 and 3.1% with 75-blow compaction. The design air void contents for the layer 2mixes ranged from a high of 7.4% to a low of 2.4910. Three of the layer 2 mixes were designedwith air void contents of less than 3.070 again with 50-blow compaction.
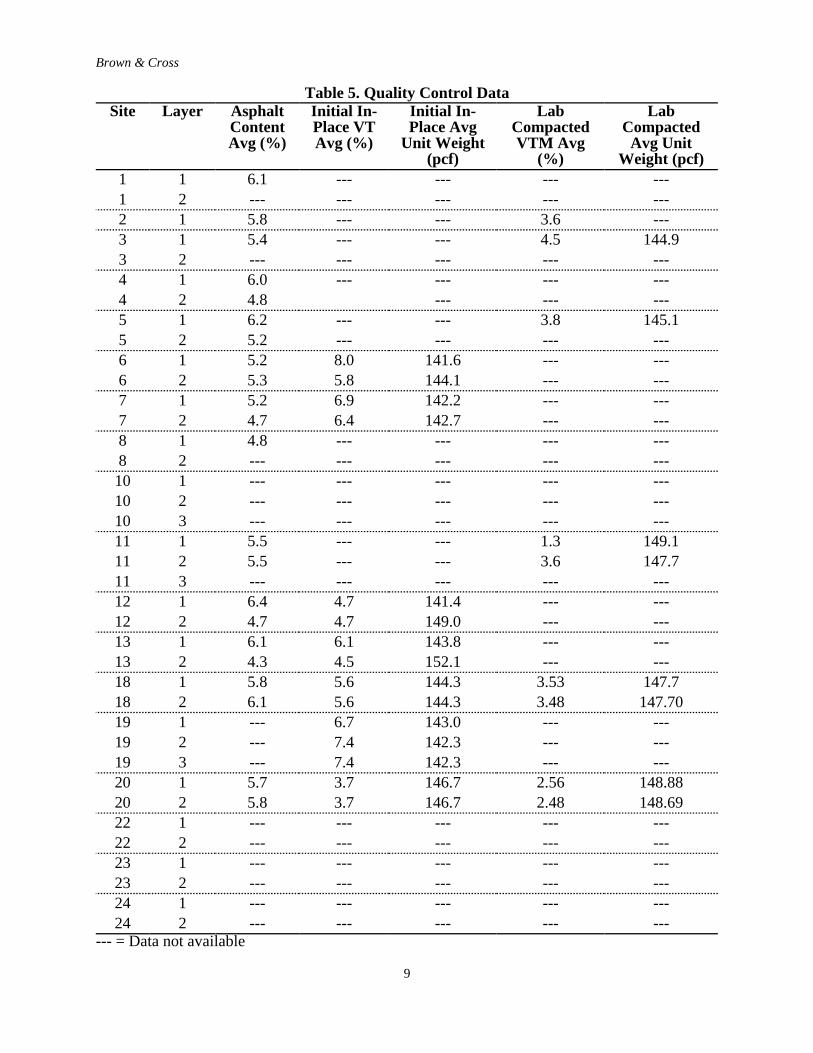
The quality control data supplied by the various states is summarized in Table 5. Quality controldata was available for fifteen of the sites. At the time of preparation of this report, the mix designinformation from sites 22-24 was available, however, the construction data was not available.The lab compacted data represents testing performed on samples of the mix obtained from eitherthe plant or the roadway, returned to the lab, and compacted to duplicate the mix design.
One of the most important observations that can be made with regards to construction testing isthe lack of data. Construction history data from asphalt cores was available from 14 of 15 sites,however this data is incomplete for many of the sites and pavement layers. The data from theasphalt cores represented extractions for asphalt content, gradation analysis, and unit weights tocheck initial compaction. Of the fourteen sites with in-place density data, six sites containedextraction and gradation analysis data only, six sites contained both extraction and gradationanalysis data and unit weight and air void data, and two sites contained only unit weight and airvoid data. Only five of the 15 sites utilized lab compacted samples as a part of QA/QCprocedures and this represented only eight of thirty-two mixtures evaluated. This lack ofinformation represents either information that was not obtained or information that was notavailable in the project files. Probably the most important test that can be conducted duringQC/QA is to compact plant mixed material in the laboratory and determine and evaluate the airvoids of the laboratory compacted mixture.
The results of the testing performed on the 6-inch diameter cores obtained from each project aresummarized in Tables 2 and 3. Table 2 gives the results of the testing performed on thepavement cores after traffic loadings and are referred to as in-place data. Table 3 gives theresults of the recompaction analysis performed on the cores from each site. The in-place cores(Table 2) show sixteen of the thirty-eight mixtures with in-place air voids below 3.0% with tenof the low air void contents occurring in layer 1. This indicates that the in-place density washigher than the mix design density or that something in the mix had changed. Thus the mixdesign compactive effort was likely too low, probably due to 50-blow compaction or othercauses, or something in the mix, such as the amount of fines, had changed after design of themix.
The recompaction data contains data from both the 75-blow Marshall hammer and the GTM. Forthe GTM thirty of thirty-eight mixtures and twenty-seven of thirty-eight mixtures for theMarshall hammer had air void contents below 3.0%. These low voids are typical for ruttedpavements. The above data shows that mixtures are exceeding the mix design densities aftertraffic and that these high densities and low air voids are leading to premature rutting.

Brown & Cross
18
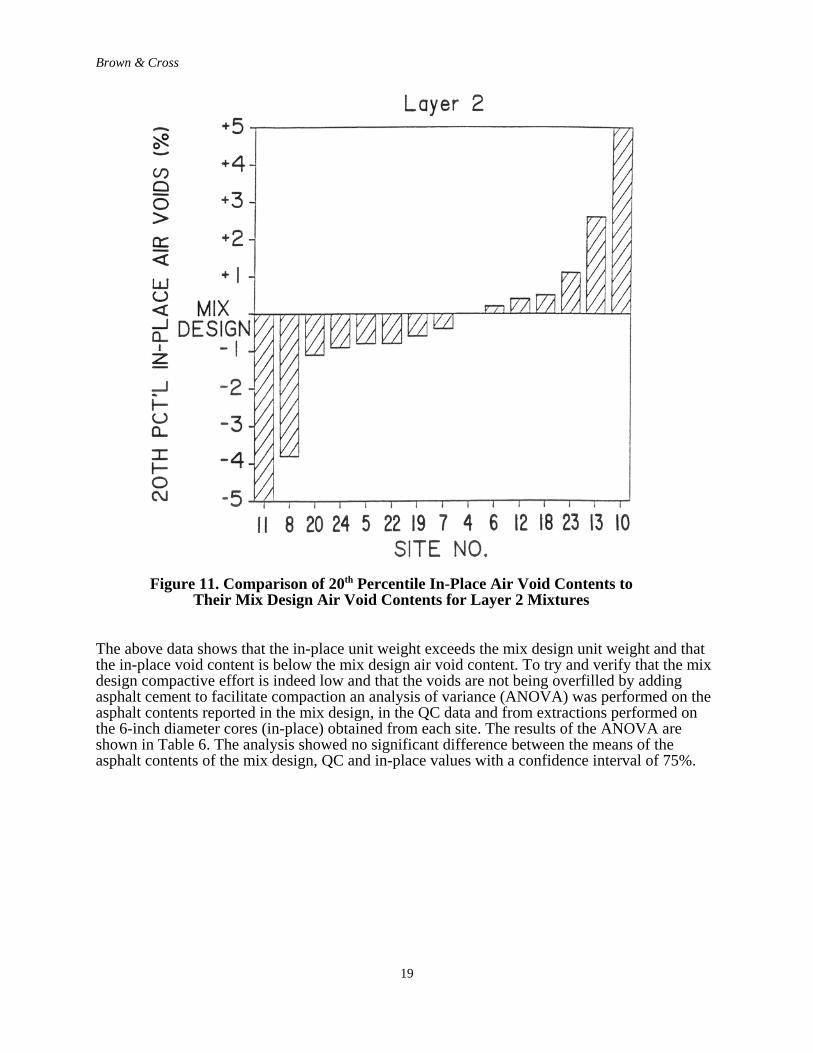
The differences between the in-place air void contents at the 20th percentile and the mix designair void content are shown in Figures 10 and 11 for layers 1 and 2 respectively. Fourteen of 18mixtures or 78% for layer 1 and eight of fifteen or 53 $Z for layer 2 of the mixtures showed thein-place air void content to be lower than the mix design air void content. The same was true forthe unit weight at the 80th percentile (Figures 12 and 13), with 7890 of the mixtures from layer 1and 53% of the mixtures from layer 2 exceeding the mix design unit weight. This indicates thatthe mix design compactive effort, especially for the near surface mixtures, is too low for thecurrent level of traffic. In many cases the in-place air voids are 1 to 3 percent lower than the mixdesign air voids. Since mixes are typically designed to have 4% air voids and rutting is expectedto be a problem at 3% air voids these lower in-place air voids are a major problem.
Figure 10. Comparison of 20th Percentile In-Place Air Void Contentsto Their Mix Design Air Void Contents for Layer 1 Mixtures
Brown & Cross
19
The above data shows that the in-place unit weight exceeds the mix design unit weight and thatthe in-place void content is below the mix design air void content. To try and verify that the mixdesign compactive effort is indeed low and that the voids are not being overfilled by addingasphalt cement to facilitate compaction an analysis of variance (ANOVA) was performed on theasphalt contents reported in the mix design, in the QC data and from extractions performed onthe 6-inch diameter cores (in-place) obtained from each site. The results of the ANOVA areshown in Table 6. The analysis showed no significant difference between the means of theasphalt contents of the mix design, QC and in-place values with a confidence interval of 75%.
Figure 11. Comparison of 20th Percentile In-Place Air Void Contents toTheir Mix Design Air Void Contents for Layer 2 Mixtures

Brown & Cross
20
Figure 12. Comparison of 80th Percentile Unit Weight toTheir Mix Design Unit Weights for Layer 1 Mixtures
Figure 13. Comparison of 80th Percentile Unit Weight toTheir Mix Design Unit Weights for Layer 2 Mixtures

Brown & Cross
21
Table 6. Results of One-Way ANOVA on Asphalt ContentSource Degrees of
FreedomSum of Squares Mean Squares F-value
Total 93 13.0462 --- ---Model 2 0.5790 0.2895 2.11Error 91 12.4672 0.1370 ---
To statistically show that the mix design density is being exceeded by the in-place density anANOVA was performed on the unit weights obtained from the mix design, the in-place data andthe recompaction (GTM and 75 Blow) data. The results are shown in Table 7. The analysis ofvariance showed a significant difference at the 95% confidence level in the means of the unitweights from the above data sets. Duncan’s multiple range test was performed with alpha = 0.05to determine the rank and significant differences between the means. Duncan’s test ranked themeans from highest to lowest as GTM, 75 Blow, in-place after traffic, and mix design with asignificant difference between each group of means except GTM and 75 Blow recompacted.
Table 7. Results of One-Way Anova on Unit WeightSource Degrees of
FreedomSum of Squares Mean Squares F-value
Total 145 476.9889 — ---Model 3 213.3884 71.1295 38.32Error 142 263.6005 1.8563 ---Duncan's Multiple Range Test
Model Duncan's*Grouping
Mean NumberObservations
GTM A 1.186 3775 Blow A 0.881 37In-Place B -0.241 37Mix Design C -1.931 35
*Means with the Same Letter Are Not Significantly Different.
The difference between the initial in-place air void content and the mix design air void contentsfor layers 1 and 2 are shown in Figures 14 and 15. All of the initial in-place air void contentswere above the mix design void content as they should be. However, site 20 indicates the initialin-place density to be very close to the mix design density which results in low in-place air voidsafter traffic. Figure 16 shows that for site 20 the in-place air voids after traffic is indeedapproximately 2% lower than the mix design value. The rut depth at site 20 was only 5/16 inchand this low rut depth is due in part to the low level of traffic (0.38 million ESALs). Figure 16shows the results of the limited data available on the QC lab compacted samples. Five of the ninemixtures had air void contents significantly below the mix design value and four of the mixtureswere within 0.5% of the mix design air void content. With this information it can be seen thatfive of the mixtures should have been modified to raise the air void content to minimize rutting.

Brown & Cross
22
Figure 14. Comparison of Quality Control Air VoidContents Obtained Prior to Traffic to Their Mix Design Air
Void Contents for Layer 1 Mixtures
Figure 15. Comparison of Quality Control Air VoidContents Obtained Prior to Traffic to Their Mix Design
Air Void Contents for Layer 2 Mixtures

Brown & Cross
23
IV. CONCLUSIONS
Based on the data obtained in this study the following conclusions are warranted.1. In-place air void contents above 3.0% are needed to decrease the probability of
premature rutting throughout the life of the pavement. The voids in laboratorycompacted samples are used to estimate the ultimate void content of the mixture.
2. In-place air void content below 3.0% greatly increases the probability of prematurerutting.
3. Compaction utilizing the GTM set at 120 psi, 1 degree angle and 300 revoultionsgives sufficient design density and void content for up to 9 million ESALs.
4. Compaction utilizing 75 blows per side with the manual Marshall hammer givessufficient design density and void content for up to 6 million ESALs.
5. Construction quality control documentation is not adequate on many paving projects.Samples of asphalt mixtures from the mixing plant should be compacted in thelaboratory during construction to verify that the air voids are within an acceptablerange. If the air voids are not within an acceptable range adjustments to the mixshould be made.
6. Most of the pavements evaluated in this study utilized a 50-blow Marshall mixdesign. Mixtures to be exposed to high traffic volumes should utilize a 75-blowMarshall mix design to insure adequate voids throughout the life of the pavement.
7. The in-place unit weight of the pavement after traffic usually exceeded the mixdesign unit weight resulting in low air voids and hence premature rutting.
Figure 16. Comparison of Laboratory Compacted Air VoidContents to Their Mix Design Air Void Contents

Brown & Cross
24
V. RECOMMENDATIONS
Based on the data obtained horn this study the following recommendations are made.1. Samples of the field produced mixture should be compacted using the specified mix
design compactive effort to ensure that the mix being produced has acceptable airvoids and other properties. If there is a significant difference between the fieldproduced samples and the mix design modifications to the field produced mix mustbe made.
2. Efforts must be made to ensure the mix design produces a density approximatelyequal to the in-place density after several years of traffic. The results of this studyshow that this is not the case. For heavy duty pavements with significant truck trafficsuch as most Interstate highways it is recommended that either a 75-blow Marshallmix design or the GTM be utilized. For the Marshall mix design compaction shouldbe performed with either the manual Marshall hammer or another hammer calibratedto give the same density as the manual hammer.
3. Pavements should be designed to ensure 4.0% air voids in-place after several years oftraffic to help prevent premature rutting. Mixes with design air voids much less than4.0% are likely to rut.
VI. REFERENCES
1. Mix Design Methods for Asphalt Concrete, Manual Series No. 2, printed March 1974.2. McFadden, Gayle and W. C. Ricketts, “Design and Control of Asphalt Paving Mixtures
for Military Installations,” Proceedings, The Association of Asphalt PavingTechnologists, Volume 17, 1948, pp. 93-113.
3. Hudson, Stewart W. and Stephen B. Seeds, “Evaluation of Increased Pavement Loadingand Tire Pressure,” Paper presented at 67th Annual Transportation Research BoardMeeting, January 1988.
4. Federal Highway Administration, “Proceedings of a Symposium/Workshop on HighPressure Truck Tires,” Austin, Texas, 1987.
5. Brown, E.R. and Stephen A. Cross, “A Study of In-Place Rutting of AsphaltPavements,”Proceedings, The Association of Asphalt Paving Technologists, Volume 58,1988.
6. Huber, G.A. and G.H. Heiman, “Effect of Asphalt Concrete Parameter on RuttingPerformance: A Field Investigation,” Proceedings, The Association of Asphalt PavingTechnologists, Volume 56, 1987, pp. 33-61.
7. Ford, Miller C. “Pavement Densification Related to Asphalt Mix Characteristics,” Paperpresented at 67th Annual Transportation Research Board Meeting, January 1988.
8. Parker, Frazier, Jr. and E. R. Brown, “Effects of Aggregate Properties on FlexiblePavement Rutting in Alabama,” Paper prepared for presentation at 70th AnnualTransportation Research Board Meeting, January 1991.