comparison of measured data with standards (revised)
TRANSCRIPT

1
Lightning Protection of Wind Turbines – A Comparison Of Measured Data
With Required Protection Levels
V Peesapati, I Cotton Electrical & Electronic
Engineering
University of Manchester
PO Box 88
Manchester
M60 1QD
Vidyadhar.peesapati-
uk
uk
T Sorensen DONG Energy
A.C. Meyersvaenge 9
DK2450 Copenhagen SV
Denmark
Nikolaos Kokkinos Elemko SA
90 Tatoiou Street
14452 Metamorphosis
Greece
T Krogh For Siemens
Wind Power
Electricon A/S
Birk Centerpark 40
DK7400 Herning
Denmark
1 Abstract
Latest wind turbine lightning protection systems have been refined to the point where lightning
damage is now relatively rare. This is increasingly important as wind turbines move offshore where
access for maintenance is more difficult than for most land based wind farms. Manufacturers have
been trying to make sure that the lightning protection systems they install comply with the highest
protection levels stipulated in the relevant IEC standards. In this paper, data from the Nysted
Offshore Wind farm in Denmark and that from a large number of other wind turbines worldwide is
reviewed to show the range of lightning currents that have been measured on wind turbines
currently in operation. These current values are compared with the required protection levels within
the standards.
2 Introduction
Since their first introduction for generating electricity in the early 1900’s, wind power has increased
and become one of the major options for renewable energy. According to the Global Wind Energy
Council, the total installed capacity of wind power around the world reached a massive 60000MW
at the end of 2005, a 12 fold increase, in comparison to 1995 [1]. By the end of 2008 this number
has reached a massive 120 Giga Watts [2]. Wind turbines continue to increase in size and at the

2
same time are being moved offshore as availability of suitable on-shore sites and the related
planning constraints reduce the potential number of onshore projects. Both these factors pose a
significant risk in the increase of lightning strikes and attachment to the wind turbines [3, 4].
However, it is difficult to quantify which as while it is certain that larger wind turbines have a
higher probability of being struck by lightning, the combined effect of increased height and an
offshore location has not been widely studied.
Before discussing about the lightning protection system on wind turbines, the phenomena of
lightning and its characteristics are discussed in relation to wind turbines.
2.1 Lightning
Lightning is an atmospheric discharge of current. The highest recorded value of lightning current is
around 300kA [5]. However, this value is very rarely seen, the median (for a downward negative
stroke) being about 30kA with the median values of charge transfer and specific energy being 5.2C
and 55kJ/Ω respectively [6, 7]. The visible part of the lightning strike process, whether lightning
strikes the ground or not, is termed as a “lightning flash”. The individual components of this
lightning flash are defined as strokes. Lightning can be classified into two main types, downward
and upward initiated. These are also known by the names, cloud-to-ground and ground-to-cloud
lightning, respectively. These two forms of lightning can be further subdivided into positive and
negative polarity, the polarity being that of the charge transferred from the cloud to the ground.
2.1.1 Downward Initiated Lightning
Downward initiated lightning starts from the cloud with a stepped leader moving towards the earth.
The end of the leader, the leader tip, is in excess of 10MV with respect to the earth [8]. As the tip
gets near to the earth, it raises the electric field strength at the surface of the earth. Where this field
is elevated significantly, typically around sharp and/or tall objects, upward connecting leaders are

3
emitted and travel towards the downward propagating leader. When an upward connecting leader
and stepped leader meet, this completes the channel or path from the cloud to earth, thus allowing
the charge in the cloud to travel through the ionised channel. This is the first return stroke, and has a
peak value of upto a few hundred kilo amps and a typical duration of a few hundred microseconds.
After a certain time interval, further strokes may follow the already ionised path and are known as
subsequent return strokes (Figure 1). On average, a negative downward lighting flash may contain 2
to 3 subsequent return strokes. Positive downward flashes (only 10% of those observed worldwide)
are higher in magnitude but typically contain no subsequent strokes.
2.1.2 Upward Initiated Lightning
The presence of tall structures and objects brings rise to another form of lightning, which is upward
initiated. Tall structures enhance the electric field produced by the thundercloud and thereby give
rise to upward propagating leaders that move towards the cloud and which then develop into a
lightning flash when reaching charges situated in the cloud. This phenomenon is particularly
common where the cloud height is quite low (often during winter months in coastal areas or in
mountainous regions). The profile of the typical channel base current associated with an upward
discharge (Figure 2) is different as compared to that of a downward initiated discharge (Figure 1).
An upward initiated lightning starts with a continuing current phase on which may be superimposed
short duration high magnitude current pulses. Though the current values are quite low at around
10kA [8] as compared to downward lightning, the charge transfer associated with the continuing
current phase can be quite high. The initial continuing current in upward initiated lightning may be
followed by a number of return strokes that are similar to those observed in a negative downward
lightning flash.
3 Lightning and Wind Turbines
4
The high peak currents carried by lightning strikes are a source of significant energy. Also the
continuing current in the case of upward lightning is a source of high energy content. If a lightning
protection system does not divert this lightning current safely to ground through a low impedance
path, significant damage can result. Lightning can also damage equipment through the production
of large induced voltages/currents as a result of the high levels of electromagnetic field produced
during a lightning strike. Examples of surveys of wind turbine damage can be found in [3, 8, 9].
According to [3], based on data taken from the WMEP database of ISET, during a period of seven
years, 739 wind turbines had been damaged by lightning, and there were 1032 faults reported due to
these events. This shows that for each lightning damage event, there is a possibility of more than
one fault. According to this study 30% of the faults involved the control systems, 26.3% the
electrical system and 19.9% the blades. Recent studies [10] showed that the rotation of the blades
may have a considerable influence in the number of strikes attaching the wind turbine. The rotating
blades are said to initiate their own lightning. Also according to [8], old wind turbines frequently
experienced damage to the control system, while new wind turbines experience damage to the
blades relatively more often. This change could be due to a combination of improved transient
protection of control system and the increase in the size of wind turbines
Such studies, retrospective by their nature, must be treated with some caution in terms of their
application to future designs of wind turbine. New projects such as FINO 3 are now trying to
establish the risks involved in installing large wind farms offshore, with special importance given to
lightning. More information about this is available in [11, 12].
Due to the risk of damage and possible downtime due to lightning strikes, all new wind turbines are
equipped with different lightning protection systems. [8] Provides guidance on how to achieve this.
The main functions of the lightning protection are

5
� Successful attachment/formation of the lightning strike to a preferred attachment point such as
the air termination system on the blade
� The successful passage of the lightning current through the system into the earth without
causing damage to systems including that damage that would result from high levels of electric
and magnetic field
� Minimising levels of voltages and voltage gradients observed in and around the wind turbine
These functions can be achieved by a number of different methods. These methods have changed
and improved with the development of new wind turbines.
The different types of lightning protection installed in wind turbines blades are [8]
i. Air termination systems on the blade surfaces
ii. High resistive tapes and diverters
iii. Down conductors placed inside the blade
iv. Conducting materials for the blade surface
In all types of LPS, the metallic air terminations, strips and diverters and down conductors should
be of sufficient cross sections that they safely conduct the lightning current without any physical
damage. Where the conductors have been placed on the blade surface, issues have been raised that
these compromise the aerodynamics of the blade and also contribute to undesirable noise [8]. High
resistive tapes and diverters have been used on lightning protection of aircraft wings and radomes.
These could be a good solution for rotor blades in operation and have no lightning protection
system installed. Diverter strips can be easily installed on rotor blades already in service. Though
this system does have its advantages, it is not as structurally binding than the other systems and in
one case they were noted to peel off after a few months in service [8]
6
A system that is widely used is the internal lightning protection system consisting of an internal
lightning down conductor capable of carrying the lightning current. Metal receptors (figure 3)
which act as air terminations penetrate the blade surface and are then connected to the down
conductor. This system of external receptors connected to an internal downconductor is being
widely used for blades upto 60m [8] and this system does not look likely to be changed for longer
future blades. According to [13] rotor blades with built in conductors are far less likely to
experience extensive damage as compared to those without.
The number of receptors on each blade depends on manufacturers. Some blades are designed with a
limited number of receptors at different lengths of the blade and some of them have these receptors
equally spaced till the root tip. The blade tip receptor is said to be the one which is hit by most
lightning strikes [14]. Numerical models have shown that the blade tips are the most exposed part of
the turbine [15]. The maximum electric field seen on the blade depends on its position and in most
cases is on the tip of the blade [16].
Current lightning protection systems for rotor blades are designed to withstand 98% of lightning
strikes [3] but there is still a risk of damage, particularly at the attachment point. Lightning can
damage the blades in many ways. Some of these are highlighted below,
• There is a high risk of the lightning penetrating the surface on polluted blades due to water
ingress, moisture etc.
• Surface discharges could damage the blade surface, and over time cause weak points for
possible electrical breakdown of the blade laminate.
• Internal discharges inside the blade due to the field enhancement on the down conductor could
cause damage over prolonged periods.

7
More information regarding the types of lightning damage that have been observed in wind turbines
and the types of lab tests that can be used to verify/understand lightning protection performance is
available in [3, 17, 18].
Though the blades are at higher risk of lightning attachment than other components, there still exists
a possibility of the lightning flash attaching to those other components. The wind sensors (i.e. wind
vane / anemometry equipment) and any aircraft warning lights are prone to lightning strikes. To
protect the wind sensors and the aircraft warning lights separate lightning rods are typically used.
4 Lightning Data Sources
The data reviewed in this paper comes from two specific sources. The first is the Nysted Offshore
Wind farm. The wind farm consists of 72 wind turbines placed in eight rows of nine wind turbines
each. Each wind turbine is 110m high from the mean sea level to the tip of the blade (when in a
vertical position). The distance between wind turbines in the rows is 500 m and the distances
between the rows is 850m. The data has been collected over a period of over three years, the oldest
lightning strike record being in June 2003 with the last reading analysed being from in October
2006. This is an equivalent of 216 turbine years. It must be noted that the equivalent turbine years
calculated for the turbines present in the Nysted wind farm should not be compared to data collected
from an equal number of wind turbines present in different locations of the world. The data thus
collected at the offshore wind farm will shed light on the local lightning phenomenon only.
Data at this wind farm is collected in two ways. The first measurement system is the active Jomitek
system. This consists of two antennas which are placed on opposite sides of the tower [19, 20]. In
the event of a lightning strike to the wind turbine, the lightning current flow induces a voltage into
the antennae system as a result of the rate of change of magnetic field around the tower. Lightning

8
strikes away from the wind turbine are discriminated against by adding the outputs of the antennae
together. The Jomitek system has a simple analog trigger level which at Nysted Offshore Wind
Farm is set to 1 kA peak. The output of this measurement system is connected to the turbine
SCADA system. In the event of the system being triggered, an alarm is raised but no data regarding
the possible magnitude of the lightning current is obtained. For this reason, peak current sensor
(PCS) cards manufactured by OBO Bettermann are placed on the down-conductor of each of the
blades and of the air terminals protecting the aviation lights and the wind-vane. These cards have a
magnetic strip imprinted with a pre-defined signal. When placed near a down conductor, the
magnetic field resulting from the flow of lightning current erases a portion of this magnetic strip
and by the use of a card reader, the current that the card has observed can be found [21]. Once the
Jomitek system has been triggered, it is possible to go to the wind turbine to remove the PCS cards
and therefore gain knowledge of the lightning strike magnitude along with the component struck.
Such data is probably as best as can be achieved using the lightning monitoring systems available at
present but there remain limitations and difficulties in sorting the data:
• The error margin on the PCS cards means that they fail to record small peak currents (lower
than around 5kA according to the manufacturer’s specification) [22]. In 25% of cases when the
Jomitek system was triggered, no readings were observed on the cards. This either means the
lightning current amplitude has been too small to be detected by the PCS system or the Jomitek
system has falsely registered a lightning strike. There is also a possibility that these strikes could
have attached to other parts of the wind turbine where no lightning card has been fitted.
• In 50.8% of cases when readings were observed on the PCS cards, the Jomitek system was not
triggered. The significance of this data is limited since all cards are also changed during the
summer maintenance cycles when no corresponding Jomitek reading would be available

9
• The PCS cards are capable of only recording one peak current (the highest observed) and if
multiple attachments are experienced by a component, it is not possible to determine the number
of strikes or which strike had the higher peak current. In Nysted Offshore Wind Farm the
service instruction was to send a service boat to wind turbines to inspect and exchange PCS
cards as soon as practically possible after a lighting alarm had been received from the Jomitek
system. Usually the PCS cards were exchanged within few days, and hence the likelihood of
multiple lightning flashes being recorded on a PCS card is small.
• The system cannot determine if one component of the wind turbine was hit before another. For
example, did the initial stroke go to a blade tip and then a subsequent stroke to another
component?
The second data set that has been analysed comes from windfarms all over the world. The database
contains records of over a 450 wind turbines recorded over a span of 7 years. However, no active
alarm systems are fitted to these wind turbines, only PCS cards. In addition to the limitations
regarding the PCS cards for the Nysted case, this means that between the installation and
replacement date of the cards (typically between 5 to 6 months) they could have been exposed to
more than one lightning strike. They would not record all of these due to their inherent character of
just being able to record the highest peak current.
5 Data Analysis
5.1 Nysted Offshore Windfarm
The data from the Nysted windfarm is firstly examined by showing the components of the wind
turbine on which the PCS cards indicated current readings following an alarm. Multiple
registrations were present on a number of occasions. The data in Figure 4 shows that the wind vane

10
and aviation lights cards PCS cards (actually fitted onto the lightning protection rods of these
components) detected lightning current flowing through these components regularly. This result
could be perceived as being in contrast to the work by a number of other researchers who suggest
that the blades are the parts of a wind turbine that are most likely to be hit by lightning. [3, 8, 9, 13,
23]. However as most wind turbines are not equipped with PCS cards, and those who are then
mainly in the blades, there are for most wind turbines simply no effective registration of lightning
strikes elsewhere but the blades.
Multiple registrations on different components for a single lightning strike could be accounted for
by the following.
Firstly, there is likelihood of increased lightning strikes to the windvane when the case of upward
propagated lightning is considered. The production of upward initiated lightning initially depends
on a given level of electric field enhancement existing around a component such as the windvane /
blade and also their position [24]. As a downward leader is not involved, this will purely depend on
the overall geometry of the structure.
Secondly, it is possible that upward leaders forming from the wind turbine in the presence of a
downward leader result in the passage of currents through the wind turbine down-conductor
systems. A typical leader would contain some 45μC of charge per metre [25]. With a typical
propagation speed of 1.5cm/μs, this would correlate to an average current requirement of 0.68A for
propagation. A sudden collapse in the leader due to a nearby lightning strike / change in electric
field could cause higher currents to flow. To produce a current of 5kA, a 100m upward leader
would need to collapse in around 1μs (equivalent to 1/3rd the speed of light).
The hypothesis of upward lightning being a major contributor to the lightning strike rate is
strengthened when the distribution of lightning strikes by month is examined. The data shown in
Figure 5 gives the peak current read from the each PCS cards due to an event detected by the active

11
alarm system by date. In total, 33 out of 51 lightning events occurred during the winter months.
This shows that winter lightning is a significant phenomena even in Denmark which is not in an
area particularly prone to winter lightning.
In areas prone to winter lightning, the following has been shown to be observed:
• The incidence of lightning strikes to tall structures during winter is greater relative to that during
summer [5].
• A large percentage of these lightning strikes, up to 98% are upward propagating (it is noted that
any significantly tall structure in any season is likely to receive mainly upward propagating
lightning). Even on flat terrain and for objects of moderate height, there is a large number of
upward strikes [5] [26].
• Winter lightning simultaneously strikes more than one tower within a lightning flash. The
probability of occurrence of these simultaneous strokes to multiple points was up to 20% in the
studies detailed in [26].
Examining the data regarding the probabilistic distribution of lightning current values also yields
some interesting findings. This data is shown in Figure 6. As would be expected, the blades are
shown to capture lightning strokes with the higher peak currents. This is something predicted by the
typical downward lightning attachment models such as the electro geometric model [27]. However,
in all cases, the mean value of the peak currents lies between 6-8 kA, much less than the mean
values of the first return and the subsequent strokes defined in the literature for downward strokes
[28]. It must be noted that the electro geometrical model is based on the downward leader attaching
to a point on the structure once it enters within the striking zone. The striking zone is determined
using the peak current distribution of the lightning strikes observed in the area where the structure is
installed. The large drawback of this model comes with its inability to take into consideration

12
upward initiated lightning. Tall structures are known to initiate upward lightning and not taking this
into consideration could lead to major variations in risk calculations.
These small values could be explained by the two options previously stated, i.e. the possible
prevalence of upward lightning or the measurement of current produced during leader growth and
collapse. A third option is also possible, namely that the standard distribution of lightning strike
currents as used by the IEC standards is conservative. The distribution used in the IEC standards is
based on measurements carried out by Berger Mont San Salvatore (Switzerland), and further
analysed by Kroninger H, Anderson R.B and Eriksson A.J [6, 7, 29] The measurements were done
using two towers each 70m high and separated 400m apart. The peak of Mont San Salvatore is
915m above sea level [6]. This site was prone to upward and downward lightning as of recorded
over an 8 year period [6], 129 of these have been identified as downward propagating (these being
used to formulate the IEC lightning current distributions). The question that arises here is how
relevant it is to base the general lightning parameters used for design of lightning protection
systems on (particularly in the case of downward lightning) a small data-set that has been gathered
from a mountain which evidently is prone to a large number of strikes the nature of which appear to
be strongly influenced by the mountain site itself.
The final analysis of data in relation to the Nysted windfarm relates to the lightning strike frequency
and to the distribution of lightning strikes within the windfarm. A widely used equation 1 for
calculating the annual lightning incidence N (per year) to ground based objects was derived by [30]
where H is the Height of the structure in question.
6 2.0524 10s g
N H N−
= ×
Equation 1: Annual Lightning Incidence N

13
Using a ground flash density between 0.2 and 0.3km-2 yr-1, according to this number each turbine
should have experienced between 0.07 and 0.11 lightning flashes per year. With 72 wind turbines
the theoretical value of the number of flashes that the entire farm should experience is between 5.3
and 7.9 yr-1.
The number of flashes that the windfarm actually sees can be estimated in a number of ways. If the
alarm events with a related PCS registration are considered as a flash then there are 127 recordings
of current in a three year period, i.e. 42.3 recordings an year, almost six times as much of the
highest theoretical value.
If all the PCS registrations were taken into consideration, assuming that each of these registrations
relates to a stroke, there were a total of 398 recordings. This equates to a total number of flashes
between 398 (i.e. all strokes in a single lightning flash go to one attachment point) and 133 (where
with an average of 3 strokes per flash each stroke attaches to a different location – something that is
possible but is accepted not to be probable).
This can be compared with 166 alarm events (including those without a corresponding PCS card
registration). If each of these alarms is to be considered as a flash, the value is within the region
(133-398) of the number of flashes calculated from the total PCS card registrations.
The distribution of these lightning flashes within the windfarm can also be examined. There are a
total of 72 wind turbines present in the offshore windfarm, arranged in 8 rows of 9 turbines each.
The outside perimeter consists of 30 turbines (42%), leaving 42 turbines inside. The number of
recordings on the PCS cards (excluding multiple registrations on different cards on each turbine
itself) that the total wind farm has experienced is 127. Out of these 127 strikes, 54 (42%) attached to
a wind turbine on the perimeter while the remaining 73 strikes affected a turbine inside the

14
perimeter. The lightning incidence to turbines on the perimeter is therefore similar to that within the
perimeter.
If the farm is divided into eastern and western sides, then the eastern side of the array experiences
61 strikes while the western side of the array experiences 66 based on PCS card data. If only those
alarm notifications with a corresponding PCS card registration are taken into consideration, then the
western side of the farm experiences 37 strikes while the eastern side experiences only 24 strikes.
This data suggests no significant correlation between wind turbine position and lightning risk. If the
data relating to blade strikes only is examined, similar figures are found.
In summary, the lightning data from the offshore windfarm has shown:
a. All components (i.e. blades, windvane and aviation lights) are affected by lightning. This would
suggest that models predicting lightning strike attachment points need refinement.
b. There is a very low average lightning current level detected by the PCS cards. This would again
be explained by false readings of the PCS cards, which will be discussed later sections, or by a high
probability of upward lightning strikes or leaders.
c. The windfarm is particularly exposed to lightning in the winter months.
d. The fact that the windfarm is experiencing lightning strikes six times as high as the theoretical
calculations.
e. Lightning flashes appear to strike evenly across the wind farm.
5.2 Worldwide Wind Turbine Records
The second data set that has been analysed comes from wind farms all over the world. The database
contains records of over 450 wind turbines, and their lightning registrations over a 6 year period

15
(2000 – 06). However, no alarm systems are fitted to these wind turbines and for this reason, any
registration on the PCS cards must be taken as a lightning attachment. As there is no data other than
the component on which the PCS cards were fitted, the data analysis is simplistic. The limitations
and difficulties in sorting the data were:
• Due to the lack of an alarm system the PCS cards could have been exposed to more than one
lightning strike between the date placed and the date replaced (typically between 5 to 6 months).
They will fail to record all of these due to their inherent character of just being able to read one
peak current recording.
• It is not possible to state that a particular component was exposed to the first return stroke while
others saw a subsequent stroke
Figure 8 shows the peak current readings taken from the blades of all of the wind turbines in the
data set.
Over 1800 PCS card readings were taken from the blades of the worldwide wind turbines. From the
readings, it can be observed that peak currents reach a maximum with one reading of 120 kA. As
PCS cards are limited to register only peak currents upto 120kA, the actual maximum current could
be higher than this, but as there is only one reading at 120 kA this clearly show that very high peak
currents are rare. There is a peculiar abundance of readings of 41kA within the data set. This is
something that should not be expected from a natural phenomenon and suggests an issue with the
measurement system. This will be dealt with in the next section.
From Figure 8, there is a higher probability of strikes with low peak currents attaching to the
windvane as compared to the other components. Also comparing the lightning strikes of the blades
collected worldwide and to that of Nysted, there is a larger possibility of low peak currents
16
attaching themselves to the blades offshore as compared to the rest. This once again brings back the
possibility of a large number of these low peak currents being upward initiated lightning. If this is
the case, then the move of the wind farms offshore increases the risk of upward lightning as it can
be seen from the peak current distribution of the rotor blade strikes compared to those compared to
the rest of the world. However, it is difficult to be certain of this conclusion since the cards at
Nysted are generally exchanged more frequently than those in other wind turbines. This itself would
also lead to a probability distribution of lightning current that has a lower average value or higher as
in the case of the worldwide data as the PCS cards are not changed as frequently as compared to
Nysted, thus there is a possibility of the cards being overwritten by a strike of a higher peak current.
5.3 Testing Of PCS Cards
To ascertain the detection limits of the PCS card more accurately, a series of high current tests were
carried out. According to the manufacturer, the PCS cards are said to be able to record peak currents
between 3kA – 120 kA. However, the accuracy of these cards has been questioned before [21]. The
OBO PCS cards claim to have a range of 3kA to 120kA with results deviating not more than ±2 kA,
but according to the tests performed in the above research the cards failed to detect small (2kA to
5kA) currents, subsequently it was concluded by the authors that the minimum current required to
trigger the cards was above 5 kA. To verify these results and to try and explain the phenomena of
the recurring registrations of 41kA, tests were performed on PCS cards in a high current laboratory.
Three waveforms, a 10/350, an 8/20 and a 12/53µs were used to test PCS cards at current levels of
10, 20, 30, 50, 70 and 100 kA. The cards were read and replaced after each level of peak current.
The cards were mounted on two sizes of down-conductors, a 6.6mm diameter stranded wire and a
10mm diameter solid wire. Five PCS cards were used for each test in order to examine the variation
between the readings of individual cards.
17
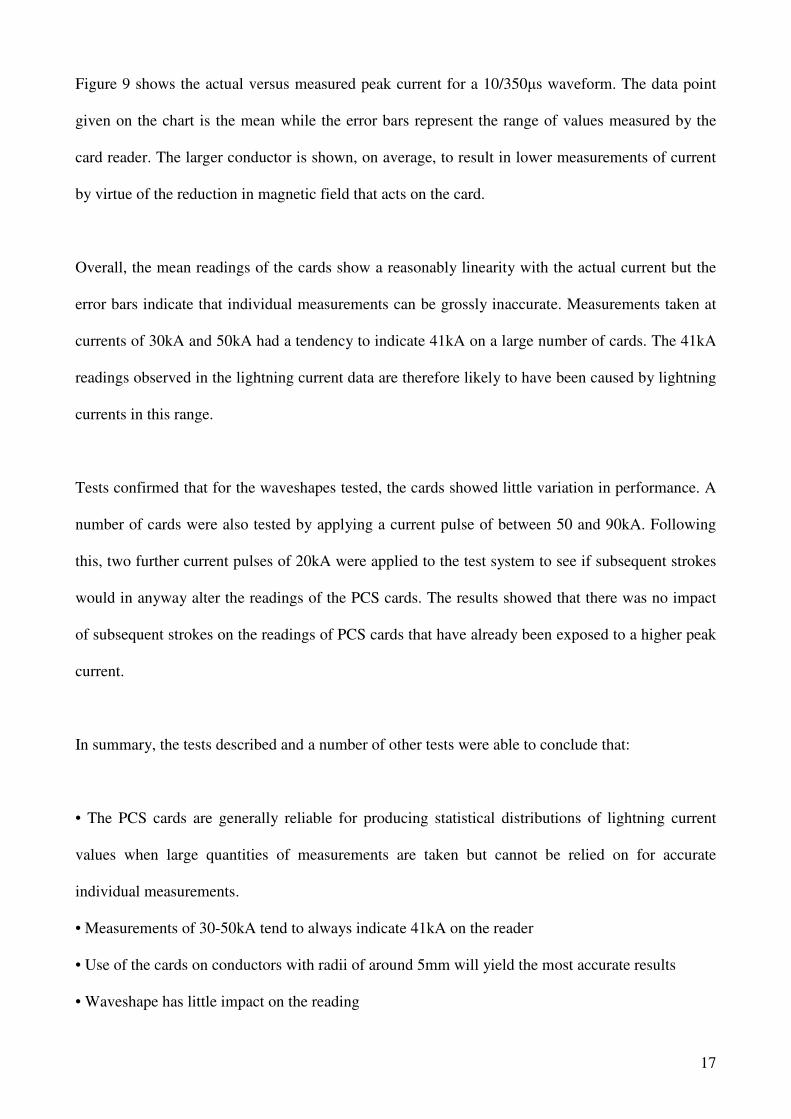
Figure 9 shows the actual versus measured peak current for a 10/350μs waveform. The data point
given on the chart is the mean while the error bars represent the range of values measured by the
card reader. The larger conductor is shown, on average, to result in lower measurements of current
by virtue of the reduction in magnetic field that acts on the card.
Overall, the mean readings of the cards show a reasonably linearity with the actual current but the
error bars indicate that individual measurements can be grossly inaccurate. Measurements taken at
currents of 30kA and 50kA had a tendency to indicate 41kA on a large number of cards. The 41kA
readings observed in the lightning current data are therefore likely to have been caused by lightning
currents in this range.
Tests confirmed that for the waveshapes tested, the cards showed little variation in performance. A
number of cards were also tested by applying a current pulse of between 50 and 90kA. Following
this, two further current pulses of 20kA were applied to the test system to see if subsequent strokes
would in anyway alter the readings of the PCS cards. The results showed that there was no impact
of subsequent strokes on the readings of PCS cards that have already been exposed to a higher peak
current.
In summary, the tests described and a number of other tests were able to conclude that:
• The PCS cards are generally reliable for producing statistical distributions of lightning current
values when large quantities of measurements are taken but cannot be relied on for accurate
individual measurements.
• Measurements of 30-50kA tend to always indicate 41kA on the reader
• Use of the cards on conductors with radii of around 5mm will yield the most accurate results
• Waveshape has little impact on the reading

18
• Subsequent lower amplitude strokes do not affect the peak current reading
• Currents of less than 5kA could not be registered
When the results of the tests performed on the PCS cards are comparable with those found in [21],
it can be confirmed that the cards fail to register peak currents less than 5kA. There are a number of
registrations in the results where 41kA is read by the card reader, though the actual peak currents do
not correspond to this value. The reason for this finding is unclear and would appear to be a
function of the card/reader design and no significant remarks about the phenomena have been found
in the literature[21].
These conclusions and the data previously presented from the windfarm measurements is now used
in examining possible scenarios that could produce the probabilistic current distribution.
5.4 Comparison Of Data From Lightning Cards With Values Expected From Models
The data that has been produced from the measurements of lightning current on actual wind
turbines shows lower than expected peak values of lightning current. This section examines
different scenarios and computes theoretical cumulative probability distributions of lightning
current based on the known capabilities of the PCS card readers and combinations of upward /
downward lightning. The simulation considered lightning striking 10,000 objects all fitted with a
PCS card.
For downward lightning, the probability distributions were assumed to follow those contained
within the IEC guidelines [28]. For upward lightning, data detailing the cumulative distribution of
lightning current observed for upward lightning strikes was considered [31] . In this data, upward
lightning is divided into α and β components. Upward lightning starts with a continuing current.

19
This continuing current is superimposed by impulse currents which are known as α components.
The continuing current is sometimes followed by impulse currents, these are also known as β
components [5]. The α components are said to be comparable to the so called M-components of
triggered lightning strikes [31]. M – components are spikes or surges that are created on the
continuing current during triggered lightning. Though α components are said to have lower rise
times, they have higher peak current amplitudes. The β – components are compared to subsequent
strokes [5, 7, 29, 31]. They are said to have similar rise times and peak current amplitudes.
In a study performed on the lightning strikes attaching to Peissenberg tower, 249 α – components
and 74 β – components were measured. The same ratios were taken in order to replicate the upward
lightning phenomena.
In this analysis, these probabilistic distributions are used in combination with knowledge from the
PCS card tests. The rules applied are:
• A strike of less than 5kA will be ignored on the basis it is unlikely to be detected by the PCS
card system
• Strikes of over 120kA will be limited to a reading of 120kA owing to the limitation of the PCS
card system
• Where multiple strikes are assumed to hit one wind turbine, the highest peak current will be
stored on the PCS card
The scenarios applied were:
• Scenario 1: One first downward negative return stroke followed by two subsequent negative
strokes

20
• Scenario 2: As for Scenario 1 but with 60% of the cards struck by an additional first downward
return stroke and two subsequent strokes
• Scenario 3: A first downward negative stroke followed by two subsequent strokes, each
attaching to a different location
• Scenario 4: 80 % upward initiated and 20% downward initiated strikes (subsequent strokes
attaching to different locations).
• Scenario 5: 80% upward initiated and 20% downward initiated strikes all attaching to the same
location
As would be expected, scenario 1 that only includes downward propagating lightning produces a
cumulative probability distribution of current that is considerably different to the measurements
observed in the field. Scenario 2 only moves the probability distribution away from the Nysted and
Worldwide data by virtue of lower current values not being able to overwrite the higher values
already on the PCS cards. Scenario 3 moves the probability distribution towards the Nysted and
Worldwide as the cards that are affected by the subsequent strokes will register lower average
currents than those in the first two scenarios. All of these scenarios are some way from the real data
that has actually been observed.
Scenario 4 and 5 provide a close match between the observed data and the predicted cumulative
probability distribution of lightning current. It is accepted that an 80% probability of upward strikes
is high based on the accepted equations for estimating upward lightning strike frequency
probability. However, this high probability of upward lightning would appear to fit with the
prevalence of lightning during the winter months and the high percentage of upward lightning
strikes found during such periods by other researchers [26]. A poor match between Scenarios 1-3
and the real data could also be explained if the lightning current probability distributions
recommended by IEC 62305 and largely based on the data by Berger probably being conservative.

21
6 Summary & Conclusions
1. From the offshore wind farm and worldwide lightning data, the blades are shown to be the
most exposed components of the wind turbine. This is in accordance with many other models.
However, in the case of the offshore wind farm data and if the external hardware on the nacelle is
taken as one entity, the number of strikes to these locations strikes exceed that of the rotor.
2. The results from the PCS cards tests reveal that cards registering peak currents of 41 kA are
actually lighting strikes with currents ranging from 30-50 kA, this range could be higher if the
conductors used are not of the right diameter. The PCS cards are still not sensitive for low peak
currents. Strikes below 5 kA are not registered.
3. Testing components for standardisation is a general practice in lightning protection systems.
The level of testing is pre-defined in these standards. For example, blades which are characterised
as a LPZ 0A and LPZ 0B zones should withstand the effects of direct lightning attachment (or no
lighting attachment for LPZ 0B), full lightning current and unattenuated magnetic field.
Components in these zones are tested at 200kA. In reality with only a couple of strikes out of
thousands reaching this level, the test levels in terms of peak current appear to be very high.
However, it must be noted that the data analysed in this paper only covers 7 years and it is difficult
to confirm this conclusion considering the estimated 20 years lifetime of a wind turbine.
4. The current distribution of the strikes shows that there are a large number of peak currents
below 15kA. The existence of this larger than expected number of low peak current strikes can be
reproduced using a probabilistic model that includes 80% of the total strikes being upward initiated.

22
5. The error margin in the PCS cards makes it hard to determine the reliability of the data set,
thus caution must be taken while comparing this data with other sources. The difficulties in sorting
and analysing the data brings into the light the need for a comprehensive study on the lightning
attachment behaviour on larger data sets of wind turbines with accurate registration systems.
Acknowledgement
The present research has been performed as part of the project ‘SUPERGEN Wind Energy
Technologies’ sponsored by the EPSRC.
7 Reference
1. GWEC, Global Wind Energy Outlook. 2006.
2. WWEA. 120 Gigawatt of wind turbines globally contribute to secure electricity
generation 2009 [cited 2009 16/10/2009].
3. Rademakers, L., et al., Lightning Damage of OWECS. 2002(Part 1: “Parameters
Relevant for Cost Modelling”).
4. T. Sorensen, F.V.J., N. Raben, J. Lykkegaard and J. Saxov, Lightning Protection for
Ofshore Wind Farms. DEFU - Research Inst. for Danish Electfic Utilities, SEAS, Eltra
and Elsam, Denmark.
5. Rakov, V.A. and M.A. Uman, Lightning - Physics and Effects. 2000.
6. Berger, K., Novel Observations on Lightning Discharges: Results of Research on Mount
San Salvatore. Journal of the Franklin Institute, 1967. 283(6): p. 478-525.
7. Berger, K. Anderson, and R.B.a. Kröninger, Parameters of Lightning Flashes. Cigré,
1975(41): p. 23-37.
8. IEC 61400-24, Wind turbine generator systems – Part 24: Lightning protection for wind
turbines” June 2000.
9. Durstewitz, M., “Wind Energy Report Germany 2001; Annual Evaluation of WMEP”;
ISET, Germany. 2001.
10. Rachidi, F., et al., A Review of Current Issues in Lightning Protection of New-
Generation Wind-Turbine Blades. Industrial Electronics, IEEE Transactions on, 2008.
55(6): p. 2489-2496.

23
11. Project FINO 3 http://www.fino3.de/Joomla/index.php.
12. Sceibe, K., T. Axmann, and C. Birk, Lightning Research for Offshore Wind Farms in
the North Sea. 29th International Conference on Lightning Protection, 2008.
13. McNiff, B., Wind Turbine Lightning Protection Project NREL Subcontractor Report, SR-
500-31115. 2002.
14. Sorenson, T.S., et al., The update of IEC 61400-24 Lightning Protection of Wind
Turbines. 29th International Conference on Lightning Protection of Wind Turbines,
2008.
15. Bertelsen, K., et al., Application of numerical models to determine lightning attachment
points on wind turbines. ICLP 2007, 2007.
16. Alonso, M.A. and I.A. Larrion, Calculation of electric fields in a wind mill due to a
lightning discharge using finite elements method.
17. Naka, T., et al., Experimental Studies on Lightning Protection Design for Wind Turbine
Blades.
18. Cotton, I., et al., Lightning Protection Of Wind Turbines - A Designers Guide To Best
Practice. 1999.
19. http://www.jomitek.dk/, accessed January 2008.
20. Sørensen, T., et al., Lightning Strike Sensor for Power Producing Wind Turbines.
European Wind Energy Conference and Exhibition, Nice, France, 1999.
21. Schoene, J., et al., Testing of the OBO Bettermann Peak Current Sensor System for
Lawrence Livermore National Laboratory. Lawrence Livermore National Laboratory,
2005.
22. 2007, A.A., http://www.obo-bettermann.com/en/pdf_kataloge.shtml.
23. Naka, T., et al., Study on Lightning Protection Methods for Wind Turbine Blades. IEEJ
Transactions, 2005. 125(10).
24. Alonso, M.A. and D.C. Irastorza, Dynamic Wind Turbine Lightning Protection
Behaviour Under Strom Conditions. 29th International Conference on Lightning
Protection, 2008.
25. Rizk, A.M., A model for switching impulse leader inception and breakdown of long air-
gaps. IEEE Transactions on Power Delivery, 1989. 4(1): p. 596 - 606.
26. Miyake, K., et al., Winter lightning on Japan Sea coast-lightning striking frequency totall
structures IEEE Transactions on Power Delivery, 1990. Volume: 5( Issue: 3): p. 1370-
1376.
27. Aguado, M., H. B, and M.C. P, Risks Assessment For Lightnings Strokes in Wind Farm
Installations. High Voltage Engineering Symposium, 1999.

24
28. IEC 62305, Protection against lightning — Part 1: General principles. BS EN, 2006.
29. Anderson R.B and E. A.J, Lightning Parameters for Engineering Application. Cigré
Electra, 1980. 69: p. 65-102.
30. Eriksson, A.J., The incidence of lightning strikes to power lines IEEE Transactions on
Power Delivery, 1987. v PWRD-2(3): p. 859-70.
31. Fuchs, F., et al., Lightning Current and Magnetic Field Parameters Caused by Lightning
Strikes to Tall Structures Relating to Interference of Electronic Systems. IEEE
Transactions On Electromagnetic Compatibility, 1998. 40(4): p. 444 - 451.
32. LM Lightning Protection. 2006.
Figures
Figure 1 Profile Downward Initiated Lightning
Figure 1 Profile Upward Initiated Lightning

25
Figure 2 Lightning Protection Methods for Rotor Blades
Figure 3 Tip of blade with surface erosion caused by lighting arc around receptor and
towards the trailing edge [32]

26
Figure 4 : Number of PCS Cards Showing a Lightning Current Reading Following an Alarm
Event
Figure 5 : Lightning Strikes Given By Their Peak Current versus Season of Occurrence

27
Figure 6: Cumulative Probability of Peak Currents As Measured On the Downconductors of
Various Wind Turbine Components
Figure 7: Current Distribution of Strikes to Blades Worldwide

28
Figure 8: Cumulative Probability of Peak Currents on Different Components
Figure 9: Measured Versus Actual Peak Current for a 10/350μs Waveform with the PCS
Cards Mounted On a 6.6mm or 10mm Diameter Conductor

29
Figure 10 Cumulative Probability of Assumed Scenarios