comparison of mono- to diphosphate ester ratio in ... · ratio in inhibitor formulations for...
TRANSCRIPT

Comparison of Mono- to Diphosphate EsterRatio in Inhibitor Formulations for Mitigationof Under Deposit Corrosion
Bruce Brown,‡,* Amr Saleh,* and Jeremy Moloney**
ABSTRACT
Mitigation of localized under deposit corrosion (UDC) in upstreamoil and gas pipelines is an important research topic for bothindustry and academia. In a research program to better definethe various inhibitor components that provide mitigation of UDC,this initial research investigates the effect of varied ratios ofmono- to dinonylphenol phosphate esters (PE) by testing a set ofspecifically formulated inhibitors. Inhibitors with three mono-to di-PE ratios were tested in the presence and absence of2-mercaptoethanol (ME). Using two 1.25 in (3.18 cm) diameterAPI 5L X65 pipeline steel samples and 250 μm silica sand,UDC testing was conducted for 28 d in a CO2 saturated solutionat 70°C and 1 bar (100 kPa) total pressure. Analysis hasshown that localized corrosion (pit penetration rate) increased forME-free nonylphenol PE as the concentrations of di-PEs andmono-PEs approached equivalency. The nonylphenol PE inhibitorwith a 50:50 mono- to di-PE ratio at 100 ppm concentrationfailed to protect the surface of the sample under the individualsand grains. Even the base product inhibitor package with noPE provided better mitigation under these test conditionsthan the 50:50 mono- to dinonylphenol PE. However, it wasobserved that the addition of ME provided a dramatic improve-ment in the mitigation of UDC for each mono- to di-PE ratio of thenonylphenol PE tested. From this research, it is seen thatthemono- to di- PE ratio is important to consider when developingcorrosion inhibitors containing PEs.
KEY WORDS: API 5L X65, corrosion mitigation, nonylphenol,phosphate ester, under deposit corrosion
INTRODUCTION
Under deposit corrosion (UDC) is a localized corrosionthat occurs where sediments, carried through a pro-duction or transmission pipeline, have settled instagnant or low-flow sections of a pipeline and mitiga-tion strategies are ineffective or impractical.Computational fluid dynamics studies1-2 have recentlybeen conducted to understand mechanisms of solidsdeposition in order to mitigate deposit formation.Conclusions from these studies confirmed specificconditions related to flow and pipeline geometry reducethe near-wall velocity at the pipe floor, allowingdeposits containing a mixture of water, hydrocarbons,microorganisms, and inorganic compounds to form.Particular types of inorganic deposits, i.e., silica sand,have been found to retard uniform corrosion of mildsteel by slowing down the mass transfer of corrosivespecies;3 however, the difference between the envi-ronmental conditions in the bulk solution versus underthe deposit has been found to increase the probabilityof localized corrosion. This difference in environmentalconditions is particularly prominent when an inhib-itor is present in the bulk solution, as the sand depositwill slow down inhibitor diffusion to themetal surface,as well as parasitically deplete the inhibitor concen-tration through adsorption on the large surface areaprovided by the sand.4-5 Even though an inhibitor hasbeen shown to be effective in protecting the pipeline
Submitted for publication: May 26, 2015. Revised and accepted:September 21, 2015. Preprint available online: September 21,2015, http://dx.doi.org/10.5006/1786.
‡ Corresponding author. E-mail: [email protected].* Institute for Corrosion and Multiphase Technology, Departmentof Chemical & Biomolecular Engineering, Ohio University,342 W. State St., Athens, OH 45701.
** NALCO Champion, 7705 Highway 90-A, Sugarland, TX 77478.
1500ISSN 0010-9312 (print), 1938-159X (online)
15/000247/$5.00+$0.50/0 © 2015, NACE International CORROSION—DECEMBER 2015
CORROSION SCIENCE SECTION

from uniform corrosion under sand beds, it may have atendency to cause localized corrosion; therefore, caremust be taken to evaluate each inhibitor’s effectivenessbefore use.5 A well-known example reported bySmart6 found significant localized pitting under thesediment in the bottom of an inhibited crude oiltransmission pipeline, while general corrosion rates inthe pipeline were measured in the range of0.005 mm/y to 0.01 mm/y (0.2 mpy to 0.4 mpy).
Laboratory experiments focused on UDC in asweet environment have found that the addition of aninhibitor will not always mitigate localized corrosionand may lead to its acceleration. Marsh, et al.,7 con-ducted artificial pit experiments using three indus-trial inhibitors in sweet conditions under a bariumsulfate scale and found that low concentrations of theinhibitors (10 ppm) would give efficient general corro-sion inhibition, but could lead to an acceleration ofcorrosion processes associated with galvanic phenom-ena. Pedersen, et al.,8 investigated the risk of localizedUDC of an X65 pipeline steel by galvanically coupling asand-covered sample with a non-covered sample inthe presence of an imidazoline-type inhibitor. Whensand deposition occurred prior to adding the inhibi-tor, severe localized corrosion was observed with pitpenetration rates of 4 mm/y to 5 mm/y, while thegeneral corrosion rate was 0.2 mm/y. However, whenthe sand deposition occurred after both samples wereexposed to the inhibitor, the corrosion rate was notgreatly affected. In experiments using multi-electrodearray probes, Hinds, et al.,9 found that the addition ofan inhibitor polarized a non-sand-covered electrodeto a more noble potential with respect to a sand-coveredelectrode that accelerated the corrosion rate underthe sand deposit. Even though the full composition ofthe two different inhibitors used in the study wasunknown, it was shown that a significant amount ofeach inhibitor was lost by adsorption on the sand.These corrosion studies concluded that neither inhibi-tor tested provided ideal mitigation of UDC, possibly aresult of transport limitations through the sand bed andpre-corroded regions, but these conclusions weremade without analyzing the interaction betweenneighboring electrodes. Tan, et al.,10 used a partiallysand-covered multi-electrode array, but focused onshowing the interaction between the neighboringelectrodes on a partially sand-covered multi-electrodearray. Their experiments included measuring thegalvanic current distribution without sand, under apartial sand deposit, and under a partial sand depositwith the addition of an imidazoline-type corrosion in-hibitor. They confirmed that the addition of sandlimits transport of corrosive species to the metal sub-strate under the deposit, but this limitation would notinitiate localized corrosion. UDC resulted from inhibitoraddition to the system. The addition of an imidazo-line-type inhibitor at various concentrations from10 ppm to 50 ppm was found to enhance localized
UDC as the potential difference between anodic andcathodic sites was measured to be approximately250 mV, with major anodic areas found under the sandbed. In most of their experiments with industrialinhibitors relevant to oilfield applications, this type ofgalvanic corrosion could continue for more than 30 d.From these examples, the overall scenario for localizedUDC to occur can be defined as a partial coverage by awet inorganic deposit on the pipe wall with the presenceof an inhibitor in the bulk fluid flow, which dramat-ically increases the probability to initiate andmaintain agalvanic corrosion. However, pertinent research in-formation toward understanding mitigation mechan-isms was missing in these studies because the inhi-bitors did not have defined chemical components.
In research focused on the mechanisms of UDC,Huang3 observed that pitting corrosion was initiated asa result of the inability of the corrosion inhibitor toprotect the steel surface in the crevices immediatelyunderneath each individual sand particle. In experi-ments using an imidazoline inhibitor package with all ofthe chemical components known, Huang concludedthat the driving force for localized UDC was a result ofgalvanic effects between the larger cathodic area ofthe inhibited surface and the smaller anodic area un-derneath the sand particle that was not protected bythe inhibitor. She also found that addition of thiosulfateenabled mitigation of this type of localized corrosionbecause of its lack of interaction with the silica sand.Through her research, Huang had developed a re-peatable procedure to initiate localized UDC that couldbe used to test the effect of individual chemicalcomponents of an inhibitor on initiation of localizedcorrosion.
Phosphate esters (PE) are part of a class of an-ionic surface active components that are often added ascomponents in corrosion inhibitors for well stimula-tions and oil and gas production, as they are effective atmoderate temperatures or in the presence of traceamounts of oxygen.11 Experiments by O’Lenick andParkinson12 found that ethoxylated surface activecomponents had faster wetting times with 2mol to 3molof ethylene oxide (EO) structural units added betweeneach set of decyl alcohol hydrophobes and the phos-phate head group. Wetting times decreased with anincrease in the number of mol of EO present as intra-molecular sub-units. They also found that as thenumber of carbon atoms was increased in the hydro-phobic tail without EO, the wetting time increased.
Smith has described the role of intramolecularEO units as follows: “Some corrosion inhibitors areethoxylated in order to increase the dispersibility ofthe chemical in water. The ethoxylation does not play arole in the actual inhibitor performance of thechemical other than allowing it to disperse into theaqueous phase so that it reaches the metal/waterinterface. Without ethoxylation, the oil soluble inhibi-tors would stay in the hydrocarbon liquid (or would
CORROSION—Vol. 71, No. 12 1501
CORROSION SCIENCE SECTION
float on the water/gas interface), where they will notinhibit the corrosion of the metal.”13
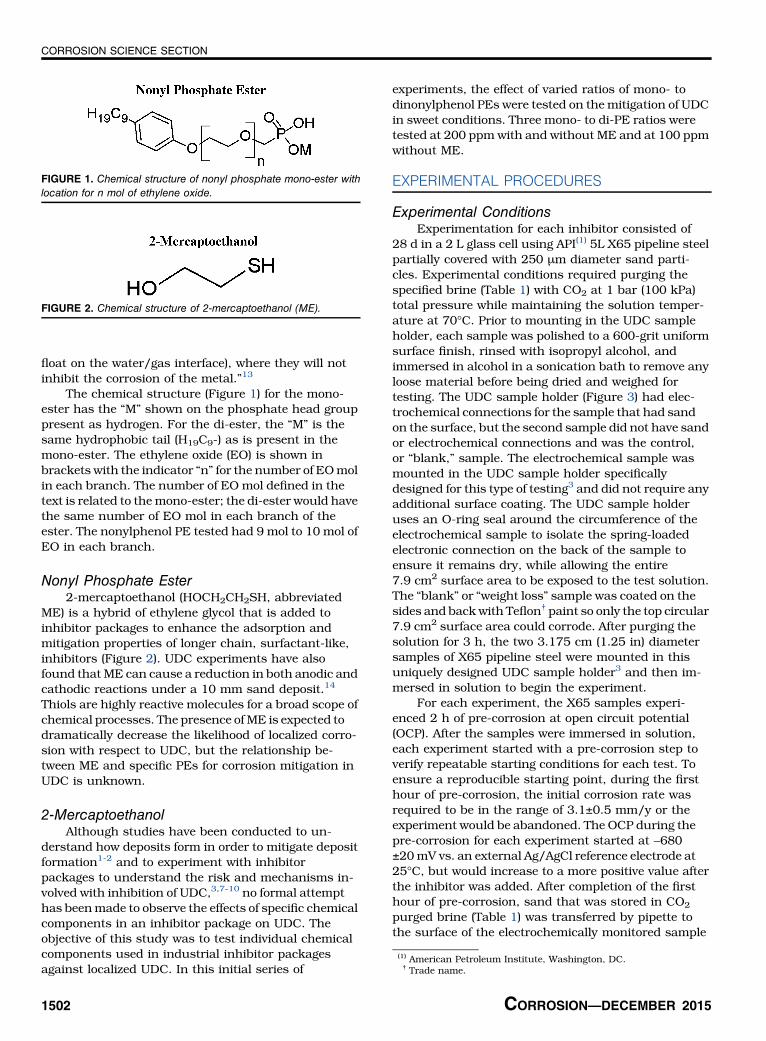
The chemical structure (Figure 1) for the mono-ester has the “M” shown on the phosphate head grouppresent as hydrogen. For the di-ester, the “M” is thesame hydrophobic tail (H19C9-) as is present in themono-ester. The ethylene oxide (EO) is shown inbrackets with the indicator “n” for the number of EOmolin each branch. The number of EO mol defined in thetext is related to the mono-ester; the di-ester would havethe same number of EO mol in each branch of theester. The nonylphenol PE tested had 9 mol to 10 mol ofEO in each branch.
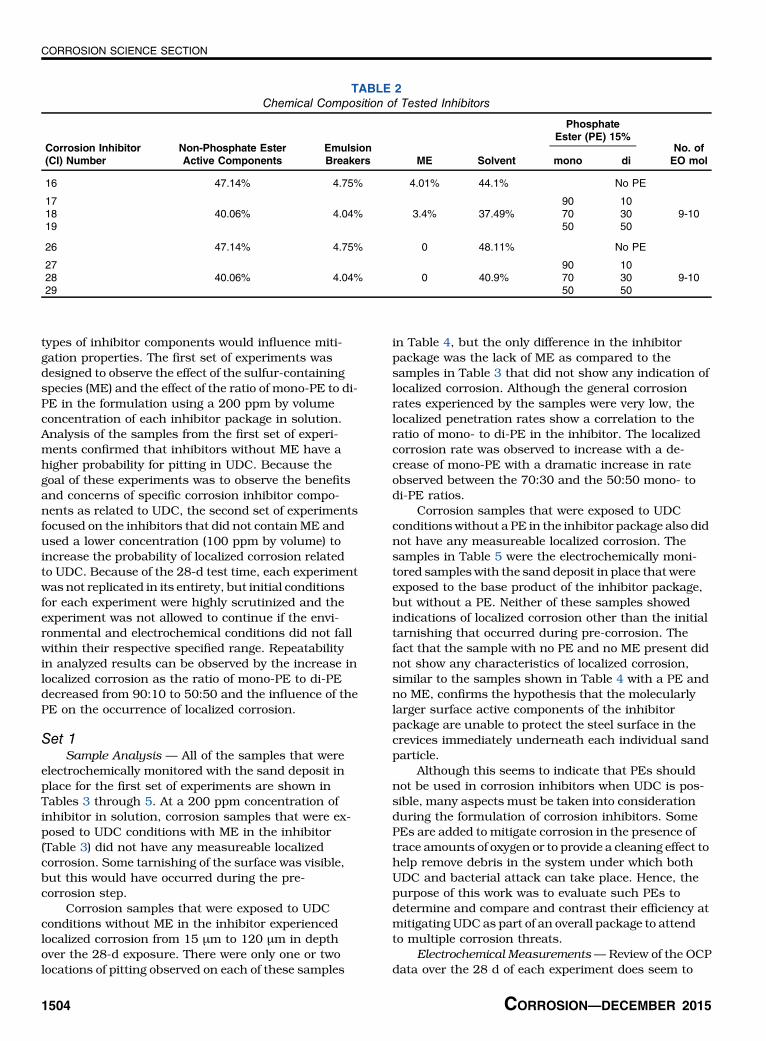
Nonyl Phosphate Ester2-mercaptoethanol (HOCH2CH2SH, abbreviated
ME) is a hybrid of ethylene glycol that is added toinhibitor packages to enhance the adsorption andmitigation properties of longer chain, surfactant-like,inhibitors (Figure 2). UDC experiments have alsofound that ME can cause a reduction in both anodic andcathodic reactions under a 10 mm sand deposit.14
Thiols are highly reactive molecules for a broad scope ofchemical processes. The presence ofME is expected todramatically decrease the likelihood of localized corro-sion with respect to UDC, but the relationship be-tween ME and specific PEs for corrosion mitigation inUDC is unknown.
2-MercaptoethanolAlthough studies have been conducted to un-
derstand how deposits form in order to mitigate depositformation1-2 and to experiment with inhibitorpackages to understand the risk and mechanisms in-volved with inhibition of UDC,3,7-10 no formal attempthas beenmade to observe the effects of specific chemicalcomponents in an inhibitor package on UDC. Theobjective of this study was to test individual chemicalcomponents used in industrial inhibitor packagesagainst localized UDC. In this initial series of
experiments, the effect of varied ratios of mono- todinonylphenol PEs were tested on the mitigation of UDCin sweet conditions. Three mono- to di-PE ratios weretested at 200 ppm with and without ME and at 100 ppmwithout ME.
EXPERIMENTAL PROCEDURES
Experimental ConditionsExperimentation for each inhibitor consisted of
28 d in a 2 L glass cell using API(1) 5L X65 pipeline steelpartially covered with 250 μm diameter sand parti-cles. Experimental conditions required purging thespecified brine (Table 1) with CO2 at 1 bar (100 kPa)total pressure while maintaining the solution temper-ature at 70°C. Prior to mounting in the UDC sampleholder, each sample was polished to a 600-grit uniformsurface finish, rinsed with isopropyl alcohol, andimmersed in alcohol in a sonication bath to remove anyloose material before being dried and weighed fortesting. The UDC sample holder (Figure 3) had elec-trochemical connections for the sample that had sandon the surface, but the second sample did not have sandor electrochemical connections and was the control,or “blank,” sample. The electrochemical sample wasmounted in the UDC sample holder specificallydesigned for this type of testing3 and did not require anyadditional surface coating. The UDC sample holderuses an O-ring seal around the circumference of theelectrochemical sample to isolate the spring-loadedelectronic connection on the back of the sample toensure it remains dry, while allowing the entire7.9 cm2 surface area to be exposed to the test solution.The “blank” or “weight loss” sample was coated on thesides and back with Teflon† paint so only the top circular7.9 cm2 surface area could corrode. After purging thesolution for 3 h, the two 3.175 cm (1.25 in) diametersamples of X65 pipeline steel were mounted in thisuniquely designed UDC sample holder3 and then im-mersed in solution to begin the experiment.
For each experiment, the X65 samples experi-enced 2 h of pre-corrosion at open circuit potential(OCP). After the samples were immersed in solution,each experiment started with a pre-corrosion step toverify repeatable starting conditions for each test. Toensure a reproducible starting point, during the firsthour of pre-corrosion, the initial corrosion rate wasrequired to be in the range of 3.1±0.5 mm/y or theexperiment would be abandoned. The OCP during thepre-corrosion for each experiment started at −680±20mV vs. an external Ag/AgCl reference electrode at25°C, but would increase to a more positive value afterthe inhibitor was added. After completion of the firsthour of pre-corrosion, sand that was stored in CO2
purged brine (Table 1) was transferred by pipette tothe surface of the electrochemically monitored sample
FIGURE 1. Chemical structure of nonyl phosphate mono-ester withlocation for n mol of ethylene oxide.
FIGURE 2. Chemical structure of 2-mercaptoethanol (ME).
(1) American Petroleum Institute, Washington, DC.† Trade name.
1502 CORROSION—DECEMBER 2015
CORROSION SCIENCE SECTION

for an approximate 25% surface coverage with asingle layer of sand and then CO2 purged model oil (LVT200†) was added at 10% by volume to the glass cell.After another hour of monitoring pre-corrosion with thesand in place and the same range of corrosion ratemaintained, the chosen inhibitor was added as ppm bytotal volume below the hydrocarbon phase in the 2 Lglass cell. To minimize oxygen contamination, the CO2
sparge rate was increased as additions to the glasscell were made through a 1 cm diameter opening inthe lid.
Electrochemical data was collected on a dailybasis and both samples were removed after 28 d foranalysis. OCP, linear polarization resistance (Rp), andelectrochemical impedance spectroscopy (EIS) mea-surements were collected manually on a daily basis.Automation of the electrochemical measurements wasnot used as added salts, inhibitors, and FeCO3 pre-cipitation have been found to interfere with the refer-ence electrode connection to cause erroneous read-ings leading to possible damage of the working
electrode. The solution resistance (Rs) determinedfrom EIS analysis was documented and used to correctthe Rp calculation. Corrosion rate was calculatedusing a B value of 26 mV.
At the end of each experiment, a sample of thebulk solution below the hydrocarbon phase was takenfor residual inhibitor analysis prior to removal of thesamples for analysis. After removing them from solu-tion, both samples were photographed, rinsed withnitrogen purged deionized water to remove salts andloose sand, rinsed with isopropyl alcohol to removewater, dried with a cool air blower, and stored in adesiccator until analyzed. Weight loss and imageanalysis procedures were conducted and recorded foreach sample including scanning electron microscopy(SEM)/energy dispersive x-ray spectroscopy (EDS) ofthe corrosion product layer, corrosion product layerremoval by Clarke solution cleaning,15 and profilometermeasurements of the metal surface to quantify anyobservable localized corrosion. After cleaning, eachcorrosion sample’s surface was fully imaged witha profilometer to find the maximum pit depth. To de-termine the amount of residual inhibitor in the bulksolution after each experiment, surface tension mea-surements from a series dilution of each inhibitor(mN/m vs. ppm) were used as a guideline to backcalculate the concentration of inhibitor from bulksolution collected at the end of the experiment before thesamples were removed.
Inhibitor ComponentsThe chemical composition of each inhibitor in
this study is listed in Table 2. Inhibitor packagesnumbered from 16 to 19 contained ME, while theinhibitor packages numbered from 26 to 29 did notcontain ME.
RESULTS AND DISCUSSION
The goals of these experiments were to observe iflocalized corrosion would initiate and propagate afterthe addition of a corrosion inhibitor to a systemwith apartial steel surface coverage by sand and if particular
TABLE 1Solution Mixture of Salts to Create the Desired Brine
Brine Composition
Ion ppm
Na+ 13,000Ca2+ 95Mg2+ 150Br− -CH3COO− 600Cl− 20,000HCO3
− 300SO4
2− 150TDS 34,295
Component Salts for 3.4 wt% Brine
Total Fluid: 2 L
Salt g/mol Amount (g)
NaHCO3 84.007 0.85NaCl 58.44 65.9KCl 74.5513 0.39CaCl2 (anhydrous) 110.98 0.54Na2SO4 142.04 0.45NaCH3COO 82.0338 1.72MgCl2 · 6H2O 203.271 2.59
FIGURE 3. UDC sample holder showing location for electrochemicalsample with sand coverage and weight loss sample without sand.Both samples have a 7.9 cm2 (1.23 in2) wetted surface area.
CORROSION—Vol. 71, No. 12 1503
CORROSION SCIENCE SECTION
types of inhibitor components would influence miti-gation properties. The first set of experiments wasdesigned to observe the effect of the sulfur-containingspecies (ME) and the effect of the ratio of mono-PE to di-PE in the formulation using a 200 ppm by volumeconcentration of each inhibitor package in solution.Analysis of the samples from the first set of experi-ments confirmed that inhibitors without ME have ahigher probability for pitting in UDC. Because thegoal of these experiments was to observe the benefitsand concerns of specific corrosion inhibitor compo-nents as related to UDC, the second set of experimentsfocused on the inhibitors that did not contain ME andused a lower concentration (100 ppm by volume) toincrease the probability of localized corrosion relatedto UDC. Because of the 28-d test time, each experimentwas not replicated in its entirety, but initial conditionsfor each experiment were highly scrutinized and theexperiment was not allowed to continue if the envi-ronmental and electrochemical conditions did not fallwithin their respective specified range. Repeatabilityin analyzed results can be observed by the increase inlocalized corrosion as the ratio of mono-PE to di-PEdecreased from 90:10 to 50:50 and the influence of thePE on the occurrence of localized corrosion.
Set 1Sample Analysis — All of the samples that were
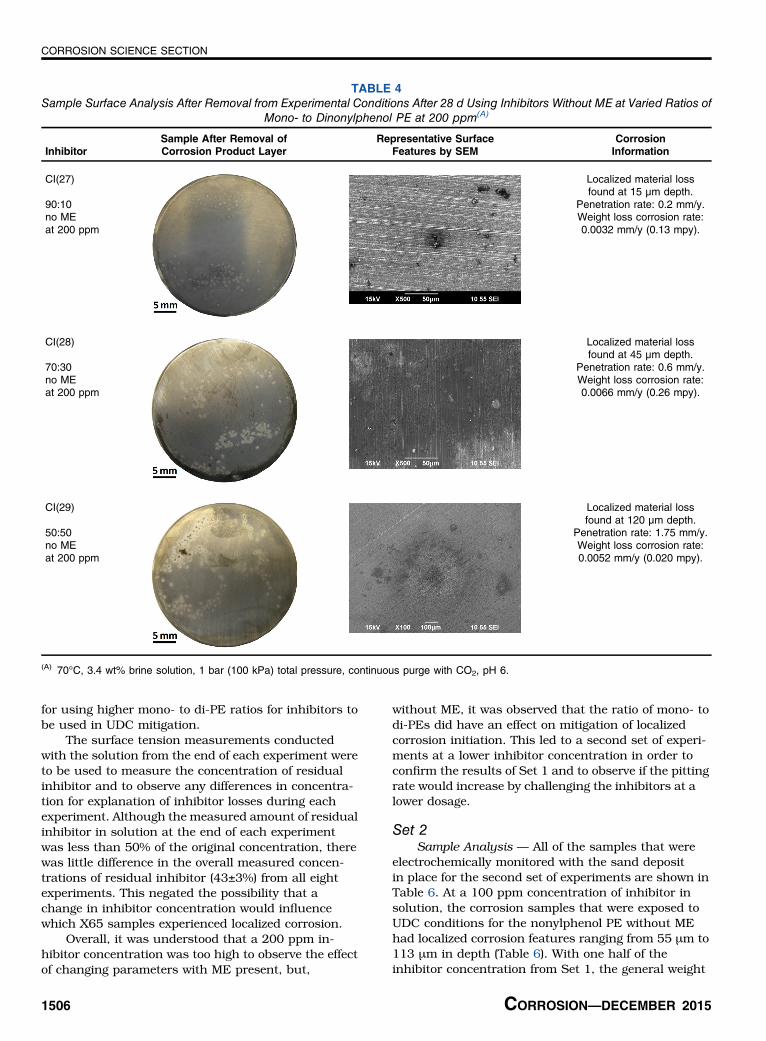
electrochemically monitored with the sand deposit inplace for the first set of experiments are shown inTables 3 through 5. At a 200 ppm concentration ofinhibitor in solution, corrosion samples that were ex-posed to UDC conditions with ME in the inhibitor(Table 3) did not have any measureable localizedcorrosion. Some tarnishing of the surface was visible,but this would have occurred during the pre-corrosion step.
Corrosion samples that were exposed to UDCconditions without ME in the inhibitor experiencedlocalized corrosion from 15 μm to 120 μm in depthover the 28-d exposure. There were only one or twolocations of pitting observed on each of these samples
in Table 4, but the only difference in the inhibitorpackage was the lack of ME as compared to thesamples in Table 3 that did not show any indication oflocalized corrosion. Although the general corrosionrates experienced by the samples were very low, thelocalized penetration rates show a correlation to theratio of mono- to di-PE in the inhibitor. The localizedcorrosion rate was observed to increase with a de-crease of mono-PE with a dramatic increase in rateobserved between the 70:30 and the 50:50 mono- todi-PE ratios.
Corrosion samples that were exposed to UDCconditions without a PE in the inhibitor package also didnot have any measureable localized corrosion. Thesamples in Table 5 were the electrochemically moni-tored samples with the sand deposit in place that wereexposed to the base product of the inhibitor package,but without a PE. Neither of these samples showedindications of localized corrosion other than the initialtarnishing that occurred during pre-corrosion. Thefact that the sample with no PE and no ME present didnot show any characteristics of localized corrosion,similar to the samples shown in Table 4 with a PE andno ME, confirms the hypothesis that the molecularlylarger surface active components of the inhibitorpackage are unable to protect the steel surface in thecrevices immediately underneath each individual sandparticle.
Although this seems to indicate that PEs shouldnot be used in corrosion inhibitors when UDC is pos-sible, many aspects must be taken into considerationduring the formulation of corrosion inhibitors. SomePEs are added to mitigate corrosion in the presence oftrace amounts of oxygen or to provide a cleaning effect tohelp remove debris in the system under which bothUDC and bacterial attack can take place. Hence, thepurpose of this work was to evaluate such PEs todetermine and compare and contrast their efficiency atmitigating UDC as part of an overall package to attendto multiple corrosion threats.
Electrochemical Measurements— Review of the OCPdata over the 28 d of each experiment does seem to
TABLE 2Chemical Composition of Tested Inhibitors
Corrosion Inhibitor(CI) Number
Non-Phosphate EsterActive Components
EmulsionBreakers ME Solvent
PhosphateEster (PE) 15%
No. ofEO molmono di
16 47.14% 4.75% 4.01% 44.1% No PE
1740.06% 4.04% 3.4% 37.49%
90 109-1018 70 30
19 50 50
26 47.14% 4.75% 0 48.11% No PE
2740.06% 4.04% 0 40.9%
90 109-1028 70 30
29 50 50
1504 CORROSION—DECEMBER 2015
CORROSION SCIENCE SECTION
give an indication of whether or not pitting occurredduring the experiment. Although the OCP for eachexperiment was only measured once per day, the fluc-tuations in these values during the last 20 d of eachexperiment seemed to indicate a higher probabilityof localized corrosion. Moloney, et al.,16 found thatpotential transients in a continuously measured OCPcan be directly attributed to pitting activity on themetal surface. Although the data in this current studyonly reviewed the OCP on a daily basis, when the OCPwas not stable (more than ±10 mV fluctuation) duringthe 28 d experiments, the sample was more likely tohave measureable localized corrosion.
The comparison of electrochemical measure-ments in Figures 4 and 5 agree with this assumption.The general corrosion rate seems stable in both cases,but the OCP for CI(29) in Figure 4 experienced fluc-tuations up to 16.7 mV during the last 20 d of theexperiment. The sample with CI(29) containing 50:50
mono- to dinonylphenol PE with no ME experiencedlocalized corrosion measured at 120 μm in depth(Table 4). The sample with CI(19) containing 50:50mono- to dinonylphenol PE with ME had a maximumchange in potential of 5.7 mV over the last 20 d of theexperiment with no true visual indication of localizedcorrosion (Table 3).
Effect of Inhibitor Components — At 200 ppm con-centration, each inhibitor package did provide pro-tection against general corrosion, but it was observedthat the inhibitors without the ME additive show ahigher probability for UDC localized corrosion. It wasalso observed that the CI(29) inhibitor package with a50:50 ratio of mono- to dinonylphenol PE and no MEhad the largest pit penetration rate of localized cor-rosion under these conditions. Notice that the change inlocal penetration rate for CI(29) is more than 1.5 timesgreater than a linear relationship to the increasingconcentration of di-PEs, which indicates a preference
TABLE 3Sample Surface Analysis After Removal from Experimental Conditions After 28 d Using ME-Containing Inhibitors with Varied
Ratios of Mono- to Dinonylphenol PE at 200 ppm(A)
InhibitorSample After Removal ofCorrosion Product Layer
Representative SurfaceFeatures by SEM
CorrosionInformation
CI(17)
90:10with MEat 200 ppm
No localizedmaterial loss.Weight loss
corrosion rate:0.0049 mm/y(0.19 mpy).
CI(18)
70:30with MEat 200 ppm
No localizedmaterial loss.Weight loss
corrosion rate:0.0027 mm/y(0.11 mpy).
CI(19)
50:50with MEat 200 ppm
No localizedmaterial loss.
Profilometer depthmeasurements
were less than 10 μmdepth. Weight losscorrosion rate:0.0026 mm/y(0.10 mpy).
(A) 70°C, 3.4 wt% brine solution, 1 bar (100 kPa) total pressure, continuous purge with CO2, pH 6.
CORROSION—Vol. 71, No. 12 1505
CORROSION SCIENCE SECTION
for using higher mono- to di-PE ratios for inhibitors tobe used in UDC mitigation.
The surface tension measurements conductedwith the solution from the end of each experiment wereto be used to measure the concentration of residualinhibitor and to observe any differences in concentra-tion for explanation of inhibitor losses during eachexperiment. Although the measured amount of residualinhibitor in solution at the end of each experimentwas less than 50% of the original concentration, therewas little difference in the overall measured concen-trations of residual inhibitor (43±3%) from all eightexperiments. This negated the possibility that achange in inhibitor concentration would influencewhich X65 samples experienced localized corrosion.
Overall, it was understood that a 200 ppm in-hibitor concentration was too high to observe the effectof changing parameters with ME present, but,
without ME, it was observed that the ratio of mono- todi-PEs did have an effect on mitigation of localizedcorrosion initiation. This led to a second set of experi-ments at a lower inhibitor concentration in order toconfirm the results of Set 1 and to observe if the pittingrate would increase by challenging the inhibitors at alower dosage.
Set 2Sample Analysis — All of the samples that were
electrochemically monitored with the sand depositin place for the second set of experiments are shown inTable 6. At a 100 ppm concentration of inhibitor insolution, the corrosion samples that were exposed toUDC conditions for the nonylphenol PE without MEhad localized corrosion features ranging from 55 μm to113 μm in depth (Table 6). With one half of theinhibitor concentration from Set 1, the general weight
TABLE 4Sample Surface Analysis After Removal from Experimental Conditions After 28 d Using Inhibitors Without ME at Varied Ratios of
Mono- to Dinonylphenol PE at 200 ppm(A)
InhibitorSample After Removal ofCorrosion Product Layer
Representative SurfaceFeatures by SEM
CorrosionInformation
CI(27)
90:10no MEat 200 ppm
Localized material lossfound at 15 μm depth.
Penetration rate: 0.2 mm/y.Weight loss corrosion rate:0.0032 mm/y (0.13 mpy).
CI(28)
70:30no MEat 200 ppm
Localized material lossfound at 45 μm depth.
Penetration rate: 0.6 mm/y.Weight loss corrosion rate:0.0066 mm/y (0.26 mpy).
CI(29)
50:50no MEat 200 ppm
Localized material lossfound at 120 μm depth.
Penetration rate: 1.75 mm/y.Weight loss corrosion rate:0.0052 mm/y (0.020 mpy).
(A) 70°C, 3.4 wt% brine solution, 1 bar (100 kPa) total pressure, continuous purge with CO2, pH 6.
1506 CORROSION—DECEMBER 2015
CORROSION SCIENCE SECTION
loss increased by a factor of 3 for CI(28) to a factor of10 for CI(26). Although the general weight loss for eachsample exposed to an inhibitor with a PE was still lessthan 0.025 mm/y (1 mpy), there was a significantincrease in the amount of localized corrosion as theratio of mono- to di-PE decreased from 70:30 to 50:50.This is the same phenomenon that was observed forthe same inhibitors at a 200 ppm concentration insolution.
The samples taken from the experiment with CI(29) at 100 ppm are shown in Figures 6 and 7. Thesesamples were removed from the experiment andcarefully rinsed with deoxygenated isopropyl alcohol
before being photographed. The sand is shown on theelectrochemical sample in the image at the bottom ofFigure 6. The same electrochemical sample after itsrecovery from the sample holder with the sand removedis shown in Figure 7. The intact corrosion productlayer shows the locations where pitting and localizedcorrosion occurred. Profilometer measurements inFigure 8 were conducted after the corrosion product wasremoved and show themaximumpit penetration to be113 μm, which is equivalent to 1.5 mm/y penetrationrate. The weight loss sample used for comparisonwithout sand or electrochemical measurements (topof Figure 6) did not have any localized corrosion.
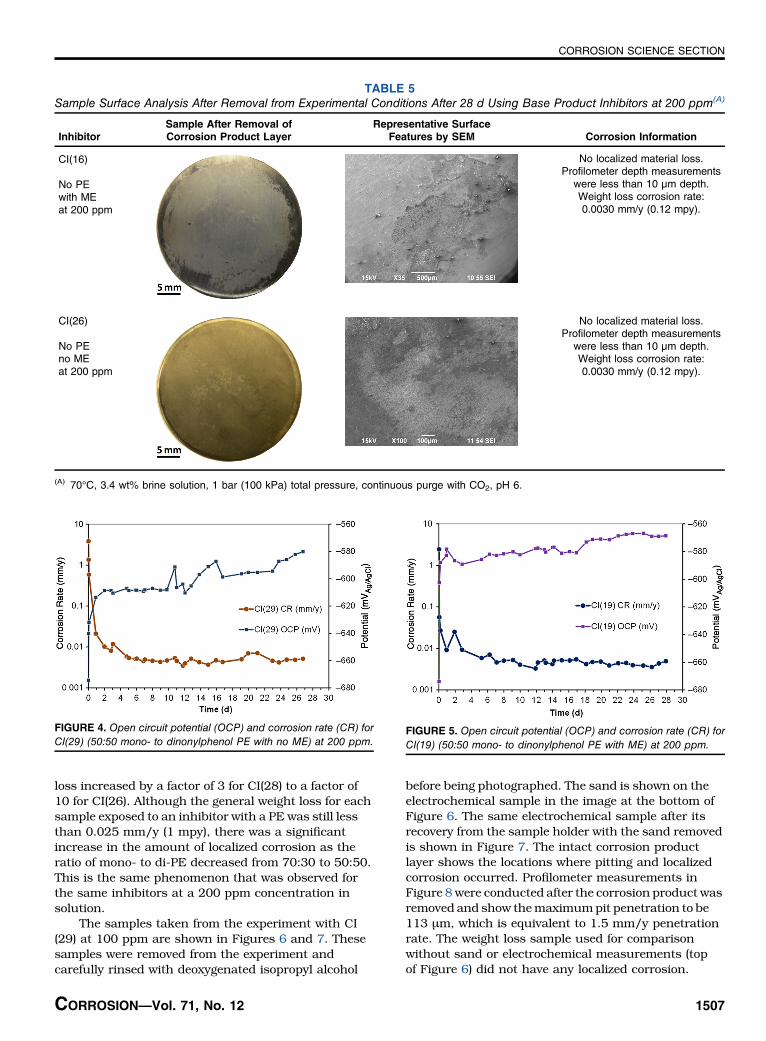
TABLE 5Sample Surface Analysis After Removal from Experimental Conditions After 28 d Using Base Product Inhibitors at 200 ppm(A)
InhibitorSample After Removal ofCorrosion Product Layer
Representative SurfaceFeatures by SEM Corrosion Information
CI(16)
No PEwith MEat 200 ppm
No localized material loss.Profilometer depth measurements
were less than 10 μm depth.Weight loss corrosion rate:0.0030 mm/y (0.12 mpy).
CI(26)
No PEno MEat 200 ppm
No localized material loss.Profilometer depth measurements
were less than 10 μm depth.Weight loss corrosion rate:0.0030 mm/y (0.12 mpy).
(A) 70°C, 3.4 wt% brine solution, 1 bar (100 kPa) total pressure, continuous purge with CO2, pH 6.
FIGURE 4. Open circuit potential (OCP) and corrosion rate (CR) forCI(29) (50:50 mono- to dinonylphenol PE with no ME) at 200 ppm.
FIGURE 5. Open circuit potential (OCP) and corrosion rate (CR) forCI(19) (50:50 mono- to dinonylphenol PE with ME) at 200 ppm.
CORROSION—Vol. 71, No. 12 1507
CORROSION SCIENCE SECTION

As compared to similar samples tested with nonylphe-nol PE at different mono- to di- ratios, the weightloss corrosion rate was higher for inhibitor CI(26)without PE at 100 ppm (Table 6). This was alsothought to be the reason for a minimal amount oflocalized corrosion on this sample, which was aboutthe same as the 90:10 mono- to dinonylphenol PE whentaking into account the increase in general corro-sion rate.
Electrochemical Measurements — The second set ofexperiments was conducted identically to the first setwith the OCP, Rp, and EIS data collected on a daily basisover the 28-d experimental duration. The Rs wasdetermined from EIS analysis and used to correct thecorrosion rate calculations. After 2 h of pre-corrosionwith initial corrosion rates at 3.1±0.5 mm/y, a partialcoverage of sand was added to the electrochemicalsample and then the inhibitor. Review of the OCP data
TABLE 6Sample Surface Analysis After Removal from Experimental Conditions After 28 d Using Inhibitors Without ME at Varied Ratios of
Mono- to Dinonylphenol PE or no PE at 100 ppm(A)
InhibitorSample After Removal ofCorrosion Product Layer
Representative SurfaceFeatures by SEM Corrosion Information
CI(26)
No PEno MEat 100 ppm
Localized material lossfound at 55 μm depth.
Penetration rate: 0.72 mm/y.Weight loss corrosion rate:0.030 mm/y (1.18 mpy).
CI(27)
90:10no MEat 100 ppm
Localized material lossfound at 65 μm depth.
Penetration rate: 0.85 mm/y.Weight loss corrosion rate:0.014 mm/y (0.55 mpy).
CI(28)
70:30no MEat 100 ppm
Localized material lossfound at 99 μm depth.
Penetration rate: 1.3 mm/y.Weight loss corrosion rate:0.020 mm/y (0.79 mpy).
CI(29)
50:50no MEat 100 ppm
Localized material lossfound at 113 μm depth.
Penetration rate: 1.5 mm/y.Weight loss corrosion rate:0.017 mm/y (0.67 mpy).
(A) 70°C, 3.4 wt% brine solution, 1 bar (100 kPa) total pressure, continuous purge with CO2, pH 6.
1508 CORROSION—DECEMBER 2015
CORROSION SCIENCE SECTION

over the 28 d of the experiment with inhibitor CI(28)(Figure 9) and inhibitor CI(29) (Figure 10) did not give aclear indication whether or not pitting occurredduring the experiment, although both experiencedfluctuations in the OCP greater than 10 mV. Theelectrochemical sample with CI(28) had a maximumpotential fluctuation of 15.3 mV during the last 20 dof the experiment, while the sample with CI(29) had amaximum potential fluctuation of 11.7 mV. Both ofthese inhibitors showed similar trends in corrosion rate,
solution resistance, and OCP measurements,although the results were quite different.
Effect of Inhibitor Components — The general cor-rosion rate for all four experiments at 100 ppm in-hibitor had values that were a factor of 3 to 10 timeshigher than at 200 ppm. Inhibitors CI(26) (baseproduct), CI(27) (90:10 mono- to di-PE), and CI(28)(70:30 mono- to di-PE) experienced deeper penetra-tion rates for localized corrosion at 100 ppm than at200 ppm concentration, but all of these had limitedonset of localized events (one to three pits). InhibitorCI(29) (50:50 mono- to di-PE) failed to protect thesurface of the sample under the individual sand grains.There was so much difference between the CI(29) at100 ppm and the other three inhibitors tested in Set 2that it proves a major decrease in mitigation of UDCoccurs between the 70:30 mono- to di-PE and the 50:50mono- to di-PE.
Residual inhibitor concentration at the end of theSet 2 experiments was measured at 34±5% of theoriginal concentration in the bulk solution. But thisdecrease of excess inhibitor available in the bulk
FIGURE 6. Samples in sample holder “as-removed” from the exper-iment for inhibitor CI(29) at 100 ppm.
FIGURE 7. Electrochemical sample with corrosion product layer afterremoval of the sand particles for the experiment with inhibitor CI(29)at 100 ppm.
FIGURE 8. Profilometer measurements of localized corrosion atdepths of 101 μm, 98.4 μm, and 61 μm, respectively, found onelectrochemical sample after experiment with inhibitor CI(29) at100 ppm.
FIGURE 9. Open circuit potential (OCP) and corrosion rate (CR) forCI(28) (70:30 mono- to dinonylphenol PE with no ME) at 100 ppm.
CORROSION—Vol. 71, No. 12 1509
CORROSION SCIENCE SECTION
solution, again, did not have any correlation to theobservations of localized corrosion, which negates thepossibility that a change in bulk inhibitor concen-tration during the experiments would influence whichX65 samples experienced localized corrosion.
CONCLUSIONS
v The presence of 2-mercaptoethanol (ME) almost al-ways assisted the nonylphenol PE inhibitors to havebetter performance. When such a sulfur-containingcompound was present in the inhibitor used at 200 ppmby volume, no localized corrosion was observed.v Localized corrosion (pit penetration rate) increasedfor nonylphenol PEs without ME as the amount ofdiphosphate esters became equivalent to the concen-tration of monophosphate esters: CI(27) (90:10mono- todi-PE) 15 μm pitting, CI(28) (70:30 mono- to di-PE)45 μmpitting, and CI(29) (50:50mono- to di-PE) 120 μmpitting, which indicates a preference for using highermono- to di-PE ratios in inhibitor formulations to beused in UDC mitigation.v The 50:50 mono- to dinonylphenol PE inhibitor, CI(29), at 100 ppm concentration failed to protect thesurface of the sample under the individual sand grains.v From this research, it is seen that the mono- todiphosphate ester ratio is important to consider whendeveloping corrosion inhibitors containing phosphateesters, which may be added to attend to multiple
corrosion threats, to mitigate UDC. A higher mono- todiphosphate ester ratio increases the efficacy in UDCinhibition and in turn enhances the versatility of theproduct, enabling it to be used under a wider range ofoperating environments.
ACKNOWLEDGMENTS
This research was conducted at the Institute forCorrosion and Multiphase Technology, Ohio University,with financial support and cooperation by NALCOChampion. The authors would like to thank NALCOChampion for permission to present these results.
REFERENCES
1. X. Landry, A. Runstedtler, S. Papvinasam, T. Place, Corrosion 68,10 (2012): p. 904-913.
2. A. Runstedtler, P. Boisvert, T. Place, Corrosion 71, 6 (2015):p. 726-734.
3. J. Huang, “Mechanistic Study of Under Deposit Corrosion of MildSteel in Aqueous Carbon Dioxide Solution” (Ph.D. diss., OhioUniversity, 2013).
4. J. Vera, D. Daniels, M. Achour, “Under Deposit Corrosion (UDC) inthe Oil and Gas Industry: A Review of Mechanisms, Testing andMitigation,” CORROSION 2012, paper no. 1379 (Houston, TX:NACE International, 2012).
5. M.M. Salama, “Influence of Sand Production on Design andOperations of Piping Systems,” CORROSION 2000, paper no. 80(Houston, TX: NACE, 2000).
6. J.S. Smart, Pipeline & Gas J. 231, 10 (2004): p. 28-30.7. J. Marsh, J.W. Palmer, R.C. Newman, “Evaluation of Inhibitor
Performance for Protection Against Localized Corrosion,” COR-ROSION 2002, paper no. 288 (Houston, TX: NACE, 2002).
8. A. Pedersen, K. Bilkova, E. Gulbrandsen, J. Kvarekvål, “CO2
Corrosion Inhibitor Performance in the Presence of Solids:Test Method Development,” CORROSION 2008, paper no. 632(Houston, TX: NACE, 2008).
9. G. Hinds, A. Turnbull, Corrosion 66, 4 (2010): p. 046001-1 to046001-10.
10. Y. Tan, Y. Fwu, K. Bhardwaj, Corros. Sci. 53 (2011): p. 1254-1261.11. B. Alink, B. Outlaw, V. Jovancicevic, S. Ramachandran, S.
Campbell, “Mechanism of CO2 Corrosion Inhibition by PhosphateEsters,” CORROSION 1999, paper no. 037 (Houston, TX: NACE,1999).
12. A.J. O’Lenick, J.K. Parkinson, Textile Chemist & Colorist 27,11 (1995): p. 17-20.
13. S. Smith, correspondence to author, August 2014.14. R. Barker, B. Pickles, A. Neville, “General Corrosion of X65 Steel
Under Silica Sand Deposits in CO2-Saturated Environmentsin the Presence of Corrosion Inhibitor Components,” CORROSION2014, paper no. 4215 (Houston, TX: NACE, 2014).
15. ASTM Standard G1, “Standard Practice for Preparing, Cleaning,and Evaluating Corrosion Test Specimens” (West Conshohocken,PA: ASTM International, 2003).
16. J.J. Moloney, W.Y. Mok, C.M. Menendez, Corrosion 66, 6 (2010):p. 065003-1 to 065003-18.
FIGURE 10. Open circuit potential (OCP) and corrosion rate (CR) forCI(29) (50:50 mono- to dinonylphenol PE with no ME) at 100 ppm.
1510 CORROSION—DECEMBER 2015
CORROSION SCIENCE SECTION