comparison of nysdec sample splits - sampling, analysis … · sediment and water sampling during...
TRANSCRIPT

SDMS Document
•
110740
Attachment B
Comparison of NYSDEC Sample Splits Sampling, Analysis & Monitoring Plan
St. Lawrence - Grasse River Site Site Code 6-45-015
Reynolds Metals 106 Order
Reynolds Metals Company performed St. Lawrence and Raquette River sediment and water sampling during September 1990 in accordance with an EPA approved Sampling, Analysis and Monitoring Plan dated December 1989 as amended in May 1990 and supplemented in July 1990.
This work, which was required by an EPA unilateral (106) order under CERLA, was conducted by Woodward-Clyde Consultants on behalf of Reynolds Metals.
NYSDEC personnel (George Momberger and Jim Reagan) were present during much of this sampling activity and collected splits of sediment and water samples.
A total of seventeen samples were split between Woodward-Clyde and NYSDEC; five aqueous samples and twelve sediment samples (see pages B-5 through B-8). The dates and locations of the split samples are detailed in the attached Table 1. The collection procedures and the analytical results are presented in the Draft Additional River Sampling Report St. Lawrence River System, prepared by Woodward-Clyde Consultants for the Reynolds Metals Co. and received by the Department in January of 1991.
A comparison of the analytical results of the split samples is presented in the following tables.
I. Sediment Samples:
A. PAH's: TABLE 2
The polynuclear aromatic hydrocarbons were analyzed by USEPA Method 8270.
(1) Samples 3B-9/1, 38-12, 3B-13/2 and 3C-4/1 collected from areas of low ppm PAH contamination show the highest degree of correlation, most analytes being reported as non-detected or present below the CRQL.
73 m
< o o
B-1 ^

(2) Samples 3B-1/2, 3B-2/1 and 38-4/1 were collected from areas of high contamination and exhibit a greater degree of variability; in particular NYSDEC results are, on occasion, significantly greater for particular analytes than the corresponding results from Woodward-Clyde.
Total Results PAH
3B-2/1 3B-4/1 3B-1/2
PCB's: TABLE 3
NYSDEC (ppm) 7570 705 2391
WC (ppm) 3730 215 1355
The PCB splits compare favorably on a qualitative basis; NYSDEC split samples with detectable concentration of PCB's have detectable levels of PCB's in the Woodward-Clyde data.
The quantitative results exhibit some variability with the greatest difference at sample location 3A-10/2.
Metals: TABLE 4
The inorganics data from splits analyzed by NYSDEC contract lab compares favorably with the data presented by Woodward-Clyde for Al, F- and CN-. The balance of inorganic analytes (As, Cd, Cr, Hg, Pb and Ni) were not analyzed for in the Woodward-Clyde samples, therefore no comparison can be conducted. However, the levels of these analytes in the samples collected from areas of high PAH/PCB contamination are not significantly higher than the levels in samples from what are thought to be relatively "uncontaminated" areas.
II. Aqueous Samples: TABLE 5
A. PAH:
There were no PAH's detected in either the Woodward-Clyde samples or the NYSDEC split samples.
B. PCB's:
NYSDEC split samples analyzed by DOH for locations WA-2, WB-2 and WC-2 collected from the St. Lawrence reported PCB total concentrations of 0.033, 0.054 and 0.021 ppb respectively. Woodward-Clyde reported non-detect at 0..065 ppb for these three samples. It should be noted that NYSDEC data for these samples from Versar also reported non-detect at 0.5 ppb for 1015, 1221, 1232, 1242, 1248 and 1.0 ppb for 1254, 1260.
PCB's were not detected by NYSDEC split samples from the Raquette River at locations W5-1 and W5-2 (by both Versar and DOH). Woodward-Clyde reported 2.3 ppb at W5-1 and non-detect (0,065 ppb) for W5-2.
B-2
73 m < o o fV)
o Nj

The fact that PCB's were not detected in sample W5-1 by either Versar or DOH would indicate that the number reported by Woodward-Clyde is suspect. Further investigation may be required to address this anomilie.
C. Inorganics:
The inorganic results compare favorably for all analytes with one exception: NYSDEC results for WA-2 reports 280 ppb CN-, Woodward-Clyde reports 3500 ppb for CN-,
73 m <
o o
B-3 o Nl
NJ

TABLE 1
Sanple
Suffix
01 02 03 U4 05 06 07 08 09 10
11 12 13 14 15 16 17
NYSDEC Split. Samp]
Station
ID
3B-13/2
3B-1/2
3B-22/2
3C-4/1
3B-9/3
3B-9/1
3B-1/2
3B-4/1
3B-2/1
UK-2
HB-2
WC-2
W5-2**
W5-1**
3(L3/2
5-11
3A10/2
Matrix
sed sed sed sed sed sed sed sed sed water
water
water
water
water
sed sed sed
es / Reynolds
Date
Collected
9/12/90
9/25/90
9/12/90
9/12/90
9/20/90
9/20/90
9/20/90
9/21/90
9/20/90
9/21/90
9/22/90
9/22/90
9/24/90
9/24/90
9/24/90
9/24/90
9/25/90
i Metals 10(
Core
Depth
8"-16"
8-16"
0-8"
16-24"
0-8"
8-16"
0-8"
p-8" NA NA NA NA NA 8-16"
8-16"
> SAMP Field Investigation
DOH Sample ID
congener
PCB
903299
903301
903300
903383
903382
8270
PAH
X X X X X X X X X
X X X
- Septei onber 1990
Versar Analyses Requested
8080
PCB
X X
" X
X X X X X X
X X X
Netals*
X X X X X X X X X
X X X
CN
X X X
X
F
X X X X X X X X X X X X X
CLP,BNA,PCB,Hetals
aP,BNA,PCB,Hetals
aP,BNA,PCB,Netals
CLP,BNA,PCB,Netals
CLP,BNA,PCB,Hetals
817 ^0 200 A3y •Aa, A l , Cd, Cr, Mg, N i , Pb
' " Raquette River Samples

TABLE 2 PAH - NYSDEC/Reynolds (WC) Split Comparison
3A-3/2 3A-10/2 .36-1/2 36-2/1 3B-4/1 36-9/1 3B-9/3 36-12 38-13/2 3B-22/2 3C-4/1 5-11
Naphthalene DEC 3.3u 2.8u 3.2u 64u 2.1u 2.6u 2.4u 3.0u 1.3u 1.9u 1.4u 1.4u
ppm WC NA NA 15u 70u 3.5u 4.6u NA 3.4u 0.9u NA 14u NA
Acenapnthylene
ppn
Acenaphthene
ppm
Fluorene
ppm
Phenanthrene
ppm
Anthracene
ppm
Fluoranthene
ppm
Pyrene
ppm
Benzo(a)Anthra
ppn
Chrysene
ppm
DEC WC
DEC WC
DEC WC
DEC WC
DEC WC
DEC WC
DEC WC
cene DEC
WC
DEC WC
3.3u
NA
3.3u
NA
3.3u
NA
3.3u
NA
3.3u
NA
3.3u
NA
2.8J
NA
i.sj'x
NA
4.6 NA
2.8u
NA
2.8u
NA
2.6u
NA
2.8u
N&
2.8u
NA
I.IJ
NA
0.84J
NA
1.3J
NA
3.0 NA
3.2u
15u
10 4.4J
11 4.4J
9.9 40
41 26
390 210
300 130
200 34
430 210
64u 70u
51J 16J
31J IIJ
280 120
99 42J
1000
540
1000
450
640 240
1500
580
2.1u
3.5u
3.1 3.5u
4.4 3.5u
26 0.6J
13 0.4J
88 1.8J
71 1.3J
62 1.4J
170 4.6
2.6u
4.6u
2.6u
4.6u
2.6u
4.6u
2.6u
4.6u
2.6u
4.6u
2.6 1.4J
1.9J
0.9J
2.4J
I.IJ
5.9 2.5J
2.4u
NA
2.4u
NA
2.4u
NA
2.4u
NA
2.4u
NA
2.4u
NA
2.4u
NA
2.4u
NA
2.4u
NA
3.0u
3.4u
3.0u
3.4u
3.0 3.4u
3.0u
2.5J
3.1 1.9J
33 18
33 13
30 17
65 41
1.3u
0.9u
1.3u
O.llJ
1.3u
0.17J
1.3u
0.95
0.42J
0.72J
1.9 2.8
1.9 2.3
0.9J
1.2
2.7 3.6
1.9u
NA
l.OJ
NA
2.0 NA
2.0 NA
3.1 NA
12.6
NA
12.6
NA
7.3 NA
16.5
NA
1.4u
14u
1.4u
14u
1.4u
14u
1.4u
14u
1.4u
14u
1.4u
0.07 J
1.4u
0.053J
1.4u
0.08J
0.6J
0.25 J
1.4a
NA
1.4u
NA
1.4u
NA
1.4u
NA
1.4u
NA
0.6J
NA
0.6J
NA
1.4u
NA
1.8 NA
•
6t'Z0 200 A3a
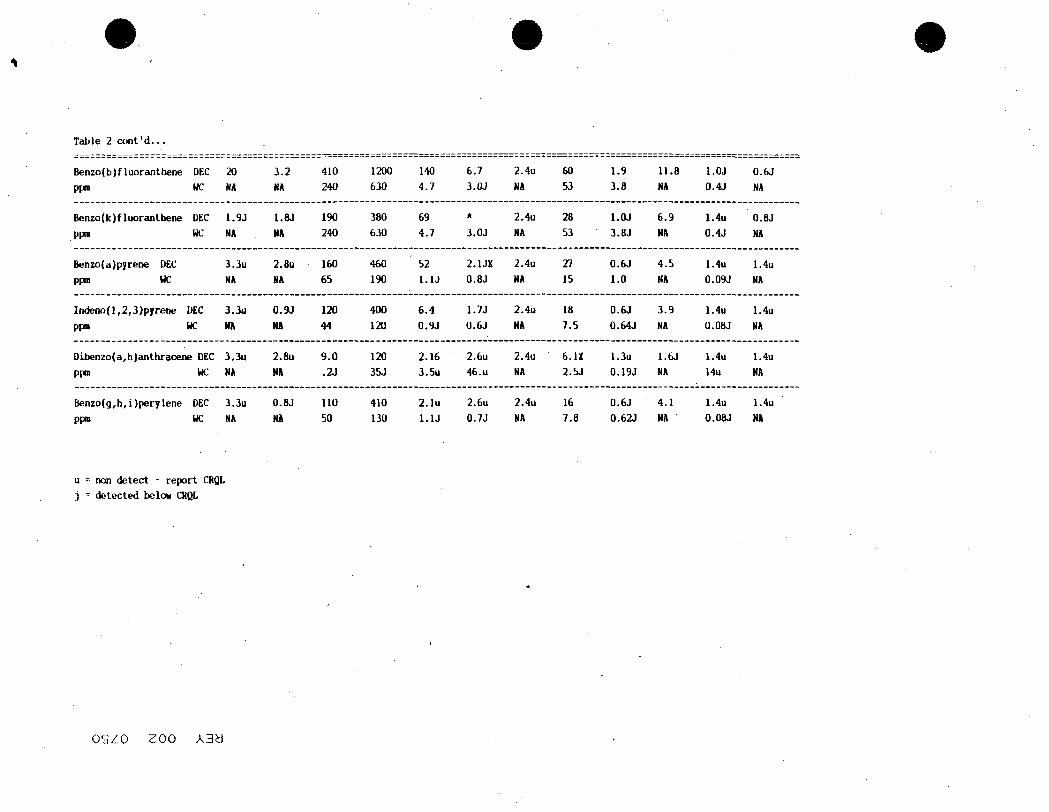
Table 2 cont'd...
Benzo(b)fluoranthene DEC 20
ppm WC NA
3.2 NA
410 240
1200
630 140 4.7
6.7 3.0J
2.4u
NA 60 53
1.9 3.8
11.8
NA l.OJ
0.4J
0.6J
NA
Benzo(k)fluoranthene DEC
ppm WC
Benzo(a)pyreDe DEC
ppm WC
IndeDo(l,2,3)pyrene DEC
ppm WC
Oibenzo(a,h)anthracene DEC
ppm WC
1.9J
NA
3.3u
NA
3.3u
NA
3.3u
NA
1.8J
NA
2.8u
NA
0.9J
NA
2.8u
NA
190 240
160 65
120 44
9.0 .2J
380 630
460 190
400
120
120 35 J
69 4.7
52 I.IJ
6.4 0.9J
2.16
3.5u
*
3.0J
2.1JX
0.8J
1.7J
0.6J
2.6u
46.u
2.4u
NA
2.4u
NA
2.4u
NA
2.4u
NA
28 53
27 15
18 7.5
6.IX
2.5J
l.OJ
3.8J
0.6J
1.0
0.6J
0.64J
1.3u
0.19J
6.9 NA
4.5 NA
3.9 NA
1.6J
NA
1.4u
0.4J
1.4u
0.09J
1.4u
0.08J
1.4u
14u
0.8J
NA
1.4u
NA
1.4u
NA
1.4u
NA
Benzo(g,h,i)perylene DEC 3.3u 0.8J
ppm WC NA NA
u - non detect - report CRQL
j = detected below CRQL
110 50
410 130
2.1u
I.IJ
2.6u
0.7J
2.4u
NA 16 7.8
0.6J
0.62J
4.1 NA
1.4u
0.08J
1.4u
NA
OSZO 200 A3y

•
TABLE 3
NYSDEC/WC PCB Split Sample Confiarison - River Sediments (Results in ppm)
1016
ppm
1221
1Z52
1242
1248
1254
1260
DEC WC
DEC
WC
DEC
WC
DEC WC
DEC WC
DEC
WC
DEC
WC
3A-3/2
0.5u
NA
0.5u
NA
<0.5
NA
<0.5u
< "*
<0.5u
NA
<1.0u
NA
<1.0u
NA
3A-10/2
1.0
0.5
3B-1/2
200 270
3B-2/1
190 300
150J
100
3B-4/1
32
3B-9/1
2.4 5.1
3B-9/3
0.5u
0.5u
0.5u
O.Su
0.31J
0.5u
l.Uu
l.Ou
JB-12
15
3.8
3B-13/2
20.0
3B-22/2
32.0
22.0
3C
0.
0.
:-4/i
26
14J
5-11
0.13U
0.13U
0.13U
0.13U
0.13U
0.13U
0.13U
TOTAL DEC 15.0* 51.0» 8.0* 19.0* 0.4* <1.0u
* = Webb/McCall Method for Quant. / Individual Arochlors could not be identified,
u - non delected - report CRQL
rszo Zoo A3^
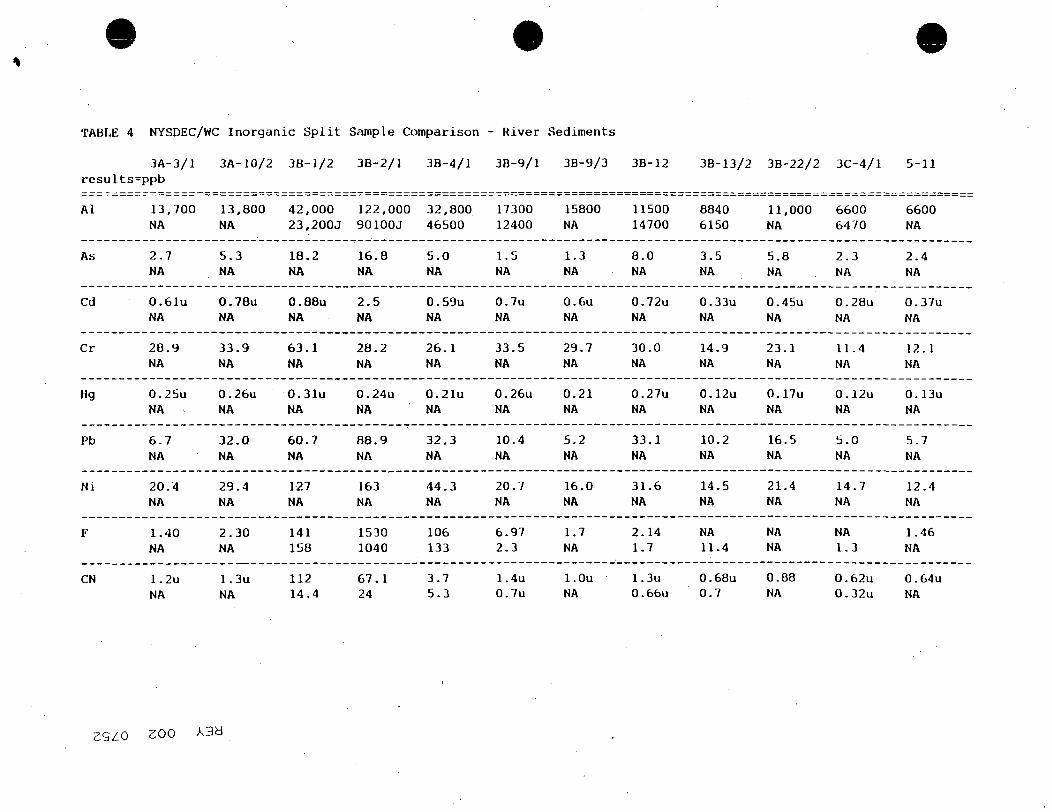
TABLE 4 NYSDEC/WC Inorganic Split Sample Comparison - River Sediments
3A-3/1 3A-10/2 3B-1/2 3B-2/1 3B-4/1 3B-9/1 3B-9/3 3B-12 results=ppb
3B-13/2 3B-22/2 3C-4/1 5-11
Al 13,700 13,800 42,000 122,000 32,800 17300 15800 11500 NA NA 23,200J 90100J 46500 12400 NA 14700
8840 11,000 6600 6600 6150 NA 6470 NA
As
Cd
Cr
Hg
Pb
Ni
F
2.7 NA
0.61U NA
20.9 NA
0.25U NA
6.7 NA
20.4 NA
1.40 NA
5.3 NA
0.78U NA
33,9 NA
0.26u NA
32.0 NA
29.4 NA
2.30 NA
18.2 NA
0,88u NA
63.1 NA
0,31u NA
60.7 NA
127 NA
141 158
16.8 NA
2.5 NA
28.2 NA
0.24U NA
88.9 NA
163 NA
1530 1040
5.0 NA
0.59U NA
26.1 NA
0.21U NA
32.3 NA
44.3 NA
106 133
1.5 NA
0.7u NA
33.5 NA
0.26U NA
10.4 NA
20.7 NA
6.97 2.3
1.3 NA
0.6u NA
29.7 NA
0.21 NA
5.2 NA
16.0 NA
1.7 NA
8.0 NA
0.72U NA
30.0 NA
0.27U NA
33.1 NA
31.6 NA
2.14 1.7
3.5 NA
0.33U NA
14.9 NA
0.12U NA
10.2 NA
14.5 NA
NA 11.4
5.8 NA
0.45U NA
23.1 NA
0.17U NA
16.5 NA
21.4 NA
NA NA
2.3 NA
0.28U NA
11.4 NA
0.12U NA
5.0 NA
14.7 NA
NA 1.3
2.4 NA
0.37U NA
12.1 NA
0.13U NA
5.7 NA
12.4 NA
1.46 NA
CN 1.2u 1.3u 112 67.1 3.7 NA NA 14.4 24 5.3
1.4u 0.7u
l.Ou NA
1.3u 0.66U
0.68U 0.7
0.88 NA
0.62u 0.32U
0.64U NA
39Z0 200 A3a

TABLE 5 Aqueous Splits
PCB (Total) ppb
Al ppb As Cd Cr Hg Pb Ni F CN
WA-2 DEC
<u 0.033*»
143 3.0u 3.0u 3.0U 0.2u 1.7B 5.0u 280 NA
WC
<0.065
149B 2.0U 3,0u 4.0u 0,2u 2,5B lOu 3500 lOu
WB-2 DEC
<u 0.054**
93,7u 3.0u 3,0u 3.0u 0,2u 2,3B 5.0u 7800 11.9
WC
<0,065
735 2,2B 3,0u 4,0u 0.2u 2,9B lOu 1400 lOu
WC-2 DEC
<u 0,021**
72.7 3,0u 3.0u 3.0u 0.2u 16,2 5.0u lOOu lOu
WC
<0.065
NA NA NA NA NA NA NA NA NA
W5-2 DEC
<u <0.003**
95,3 3,0u 3.0u 3.0u 0.2u NA 5.0u lOOu lOu
WC
<0.065
101 2,0u 3.0u 4.0u 0,2u 2,0u lOu lOOu lOu
Wb-1 DEC
<u <0,003**
168 3.0u 3.0u 3.0u 0.2u NA 5.0u lOOu lOu
WC
<0.065
85.6 2.0u 3.0u 4.0u 0.2u 2.0u lOu lOOu lOu
* u for PCB analysis by Versar = 0.5 for 1016, 1221, 1232, 1242, 1248 and 1.0 for 1254, 1260
** DOH - congener specific analysis - total of congeners
u = non detected - report CRQL B = detected below CRQL, and above IDL
eSZO 200 A3y

Conclusions:
The sediment data from NYSDEC compares favorably with the data provided in Draft Additional River Sampling Report. The quantitative differences are based on the heterogeneous nature of the river sediment and impact only the delineation of contamination contours. The differences in data are not sufficient to impede either the selection of remedial alternatives or the evaluation of environmental impacts.
The water column split samples data provides a good correlation between NYSDEC splits and Woodward-Clyde results. However the data for PCB concentrations exhibits qualitative differences based on the detection limit of the respective analytical protocol.
NYSDEC data from samples collected in the St. Lawrence indicates low level PCB concentrations (50-20 ppt) whereas WC data reports no PCB's at a detection limit of 65 ppt.
These differences lead to questioning of WC's conclusions concerning low level PCB's for both the St. Lawrence River aqueous data and the elutriate test procedure conclusions.
cc: J. Reagan; M. Serafini B, Daigle
•
73
m
o
o Ni

B-5
-0-.. RCD BUOY
LECCND
CHANNEL MARGIN
1988 SAMPLING
• •
o
. •''
coot SAupies
CRAB SAMPICS
OUITAU.
BOUNOARV or StUO* ARtAS
roFAi pce« CRCAIIR THAN
1990 SAMPLING 1
«
B7/i
X
-f
SEDIMeNT SAMPt£ LOCATION
LOCATION N O / NO. or SAUPUS
WATER SAMPLES
SEOiMCNT SAMPLES TO WaUOE ELUTRIATE TESTING
S. CORNWALL CHANNEL - ST. LAWRENCE RIVER
CHANNEL MARGIN
0 200 400
I i- 4 SCAlt IN f t t i
9gZ0 ZOO A3d

LL^ENO:
SAMPLE LOCATION
REYNOLDS MEIALS COMPANY MASSENA. NEW YO«K
© WOODWARD-CLYDE CONSULTANTS Con«.ll»iS Cn^lnM**. CMri^^l.t. an« Cn^annttntm icJm\imt»
RAQUETTE RIVER SAMPLE LOCATIONS
* * Ho: aiiC}»i-4 I k«k« tte U I M I M Oal« l l / I I / M
FIGURE 9
93 10 300 A3y 8-6-

^SZO 200 A3y
B-7

B.8
>' '^' ' - ' ' WC
TFAL'l2r~~%A
REYNOLDS METALS COMPANY MASSENA, NEW YORK
WOODWARD-CLYDE CONSULTAI Contulling Cnqirymr%. C«olo^iaU ond EnMranm«nlal S.
ST. LAWRENCE RIVER SEDIMENT SAMPLING PROGRAM
DETAIL AREA SAMPLE LOCATIONS
Ora<n9 No. 9SIM)2II
89Z0 200 A3a AS NOTEO
OalK 11/9/
FIGURi