comparison of power enhancement options for greenfield
TRANSCRIPT

Thomas C. Tillman, PE Vice President Strategic Development
Turbine Air Systems, Ltd 4300 Dixie Drive
Houston, TX 77021 713-877-8700 [email protected] www.tas.com
Comparison of Power Enhancement Optionsfor Greenfield Combined Cycle Power Plants
Rev 02, February 2004
Originally Presented at PowerGen International 2003 Las Vegas, NV, USA 10 December 2003

Comparison of Power Enhancement Options For Green-Field Combined Cycle Power Plants Rev 02, February 2004
1
Purpose
Turbine Air Systems (TAS) began this effort in early 2002 with the concept of studying the relative impact of several options of power augmentation for new "Greenfield" combined cycle plants. We undertook this effort in response to several of our customers, who expressed confusion regarding the competing claims of many power augmentation vendors who sometimes made assertions that were difficult to back up.
Our customers were also largely unaware that during the past five years, the cost of inlet chilling has dropped dramatically, and that the efficiency and maturity of these systems has increased significantly. Thus, many of the previously held assumptions of otherwise well-intentioned people needed to be challenged with new data that reflected the state-of-the-art (2002 data).
Our goal was to develop a methodology that would allow a project developer, an engineering contractor, or a gas turbine OEM to be able to clearly understand the inputs and assumptions that we would model, and more importantly, to be able to use independent and commercially available software to re-create the same results.
The role of TAS was to set the overall concept of the study. An independent engineering company ran the cases that TAS requested, using the industry-standard GTPro suite of software. Our goal has been to maintain maximum credibility throughout the development of this material through the collaboration of a third party engineering firm.
This narrative makes a case for the relative success of chilling technology versus fogging technology. Our narrative also describes the related benefits of supplemental duct firing.

Comparison of Power Enhancement Options For Green-Field Combined Cycle Power Plants Rev 02, February 2004
2
Introduction The purpose of this paper is to explore the economic and performance implications of several common forms of power enhancement for combined cycle power plants. Options compared are:
• Turbine inlet air cooling using fogging (evaporative cooling) • Turbine inlet chilling (TIC) using mechanical chillers (refrigeration) • HRSG supplemental duct firing
Many claims have been made for various power augmentation systems. The inspiration for this paper is to provide documentation based on commercially available third-party modeling software. Thus, the results in this study should be repeatable by individuals attempting to perform similar analyses. Such repeatability by readers of this paper should be able to dispel any potential bias provided by the power augmentation equipment vendors.
Simplified illustration of duct-burner system,
shown at left
A typical spray-impingement fog nozzle is shown at left. The resulting fog stream is shown at right. Evaporation of the fog spray into the air causes the air temperature to drop.

Comparison of Power Enhancement Options For Green-Field Combined Cycle Power Plants Rev 02, February 2004
3
The impacts on power output and heat rate, as well as the capital cost of the plant, in both absolute and in incremental terms, are calculated for various scenarios. The results will show several important design aspects for turbine inlet cooling by means of mechanical chillers:
• The incremental cost per kW for output attributed to chiller systems is vastly superior to the base plant unit cost.
• The perceived gap in installed cost between chillers and foggers is not as great as
commonly stated.
• The heat rate of incremental power from chillers is superior to that achieved by duct firing. The higher incremental heat rate of duct firing is partially mitigated when combined with chilling.
• That power augmentation for maximum summer power should not be an “either / or”
choice between chillers and duct firing, but rather should be the combination of the two, due to synergistic design parameters for the HRSG and steam turbine.
• The economic payback of TIC is dependant upon where in the design process it is
evaluated. It is preferable to make chilling the base case assumption, and optimize the balance of plant at a lower fixed compressor inlet temperature (such as 50°F [10°C]).
• Maximum operational flexibility is achieved when providing maximum augmentation at
both the “front-end” as well as the “rear-end” of the GT train.
• Both chillers and duct firing provide “active” controls that maximize the output and flexibility of the front-end and rear-end systems. Active systems allow the operators to react to changing economic conditions.
• Power augmentation can be likened to a built-in peaker, except with superior economic
characteristics as compared to an aero-derivative GT.
• Performance and economic results will challenge the status quo for combined cycle design.

Comparison of Power Enhancement Options For Green-Field Combined Cycle Power Plants Rev 02, February 2004
4
A typical 2x1 F-Class gas turbine combined cycle power plant is considered for this study. The HRSG and other plant hardware are generic and designed for the gas turbine exhaust conditions. The six major cases studied are described later. These six cases are selected to provide a complete set of combinations of the potential inlet cooling options, with and without supplemental duct firing.
Two TAS F-50 chiller systems are shown installed with a common pipe rack, turning the two systems into a central chiller plant. The equipment in this picture represent the type of equipment discussed in the chiller system sections of this paper, providing sufficient capacity for two F-class gas turbines. The role of the chiller system is to produce cold water, which in turn is pumped to heat transfer coils at the GT filter house.
F-Class gas turbine inlet filter house, showing installation of chiller coils. Coil manifolds are the vertical pipes along side the filter house. This filter house is “passively balanced” with a third “reverse return manifold”.
Filter houses for chilling applications are much larger than standard models. A larger “face area” keeps pressure drop across the coils low. This filter house also has a symmetrical transition duct that improves the airflow across the coils.

Comparison of Power Enhancement Options For Green-Field Combined Cycle Power Plants Rev 02, February 2004
5
Modeling of the Power Plant
A 2x1 GE7FA (PG7241FA) gas turbine combined cycle power plant, typically referred to as a STAG207FA, is considered for this study. The HRSG and other plant hardware are generic and designed for the gas turbine exhaust conditions. The steam turbine is generic but an attempt has been made to conform to standard GE D-11 sizes available in the market. All models are designed in Thermoflow’s1 GTPro software and then simulated for off-design using the GTMaster software. The Thermoflow PEACE option in the simulation software sizes all the hardware and provides an estimate of the cost of the equipment as well as construction and installation cost of the facility.
The following cases are simulated:
Case No. Case Description
1 Base Case. No turbine inlet air conditioning. No firing. High Avg. Ambient Temperature 95°F (35°C), 40% RH, 75°F WB (23.9°C) 2
2 Turbine inlet air conditioning using foggers. High Avg. Ambient Temperature 95°F, 40% RH
3 Turbine inlet air conditioning using chillers. High Avg. Ambient Temperature 95°F, 40% RH. Chill to inlet temperature of 50°F (10°C).
4 No turbine inlet air conditioning. Duct Fire to maintain maximum Steam Turbine gross output at HPT inlet steam flow of 1300 kpph.
5 Turbine inlet air conditioning using foggers. Duct Fire to maintain maximum Steam Turbine gross output at HPT inlet steam flow of 1300 kpph.
6 Turbine inlet air conditioning using chillers. Chill to inlet temperature of 50°F. Duct Fire to maintain maximum Steam Turbine gross output at HPT inlet steam flow of 1300 kpph.
7 Turbine inlet air conditioning using chillers. High Avg. Ambient Temperature 95F, 40% RH. Chill down to dew point temperature. Same mechanical equipment as Case 3. No duct firing.
1 www.Thermoflow.com. This software was chosen because of its wide acceptance among power project developers, not only for initial screening studies, but also for detailed plant design as well. 2 The hot day (summer) conditions of 95°F and 40% RH (75°F WB) are chosen as a reasonable proxy for summer design conditions for many temperate climates. Clearly, a hotter and dryer desert location could be substituted for the study, as well as a more tropical or maritime climate with higher humidity.

Comparison of Power Enhancement Options For Green-Field Combined Cycle Power Plants Rev 02, February 2004
6
It is expected that the use of the GE F-class GT is representative of similar results for all advanced gas turbines such as the Westinghouse W501FD, the Alstom GT24, the MHI 501F, and the Siemens V84.3A, and all of these turbines’ 50-cycle counterparts. Moreover, the general concepts of this study can be reasonably extrapolated down to older E-class non-reheat cycles, as well as up to G/H class advanced steam-cooled cycles.
The simulation of the above cases is achieved as off-design performance of the models designed at average ambient conditions. All models are designed using the following assumptions:
• Average ambient conditions for plant design: Dry Bulb Temperature: 77°F3 (25°C) Relative Humidity: 50%4 Wet Bulb Temperature: 64°F (17.8°C) Elevation: 0 ft. MSL (0 meters MSL)
• Gas Turbines: o Two GE PG7241FA gas turbines with DLN combustors o Performance is based on the default library model in GTPro o Inlet filter house losses are 3 in. water gauge (wg). An additional loss of 1.0 in. wg is
assumed for the chiller option due to losses across the cooling coil. o Total exhaust losses are set at 16 in. wg, which includes the losses due to catalytic
reactors in the HRSG for NOx and CO reduction. o Gas turbine natural gas fuel is heated from 59°F to 365°F (15° to 185°C) in a heat
exchanger using hot water from HRSG IP economizer. o A typical natural gas fuel composition is one used with heating value of 20695 Btu/lb
(LHV). The HHV/LHV ratio is 1.1076. No provision has been made for liquid fuel / dual fuel firing.
• Steam Turbine:
o This is a three-pressure reheat steam turbine. Attempt has been made to conform to GE’s D-11 structured steam turbine.
o The steam turbine is designed with two LPT exhaust ends with down exhaust. Two sizes of steam turbine are used in the models depending on the power enhancement option considered. All supplementary duct-fired and inlet air chiller models have a steam turbine with 33.5 inch Last Stage Blade (LSB). The rest of the models (base and fog) have a steam turbine with a standard 30-inch LSB. Therefore, the costs associated with a larger steam turbine will be borne by both the duct-fired and chiller cases, even though a scenario with chillers and no duct-firing would not necessarily require the larger steam turbine.
o The maximum output of the steam turbine is limited by the HP inlet steam flow of 1300 kpph.
3 77°F corresponds to 25°C, a common design point for balance-of-plant equipment. 4 50% RH corresponds to a linear interpolation between the design summer conditions of 95°F (35 C) / 40% RH,
and ISO conditions of 59°F (15 C) / 60% RH.

Comparison of Power Enhancement Options For Green-Field Combined Cycle Power Plants Rev 02, February 2004
7
o The steam turbine operates on sliding pressure in off-design cases. • HRSG:
o The HRSG is designed as a three pressure reheat type. o The HRSG arrangement is optimized by the software for the gas turbine exhaust and
steam conditions, based on ambient conditions of 77°F (25°C) and 40% RH. o The low-pressure economizer at the back end of the HRSG contains a re-circulation
loop to maintain inlet feedwater temperature higher than the acid dew point of the sulfur in the exhaust gases.
o Duct burners for supplementary firing are included for specific models.
• Condenser and Cooling System: o The plant has a deaerating condenser. o The condenser is designed at 2.0 in. Hg. backpressure, based on ambient conditions
of 77°F (25°C) and 50% RH. o The range of the cooling tower is 18°F (10°C) o The approach is 11°F (6.1°C) o A mechanical air-draft wet cooling tower is included for heat dissipation.
• Chiller:
o A water-cooled electrical chiller with its own auxiliary cooling tower for condenser cooling.
o Chilled Air nominal approach to chilled water: 7.25°F (4°C) o Chilled water nominal range: 18°F (10°C) o Condenser water nominal approach to wet bulb: 7°F (3.9°C) o The capacity of the chillers and its associated equipment is designed such that it will
chill the turbine inlet air down to 50°F (10°C) at the summer ambient condition of 95°F (35°C) and 40% relative humidity. The cold air temperature downstream of the chiller coils is often referred to as “T2” (where T1 would be the ambient temperature). This summer design ambient condition is always used for chiller system design, even for cases where the BOP (HRSG etc.) equipment is designed and operated at the default 77°F (25°C) / 50% RH ambient condition. Accordingly, when the ambient conditions are less severe, the chiller system will be operating at part-load.
o The GTPro / PEACE model does not yet support an integrated chiller system design such as the TAS F-50 which TAS would recommend for this application. Accordingly in the GTPro models, each gas turbine has three chillers, each chiller with a nominal capacity of 1,850 tons. Nonetheless, we have forced the model to provide performance characteristics commensurate with the function of (2) TAS F-50 chiller systems.
o The GTPro model was set up with the following inputs to mimic the performance characteristics of the TAS F-50 chiller system, with a nominal capacity of 5,500 tons (11,000 tons total) at the following nominal conditions: • 82°F (27.8°C) condenser water supply temperature from the dedicated
condenser cooling tower. • 42.5°F (5.83°C) chilled water temperature

Comparison of Power Enhancement Options For Green-Field Combined Cycle Power Plants Rev 02, February 2004
8
• System electrical parasitic loads are “grossed-up” for ARI allowable tolerances (“zero negative tolerance”)
• The overall chilling system is based on the most common “two on two” configuration, with two chiller plants on a common piping manifold that supply the two GT’s.
• The TAS F-50 system is operating within the guaranteed performance envelope (output and efficiency) typically quoted for this system.
• Fogger:
o The Fogging system is designed for 95%5 effectiveness with ultra-fine droplet size. No additional inlet air pressure drop is associated with the fogging system.
o An over-spray6 style of fogging system was not considered for this study. This system is not offered by the OEM for the 7FA machine.
o Evaporative cooling by method of “evaporative media”7 was not considered. • Selected PEACE input variables used for estimating the cost of the power plant:
o The gas turbine, steam turbine and HRSG are not located indoors. The water treatment center is located indoors.
o Cost multipliers of 1.0 are used for all estimates. These factors can be changed in the “Cost Modifiers” worksheet in the Cost Report spreadsheet.
o The gas turbine has a single-fuel package option, Hydrogen-cooled generator and electric motor starter.
o One 36 kpph auxiliary boiler, running on natural gas for the plant. o Steam turbine has a downdraft exhaust duct. o SCR or Catalytic reactor in the HRSG for NOx and CO reduction. o Inclusion of continuous emission monitoring system (CEMS). o The plant has a DCS.
5 95% is considered to be an excellent performance specification for a typical fogging system. Real-world
applications are largely limited to 75% to 85% effectiveness, as measured on an “approach to wet bulb” basis. In order to achieve 95% effectiveness, it is usually necessary to over-spray the fog considerably, resulting in water droplet carryover into the GT compressor. For the purposes of this paper, which is to demonstrate the relative impact of chilling technology as compared to fogging technology, using the higher fogging effectiveness causes the relative chiller results to be highly conservative.
6 “Over-spray” fogging systems are proprietary, with limited applications, and are not used for comparison
purposes for this paper. The methodology for determining incremental costs and incremental performance throughout this study can also be used for evaluating over-spray systems.
7 Evaporative cooling through wetted media continues to be a viable alternative to fogging. Typical design
effectiveness is 85% approach to WB. The use of evaporative cooling requires a larger filter house than a non-augmented filter house. The air pressure drop associated with the evaporative media (and drift eliminator) can be approximated at 1” w.g., same as for the chiller coil. Because of the similar performance and cost impacts of evaporative media and fogging, we only study fogging due to fogging’s higher relative effectiveness, which makes the chiller comparison conservative. Some operators continue to choose evaporative cooling over fogging due to safety concerns resulting from water droplet carryover into the compressor inlet.

Comparison of Power Enhancement Options For Green-Field Combined Cycle Power Plants Rev 02, February 2004
9
It is important to note that in setting up the GTPro models, certain aspects of plant performance were “fixed”, such as steam turbine generator (STG) last stage blade length and cooling tower approach and range. However, other design parameters were allowed to “float” to find the best economic and technical results. The most important of these features would be the heat transfer surface of the HRSG. The importance of this ability to allow the GTPro program to find the best heat transfer surface area derives from the fact that as GT inlet temperatures change, so will the GT exhaust temperatures. Such changes in exhaust temperatures will change the approach for the superheater section of the HRSG. Moreover, as the GT inlet temperature changes, there will be significant changes in exhaust mass flow. For the chilled cases, the HRSG needs to be optimized for higher mass flow and lower exhaust temperatures, in order to attain the highest possible steam cycle output. This is a critical design factor in optimizing the combined cycle for chiller operations. An HRSG not designed for chiller operations will clearly under perform as compared to a properly designed HRSG.
This figure shows a S207FA in Texas, USA, with anominal power rating of 633 MW. This plant wasdesigned for both chilling and high rates ofsupplemental firing. In summer operations, thechiller capacity is dispatched before the firingcapacity, which is held in reserve for the hottest daysonly when economic dispatch is made possible.Two TAS F-50 chiller systems are shown on theright side of the picture. Combined coil demand isapproximately 10,500 tons (refrigeration).

Comparison of Power Enhancement Options For Green-Field Combined Cycle Power Plants Rev 02, February 2004
10
Methodology and Output
The various combined cycle models, designed at the average ambient conditions of 77°F (25°C) and 50% RH were used for simulating performance at off-design conditions of 95°F (35°C) and 40% relative humidity. This temperature was selected as a typical high ambient temperature when the need for summer power enhancement is most beneficial.
The reason for these two ambient conditions can be explained as follows. The design conditions are optimized for a combined cycle plant in “intermediate” service, that is, neither a base-loaded plant nor a peaker. This design is representative of the “merchant” plants pressed into service in the past seven years. Such a plant can be expected to operate approximately 4,000 hours per year (this unfortunately turned out to be optimistic for many new US merchant plants). The fogger and chiller systems, on the other hand, are designed for summer peak design conditions, as is typical design practice for the industry, and not coincidently, when the combined cycle plants are getting so much of their dispatch time.
Future users may opt to design the Balance of Plant equipment such as the HRSG and STG for a defined GT inlet temperature of 50°F. Such optimization would provide maximum output and efficiency during the summer months when a chiller system is expected to operate. The downside would be a slight loss of performance during “shoulder” hours and winter operations (if any). Considering that most Merchant plants that were designed for Base-load or Intermediate-dispatch service are now operating almost exclusively as summer peakers, making the case for designing the BOP for a GT inlet temperature of 50°F, and the main cooling tower for a temperature of 95°F DB and 75°F WB, may have been a better choice.
The performance results of the simulation are summarized in Table 1 in Appendix A. The cost reports8 are summarized in Table 2 of Appendix A. The graphical output of the simulation of power plant cycle for each of the case runs described earlier is given in Appendix B. The description of the cases is as shown in the following table:
No Duct Firing With Duct Firing No Inlet Conditioning Case 1 Case 4
Fogging Case 2 Case 5 Chilling Case 3 Case 6
Analysis of this data is as follows:
8 The Cost Report contains the estimated cost for equipment, civil, mechanical and electrical work including labor as estimated by the PEACE program. A comparison of the cost reports for each of the Cases 1 through 6 is shown in Appendix A, Table 2. Due to constraints on size of this paper, we have omitted several of the GTPro and PEACE outputs associated with this study. However, such information is available from the author upon request.

Comparison of Power Enhancement Options For Green-Field Combined Cycle Power Plants Rev 02, February 2004
11
ANALYSIS - Power Output Results
The subject of this paper is to describe power augmentation technologies. Hence, the incremental output of each option is a critical factor in the evaluation of the technology.
The performance summary shown in Appendix A Table 1 includes the incremental power output (as well as the incremental heat rate) for various power enhancement options.
All values are based on the simulation at the given (off-design) ambient summer conditions of 95°F and 40% relative humidity. With secondary results given of the design conditions of 77°F and 50%. All values are in kilowatts (kW). The absolute and incremental results are shown for fogging, chilling, and supplementary duct firing. These results are analyzed in further detail in the following pages.
Summer Peak Conditions of 95°F (35°C) and 40% RH Case Inlet Conditioning Duct Firing Output Incremental Output
1 None No 452,183 2 Fog No 481,853 29,670 6.6% 3 Chiller No 505,922 53,739 11.9% 4 None Yes 530,203 78,020 17.3% 5 Fog Yes 557,106 104,923 23.2% 6 Chiller Yes 579,316 127,133 28.1%
Nominal BOP Design Conditions of 77°F (25°C) and 50% RH Case Inlet Conditioning Duct Firing Output Incremental Output
1 None No 480,855 2 Fog No 498,494 17,639 3.7% 3 Chiller No 512,718 31,863 6.6% 4 None Yes 554,628 73,773 15.3% 5 Fog Yes 571,540 90,685 18.9% 6 Chiller Yes 584,833 103,978 21.6%

Comparison of Power Enhancement Options For Green-Field Combined Cycle Power Plants Rev 02, February 2004
12
• Fogging:
Summer Peak Conditions of 95°F (35°C) and 40% RH Case Inlet Conditioning Duct Firing Output Incremental Output
1 None No 452,183 2 Fogging No 481,852 29,669
4 None Yes 530,203 5 Fogging Yes 557,106 26,903
Nominal BOP Design Conditions of 77°F (25°C) and 50% RH
Case Inlet Conditioning Duct Firing Output Incremental Output 1 None No 480,855 2 Fogging No 498,494 17,639
4 None Yes 554,628 5 Fogging Yes 571,540 16,912
The incremental output of the fogging system seems impressive, especially given its low cost. Nonetheless, we expect that we have overstated the capability of the system, in order to make our comparison to chillers conservative. Our customers have provided anecdotal stories that such fogging results are not achievable “in the real world”. They believe that 75% effectiveness is more likely.
We believe that fogging is a technology that evaluates well in “paper” studies, such as a first cost analysis performed at the design point. However, the technology rarely lives up to its promises in operations. Being a system that is dependent on the spread between dry bulb and wet bulb temperatures, the performance (and hence incremental power capacity) is strictly related to weather conditions. Fogging systems remove some of the variability in plant output due to hot weather, but not nearly enough to make the plant output anything that we would call “predictable”.
This comparison also does not account for the increased GT maintenance costs that have been experienced by some owners due to moisture carryover into the GT compressor with fogging systems. In fact, many operators abandoned fog systems in-place for the 2003 operating season due to compressor erosion concerns. For those operators that have chosen to run their foggers in their F units, they have been required to perform frequent inspections. It is expected that operators wishing to return to normal fogging operations will require a compressor blade material upgrade, the costs of which are not included herein.

Comparison of Power Enhancement Options For Green-Field Combined Cycle Power Plants Rev 02, February 2004
13
• Chilling:
Summer Peak Conditions of 95°F (35°C) and 40% RH Case Inlet Conditioning Duct Firing Output Incremental Output
1 None No 452,183 3 Chilling No 505,922 53,739
4 None Yes 530,203 6 Chilling Yes 579,316 49,113
Nominal BOP Design Conditions of 77°F (25°C) and 50% RH
Case Inlet Conditioning Duct Firing Output Incremental Output 1 None No 480,855 3 Chilling No 512,718 31,863
4 None Yes 554,628 6 Chilling Yes 584,833 30,205
The power output associated with chilling is nearly double that of the fogging cases9. What can’t be shown within the limits of this paper is that this incremental power output for chilling is much more predictable than that for fogging systems. That is, it is possible to “dial-in” a T2 temperature with a chiller system, and maintain the temperature constant, and expect the plant to operate in that stable condition for weeks at a time (or even all year long in warm climates). As such, it is simple to establish performance guarantees for chilling systems that can be well documented, hence reducing the questions of long-term performance risk. The predictability of output from chiller systems is secure enough to provide a physical “hedge” against abnormal weather spikes.
The ability to control inlet temperature makes the task of selling power in forward markets much easier to accomplish, because the plant output is much less tied to swings in ambient conditions, for both dry bulb temperature and relative humidity. A control scheme is available for the chillers that controls on net power output instead of for T2, making the control of power output much more stable as temperature and humidity changes throughout the day. This is particularly helpful in a SCADA-controlled plant in which the chillers are used for trim power as system demand changes, as well as for providing secondary power products such as “spinning reserve”.
9 “Nearly double” refers to this paper analysis where we provided conservatisms in favor of fogging. We are confident that the incremental chiller capacity will be much more than double in a real plant on a hot day, and that spread would open up greatly for off-design conditions.

Comparison of Power Enhancement Options For Green-Field Combined Cycle Power Plants Rev 02, February 2004
14
Note that for the second operating case above, for an ambient temperature of 77°F, it is possible that the T2 temperature could have been lowered from 50°F to 45°F, in order to gain even more power. That additional incremental power is not shown here. In fact, one of the benefits of chilling is that it is just as easy to vary T2 temperature as it is to hold T2 constant. For example, a typical chiller system designed at the summer off-design point of 95°F would have a design T2 of 50°F. In reality, the chiller system controls might be set to a default temperature such as 45°F. For all but the few hottest hours of the year, the plant will experience the lower T2 temperature of 45°F, taking advantage of the extra output. In a later section of this paper we will also discuss the advantages of setting T2 temperature upwards temporarily.
• The analogy to a stand-alone peaker The incremental output of the chiller system in our S207FA reference plant is between 49 and 53 MW. The coincidence is too obvious to pass up: this is approximately the same power output as a (chilled) aero-derivative engine, which are typically thought of as the mainstream peaker, with hundreds installed globally during the boom years of 1998 to 2001.
Built into every nominal 500 MW combined cycle plant, there is the ability to tap this extra capacity on a peaking basis, or on an intermediate basis, or even as base load in warm climates. However, the chiller capacity costs less than half the cost of an aero-derivative engine and has a superior heat rate. The chiller capacity can be started or ramped much more quickly than the fast-acting peaker. No additional O&M personnel are added for the chillers. No additional environmental point source is created. The best part is that the chiller capacity will not require expensive LTSAs, maintenance intervals, or hot-gas-path parts.

Comparison of Power Enhancement Options For Green-Field Combined Cycle Power Plants Rev 02, February 2004
15
• Variability of Output The graphic below is provided to show that the single best way to control plant output as-near-as-possible to a constant value is to employ chillers. Note that the unaugmented plant in the lower left hand corner show not only the least output, but between the striped column (95°F) and the solid column (77°F), there is a great deal of variability. To the immediate right of these two columns are the fogged cases, which only show marginal improvement. By comparison, in the upper right hand corner of the graphic, we see that the fully augmented plant (three plant configurations, including two thermal storage concepts), the output is not only the greatest, but that there is very little discernable variability between the two ambient temperatures.
The important factor here is the variability between the pairs of data, pairs being between the 77°F case and the 95°F case. This variability, or delta, is shown for clarity in the next graph. Our goal is to minimize this delta, if not only to maximize power, but also to minimize uncertainty in the plant output.
These graphs show that the chilled plant configuration loses the least amount of power within the temperature swings that are expected to occur during summer peaking season. Duct-firing alone can’t remove that variability due to ambient swings. While duct firing is good and useful, it does not eliminate the variability of summer operations.

Comparison of Power Enhancement Options For Green-Field Combined Cycle Power Plants Rev 02, February 2004
16
No TIC Fog Chiller Partial TES Full TES
0
5,000
10,000
15,000
20,000
25,000
30,000
Net
Var
iabi
lity
of O
utpu
t, kW
Plant Output Variability due to Changes in Ambient Temperature:the difference in Net Plant Output between 77 F and 95 F
Power Delta, Fired Power Delta, Unfired
BETTER
However, firing in combination with chilling improves output consistency better than firing alone or chilling alone, as can be discerned from the graph below.
For the chilled cases, a significant fraction of the small remaining power variability is caused by the chiller parasitic electrical load, which can be nearly eliminated by adding a Thermal Energy Storage (TES) system.
A TES system will shift daytime chiller electrical parasitic loads to the nighttime. A “Partial” storage TES system will typically shift approximately half of the chiller load; and the chillers will operate around the clock. This will save approximately 3.5 MW of parasitic load, hence raising the plant output by the same amount. A “Full” storage TES system will shift all chiller parasitics to the off-peak period, in this case saving approximately 7.5 MW of load.
The first cost, life cycle costs, and flexible operational characteristics of a TES-equipped chiller system are far superior to the basic “on-line” chiller model described in this paper. Nonetheless, space considerations for this paper do not allow us to provide the required level of details to do justice to the subject.

Comparison of Power Enhancement Options For Green-Field Combined Cycle Power Plants Rev 02, February 2004
17
• Duct firing:
Summer Peak Conditions of 95°F (35°C) and 40% RH Case Inlet Conditioning Duct Firing Output Incremental Output
1 None No 452,183 4 None Yes 530,203 78,020
2 Fog No 481,853 5 Fog Yes 557,106 75,253
3 Chiller No 505,922 6 Chiller Yes 579,316 73,394
Nominal BOP Design Conditions of 77°F (25°C) and 50% RH Case Inlet Conditioning Duct Firing Output Incremental Output
1 None No 480,855 4 None Yes 554,628 73,773
2 Fog No 498,494 5 Fog Yes 571,540 73,046
3 Chiller No 512,718 6 Chiller Yes 584,833 72,115
There should be little surprise that the maximum incremental power output comes from duct firing. Case 6 shows a net plant output of 579 MW, although we show a photo on page 9 for a similar plant that is rated for 633 MW with both chilling and firing. In order to keep the additive aspects of chilling and firing in perspective, lets look at the incremental impact of both technologies combined against the base plant:
Summer Peak Conditions of 95°F (35°C) and 40% RH Case Inlet Conditioning Duct Firing Output Incremental Output
1 None No 452,183 6 Chiller Yes 579,316 127,133
While we provide some discussion here about the benefits of chilling versus fogging, we are not going to suggest that chillers should be used in lieu of firing. In fact, we believe that for a given combined cycle, the plant should be augmented to its maximum reasonable capacity, in order to capture the more lucrative summer period economics.

Comparison of Power Enhancement Options For Green-Field Combined Cycle Power Plants Rev 02, February 2004
18
Clearly, the plant that has both chillers and firing will provide both the greatest output and the most operational flexibility.
It should be intuitively obvious that the best combined-cycle plant configuration is the one with the greatest amount of performance enhancement at both the front end and at the back end of the cycle. These results back up this assumption. A reasoned explanation for these results appears on the following page.
Many developers we have spoken with over the years have stated that they did not need inlet chilling, because they already planned to have duct firing. We challenge the notion that chilling and firing are “either / or” technologies; in fact, they work best together. We advocate both technologies. The only time that we might not advocate supplementary duct firing is for air-cooled sites10, or perhaps sites with Zero-Discharge limitations11. In such cases, the extra power that is derived from firing places an enormous load on the ultimate heat sink (such as cooling tower or air-cooled condenser). This heat sink topic is too broad for this study, but will be addressed in a future paper. This paper needed to be limited to standard water-cooled plants, for brevity.
10 If this heat sink is an air-cooled condenser (ACC), then the impact of firing will only aggravate the very high capital and operational costs associated with ACCs. In such a plant, we would propose air-cooled chilling equipment. Such air-cooled technology comes with an approximate first cost penalty of 40% increase in capital and land usage. Parasitic electrical loads are also approximately 40 to 50% higher. Nonetheless, the relative impact on chilling as compared to the air-cooled combined cycle plant remains the same; that is, it still makes economic sense to chill in an air-cooled environment. Any technology that “shifts” a greater percentage of power to the front-end (GT) of the plant makes most sense for an air-cooled installation. Furthermore, chilling in an air-cooled environment makes the benefits of TES much greater, by taking advantage of the dramatic swings in ambient DB temperature between night and day. Shifting more chilled water production to nighttime avoids more expensive daytime chiller operations. 11 If the plant is water cooled, but has a Zero Discharge (ZD) system, then the extra load on the main cooling tower would perhaps drive the cost of firing into a less competitive position from both first cost and operational costs basis. For chilling capacity, we would still advocate a water-cooled system. Approximately 40% of the chillers’ cooling tower make-up water requirements could be provided by condensate from the inlet coils. However, due to the very clean nature of that water, it would more likely be used for RO / demin makeup for boiler feed water. The chiller cooling towers can tolerate at least 5 cycles of concentration in operation, perhaps more with proper water chemistry and selection of materials. Blowdown form the chiller cooling towers would then be “cascaded” to the main tower for final concentration before being recycled at the ZD system. In any event, he amount of water used in a TIC system is a small fraction (typically 10% or less) of a CC cooling tower.

Comparison of Power Enhancement Options For Green-Field Combined Cycle Power Plants Rev 02, February 2004
19
• Relative Output of “Active Systems” vs. “Passive Systems” We consider chiller technology as an “active system”, as compared to foggers, which would be described as “passive systems”. This is explained that foggers react to the ambient weather conditions, being limited to the spread between DB and WB. There is a natural meteorological limit to their performance that changes degree by degree and minute to minute.
By comparison, chillers operate in an active mode through engineered systems to maintain T2 temperature12, regardless of how hot the DB becomes13. As such, these systems break through both the WB and Dew-point barriers that would limit passive systems. The limiting condition that chillers come up against is the potential formation of ice, which is the natural limit of the performance envelope for inlet cooling systems. (Chiller systems operating with a T2 of >= 42°F run little risk of forming ice.)
The same active / passive scenario can be drawn for duct burners and unfired HRSGs. The unfired HRSG would be considered the passive system because its capacity is limited by the exhaust flow and temperature that is imposed upon it. In fact, it is mostly the ambient temperature entering the GT that determines the exhaust conditions to which the HRSG passively react! By analogy to chillers, the duct burners provide an active engineered system that breaks beyond the natural limitations of exhaust flow and temperature to greatly increase the mass flow and pressure of the steam produced in the system. The new limiting condition becomes the metallurgical limits of the superheater and/or the amount of oxygen remaining in the exhaust gas.
Another way to view these systems is to consider their “following characteristics”. A passive system reacts to its input conditions in such a way that the output is directly related to the input conditions, which are beyond its control. The foggers react to the spread between DB and WB, and can do no better. If the spread is low, then the capacity associated with foggers will be low also.
The unfired HRSG reacts to exhaust conditions. With the very minor exception of the amount of desuperheater spray that can be employed, the output characteristics of a three-pressure reheat HRSG is very much tied to incoming exhaust gas mass flow and temperature. By contrast, the duct burners are engineered to raise the exhaust temperature in such a way as to significantly increase steam pressure (and hold that pressure), and to increase steam mass flow.
Passive systems are powerless to react to changes in their environment to maintain any semblance of constant capacity.
12 Chillers controls can also be configured to provide even more direct active control by using net plant output as a feedback loop. 13 Being able to provide a constant T2 is obviously predicated on designing the chiller refrigeration capacity to meet the coil demands, as we have done here in this analysis.

Comparison of Power Enhancement Options For Green-Field Combined Cycle Power Plants Rev 02, February 2004
20
System type Front-End Back-End
Passive
Fogging
Mode of operation: react to spread in DB & WB
Following characteristics: only partly flattens GT response to
weather
Unfired HRSG
Mode of operation: react to GT exhaust conditions
Following characteristics: output is only slightly less variable than the
GT to which it is connected
Active
Chillers
Mode of operation: break through weather conditions to provide
constant T2
Following characteristics: absolutely flat-lines the GT output (and the exhaust temperature and
mass flow); BOP output is impacted only slightly on a % basis by the chiller parasitics,
which could in turn be mitigated by a TES system
Duct Burners
Mode of operation: fire to higher steam pressures and constant
steam flow
Following characteristics: helps to flat-line the pressure and steam
mass flow if the HRSG, and hence throttle conditions of the STG.
BOP continues to be impacted by summer backpressure limitations
of the STG condenser
As shown here, the benefits to active systems at both the front end and back end of the GT are that previously uncontrollable input parameters are brought under the control of engineered systems, and hence are controllable by the operators. Previous operating envelopes, mostly dictated by ambient temperature, are broken towards new mechanical limits that far exceed the old natural limits.
The idea is to take weather out of the equation.
Accordingly, active systems provide not only more capacity, but also the ability to operate in a flexible mode. Such flexibility may be difficult to quantify in a cost / benefit analysis during system conceptual design. Unfortunately, system operators of a completed plant know the benefits of such flexibility all too well, and usually too late, particularly when tethered to an uncontrollable power plant with weather-limited output. The biggest losses are the inability to choose between a maximum efficiency mode versus a maximum power mode, and the inability to predict future power capacity with accuracy (“selling forward”).

Comparison of Power Enhancement Options For Green-Field Combined Cycle Power Plants Rev 02, February 2004
21
ANALYSIS - Heat Rate Results
To benefit from the Heat Rate analysis, an appreciation of Incremental Heat Rate is essential. Incremental heat rate is the energy required to generate an extra net kilowatt of power. The range of incremental heat rate for each option is as follows in the following three tables. All heat rates and fuel usages are quoted in Lower heating value (LHV).
During the past seven years, not as much real emphasis was placed on heat rate as was placed in previous years (and we expect in future years), despite the proliferation of high-efficiency technologies (such as fuel-gas heating and the emergence of the G & H cycles). Power augmentation technologies were evaluated, almost exclusively, on a “$ per kW” basis. As the new power market of the 21st century matures, with higher fuel costs, we believe that heat rate will play an increasingly important role in making new plants more economically viable.
All values are based on the simulation at the given (off-design) ambient summer conditions of 95°F (35°C) and 40% relative humidity.
• Fogging:
Case Inlet Conditioning Duct Firing Heat Rate Incremental Heat Rate 1 None No 6,371 2 Fogging No 6,356 6,136
4 None Yes 6,668 5 Fogging Yes 6,638 6,055
In the above table, the results show that the comparison between cases 1 and 2 are favorable for fogging, because of the lower GT heat rate associated with the lower T2 temperature and the very low parasitic draw associated with fogging systems.
The incremental heat rate between Cases 4 and 5 shows an ever better incremental heat rate for fogging when combined with duct firing. This is because of the higher GT exhaust mass flow, associated with the somewhat lower GT inlet temperature, which helps to “displace” the need for some of the duct burner fuel (holding STG inlet steam flow constant).

Comparison of Power Enhancement Options For Green-Field Combined Cycle Power Plants Rev 02, February 2004
22
• Chiller:
Case Inlet Conditioning Duct Firing Heat Rate Incremental Heat Rate 1 None No 6,371 3 Chiller No 6,453 7,144
4 None Yes 6,668 6 Chiller Yes 6,705 7,103
In the above table of results, it is shown that the incremental heat rate associated with adding chillers to the base plant is moderately higher, at 7,144. However, the incremental heat rate to add chillers to a duct-fired plant shows some modest relative improvement, due to the higher GT exhaust flow that displaces some duct burner fuel.
The incremental heat rate associated with chilling is certainly higher than the results from fogging, but lower than the results from duct firing, to be shown on the following page.
Nonetheless, when ambient conditions reach 95°F (35°C), the “spark spread” of most electrical markets makes the incremental heat rate less of a concern than when the plant is operating in a much more competitive market, such as when the ambient is at 77°F (25°C). Spark Spread is typically described as the gross margin of the plant economics, as measured on an hourly basis in $ per MW-Hr. It is typically defined as the difference between the gross revenue of power and the fuel cost. During very hot weather, the Spark Spread “opens up”, causing less-efficient peaker plants to be able to operate at a profit, providing the economic incentive to make those peaking plants available to the market.
Higher spark spreads much more than make up for the modestly higher incremental heat rate of chilling as compared to fogging. Nonetheless, there are means to operate a chiller system at significantly improved incremental heat rates.
The most substantial real-time heat rate improvement modification would be to employ Thermal Energy Storage (TES) to shift daytime parasitic load to the off-peak evening periods. Various methods of TES can reduce on-peak parasitics loads by 50 to 100%, depending on the desired peaking capacity of the plant. The resulting 3.5 to 7.5 MW of TES capacity (avoided parasitics) can be operated as its own mini-peaker to help guide the plant through the hottest few hours of the day.
Another very simple concept to improved chiller capacity heat rate is to turn-down the chillers, allowing the GTs to operate at a modestly higher T2. The explanation of this mode of operation follows.

Comparison of Power Enhancement Options For Green-Field Combined Cycle Power Plants Rev 02, February 2004
23
• “Case 7”
In essence, the incremental power available from a chiller system is much like a “peaker” in that it can be dispatched and operated based on the prevailing spark spread. Accordingly, we provided a 7th case to illustrate this point. The technology (and capital cost) is exactly the same as the chiller in Case 3; however, we are going to show the flexibility to the operator that results from operating the chiller in an intelligent manner.
Intelligent operations can be built into control systems, or can be managed by operators. Usually, the best system has a high degree of intelligent functions built-in, and still allows operators to take command in periods of highest demand or lowest margin.
In essence, an active chiller system allows for maximum flexibility in operations.
In the case of a low-demand, low Spark-spread day, where operating costs need to be tightly constrained, a standard chiller system might not provide the required incremental heat rate determined by the local clearing price. In such a situation, the heat rate benefits of a fogging system would be desirable. It is possible to operate the chiller system in a way that slightly mimics the fogging system, obtaining superior heat rate results that are not normally associated with chillers.
Given an operating day at the summer design condition quoted in this study, 95°F (35°C) and 40% RH, it is relatively easy to operate the chiller at a reduced load, providing much more efficient operation. This is accomplished by operating the chiller in “Dew-Point Control Mode” to provide a T2 temperature at or near the Dew Point of the air, instead of going all the way down to the more typical 50°F (10°C).
By automatically limiting T2 operation to the Dew Point of 67°F (19.4°C), the chilling coil will produce very little (theoretically zero) water condensate. Thus all of the chilling load from the air will be “sensible”, with no “latent” load of condensation. This reduces the load on the chillers, allowing them to operate in a more efficient manner and at higher temperatures.
Accordingly, the chilled plant will provide more power than a fogged plant would under similar ambient conditions (an additional 7 MW), but can still provide excellent heat rate in a more competitive economic environment. However, when higher electric revenues are once again available, the full capability of the chillers can again be dispatched to maximum benefit.
Case Inlet Conditioning Duct Firing Heat Rate Incremental Heat Rate 1 None No 6,371 7 Chiller, DP Mode No 6,403 6,799

Comparison of Power Enhancement Options For Green-Field Combined Cycle Power Plants Rev 02, February 2004
24
Summer Peak Conditions of 95°F (35°C) and 40% RH Case Inlet Conditioning Duct Firing Output Incremental Output
(compared to Case 1) 1 None No 452,183 2 Fogging No 481,852 29,669 3 Chilling No 505,922 53,739 7 Chiller, DP Mode Yes 489,048 36,865
Note that the chillers in DP-control mode operate in a more economical fashion than in standard operating mode (6,799 incremental heat rate vs. 7,144 heat rate), and still provide more incremental power output than foggers (36,865 vs. 29,669).

Comparison of Power Enhancement Options For Green-Field Combined Cycle Power Plants Rev 02, February 2004
25
• Duct firing:
Case Inlet Conditioning Duct Firing Heat Rate Incremental Heat Rate1 None No 6,371 4 None Yes 6,668 8,839
2 Fog No 6,356 5 Fog Yes 6,638 8,443
3 Chiller No 6,453 6 Chiller Yes 6,705 8,440
The above values show that duct firing has the highest incremental heat rate of all the augmentation technologies. The incremental rate associated with duct firing is somewhat improved when it is coincident with inlet fogging or inlet cooling, due to the higher exhaust mass flows that are available to create the desired HPT flow of 1,300 kpph.
Mention should be made here that the incremental heat rate of duct firing has improved remarkably in the past 15 years. Improvements have been made in combined cycle design for the advanced combined cycle plants of the “merchant” era. This can be attributed in part to the much higher steam turbine inlet pressures than were typical during the “cogen” era of combined cycle design. Current design philosophy allows throttle pressures in excess of 1800 psi, as shown in our cases for firing. This compares favorably with the typical throttle pressures of 900 to 1200 psi during the cogen era of design. The newer three-pressure reheat steam cycles have provided much of the improvements seen in combined cycle performance, despite the much more publicized improvements in gas turbine heat rates.
Despite dramatic improvements in plant design for firing, the fact remains that a chilled plant has a significantly improved heat rate as compared to the fired plant. This is in contradiction to many commonly held beliefs in the field.

Comparison of Power Enhancement Options For Green-Field Combined Cycle Power Plants Rev 02, February 2004
26
ANALYSIS - Capital Cost Results
The summary of the cost report, shown in Appendix A - Table 2, provides a comparison of the plant cost in absolute terms ($), as well as the incremental plant cost ($ per kW) estimates for different options studied. The incremental cost numbers are provided for both the high design (95°F) and off-design (77°F) ambient conditions. The range of incremental plant cost per kW for each option is as follows in the table immediately below.
All cost figures are those provided by Thermoflow’s PEACE costing module. This software uses the plant configuration as provided by GTPro. GTPro builds up the costs of the plant item-by-item.
Due to the enormous volume of data generated in this study, we have been limited to providing minimal raw data, providing instead the summaries and analyses. However, the back-up data is available from the author upon request.
Reference Absolute Cost for Entire Plant
Case Inlet Conditioning Duct Firing Reference Cost (millions)
Incremental Cost (to Case 1) (millions)
1 None No $212.4 2 Fogging No $215.1 $2.7 3 Chilling No $225.3 $12.9 4 None Yes $229.5 $17.1 5 Fogging Yes $231.5 $19.0 6 Chilling Yes $239.9 $27.5
Reference Unit Cost for Entire Plant, at 95°F and 40% RH
Case Inlet Conditioning Duct Firing Unit Cost Incremental Unit Cost
(to Case 1) 1 None No $470 2 Fogging No $446 $90 3 Chilling No $445 $240 4 None Yes $433 $219 5 Fogging Yes $416 $182 6 Chilling Yes $414 $216

Comparison of Power Enhancement Options For Green-Field Combined Cycle Power Plants Rev 02, February 2004
27
• Fogger: While fogging system is often quoted as a very low capital cost, there are other costs14 associated with installing a fogging system in a green-field application. The largest single additional cost would come from the filter house manufacturer for a modified filter house that would include 304SS cladding for all wetted surfaces15.
Reference Cost for Fogging Systems Case Inlet Conditioning Duct Firing Reference Cost
(millions) Incremental
Cost (millions) 1 None No $212.4 2 Fogging No $215.1 $2.7
4 None Yes $229.5 5 Fogging Yes $231.5 $2.0
Summer Peak Conditions of 95°F and 40% RH Case Inlet Conditioning Duct Firing Reference Unit
Cost ($/KW) Incremental
Cost 1 None No $470 2 Fogging No $446 $90
4 None Yes $433 5 Fogging Yes $416 $73
Nominal BOP Design Conditions of 77°F and 50% RH
Case Inlet Conditioning Duct Firing Reference Unit Cost ($/kW)
Incremental Unit Cost
1 None No $442 2 Fogging No $431 $151
4 None Yes $414 5 Fogging Yes $405 $116
14 The PEACE costing module increases the cost of plant auxiliaries (such as pumps and cooling towers) in response to the slightly higher power output from a fogged plant; hence the higher than expected total plant cost. The incremental cost of the fogger and filter house upgrade alone is approximately $250k per GT ($500k per site). These costs do not include the typical, and often-significant value-adder markups imposed by the GT OEM and / or the EPC contractor. 15 This helps protect the steel from aggressive attack by the required demineralized water.

Comparison of Power Enhancement Options For Green-Field Combined Cycle Power Plants Rev 02, February 2004
28
• Chiller: The cost of a chilling system is typically a serious matter, from a cost standpoint, to be considered in the conceptual design of a new plant. It will usually be the largest mechanical subcontract outside of the power island (GT/HRSG/STG), usually exceeding the cost even of the main plant cooling tower.
Reference Cost for Chiller Systems
Case Inlet Conditioning Duct Firing Reference Cost (millions)
Incremental Cost (millions)
1 None No $212.4 3 Chiller No $225.3 $12.9
4 None Yes $229.5 6 Chiller Yes $239.9 $10.4
Unit costs below are in $ per MW.
Summer Peak Conditions of 95°F and 40% RH
Case Inlet Conditioning Duct Firing Reference Unit Cost
Incremental Unit Cost
1 None No $470 3 Chiller No $445 $240
4 None Yes $443 6 Chiller Yes $414 $212
Nominal BOP Design Conditions of 77°F and 50% RH
Case Inlet Conditioning Duct Firing Reference Unit Cost
Incremental Unit Cost
1 None No $442 3 Chiller No $439 $404
4 None Yes $414 6 Chiller Yes $410 $345
Note that the incremental cost of chilling Case 3 to Case 1 is $2.5M more than shown for Case 6 to Case 4. This is because many of the costs associated with the larger plant are already accounted for in Case 4 (larger STG last row blades and the larger condenser and cooling tower associated with that condition).

Comparison of Power Enhancement Options For Green-Field Combined Cycle Power Plants Rev 02, February 2004
29
• Duct burner:
Reference Cost for Duct Firing Systems
Case Inlet Conditioning Duct Firing Reference Cost (millions)
Incremental Cost (millions)
1 None No $212.4 4 None Yes $229.5 $17.1
2 Fog No $215.1 5 Fog Yes $231.5 $16.4
3 Chiller No $225.3 6 Chiller Yes $239.9 $14.6
Summer Peak Conditions of 95°F and 40% RH
Case Inlet Conditioning Duct Firing Reference Unit Cost
Incremental Unit Cost
1 None No $470 4 None Yes $433 $219
2 Fog No $446 5 Fog Yes $416 $218
3 Chiller No $445 6 Chiller Yes $414 $199
Nominal BOP Design Conditions of 77°F and 50% RH
Case Inlet Conditioning Duct Firing Reference Unit Cost
Incremental Unit Cost
1 None No $442 4 None Yes $414 $232
2 Fog No $431 5 Fog Yes $405 $224
3 Chiller No $439 6 Chiller Yes $410 $203

Comparison of Power Enhancement Options For Green-Field Combined Cycle Power Plants Rev 02, February 2004
30
“Blended Cost”
At TAS, we espouse the concept of “Blended Cost”. Simply put, we propose that the overall unit cost of the plant is optimized when as much low-cost augmentation technology is applied as possible to the base (high-cost) plant.
For example, the unit cost of our base case 1 is $470 per kW for all 452,183 kW. This figure must include all the fixed costs of the project such as roads, control room, exhaust stacks, etc. Therefore, every additional incremental kW is going to be made available at a lower incremental cost.
For the Case 3 scenario, we add to Case 1 an additional 53,739 kW at an incremental cost of $12,877,111. Note that the incremental cost of this additional power is available at $240 per kW. The final figure in which we are most interested is the blended cost of the chilled plant, which is now $445 per kW (as compared to the unaugmented cost of $470). In practice, we have leveraged the unit cost of the entire plant downwards by adding a significant amount of power with a modest increase in first capital cost.
We believe that this Case 3 configuration is superior to the Case 2 fogging configuration. Even though the fogging technology is extremely inexpensive, the incremental power output associated with this increase is approximately half that of the chillers, under the best of conditions. The overall blended cost of the fogged plant is $446. Thus, despite the low incremental cost of the fogging capacity, there is not enough power output to provide the leverage that we seek in driving down the overall cost of the plant.
Thus, we can favorably compare the Case 3 blended cost of $445 versus the Case 2 blended cost of $446. This is obviously a modest improvement in this single measure; but we expect that this result will surprise many readers who are pre-disposed to believe that the costs of a plant with foggers would be vastly superior to that of a chilled plant. This is not the case.
Likewise, for the plants with duct firing capability, the blended costs of Cases 5 (fogging) and 6 (chilling) are $416 and $414 respectively; again, the chiller case is modestly better than the fogging case.
Of course, of equal importance in many operators’ minds is the fact that the chilled plant will produce at least 24 additional MW (unfired) and 22 additional MW (fired) as compared to the fogged plant. Given the fact that so many capital and operational costs are fixed, these additional MWs availability during summer peaking season have an enormous impact on operational revenues. In essence, this additional revenue drops directly to the bottom line. Additionally these extra peaking MWs are gained at a very attractive heat rate and NOx emissions – far exceeding the capability of any simple-cycle peaking gas turbine, such as the aero-derivative comparison we made previously.

Comparison of Power Enhancement Options For Green-Field Combined Cycle Power Plants Rev 02, February 2004
31
Justifying the higher unit cost of Chillers vs. Foggers
Looking at the unit costs provided by Cases 1 through 4, we see that each case shows an increasingly attractive unit cost, even though the incremental cost of each technology varies. In fact, the incremental cost of the fogging capacity was by far the lowest, distantly followed by the duct burner capacity, and finally the chiller capacity.
Reference Unit Cost, at 95°F and 40% RH Case Inlet Conditioning Duct Firing Unit Cost Incremental Unit Cost
(to Case 1) 1 None No $470 2 Fogging No $446 $90 3 Chilling No $445 $240 4 None Yes $433 $219
So, how can we justify the chillers, when so many decisions in power plant design are made on an incremental first-cost basis?
Simply, each technology that lowers the overall blended cost of the plant should be given serious consideration during the evaluation of the conceptual design of the plant. In fact, each technology does lower the blended cost of the plant dramatically.
Here we extend to the industry a challenge for a change in pricing evaluation for plants. While the pricing criteria for the column in the above table for “incremental cost” is well received by the industry, that is rated capacity at the summer design condition, it is not common practice to rate the unit cost of the entire plant at this higher summer design condition. We contend that the new era of supply / demand since the Merchant era building boom (and bust) dictates that the only reasonably viable near-term power market for new GT technology is in summer peaking.
Typical practice historically has been to calculate the unit cost of the plant at ISO conditions of 59°F (15°C). The time has come to abandon this evaluation for any realistic financial analysis, including simple screening exercises, even though it still might be the unfortunate legacy by which new GT technologies are compared. The reality is that no gas turbine plant is expected to enjoy considerable run time at 59°F ambient temperature. These plants will clearly have the highest monthly capacity factors in July and August, with some run time in January and February, and much stand-by time in the remainder of the months.
With respect to duct burners, it is easy to show that this technology has its place in a first-cost evaluation, and that its somewhat high heat rate is mitigated in part by the addition of fogging or chilling. Therefore, this “back-end” technology has some synergistic effects with the two proposed “front-end” technologies. Most importantly, the back-end technology is not mutually exclusive to the two front-end technologies.
However, of the two front-end technologies, foggers and chillers, it is the case that they are mutually exclusive. It is almost unheard of to install both systems (yes, it has been done once or twice). Operating a fogger upstream of a chilling coil would actually increase the refrigeration

Comparison of Power Enhancement Options For Green-Field Combined Cycle Power Plants Rev 02, February 2004
32
load on the coil; and operating the foggers downstream of the chilling coils in the cold saturated air would render the foggers useless. So the matter at the front end is such that the designer has an “either / or” decision.
The answer here is to look at the two mutually exclusive technologies and determine which one would have the greatest net impact on the plant economically. This is best accomplished with a detailed technical and financial pro-forma analysis of the plant considering the local climate and the economic environment of the region. This type of analysis is outside the scope of this paper.
We confidently choose as a simplified operational economic proxy for this analysis the fact that the plant will make much more power, at a lower blended plant cost, with chillers than with foggers, and do so with much higher predictability.
This question has been the classic hurdle for the fogger vs. chiller dilemma. The fogger system has a quicker payback, but the chiller system has a better NPV. In fact, both technologies have positive NPVs. From a strictly financial perspective, when two mutually exclusive options meet the “hurdle rate”, the decision is based on higher NPV, which in this scenario is derived from significantly higher net operating revenue, and not on initial sunk capital.
If the NPVs of each option are still close, then the risk of each option must be considered (if the NPV analysis did not already do so by discounting the returns of the riskier scenario). In this case, because the chiller system provides a guaranteed T2 over virtually all summer operating hours, and the fogging system is at the mercy of the local weather, then the chiller operating revenue is more predictable, and hence less risky.
The other factor to consider is the technology risk. Now that several F class GTs have logged sufficient operating time with foggers, the long-term safety of the compressor is being questioned. One OEM issued a notice to their customers this year regarding compressor damage. As such, we expect that the future revenue component of the fogger capacity would be suitably discounted by the project developer to adjust for future uncertainty regarding this technology. Conversely, in 15 years of chilled water technology, we have not experienced even the slightest sign of compressor damage or any risk to the GT.

Comparison of Power Enhancement Options For Green-Field Combined Cycle Power Plants Rev 02, February 2004
33
Analysis of Chilling and Firing Together
In our practice, we often have a developer or engineer tell us during the conceptual design phase that they have already made the decision to install supplemental duct firing. Only after that decision is made would they then consider the question of chilling.
To the typical engineer, the decision to add chillers after the decision to add firing should seem inconsequential from a timing perspective. In fact, the timing does matter from an analysis standpoint.
There is a certain ‘set’ of MWs that can be traced to the steam turbine that are provided by either chilling or firing. However, once one technology is chosen, that set of MW’s will be attributed to the first decision. The second technology will then be evaluated on a lower incremental power increase.
This can be demonstrated by assuming that a developer will look at adding capacity in steps, shown in our Cases 3 and 4, ultimately arriving at Case 6 in both scenarios.
Case 1 Case 4 Case 6 (firing considered first)
Summer Peak Conditions of 95°F (35°C) and 40% RH Case Inlet Conditioning Duct Firing Output Incremental Output
1 None No 452,183 4 None Yes 530,203 78,020 6 Chiller Yes 579,316 49,113
Case 1 Case 3 Case 6 (chillers considered first)
Summer Peak Conditions of 95°F (35°C) and 40% RH Case Inlet Conditioning Duct Firing Output Incremental Output
1 None No 452,183 3 Chiller No 505,922 53,739 6 Chiller Yes 579,316 73,394
Incremental capacity from chilling
Incremental capacity from firing
Overlapping set of MWs that will only be evaluated once

Comparison of Power Enhancement Options For Green-Field Combined Cycle Power Plants Rev 02, February 2004
34
As shown in the above two tables, the incremental values of the chilling and firing technologies depend on which order they are evaluated. In the scenario where chillers are considered first, the incremental capacity is nearly 54 MW; but when considered after firing, the increase is just over 49 MW. There seems to be approximately 5 MW “lost” in the process. This can represent approximately 10% of the chiller capacity output, making the chiller scenario look less optimal.
From a heat rate perspective, this 10% is being lost from the steam cycle, where the additional exhaust flow provided by chilling should be providing “free” MWs at the STG.
On the other hand, if we consider firing, we see that firing is credited with over 78 MW when considered first but only 73 MW when considered second. Again, we are “missing” approximately 5 MW in the process.
We believe that due to the higher heat rate condition, firing would be dispatched only after the chillers are operating at full capacity. Shown below is the typical dispatch order for the S207FA plant studied: Therefore, we propose that in the order of analysis, chillers should be evaluated first, and then firing second. This parallels the reality of in-field dispatch order, such as experienced at the plant shown on page 9. Nonetheless, we still believe that the value of duct firing is such that no matter what order it is analyzed, it should usually be included in the final design. Finally, the HRSG heat transfer surface will be best optimized during the design phase when GT inlet is set to a constant temperature, such as 50F.
Dispatch Order
0
100,000
200,000
300,000
400,000
500,000
600,000
1 2 3 4
Net
Pow
er, k
W
452,183 kW@ 6,371 BTU / kWHr
BASE CASE
73,394 kW@ 8,440 BTU / kWHr
Firing
16,874kW@ 7,894 BTU / kWHr
CHILLING to 50F
enhanced turn-down capability and operational
flexibility
36,865kW@ 6,799 BTU / kWHr
CHILLING to DP

Comparison of Power Enhancement Options For Green-Field Combined Cycle Power Plants Rev 02, February 2004
35
Conclusion Clearly, the data shows that as more augmentation capacity is added, the better the plant’s blended cost becomes, and the more predictable and controllable its output becomes. Although we do not provide a thorough economic analysis of operations in this study (spark-spread and capital recovery), we can be assured that the highly augmented plants will enjoy the superior economic returns. Increased returns are assured through maximum output during the lucrative summer peaking season and through operational flexibility that allows the Owner to react to changing economic conditions. This detailed operational economic information will be provided in a follow-up study in the future.
We have set out to provide an independent evaluation of front-end augmentation with the recognition that our industry will take the front-end of the combined cycle to where most have already taken the back-end:
The logical conclusion is to maximize combined-cycle plant output and flexibility with active power augmentation systems such as chillers and duct firing, rather than react helplessly to ambient conditions with uncontrollable passive systems.
The goal should not be the “lowest first cost”, but rather, the “best optimized cost”.
We challenge the pre-disposition of many to believe that the low capital cost of fogging systems makes this the most desirable system. We have shown that the economics of the chilled plant meets or exceeds that of the fogged plant, if not in incremental cost, then clearly in blended overall plant costs, and certainly in NPV.
We challenge the mistaken notion that chilling and firing are “either / or” technologies; in fact, they work best together. We advocate both technologies.
We have also shown the importance of evaluating augmentation options in the correct order. It is essential that the front-end of the GT (i.e., T2 turbine inlet temperature) be defined first before the back-end (HRSG & STG) is optimized. A chiller system should be set as the Base Case, which will fix the inlet temperature to a constant (usually 50°F) regardless of ambient temperature. This will also “fix” the mass flow and exhaust temperature so as to make optimization of the rest of the plant more economic and efficient.
Finally, living inside every unchilled combined-cycle plant is an extremely attractive peaker waiting to be called out. Chilling technology provides the incremental peaking capacity whose characteristics exceed the already-excellent economics and environmental characteristics of a typical aeroderivative peaker. In the current economic environment, such peaking capacity should make the difference between winning or losing in the development of a sophisticated pro-forma.

Comparison of Power Enhancement Options For Green-Field Combined Cycle Power Plants 37
APPENDIX A
Table 1: Summary of Performance Runs and Incremental Heat Rates
Table 2: Comparison of plant costs and incremental cost per kilowatt

Comparison of Power Enhancement Options For Green-Field Combined Cycle Power Plants 38Table A-1: Summary of Performance Runs and Incremental Heat Rates
Case #Inlet Air
ConditioningGTG Gross kW (each) STG Gross kW
Auxiliary Power kW
Net Plant Power, kW
Each GT Fuel Input, MMBtu/hr
(LHV)
Total Duct Burner Fuel Input, MMBtu/hr Each(LHV)
Net Plant Heat Rate, Btu/kWh
(LHV)1 None 147207 169942 12173 452183 1440.373 0.000 63712 Fogger 159850 174642 12489 481853 1531.400 0.000 63563 Chillers 173833 178055 19799 505922 1632.324 0.000 64534 None 147185 252408 16575 530203 1440.3 654.636 66685 Fogger 159831 254283 16839 557106 1531.337 635.466 66386 Chillers 173813 255761 24071 579316 1632.256 619.586 67057 Chillers 164800 175366 15918 489048 1565.722 0.000 6403
5a Fogger 159837 252405 16814 555265 1531.357 620.135 66336a Chillers 173824 252404 24028 576024 1632.294 592.609 6696
CasesInlet Air
Conditioning Duct FiringDelta Net
Power, kWDelta Energy,
MMBtu/hr
Incremental Heat Rate, Btu/kwh
Case 1 and 2 Fogger No 29670 182.054 6136 Incremental HR due to fogging without duct firing Case 1 and 3 Chillers No 53739 383.902 7144 Incremental HR due to chillers without duct firing Case 1 and 4 None Yes 78020 654.490 8389 Incremental HR due to duct firing without TICCase 2 and 5 Fogger Yes 75253 635.340 8443 Incremental HR due to duct firing with foggersCase 3 and 6 Chillers Yes 73394 619.450 8440 Incremental HR due to duct firing with chillersCase 4 and 5 Fogger Yes 26903 162.904 6055 Incremental HR due to fogging with duct firing (HPT flow = 1300kpph)Case 4 and 6 Chillers Yes 49113 348.862 7103 Incremental HR due to chillers with duct firing (HPT flow = 1300kpph)
Case 4 and 5a Fogger Yes 25062 147.613 5890 Incremental HR due to fogging with duct firing (ST Power at 252.4MW)Case 4 and 6a Chillers Yes 45821 321.961 7026 Incremental HR due to chillers with duct firing (ST Power at 252.4MW)
Notes:Case 1: No turbine inlet air conditioning. ST LSB=30in.Case 2: Turbine inlet air conditioning using foggers. ST LSB=30in.Case 3: Turbine inlet air conditioning using chillers. ST LSB=33.5in.Case 4: No turbine inlet air conditioning. ST LSB=33.5in., Fired to maintain HPT inlet flow at 1300 kpphCase 5: Turbine inlet air conditioning using foggers. ST LSB=33.5in., Fired to maintain HPT inlet flow at 1300 kpphCase 6: Turbine inlet air conditioning using chillers. ST LSB=33.5in., Fired to maintain HPT inlet flow at 1300 kpphCase 7: Turbine inlet air conditioning using chillers. ST LSB=33.5in., Inlet air chilled to dew point temperature of 67FCase 5a: Turbine inlet air conditioning using foggers. ST LSB=33.5in., Fired to maintain ST Power at 252.4MWCase 6a: Turbine inlet air conditioning using chillers. ST LSB=33.5in., Fired to maintain ST Power at 252.4MW
Performance Summary of all Cases Modeled
Incremental Heat Rate Calculation
(at High Average Ambient Condition of 95F, 40% RH)
Comments
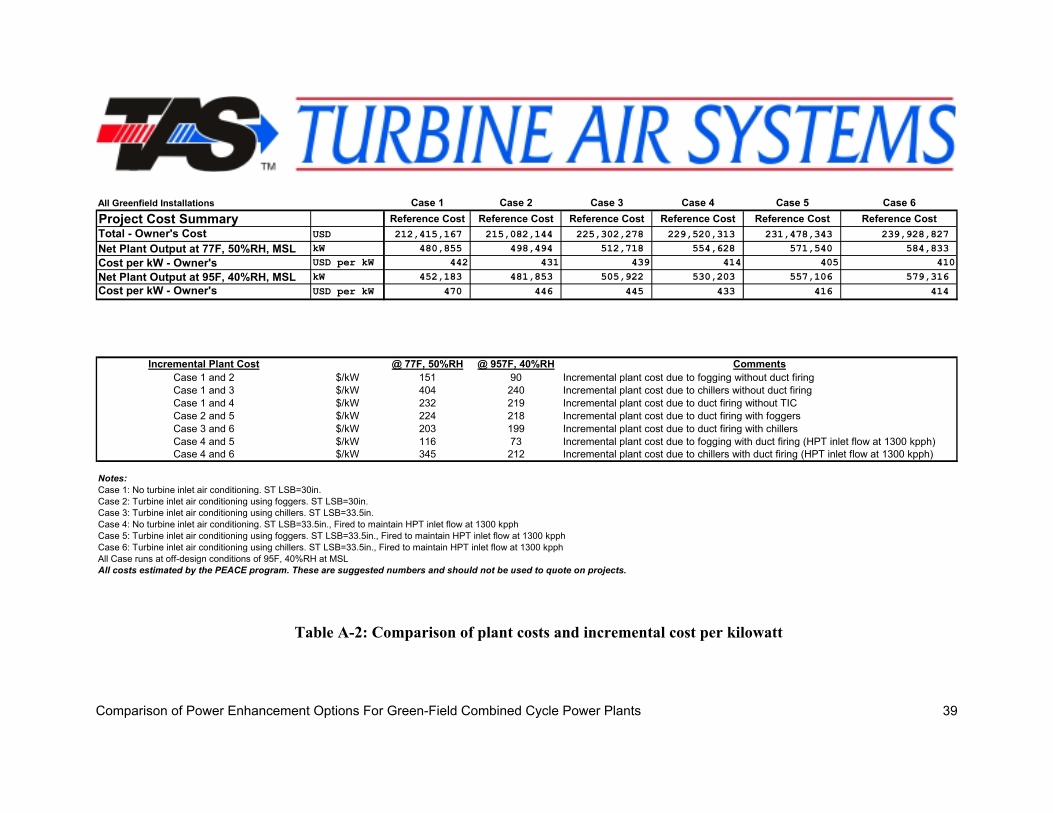
Comparison of Power Enhancement Options For Green-Field Combined Cycle Power Plants 39
All Greenfield Installations Case 1 Case 2 Case 3 Case 4 Case 5 Case 6Project Cost Summary Reference Cost Reference Cost Reference Cost Reference Cost Reference Cost Reference CostTotal - Owner's Cost USD 212,415,167 215,082,144 225,302,278 229,520,313 231,478,343 239,928,827Net Plant Output at 77F, 50%RH, MSL kW 480,855 498,494 512,718 554,628 571,540 584,833Cost per kW - Owner's USD per kW 442 431 439 414 405 410Net Plant Output at 95F, 40%RH, MSL kW 452,183 481,853 505,922 530,203 557,106 579,316Cost per kW - Owner's USD per kW 470 446 445 433 416 414
Incremental Plant Cost @ 77F, 50%RH @ 957F, 40%RHCase 1 and 2 $/kW 151 90 Incremental plant cost due to fogging without duct firing Case 1 and 3 $/kW 404 240 Incremental plant cost due to chillers without duct firing Case 1 and 4 $/kW 232 219 Incremental plant cost due to duct firing without TICCase 2 and 5 $/kW 224 218 Incremental plant cost due to duct firing with foggersCase 3 and 6 $/kW 203 199 Incremental plant cost due to duct firing with chillersCase 4 and 5 $/kW 116 73 Incremental plant cost due to fogging with duct firing (HPT inlet flow at 1300 kpph)Case 4 and 6 $/kW 345 212 Incremental plant cost due to chillers with duct firing (HPT inlet flow at 1300 kpph)
Notes:Case 1: No turbine inlet air conditioning. ST LSB=30in.Case 2: Turbine inlet air conditioning using foggers. ST LSB=30in.Case 3: Turbine inlet air conditioning using chillers. ST LSB=33.5in.Case 4: No turbine inlet air conditioning. ST LSB=33.5in., Fired to maintain HPT inlet flow at 1300 kpphCase 5: Turbine inlet air conditioning using foggers. ST LSB=33.5in., Fired to maintain HPT inlet flow at 1300 kpphCase 6: Turbine inlet air conditioning using chillers. ST LSB=33.5in., Fired to maintain HPT inlet flow at 1300 kpphAll Case runs at off-design conditions of 95F, 40%RH at MSLAll costs estimated by the PEACE program. These are suggested numbers and should not be used to quote on projects.
Comments
Table A-2: Comparison of plant costs and incremental cost per kilowatt

Comparison of Power Enhancement Options For Green-Field Combined Cycle Power Plants 40
APPENDIX B
Graphical Output of the power plant cycle for the following Cases:
• Case 1: No turbine inlet air conditioning. ST LSB=30 in
• Case 2: Turbine inlet air conditioning using foggers. ST LSB=30 in.
• Case 3a: (Future) Turbine inlet air conditioning using chillers. ST LSB=30.5".
• Case 3: Turbine inlet air conditioning using chillers. ST LSB=33.5".
• Case 4: No turbine inlet air conditioning. ST LSB=33.5 in., Fired to maintain HPT inlet flow at 1300 kpph
• Case 5: Turbine inlet air conditioning using foggers. ST LSB=33.5 in., Fired to maintain HPT inlet flow at 1300 kpph
• Case 6: Turbine inlet air conditioning using chillers. ST LSB=33.5 in., Fired to maintain HPT inlet flow at 1300 kpph
• Case 7: Turbine inlet air conditioning using chillers. ST LSB=33.5 in., Inlet air chilled to dew point temperature of 67F

Comparison of Power Enhancement Options For Green-Field Combined Cycle Power Plants 41
GT MASTER 10.3.2 Azim Jivan
1347 07-30-2002 11:41:19 file=C:\BPG\Panda\Thermoflow\Runs for Proposal 07052002\Case 1 No TIC No firing 95F.gtm
95DB, 40%RH, MSL, 30in ST Exh. EndNo inlet air conditioning, No duct firing, High ambient temperature
Net Power 452182 kWLHV Heat Rate 6371 BTU/kWh
p[psia], T[F], M[kpph], Steam Properties: IAPWS-IF97
1X GE 7241FA 2 X GT
147207 kW
14.7 p 95 T 40 %RH 3236 m 0 ft elev.
14.59 p 95 T 3236 m
User Defined 69.57 m
365 T 59 TLHV 1440373 kBTU/h
207.4 p 749 T
197 p 2409 T
3305 m
15.23 p 1151 T 6611 M
74.55 %N2+Ar 12.62 %O2 3.672 %CO2+SO2 9.153 %H2O
1148 T 6611 M
1148 1124 1089 1058 1002 886 883 611 582 582 578 526 477 331 328
260 T 6611 M
169942 kW
DAC
FW
1.189 p 108 T 969.7 M
108 T
18.88 p 225 T 1123.1 M
LTE
108 T 976.6 M
225 T 18.84 p 225 T
123 T
146.5 M
98.02 M
4.571 M
80.64 p 313 T 4.571 M
LPB
78.32 p 551 T 4.571 M
LPS
4.571 M 76.07 p 549 T
207.3 M
454 T
IPE2
98.02 M
480.9 p 463 T 109.3 M
IPB
474.6 p 554 T 109.3 M
IPS1
467.7 p 633 T 109.3 M
IPS2
862.7 M
454 T
HPE1
1522.8 p 543 T 846.4 M
HPE2
1504.1 p 587 T 846.4 M
HPE3
1504.1 p 597 T 846.4 M
HPB1
1494.4 p 881 T 846.4 M
HPS0
1467.8 p 989 T 846.4 M
HPS1
1460.6 p 1054 T 855.3 M
HPS3
1418 p 1050 T 855.3 M
1460.6 p 1054 T
8.893 M
16.34 M
833.3 M 482 p 763 T
466.1 p 945 T 942.6 M
RH1
454.2 p 1053 T 950 M
RH3
950 M 441.3 p 1050 T
7.447 M
Case 1: No turbine inlet air conditioning. ST LSB=30in

Comparison of Power Enhancement Options For Green-Field Combined Cycle Power Plants 42
GT MASTER 10.3.2 Azim Jivan
1347 07-30-2002 17:04:44 file=C:\BPG\Panda\Thermoflow\Runs for Proposal 07052002\Case 2 Fogger No firing 95F.gtm
95DB, 40%RH, MSL, 30in. ST exh.end selectedFogger on, No duct firing, High ambient temperature
Net Power 481854 kWLHV Heat Rate 6356 BTU/kWh
p[psia], T[F], M[kpph], Steam Properties: IAPWS-IF97
14.79 m Fogger
1X GE 7241FA 2 X GT
159850 kW
14.7 p 95 T 40 %RH 3367 m 0 ft elev.
14.59 p 76 T 3381 m
User Defined 73.97 m
365 T 59 TLHV 1531400 kBTU/h
217.1 p 729 T
206.3 p 2412 T
3455 m
15.25 p 1136 T 6911 M
74 %N2+Ar 12.37 %O2 3.724 %CO2+SO2 9.902 %H2O
1133 T 6911 M
1133 1111 1079 1050 996 881 878 613 585 584 580 529 479 334 327
260 T 6911 M
174642 kW
DAC
FW
1.211 p 108 T 1001.8 M
108 T
19.06 p 226 T 1160.1 M
LTE
108 T 1008.8 M
225 T 19.05 p 225 T
124 T
151.3 M
103.3 M
12.05 M
79.75 p 312 T 12.05 M
LPB
77.25 p 553 T 12.05 M
LPS
12.05 M 74.81 p 551 T
221.6 M
456 T
IPE2
103.3 M
486.7 p 464 T 118.3 M
IPB
479.6 p 555 T 118.3 M
IPS1
472.8 p 632 T 118.3 M
IPS2
878.5 M
455 T
HPE1
1545.5 p 545 T 868.1 M
HPE2
1525.8 p 589 T 868.1 M
HPE3
1525.8 p 599 T 868.1 M
HPB1
1516.2 p 886 T 868.1 M
HPS0
1512 p 988 T 868.1 M
HPS1
1477.3 p 1054 T 874 M
HPS3
1434.2 p 1050 T 874 M
1477.3 p 1054 T
5.912 M
10.42 M
851.5 M 487.3 p 763 T
471.2 p 944 T 969.8 M
RH1
459.1 p 1053 T 974.3 M
RH3
974.3 M 446.1 p 1050 T
4.506 M
Case 2: Turbine inlet air conditioning using foggers. ST LSB=30in

Comparison of Power Enhancement Options For Green-Field Combined Cycle Power Plants 43
GT MASTER 10.3.2 Azim Jivan
1347 07-31-2002 11:49:45 file=C:\BPG\Panda\Thermoflow\Runs for Proposal 07052002\Case 3 Chillers manually sized No firing 95F.gtm
95DB, 40%RH, MSL, 33.5in ST exh. end selectedChilling T2 = 50F, No duct firing, Chiller sized at 1.56 ton/kpph , COP 6.3
Net Power 505922 kWLHV Heat Rate 6453 BTU/kWh
p[psia], T[F], M[kpph], Steam Properties: IAPWS-IF97
1X GE 7241FA 2 X GT
173833 kW
14.7 p 95 T 40 %RH 3607 m 0 ft elev.
14.55 p 50 T 3584 m
User Defined 78.84 m
365 T 59 TLHV 1632324 kBTU/h
229.8 p 711 T
218.3 p 2421 T
3663 m
15.27 p 1117 T 7326 M
75.24 %N2+Ar 12.62 %O2 3.767 %CO2+SO2 8.375 %H2O
1114 T 7326 M
1114 1096 1067 1039 986 874 871 616 588 587 582 533 481 338 329
263 T 7326 M
178055 kW
DAC
FW
1.226 p 109 T 1026.9 M
109 T
19.42 p 227 T 1189.1 M
LTE
109 T 1034 M
226 T 19.42 p 226 T
124 T
155.1 M
110.7 M
17.13 M
80.94 p 313 T 17.13 M
LPB
78.25 p 556 T 17.13 M
LPS
17.13 M 75.59 p 553 T
239.9 M
455 T
IPE2
110.7 M
492.1 p 465 T 129.3 M
IPB
484.7 p 557 T 129.3 M
IPS1
477.4 p 631 T 129.3 M
IPS2
887.6 M
457 T
HPE1
1566.6 p 546 T 887.6 M
HPE2
1553.5 p 591 T 887.6 M
HPE3
1553.5 p 601 T 887.6 M
HPB1
1521.3 p 883 T 887.6 M
HPS0
1505.7 p 984 T 887.6 M
HPS1
1493.3 p 1054 T 887.6 M
HPS3
1449.8 p 1050 T 887.6 M
1493.3 p 1054 T
864.8 M 492 p 762 T
475.5 p 942 T 994.1 M
RH1
463.5 p 1052 T 994.1 M
RH3
994.1 M 450.4 p 1049 T
Case 3: Turbine inlet air conditioning using chillers. ST LSB=33.5in.

Comparison of Power Enhancement Options For Green-Field Combined Cycle Power Plants 44
GT MASTER 10.3.2 Azim Jivan
1347 08-06-2002 21:44:12 file=C:\BPG\Panda\Thermoflow\Runs for Proposal 07052002\Case 4 No TIC Fired 95F HP 1300kpph.gtm
95DB, 40%RH, MSL, Auto HRSG LayoutNo TIC, 33.5 in ST exh. end, Fired for HPT flow = 1300kpph
Net Power 530203 kWLHV Heat Rate 6668 BTU/kWh
p[psia], T[F], M[kpph], Steam Properties: IAPWS-IF97
1X GE 7241FA 2 X GT
147185 kW
14.7 p 95 T 40 %RH 3236 m 0 ft elev.
14.59 p 95 T 3236 m
User Defined 69.57 m
365 T 59 TLHV 1440300 kBTU/h
207.4 p 749 T
197 p 2409 T
3305 m
15.23 p 1151 T 6611 M
74.55 %N2+Ar 12.62 %O2 3.672 %CO2+SO2 9.152 %H2O
1148 T 6611 M
1148 1113 1393 1342 1242 1065 1064 671 618 615 523 497 496 338 328
237 T 6642 M
252408 kW
DAC
FW
1.235 p 109 T 1374.9 M
109 T
User Defined 31.62 M
17.11 p 220 T 1593 M
LTE
109 T 1385.3 M
220 T 17.11 p 220 T
124 T
207.8 M
117.3 M
17.5 M
79.53 p 312 T 17.5 M
LPB
78.04 p 411 T 17.5 M
LPS
17.5 M 76.66 p 409 T
172.4 M
418 T
IPE2
117.3 M
475.4 p 462 T 55.13 M
IPB
474.6 p 579 T 55.13 M
IPS1
464.8 p 645 T 55.13 M
IPS2
1312.7 M
405 T
HPE1
1955.6 p 519 T 1283.9 M
HPE2
1943 p 577 T 1283.9 M
HPE3
1943 p 632 T 1283.9 M
HPB1
1915.8 p 886 T 1283.9 M
HPS0
1890.6 p 1000 T 1283.9 M
HPS1
1886.8 p 1054 T 1300 M
HPS3
1831.8 p 1050 T 1300 M
1886.8 p 1054 T
16.11 M
28.79 M
1266.6 M 479 p 693 T
460.6 p 956 T 1321.7 M
RH1
451.4 p 1053 T 1334.3 M
RH3
1334.3 M 438.7 p 1050 T
12.69 M
Case 4: No turbine inlet air conditioning. ST LSB=33.5in., Fired to maintain HPT inlet flow at 1300 kpph

Comparison of Power Enhancement Options For Green-Field Combined Cycle Power Plants 45
GT MASTER 10.3.2 Azim Jivan
1347 08-06-2002 22:18:41 file=C:\BPG\Panda\Thermoflow\Runs for Proposal 07052002\Case 5 Fogger Fired 77F HP 1300kpph.gtm
95FDB, 50%RH, MSL, Auto HRSG LayoutFogger, 33.5 in ST exh. end, Fired to get HPT flow = 1300kpph
Net Power 557107 kWLHV Heat Rate 6638 BTU/kWh
p[psia], T[F], M[kpph], Steam Properties: IAPWS-IF97
14.79 m Fogger
1X GE 7241FA 2 X GT
159831 kW
14.7 p 95 T 40 %RH 3367 m 0 ft elev.
14.59 p 76 T 3381 m
User Defined 73.96 m
365 T 59 TLHV 1531337 kBTU/h
217.1 p 729 T
206.3 p 2412 T
3455 m
15.25 p 1136 T 6911 M
74 %N2+Ar 12.37 %O2 3.724 %CO2+SO2 9.902 %H2O
1133 T 6911 M
1133 1102 1362 1314 1218 1049 1048 673 622 619 530 500 499 344 330
242 T 6941 M
254283 kW
DAC
FW
1.242 p 109 T 1392.4 M
109 T
User Defined 30.69 M
17.6 p 221 T 1613.1 M
LTE
109 T 1402.7 M
221 T 17.6 p 221 T
124 T
210.4 M
124.9 M
25.33 M
80.6 p 313 T 25.33 M
LPB
78.83 p 408 T 25.33 M
LPS
25.33 M 77.17 p 406 T
194.3 M
417 T
IPE2
124.9 M
479.3 p 463 T 69.4 M
IPB
478.6 p 579 T 69.4 M
IPS1
467.8 p 642 T 69.4 M
IPS2
1308 M
407 T
HPE1
1973.8 p 521 T 1291.3 M
HPE2
1959.4 p 578 T 1291.3 M
HPE3
1959.4 p 633 T 1291.3 M
HPB1
1931.4 p 881 T 1291.3 M
HPS0
1906.1 p 993 T 1291.3 M
HPS1
1902.5 p 1054 T 1300 M
HPS3
1847.1 p 1050 T 1300 M
1902.5 p 1054 T
8.646 M
16.72 M
1266.5 M 482.1 p 692 T
463.2 p 952 T 1335.9 M
RH1
454.3 p 1053 T 1344 M
RH3
1344 M 441.5 p 1050 T
8.078 M
Case 5: Turbine inlet air conditioning using foggers. ST LSB=33.5in., Fired to maintain HPT inlet flow at 1300 kpph

Comparison of Power Enhancement Options For Green-Field Combined Cycle Power Plants 46
GT MASTER 10.3.2 Azim Jivan
1347 08-06-2002 22:53:50 file=C:\BPG\Panda\Thermoflow\Runs for Proposal 07052002\Case 6 Chillers manually sized Fired 95F HP 1300kpph.gtm
95DB, 40%RH, MSL, Auto HRSG LayoutChiller - manually sized, 33.5 in ST exh. end, Fired to get HPTflow = 1300kpph
Net Power 579315 kWLHV Heat Rate 6705 BTU/kWh
p[psia], T[F], M[kpph], Steam Properties: IAPWS-IF97
1X GE 7241FA 2 X GT
173813 kW
14.7 p 95 T 40 %RH 3607 m 0 ft elev.
14.55 p 50 T 3584 m
User Defined 78.84 m
365 T 59 TLHV 1632256 kBTU/h
229.8 p 711 T
218.3 p 2421 T
3663 m
15.28 p 1117 T 7326 M
75.24 %N2+Ar 12.62 %O2 3.767 %CO2+SO2 8.375 %H2O
1114 T 7326 M
1114 1087 1332 1286 1194 1034 1032 675 626 623 538 502 501 350 332
246 T 7356 M
255761 kW
DAC
FW
1.248 p 109 T 1408.3 M
109 T
User Defined 29.93 M
18.17 p 223 T 1631.4 M
LTE
109 T 1418.6 M
223 T 18.11 p 223 T
124 T
212.8 M
133.7 M
34.11 M
81.61 p 313 T 34.11 M
LPB
79.57 p 405 T 34.11 M
LPS
34.11 M 77.6 p 403 T
218.3 M
417 T
IPE2
133.7 M
482.6 p 463 T 84.56 M
IPB
481.5 p 579 T 84.56 M
IPS1
470 p 639 T 84.56 M
IPS2
1300 M
409 T
HPE1
1992.4 p 522 T 1300 M
HPE2
1975.6 p 580 T 1300 M
HPE3
1975.6 p 634 T 1300 M
HPB1
1954.9 p 876 T 1300 M
HPS0
1938.2 p 986 T 1300 M
HPS1
1918.3 p 1054 T 1300 M
HPS3
1862.3 p 1050 T 1300 M
1918.3 p 1054 T
1266.6 M 484.5 p 691 T
464.3 p 948 T 1351.1 M
RH1
456.3 p 1052 T 1351.1 M
RH3
1351.1 M 443.5 p 1049 TCase 6: Turbine inlet air conditioning using chillers. ST LSB=33.5in., Fired to maintain HPT inlet flow at 1300 kpph

Comparison of Power Enhancement Options For Green-Field Combined Cycle Power Plants 47
GT MASTER 10.3.2 Azim Jivan
1347 07-31-2002 16:54:39 file=C:\BPG\Panda\Thermoflow\Runs for Proposal 07052002\Case 7 Chillers manually sized No firing 95F DP.gtm
95DB, 40%RH, MSL, 33.5in ST exh. end selectedChilling T2 = 67F (Dew Point), No duct firing, 1 of 3 chillers operating
Net Power 489048 kWLHV Heat Rate 6403 BTU/kWh
p[psia], T[F], M[kpph], Steam Properties: IAPWS-IF97
1X GE 7241FA 2 X GT
164800 kW
14.7 p 95 T 40 %RH 3449 m 0 ft elev.
14.55 p 67 T 3449 m
User Defined 75.63 m
365 T 59 TLHV 1565722 kBTU/h
221.4 p 723 T
210.3 p 2416 T
3525 m
15.24 p 1130 T 7049 M
74.5 %N2+Ar 12.47 %O2 3.742 %CO2+SO2 9.285 %H2O
1127 T 7049 M
1127 1104 1070 1042 988 875 872 613 585 584 579 530 478 336 327
260 T 7049 M
175366 kW
DAC
FW
1.212 p 108 T 1012 M
108 T
19.1 p 225 T 1171.7 M
LTE
108 T 1018.9 M
225 T 18.94 p 225 T
124 T
152.8 M
106.4 M
16.09 M
79.35 p 311 T 16.09 M
LPB
76.9 p 555 T 16.09 M
LPS
16.09 M 74.51 p 553 T
229.9 M
454 T
IPE2
106.4 M
484.6 p 464 T 123.4 M
IPB
477.7 p 556 T 123.4 M
IPS1
470.9 p 633 T 123.4 M
IPS2
879.4 M
455 T
HPE1
1537.9 p 545 T 863 M
HPE2
1525.4 p 589 T 863 M
HPE3
1525.4 p 599 T 863 M
HPB1
1494.2 p 886 T 863 M
HPS0
1479 p 988 T 863 M
HPS1
1466.9 p 1054 T 871 M
HPS3
1424.2 p 1050 T 870.9 M
1466.9 p 1054 T
7.929 M
16.41 M
848.6 M 485.3 p 763 T
469.1 p 945 T 972 M
RH1
457.3 p 1053 T 980.4 M
RH3
980.4 M 444.4 p 1050 T
8.476 M
Case 7: Turbine inlet air conditioning using chillers. ST LSB=33.5in., Inlet air chilled to dew point temperature of 67F