comparison of regularization penalties pt.2 ncsu statistical learning group will burton oct. 3 2014
TRANSCRIPT

Comparison of Regularization Penalties Pt.2
NCSU Statistical Learning Group
Will BurtonOct. 3 2014
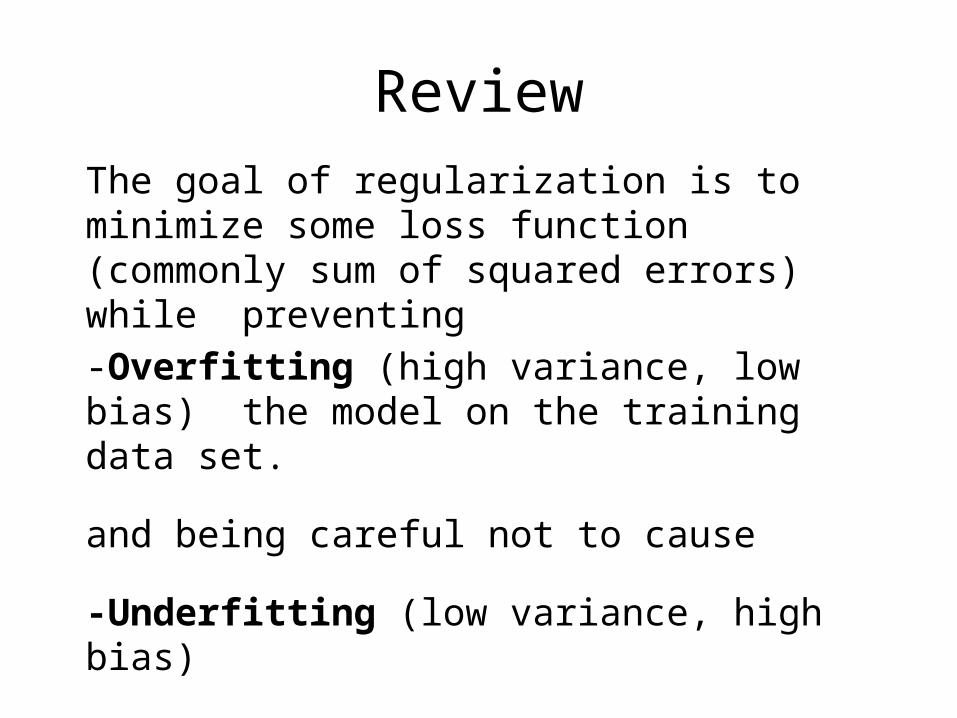
The goal of regularization is to minimize some loss function (commonly sum of squared errors) while preventing
-Overfitting (high variance, low bias) the model on the training data set.
and being careful not to cause
-Underfitting (low variance, high bias)
Review
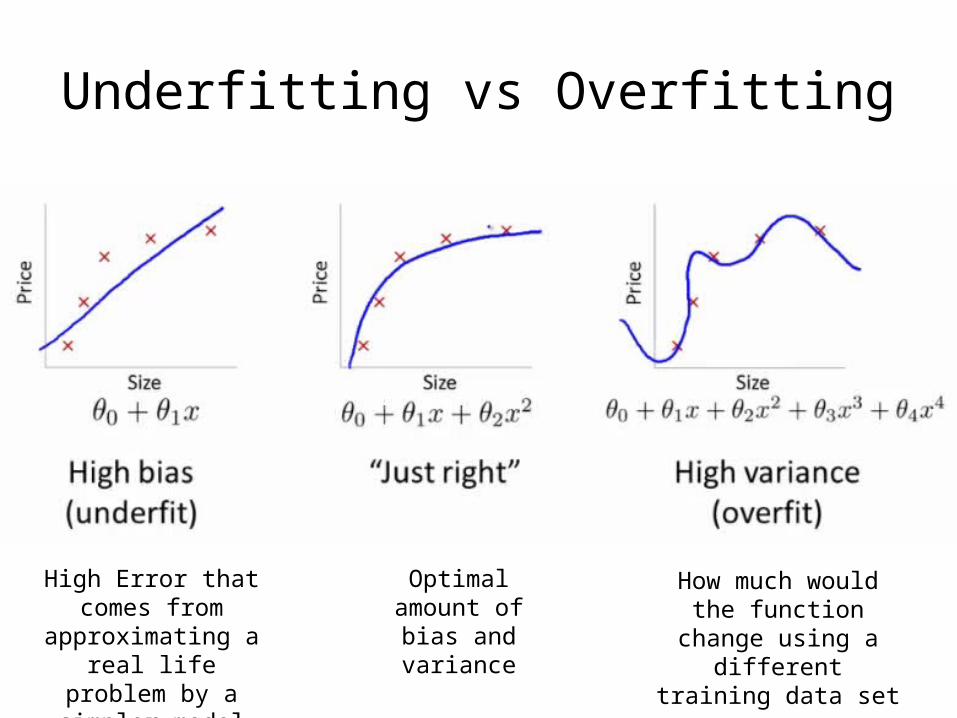
Underfitting vs Overfitting
High Error that comes from approximating a real life problem by a
simpler model
Optimal amount of bias and
variance
How much would the function change using a different training data
set
Review cont.
• Regularization resolves the overfitting problem by applying a penalty to coefficients in the loss function, preventing them from too closely matching the training data set.
• There are many different regularization penalties that can be applied according to the data type.
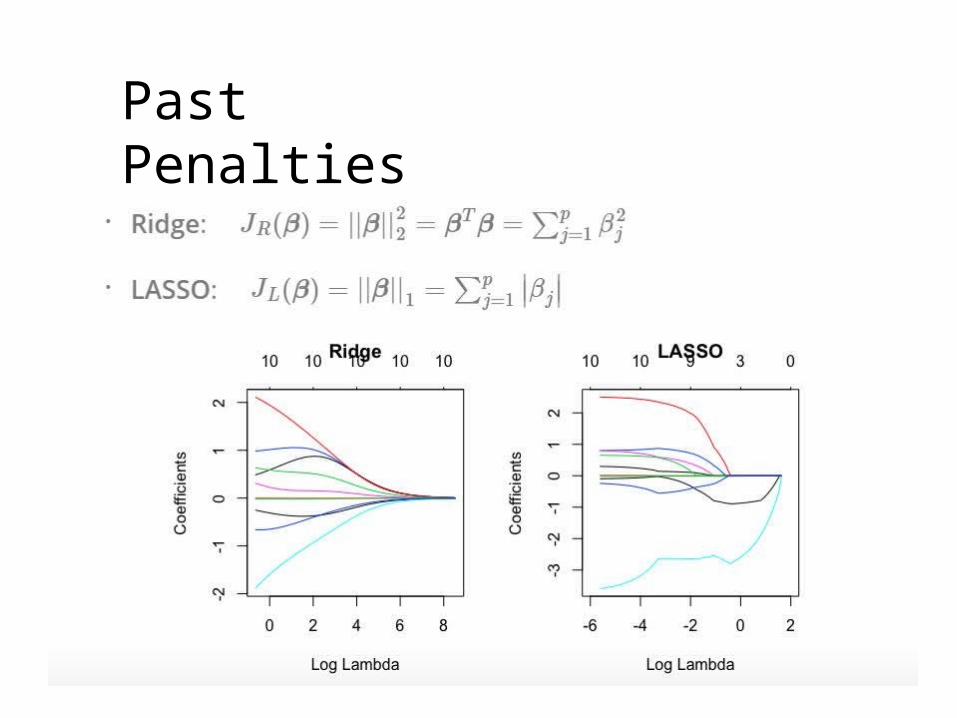
Past Penalties

Past Penalties
Additional Penalties
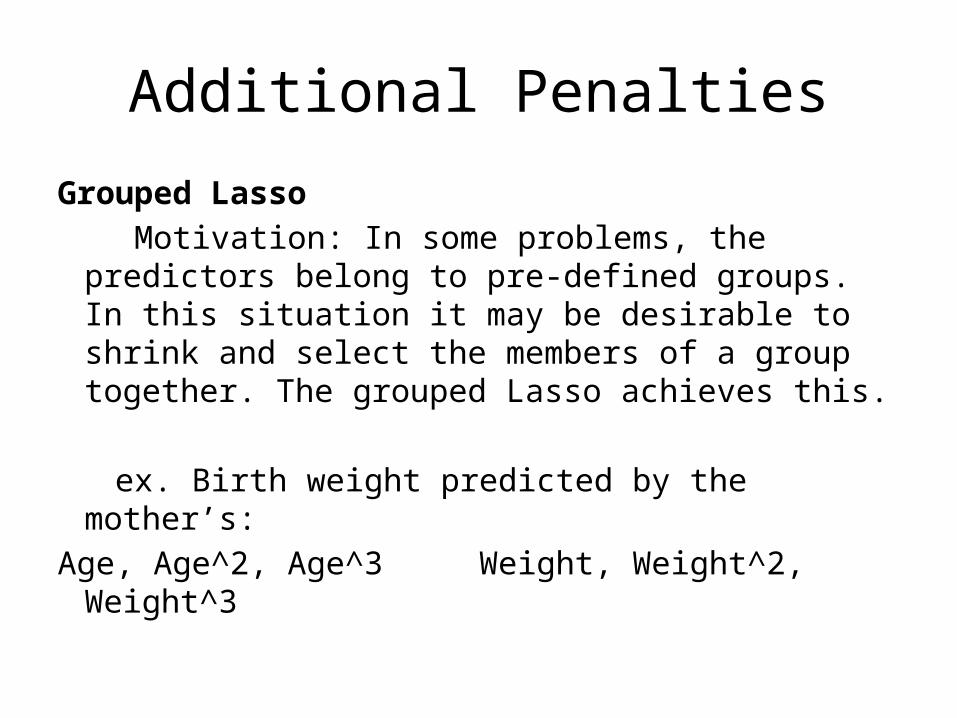
Grouped Lasso Motivation: In some problems, the predictors
belong to pre-defined groups. In this situation it may be desirable to shrink and select the members of a group together. The grouped Lasso achieves this.
ex. Birth weight predicted by the mother’s:Age, Age^2, Age^3 Weight, Weight^2, Weight^3
Grouped Lasso
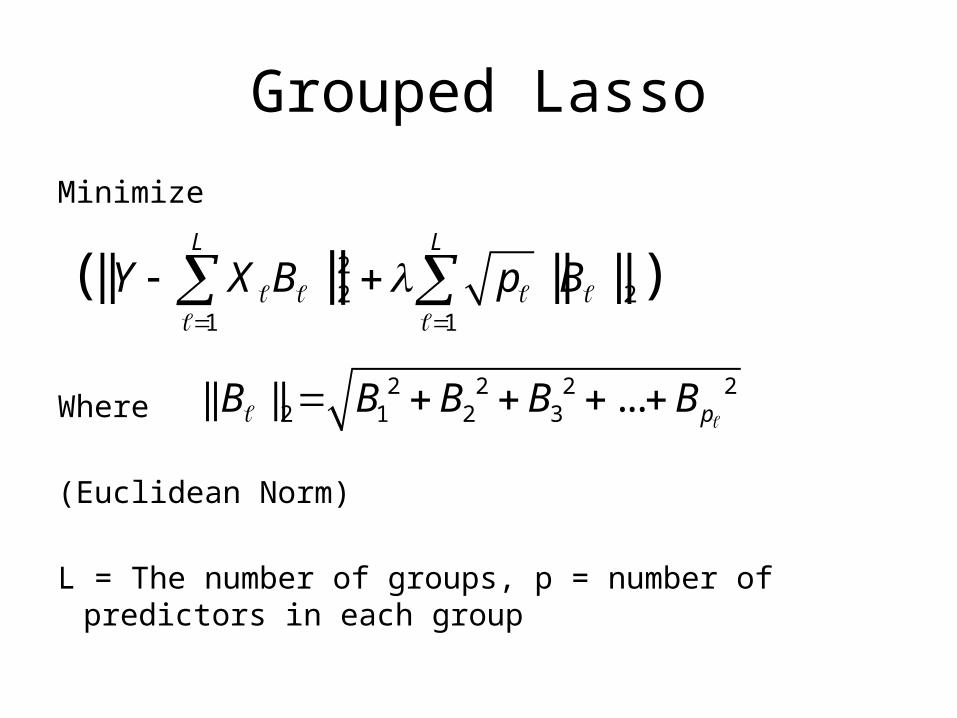
Minimize
Where (Euclidean Norm)
L = The number of groups, p = number of predictors in each group
22 2
1 1
|| || ||( || )L L
Y X B p B
2 2 2 22 1 2 3|| || ... pB B B B B
Grouped Lasso
1 2 3 4 5 6 7 8
1 4 10 5 3 5 4 20
2 6 22 9 6 6 25 22
3 7 40 1012 9 6 50
x x x x x x x x1 2 3
.54
.2
.1
.3
.6
.7
.9
.2
B
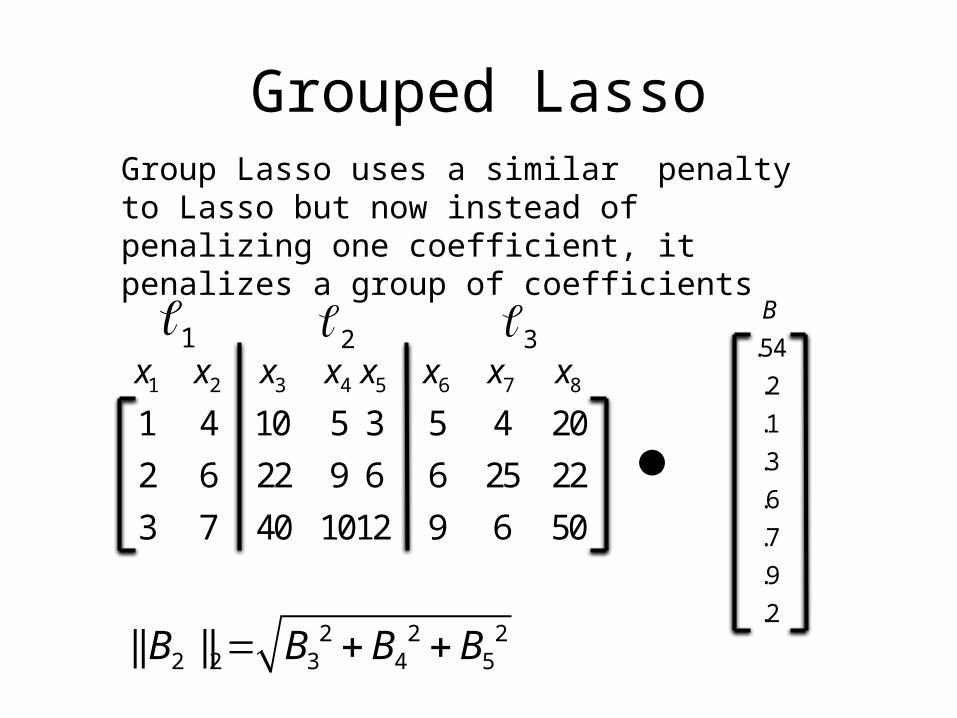
Group Lasso uses a similar penalty to Lasso but now instead of penalizing one coefficient, it penalizes a group of coefficients
2 2 22 2 3 4 5|| ||B B B B
Example-Group Lasso
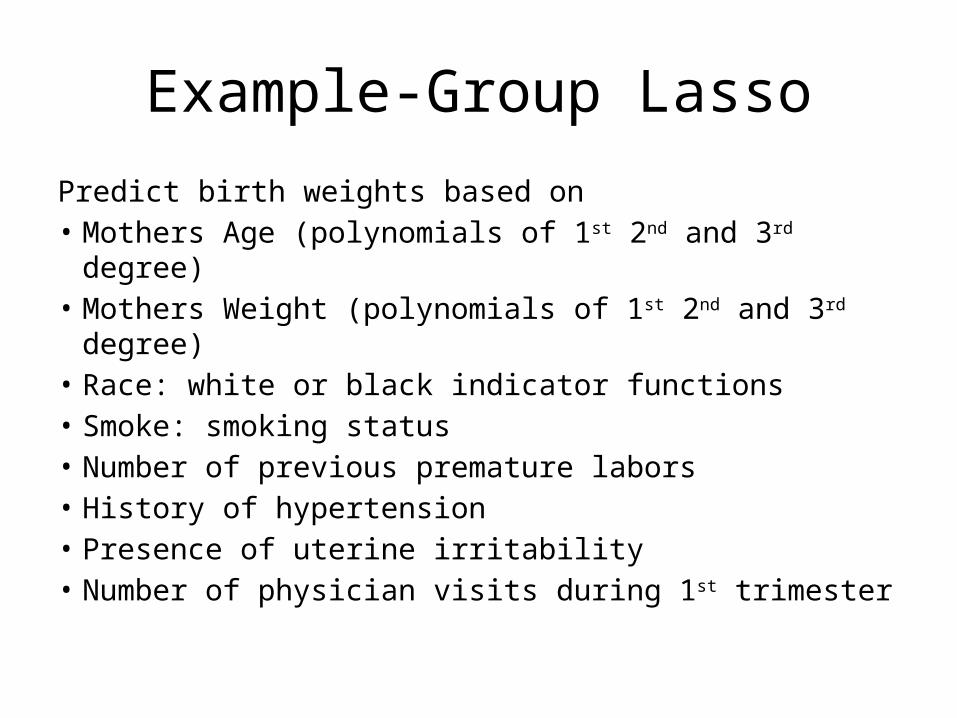
Predict birth weights based on • Mothers Age (polynomials of 1st 2nd and 3rd degree)• Mothers Weight (polynomials of 1st 2nd and 3rd degree)• Race: white or black indicator functions• Smoke: smoking status• Number of previous premature labors• History of hypertension• Presence of uterine irritability• Number of physician visits during 1st trimester
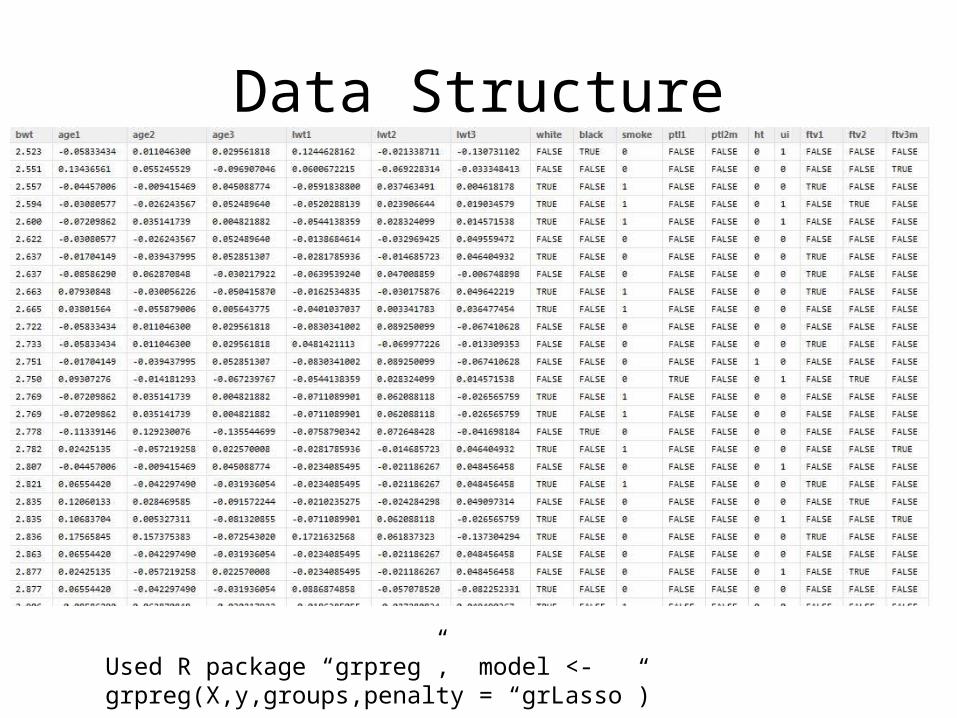
Data Structure
Used R package “grpreg”, model <- grpreg(X,y,groups,penalty = “grLasso”)
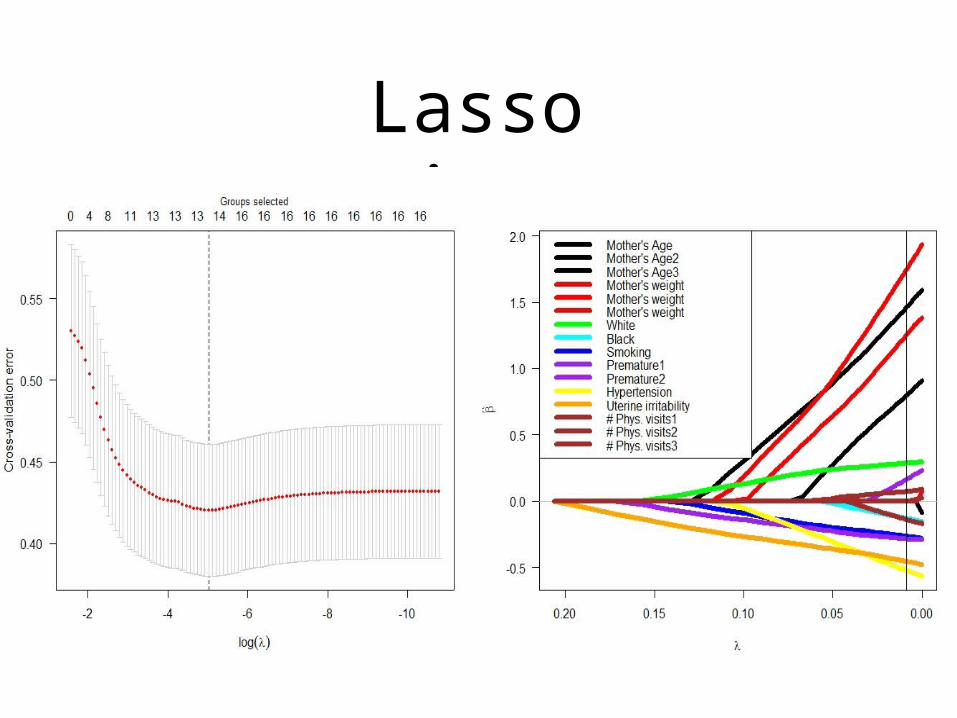
Lasso Fit
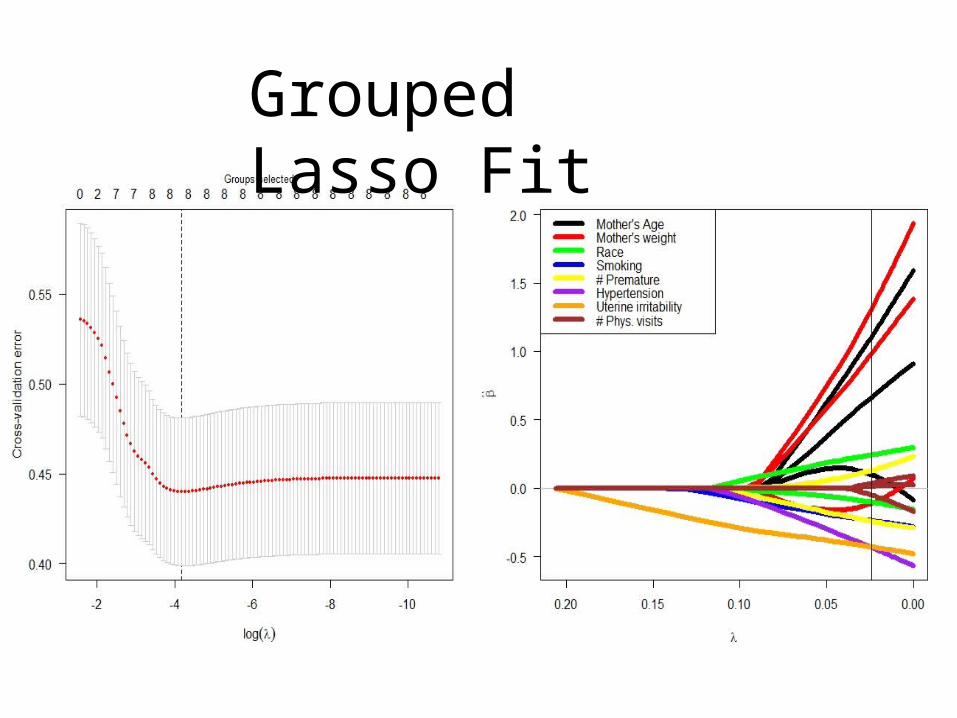
Grouped Lasso Fit
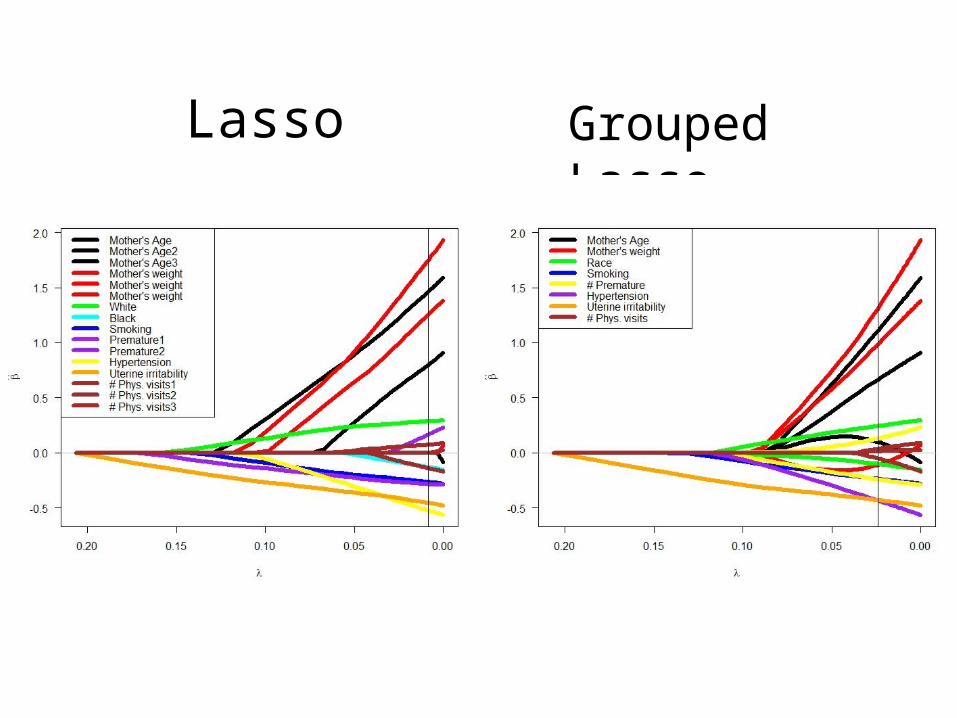
Grouped LassoLasso
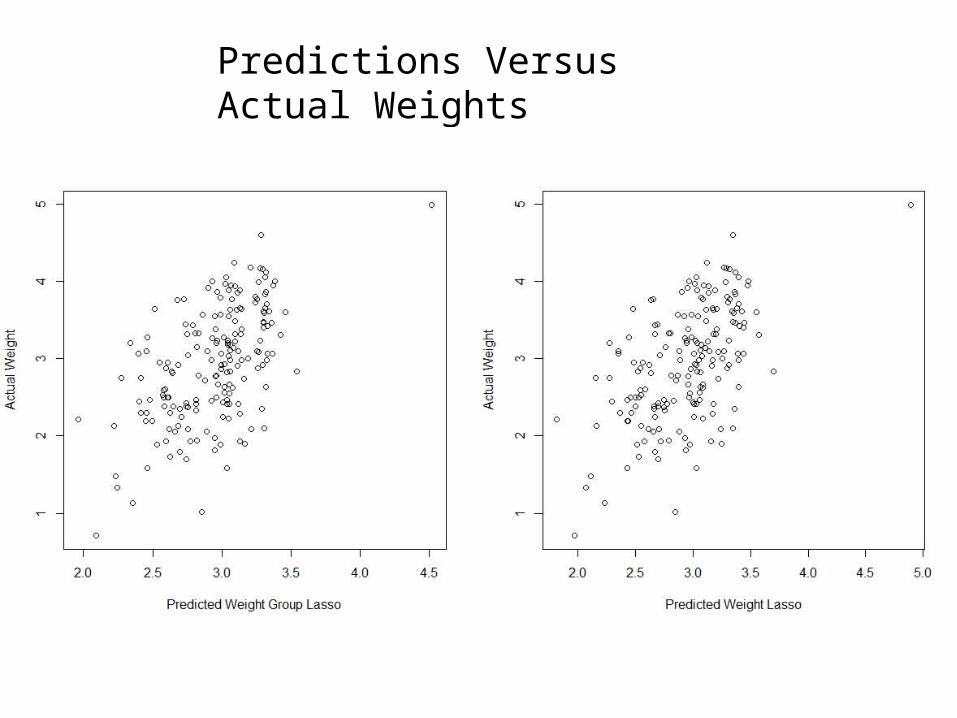
Predictions Versus Actual Weights
Other Penalties
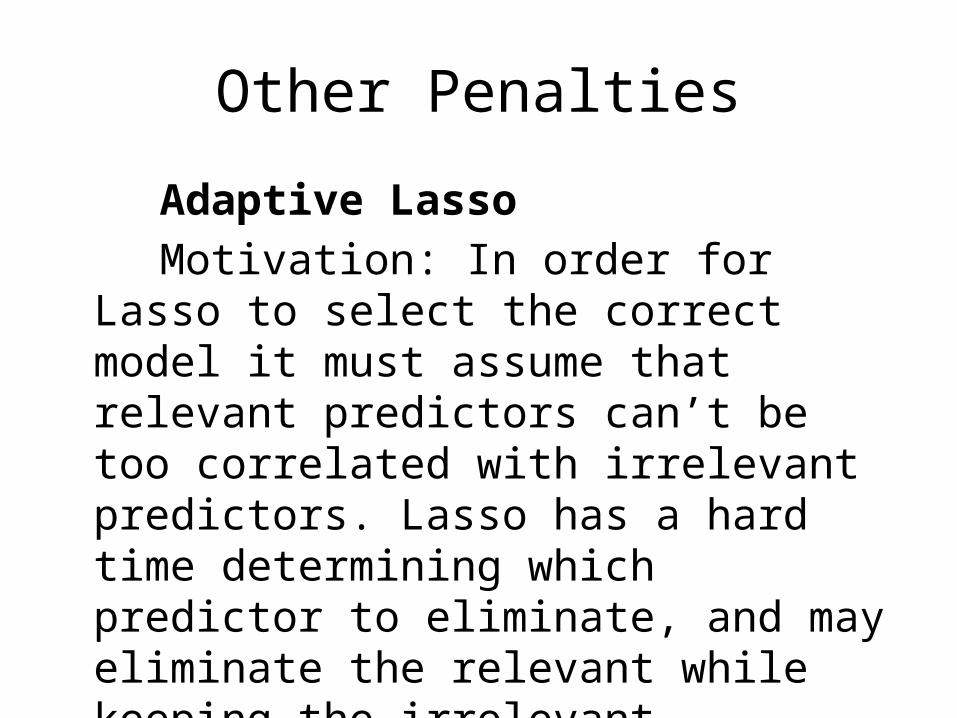
Adaptive Lasso Motivation: In order for Lasso to select the
correct model it must assume that relevant predictors can’t be too correlated with irrelevant predictors. Lasso has a hard time determining which predictor to eliminate, and may eliminate the relevant while keeping the irrelevant predictor.
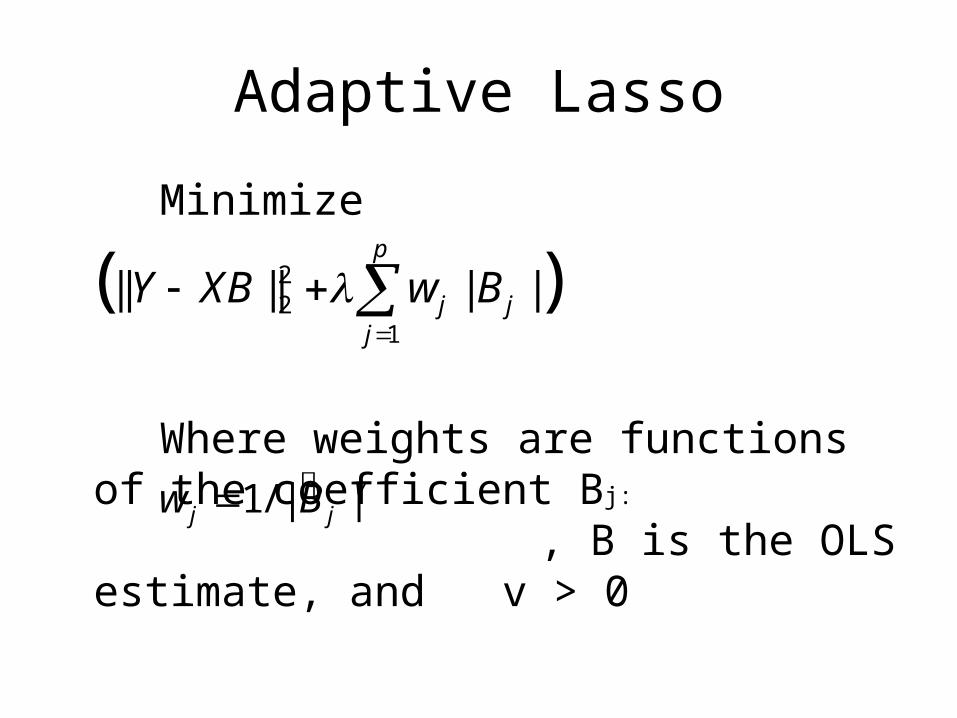
Adaptive Lasso
Minimize
Where weights are functions of the coefficient Bj: , B is the OLS estimate, and v > 0
22
1
|| || | |( )p
j jj
Y XB w B
1/ | |vj jw B
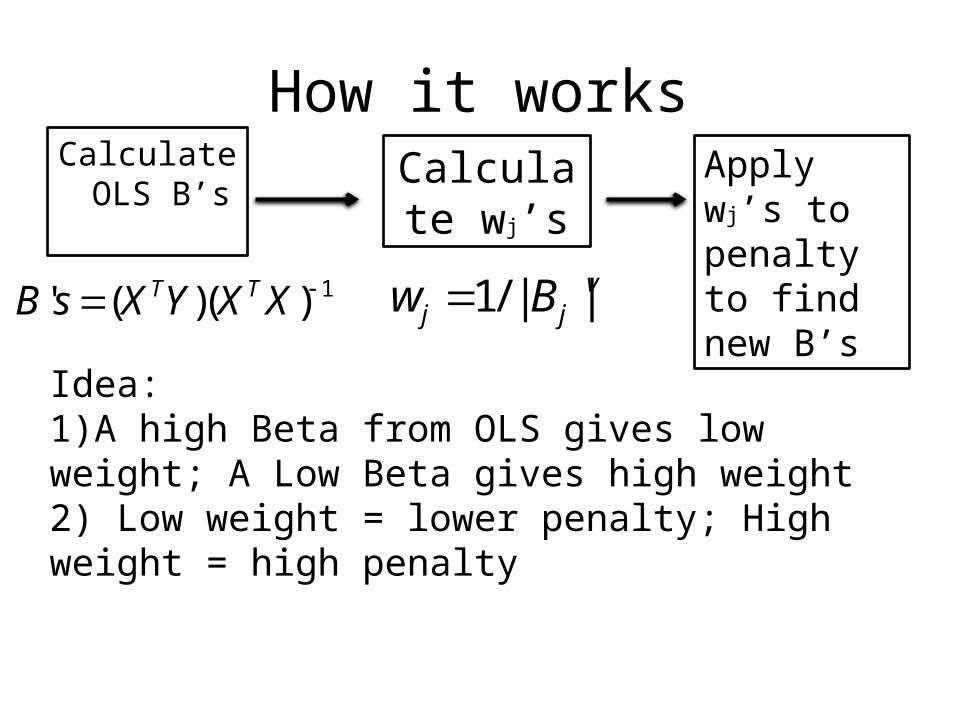
How it worksCalculate
OLS B’sCalculate
wj’s1' ( )( )T TB s X Y X X 1/ | |vj jw B
Apply wj’s to penalty to find new B’s
Idea:1)A high Beta from OLS gives low weight; A Low Beta gives high weight2) Low weight = lower penalty; High weight = high penalty
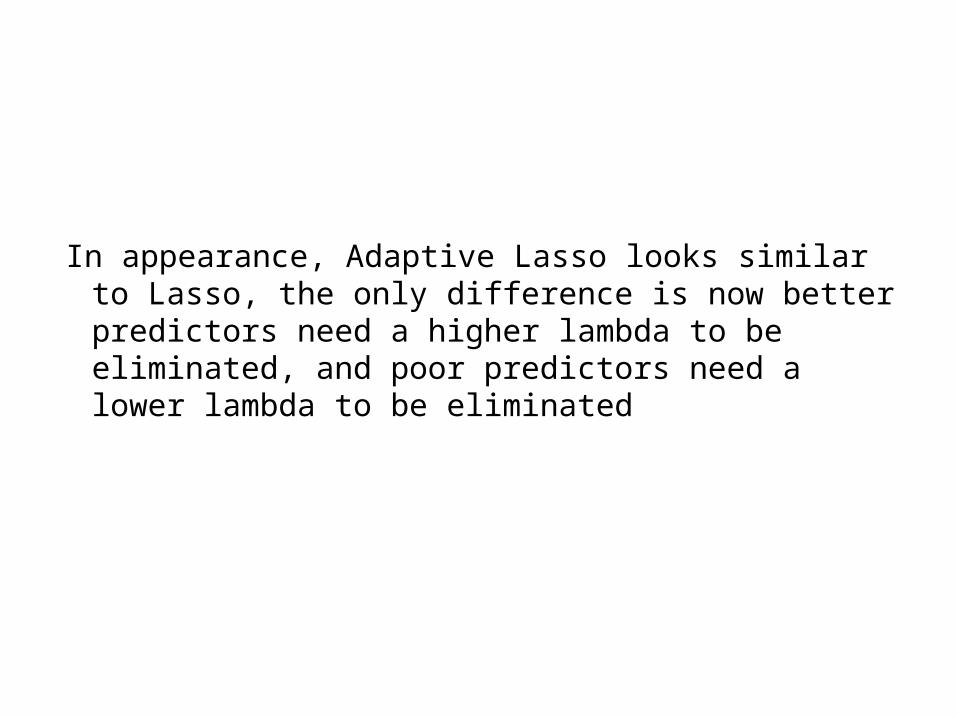
In appearance, Adaptive Lasso looks similar to Lasso, the only difference is now better predictors need a higher lambda to be eliminated, and poor predictors need a lower lambda to be eliminated
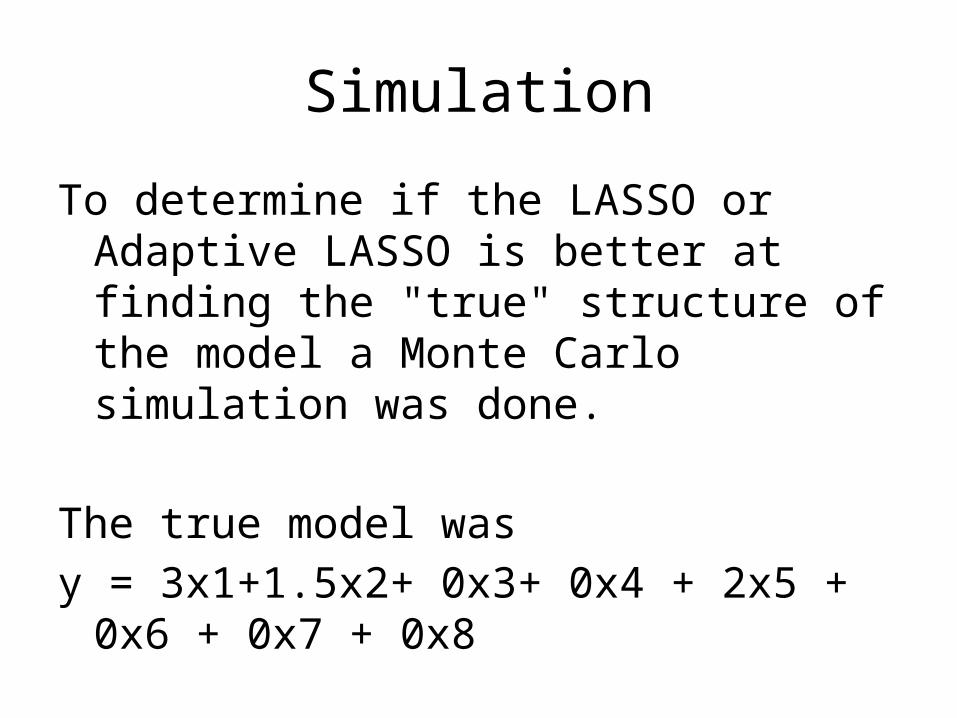
Simulation
To determine if the LASSO or Adaptive LASSO is better at finding the "true" structure of the model a Monte Carlo simulation was done.
The true model was y = 3x1+1.5x2+ 0x3+ 0x4 + 2x5 + 0x6 + 0x7 + 0x8
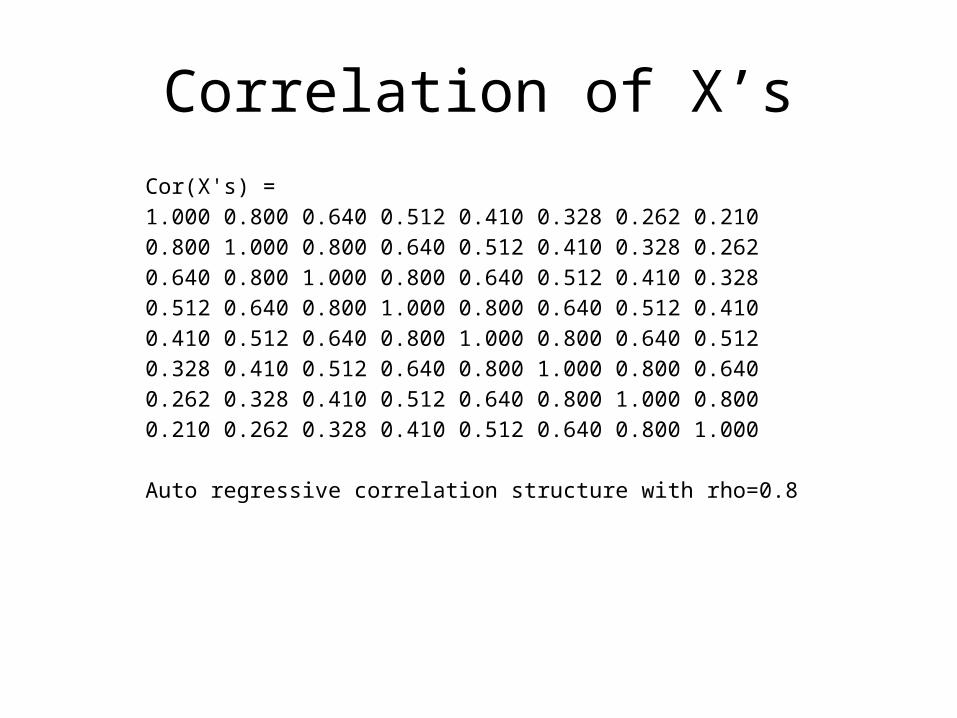
Correlation of X’s
Cor(X's) = 1.000 0.800 0.640 0.512 0.410 0.328 0.262 0.2100.800 1.000 0.800 0.640 0.512 0.410 0.328 0.2620.640 0.800 1.000 0.800 0.640 0.512 0.410 0.3280.512 0.640 0.800 1.000 0.800 0.640 0.512 0.4100.410 0.512 0.640 0.800 1.000 0.800 0.640 0.5120.328 0.410 0.512 0.640 0.800 1.000 0.800 0.6400.262 0.328 0.410 0.512 0.640 0.800 1.000 0.8000.210 0.262 0.328 0.410 0.512 0.640 0.800 1.000
Auto regressive correlation structure with rho=0.8
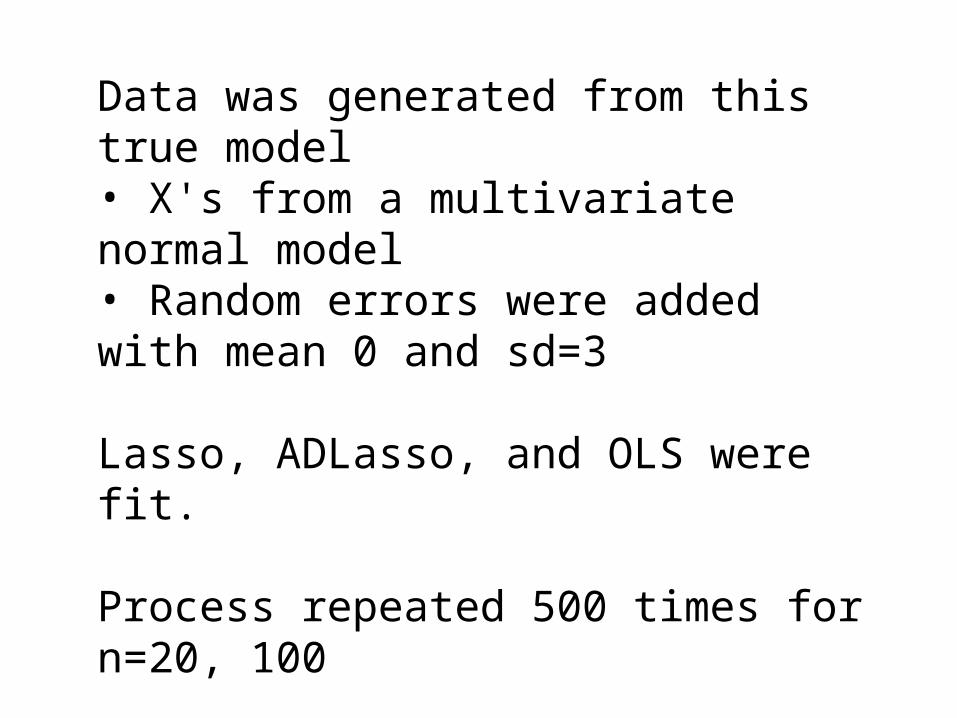
Data was generated from this true model • X's from a multivariate normal model• Random errors were added with mean 0 and sd=3
Lasso, ADLasso, and OLS were fit.
Process repeated 500 times for n=20, 100
Average and median prediction error reported along with whether or not correct structure (oracle) was selected
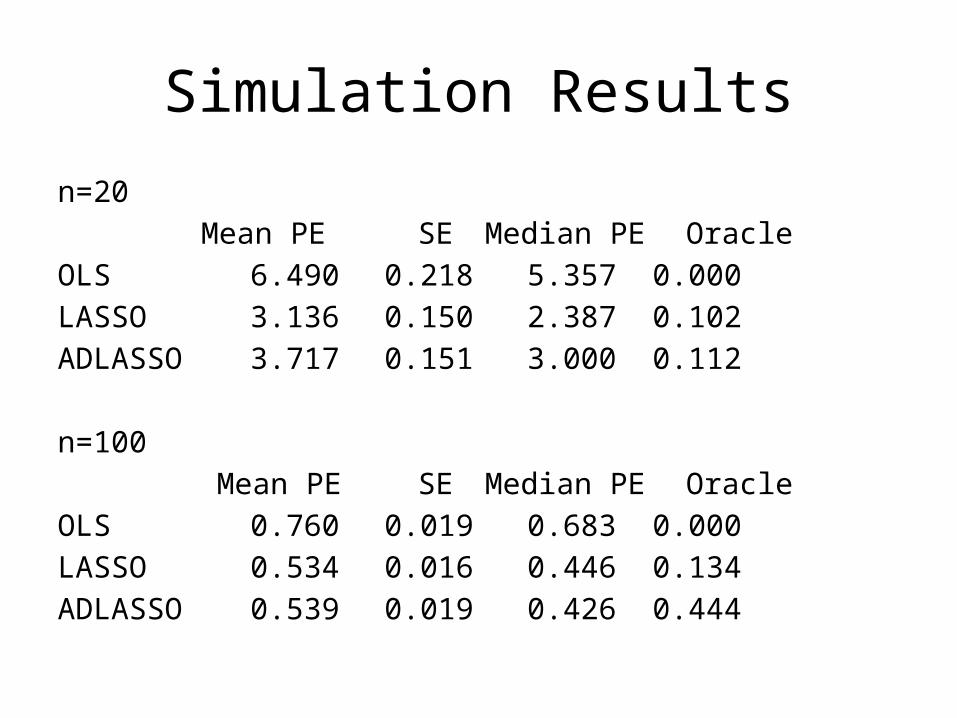
Simulation Results
n=20 Mean PE SE Median PE OracleOLS 6.490 0.218 5.357 0.000LASSO 3.136 0.150 2.387 0.102ADLASSO 3.717 0.151 3.000 0.112
n=100 Mean PE SE Median PE OracleOLS 0.760 0.019 0.683 0.000LASSO 0.534 0.016 0.446 0.134ADLASSO 0.539 0.019 0.426 0.444
Summary
• Covered the basics of regularization as well as 5 different penalty choices: Lasso, Ridge, Elastic, Grouped Lasso, and Adaptive Lasso.
• We have finished the regularization section and Neal will take over next October 17th with an overview of classification