comparison of several methods for measuring 222rn...
TRANSCRIPT

Centro de Estudios y Experimentación de Obras Públicas
Comparison of several methods for measuring
222Rn in drinking water
Ll. Pujol, M.E. Pérez-ZabaletaCEDEX – Alfonso XII, 3, 28014 Madrid, Spain.
LSC 2017Advances in Liquid Scintillation Spectrometry
1-5 May 2017, Copenhagen, Denmark

Centro de Estudios y Experimentación de Obras Públicas
2
Summary
• Introduction. Radiological control in drinking water. Radiological control in radon.
• Study area. Predictive map of radon in Spain. Duoro River Basin.
• General sampling techniques for radon.• Measurement methods of radon.• Results and discussion.• Comments and recommendations.

Centro de Estudios y Experimentación de Obras Públicas
3
Introduction
Centro de Estudios y Experimentación de Obras Públicas
4
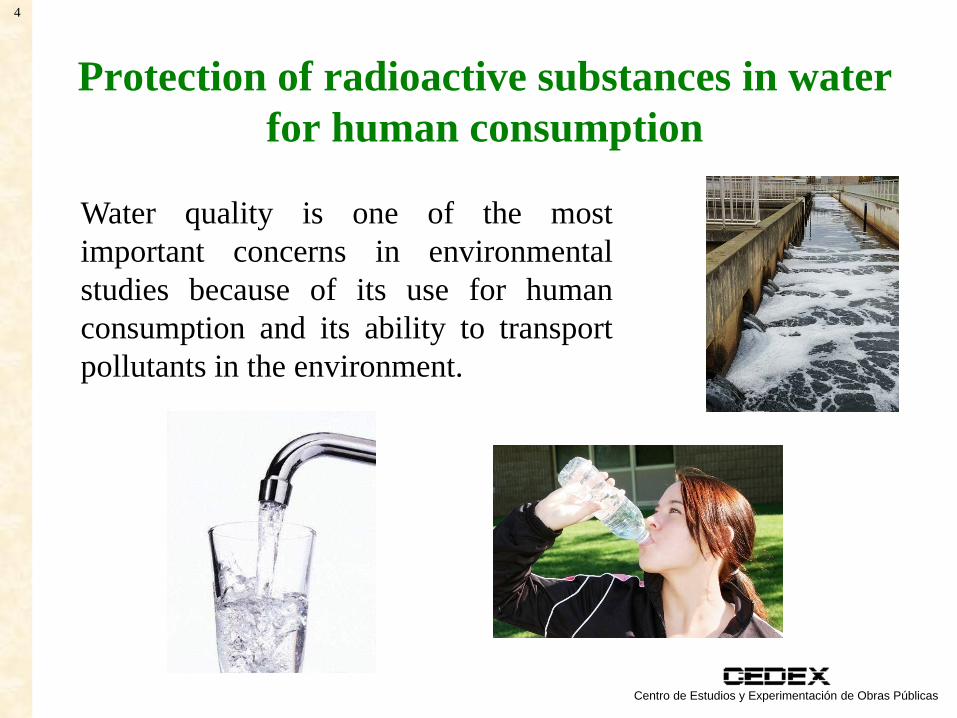
Protection of radioactive substances in water for human consumption
Water quality is one of the mostimportant concerns in environmentalstudies because of its use for humanconsumption and its ability to transportpollutants in the environment.

Centro de Estudios y Experimentación de Obras Públicas
5
Radiological control in drinking waterThe approach taken in national and international radiologicalcontrol in drinking water has two stages (WHO, 2008):
initial screening for gross alpha and/or beta activity todetermine whether the activity concentrations are below levelsat which no further action is required (Indicative Dose ≤ 0.1mSv/year); and.
if these screening levels are exceeded, investigation of theconcentrations of individual radionuclides and comparisonwith specific guidance levels.
In 2013, the European Commission published the EURATOM Drinking Water Directive (E-DWD). The Spanish legislation transposed the E-DWD in 2016.

Centro de Estudios y Experimentación de Obras Públicas
6
Flow chart of Indicative Dose Procedure
Naturally occurring radionuclides: U-238, U-234, Ra-226, Ra-228, Pb-210 and Po-210
Artificial radionuclides: C-14, Sr-90, Pu-239/240, Am-241, Co-60, Cs-134, Cs-137 and I-131
Determine gross alpha, residual beta and tritium activity
Spanish Regulation,
2016
If ID ≤ 0,1 mSv/year
NotifyAuthority
If ID > 0,1 mSv/year
Measure artificial
radionuclides
(Gross alpha ≤ 0,1 Bq/land residual beta ≤ 1 Bq/l)
and tritium ≤ 100 Bq/lID ≤ 0,1 mSv/year No further
action required
1
Measure artificial
radionuclides
(Gross alpha ≤ 0,1 Bq/land residual beta ≤ 1 Bq/l)
and tritium >100 Bq/l
2
(Gross alpha > 0,1 Bq/lor residual beta > 1 Bq/l)
and tritium ≤ 100 Bq/l
Measure naturally occurring
radionuclides
3
(Gross alpha > 0,1 Bq/lor residual beta > 1 Bq/l)
and tritium > 100 Bq/l
Measure naturally occurring and
artificial radionuclides
4

Centro de Estudios y Experimentación de Obras Públicas
7
International radon guidance and parametricvalue in drinking water
Directive/recommendationParametric
value(Bq/l)
Reference
2001/928/Euratom Recommendation 100 - 1000 EURATOM, 2001WHO guidance level 100 WHO, 20082013/51/Euratom Directive 100 – 1000* EURATOM, 2013Spain National legislation (RD 314/2016) 500* BOE, 2016
*Remedial action is deemed to be justified on radiological protection grounds,without further consideration, where radon concentrations exceed 1000 Bq/l.

Centro de Estudios y Experimentación de Obras Públicas
8
Monitoring of Radon(Annex II, 2013/51/Euratom Directive)
Member States shall ensure that representative surveys areundertaken to determine the scale and nature of likelyexposures to radon in water intended for human consumptionoriginating from different types of ground water sources andwells in different geological areas.
The surveys shall be designed in such a way that underlyingparameters, and especially the geology and hydrology of thearea, radioactivity of rock or soil, and well type, can beidentified and used to direct further action to areas of likelyhigh exposure .
Centro de Estudios y Experimentación de Obras Públicas
9
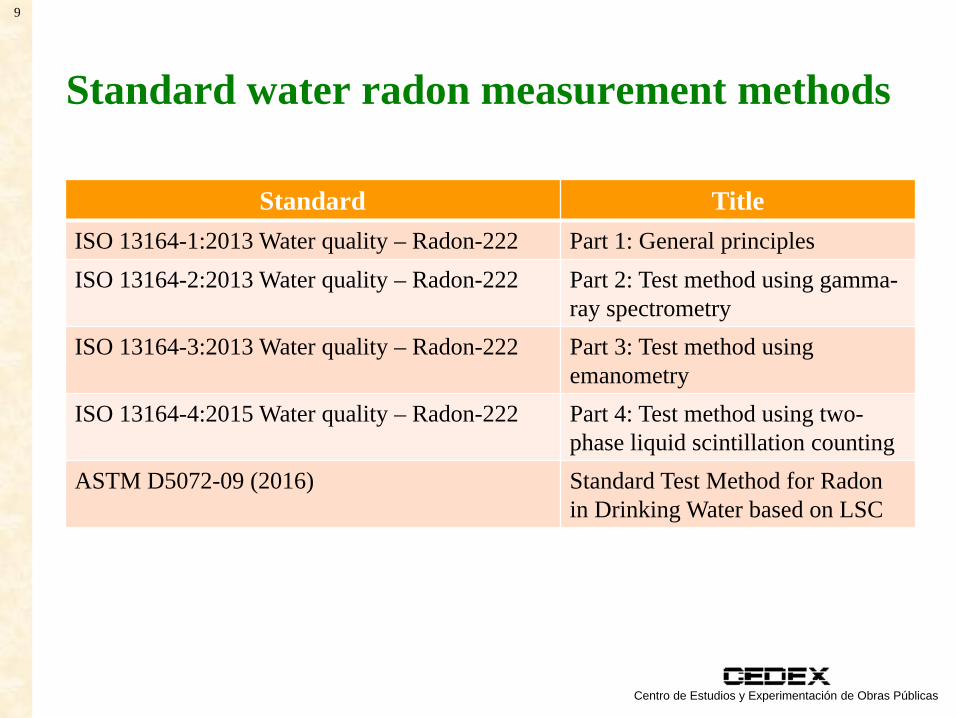
Standard water radon measurement methods
Standard TitleISO 13164-1:2013 Water quality – Radon-222 Part 1: General principlesISO 13164-2:2013 Water quality – Radon-222 Part 2: Test method using gamma-
ray spectrometryISO 13164-3:2013 Water quality – Radon-222 Part 3: Test method using
emanometryISO 13164-4:2015 Water quality – Radon-222 Part 4: Test method using two-
phase liquid scintillation countingASTM D5072-09 (2016) Standard Test Method for Radon
in Drinking Water based on LSC

Centro de Estudios y Experimentación de Obras Públicas
10
Study area

Centro de Estudios y Experimentación de Obras Públicas
11
Source: Spanish NuclearSafety Cou cil (CSN 2013)
Predictive map of the radon exposure in Spain
Geological Area(0)
Lime soil: alpineareas,
Mediterraneancoastal region
and northern partof the peninsula
.

Centro de Estudios y Experimentación de Obras Públicas
12
Geological Area(1)
Clay soil, sendimentary
rocks. It coversmost regions of
Aragón, Castilla-León, Castilla-La Mancha and La
Rioja.
Predictive map of the radon exposure in Spain
Source: Spanish NuclearSafety Cou cil (CSN 2013)

Centro de Estudios y Experimentación de Obras Públicas
13
Geological Area(2)
Silicious soil: composed of
igneous rocks, such granites.
This areaoccupies the
western part of the peninsula; itsincludes Galicia, Extremadura and
Madrid.
Predictive map of the radon exposure in Spain
Source: Spanish NuclearSafety Cou cil (CSN 2013)

Centro de Estudios y Experimentación de Obras Públicas
14
Sampling area in left-side of Douro basin
January
2009
March
2009

Centro de Estudios y Experimentación de Obras Públicas
15
Types of water sources
Drilled well
DU1, DU2, DU3, DU5, DU6, DU7,
Water samples were collectedfrom groundwater supplies:
7 different drilled wells
Borehole
DU9
1 borehole
Public spring next to a spa
DU4
1 public spring

Centro de Estudios y Experimentación de Obras Públicas
16
Sampling techniques

Centro de Estudios y Experimentación de Obras Públicas
17
General radon sampling conditions Purge the supply system. Limit the contact between air and
water to reduce gas escape during the sampling procedure.
Take the sample carefully, minimizing any turbulence.
Fill the container completely in order to avoid the presence of air.

Centro de Estudios y Experimentación de Obras Públicas
18
Sampling for AlphaGuard
A sample of 500 ml was injected into the degassing vesselby suction from the container. A 100 ml syringe was used.
Because of the fast degassingof radon from water, contactbetween the water sample andthe outside air was strictlyminimized.
After sample injection, the gascycle is closed and the gaspump is switched on.
Centro de Estudios y Experimentación de Obras Públicas
19
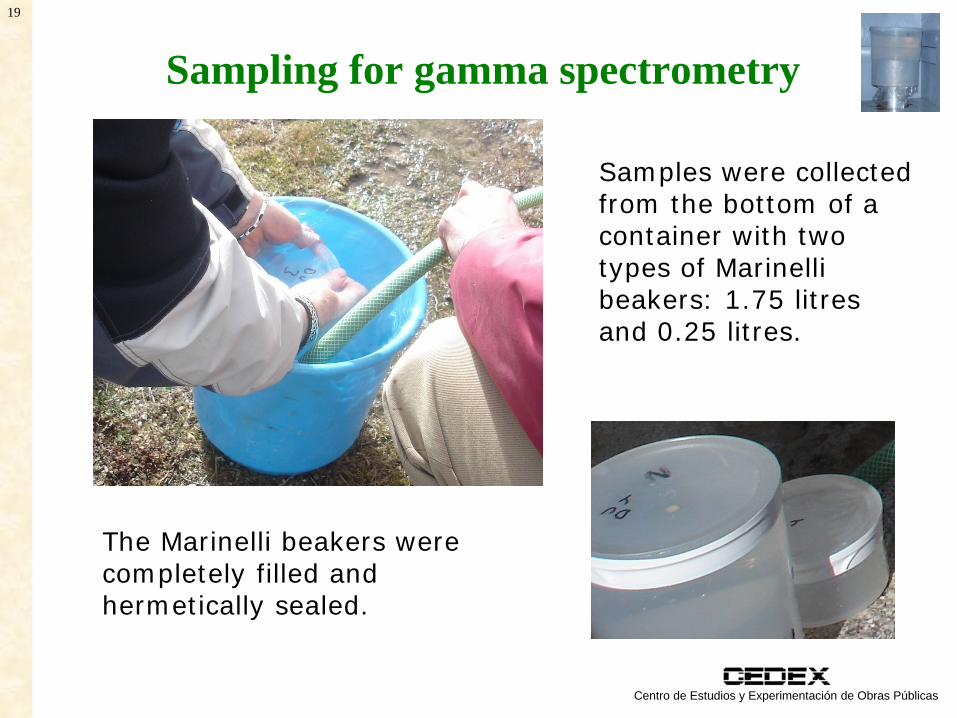
Sampling for gamma spectrometry
Samples were collected from the bottom of a container with two types of Marinelli beakers: 1.75 litres and 0.25 litres.
The Marinelli beakers were completely filled and hermetically sealed.

Centro de Estudios y Experimentación de Obras Públicas
20
Sampling for liquid scintillation countingBefore sampling, 12 ml of a scintillation cocktail wastransferred into a 20 ml vial. During the sampling, 8 ml ofwater was carefully taken by suction from the bottom of thecontainer with a syringe avoiding air bubble formation.
Immediately, the sample was injected into the bottom of the vial. The vial was then thightlycapped, vigorously shaken, and transported to the laboratory for measurement. Samples were collected in duplicate.

Centro de Estudios y Experimentación de Obras Públicas
21
Sampling for liquid scintillation counting:Vials/cocktails combinations
Three vial types were used: 20 ml polyethylenevials (PE), polyethylene low diffusion vials(PET), and glass vials from PerkinElmer.
Cocktail: Ultima Gold LLT from PerkinElmer
Sampling campaign (January 2009): 5 locations
Sampling campaign (March 2009): 4 locations
Three types of commercially available high capacity cocktailswere used: Optiphase Hisafe 3 (OPH3), Ultima Gold LLT(UGLLT), and Ultima Gold AB (UGAB) from PerkinElmer.
Vials: polyethylene low diffusion vials (PET) fromPerkinElmer.
In duplicate

Centro de Estudios y Experimentación de Obras Públicas
22
Measurementmethods

Centro de Estudios y Experimentación de Obras Públicas
23
Degassing Method: AlphaGuard PQ2000 PRO
This is an ionisation chamber, designed for measuring radon inair, soil and water. For water measurements the additionalequipment AquaKIT was used.
This equipment consists in aclosed circuit where a knownvolume (100-500 ml) of thewater to be analysed isintroduced in the degassingcell. A pump is used tocirculate the air in thesystem bubbling it throughthe degassing cell to degasthe radon dissolved in thewater.
[ ]lBqCKVVCC bairwaterwater
airairwater /)( / −+=
(Schubert, 2006)

Centro de Estudios y Experimentación de Obras Públicas
24
Change in the activity concentration of radon in the air within the system (code sample: DU7)
0
20
40
60
80
100
120
16:19 16:24 16:29 16:34 16:39 16:44 16:49 16:54 16:59
Rn-
222
(kB
q/m
3 )
HH:MM
Background measurement phase
Degassing phase
Radon measuring phase
Purging phase
1
2
3
4
After less 10 minutes, equilibrium concentration is reached, then atleast 10 more minutes the air circulate in the measuring system. Afterthis time the pump is stopped and the system purged.

Centro de Estudios y Experimentación de Obras Públicas
25
Gamma spectrometry
Gamma spectrometry was carried out by three HPGedetectors (GR2522, GR2520 and GX4020, Canberra) withrelative efficiency 25%, 25%, and 40%, respectively.

Centro de Estudios y Experimentación de Obras Públicas
26
Gamma spectrometry
The samples were measured once the equilibrium between222Rn and its daughters was reached. Dominant peaks arefrom 214Pb and 214Bi. Radon concentration was determinedusing the 214Pb emission at 351.9 keV because this peak doesnot require summing correction.
Centro de Estudios y Experimentación de Obras Públicas
27
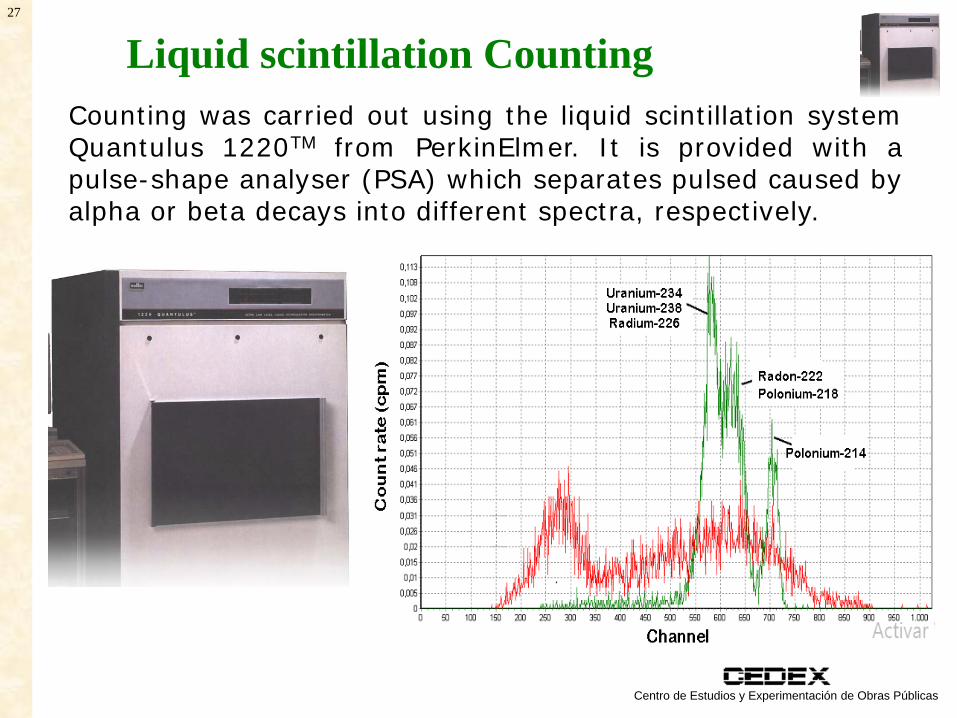
Liquid scintillation CountingCounting was carried out using the liquid scintillation systemQuantulus 1220TM from PerkinElmer. It is provided with apulse-shape analyser (PSA) which separates pulsed caused byalpha or beta decays into different spectra, respectively.

Centro de Estudios y Experimentación de Obras Públicas
28
Results and discussion
td ef ⋅∆−= ·λ

Centro de Estudios y Experimentación de Obras Públicas
29
Degassing Method: AlphaGuard
[ ]lBqCKVVCC bairwaterwater
airairwater /)( / −+=
Vwater is the water sample volume(circa 500 ml).
Vair is the total volume air in thesystem (inner volume of allthe system components:1536 ml – Vwater).
Kwater/air is the radon distributioncoefficient at the giventemperature.
Cb is the radon backgroundconcentration. Dependency of the partitioning coefficient
Kwater/air on temperature (Clever, 1979)
(Schubert, 2006)

Centro de Estudios y Experimentación de Obras Públicas
30
Code sample
Numbermeas.
Cair(kBq/m3)
Vwater(ml) T (ºC) k
Cb(Bq·m3)
Cwater(Bq/l)
DU1 6 21.5 514 13 0.33 0.05 49.9 ± 2.5
DU2 6 160 464 14 0.32 4 420 ± 11
DU3 9 30.2 505 12 0.34 9 71.9 ± 1.5
DU4 8 539 480 10 0.36 58 1379 ± 19
DU5 6 105 480 12 0.34 182 290 ± 2
DU6 22 10.8 480 13 0.33 39 27.3 ± 0.7
DU7 22 99.9 486 15 0.30 10 246 ± 4
DU8 26 5.2 492 10.5 0.35 19 12.8 ± 0.3
DU9 22 0.014 500 12 0.34 20 N.D.*
Mean value of at least ten single equilibrium concentrationreadings, recorded minute by minute was used.
Degassing Method: AlphaGuard
Quoted uncertainties correspond to k =2. * N.D.: No detectable.

Centro de Estudios y Experimentación de Obras Públicas
31
Gamma spectrometryA set of measurements was made over several days. Astraight fit line for each sample was used to calculate theinitial radon concentration at the time of sampling (C0) andthe constant decay parameter using:
0 5 10 15 20 250
1
2
3
4
5
6
7
8
R2= 1.000ln (Actividad) = ln (7.190±0.006) - (0.202±0.001)·t
ln (C) = ln (C0) -λ·t
Ln(A
ctivi
ty) (
Bq/l)
Time (days)
Sample:
DU4

Centro de Estudios y Experimentación de Obras Públicas
32
Gamma spectrometryFitted straight line parameters with Marinellis of 1.75 litres:
Code sample λ·10-6 (s-1) ln (C0)
C0(Bq·l-1) R2
DU1 2.3189 ± 0.0378 3.7651 ± 0.0271 43.2 ± 1.2 0.998
DU2 2.3449 ± 0.0084 6.2229 ± 0.0080 504 ± 4 1.000
DU3 2.3567 ± 0.0345 4.2562 ± 0.0195 70.5 ± 1.4 0.999
DU4 2.3553 ± 0.0094 7.1987 ± 0.0093 1338 ± 12 1.000
DU5 2.3675 ± 0.0156 5.7374 ± 0.0178 310 ± 5 0.999
DU6 2.3625 ± 0.0594 3.3354 ± 0.0319 28.1 ± 0.9 0.997
DU7 2.3785 ± 0.0067 5.4403 ± 0.0045 230 ± 1 1.000
DU8 2.4194 ± 0.0772 3.1351 ± 0.0481 23.0 ± 1.1 0.995
DU9 2.4958 ± 0.3893 1.2146 ± 0.1885 3.4 ± 0.6 0.911Quoted uncertainties correspond to k =1.

Centro de Estudios y Experimentación de Obras Públicas
33
Gamma spectrometryFitted straight line parameters with Marinellis of 0.25 litres:
Code sample λ·10-6 (s-1) ln (C0)
C0(Bq·l-1) R2
DU1 2.1420 ± 0.1049 3.8741 ± 0.0751 48.1 ± 3.6 0.983
DU2 2.6876 ± 0.0418 6.3886 ± 0.0295 595 ± 18 0.998
DU3 2.6333 ± 0.0659 4.4907 ± 0.0427 89.2 ± 3.8 0.996
DU4 2.8871 ± 0.0129 7.4080 ± 0.0083 1649 ± 14 1.000
DU5 2.7394 ± 0.0737 5.9282 ± 0.0473 375 ± 18 0.995Quoted uncertainties correspond to k =1.
Results shows that constant decay parameter of the fittedstraight lines are higher than the theoretical one, λ0 (222Rn)=2.0984·10-6 s-1. In general, it is higher for 0.25 litresMarinelli geometry beaker than for 1.75 litres Marinelligeometry beaker. The explanation of this result may be in thehigher leakage of the first one.

Centro de Estudios y Experimentación de Obras Públicas
34
Gamma spectrometry: radon losses duringmeasurements with Marinelli beakers
222Rn determination for both Marinellis have been corrected for decay.
Figure shows that about 2.0% and 4.7% of the 222Rn is lostfrom samples measured using Marinelli beakers geometry of1.75 litres and 0.25 litres, respectively, after 1 day (86400 s)between the sampling and the measuring.

Centro de Estudios y Experimentación de Obras Públicas
35
Liquid scintillation countingAlso a set of measurements was made over several days for LSC forsamples from DU1 to DU5. Fitted straight line parameters for codesample DU1 are shown by each vial combination and in duplicate.
Code Sample Vial λ·10-6 (s-1) ln (C0) R2
DU1
PET A 2.2240 ± 0.0538 3.8157 ± 0.0333 0.995PET B 2.0830 ± 0.0490 3.6734 ± 0.0304 0.996PE A 2.2573 ± 0.0612 3.7990 ± 0.0380 0.994PE B 2.1988 ± 0.0634 3.7535 ± 0.0394 0.993
GLASS A 2.1158 ± 0.0430 3.6547 ± 0.0268 0.997GLASS B 2.1207 ± 0.0514 3.7180 ± 0.0321 0.995
Quoted uncertainties correspond to k =1.Ultima Gold LLT cocktail was used for all vials.
Fitted straight line parameters for code sample DU2, DU3,DU4 and DU5 also were determined (not shown).
Centro de Estudios y Experimentación de Obras Públicas
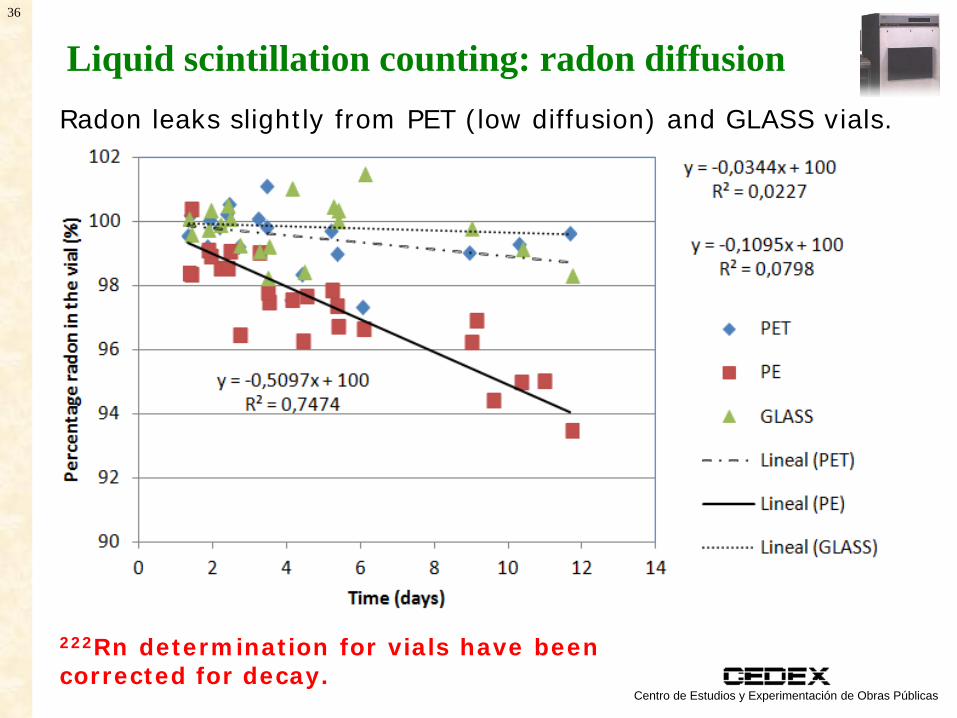
36
Liquid scintillation counting: radon diffusionRadon leaks slightly from PET (low diffusion) and GLASS vials.
222Rn determination for vials have beencorrected for decay.

Centro de Estudios y Experimentación de Obras Públicas
37
Liquid scintillation counting
Also a set of measurements was made over several days for LSC forsamples from DU6 to DU9. Radon was not detected in sample DU9.Fitted straight line parameters for code sample DU6 are shown byeach cocktail combination and in duplicate.
Code Sample Cocktail λ·10-6 (s-1) ln (C0) R2
DU6
UG LLT-1 2,2703 ± 0.1085 3.3714 ± 0.0624 0.989UG LLT-2 2.1969 ± 0.1273 3.2938 ± 0.0735 0.983UG AB-1 2.1841 ± 0.0823 3.3127 ± 0.0485 0.993UG AB-2 2.1722 ± 0.1149 3.2822 ± 0.0679 0.986OPH3-1 1.9115 ± 0.0956 3.1308 ± 0.0580 0.987OPH3-2 2.1781 ± 0.0901 3.3116 ± 0.0540 0.991
Quoted uncertainties correspond to k =1.PET vials were used for all cocktails.
Centro de Estudios y Experimentación de Obras Públicas
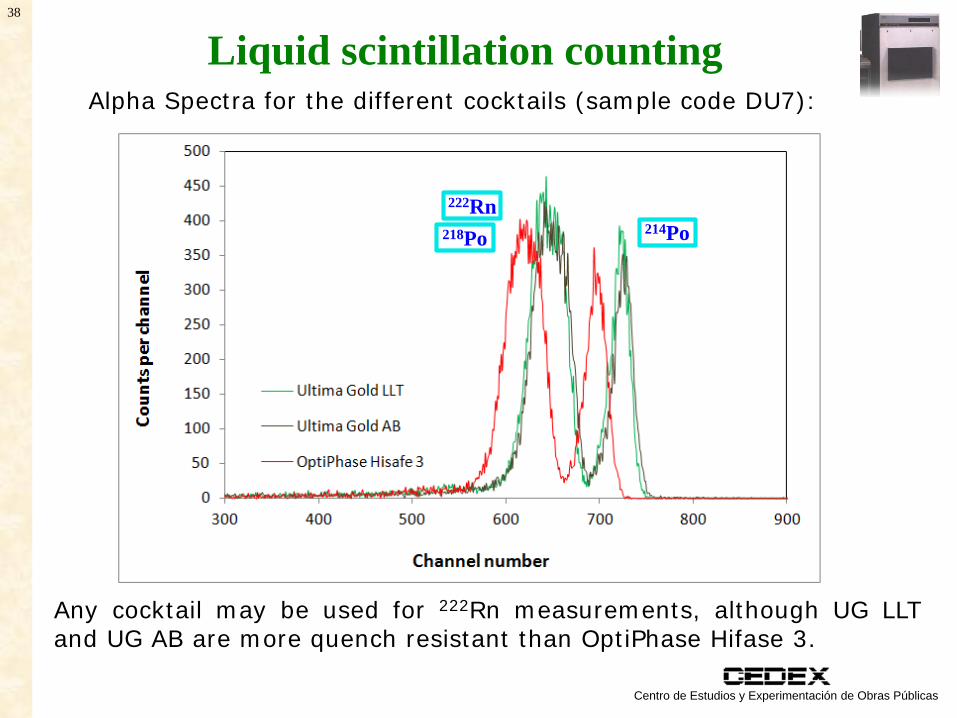
38
Liquid scintillation countingAlpha Spectra for the different cocktails (sample code DU7):
214Po218Po
222Rn
Any cocktail may be used for 222Rn measurements, although UG LLTand UG AB are more quench resistant than OptiPhase Hifase 3.

Centro de Estudios y Experimentación de Obras Públicas
39
Liquid scintillation counting
Quoted uncertainties correspond to k =2.
Code Sample Vial PET &
UGLLTPE &
UGLLTGLASS &UGLLT C0 (Bq/l)
DU1A 45.4 ± 3.0 44.7 ± 3.4 38.7 ± 2.1
42.0 ± 2.7B 39.4 ± 2.4 42.7 ± 3.4 41.2 ± 2.6
DU2A 423 ± 9 490 ± 12 465 ± 10
467 ± 26B 467 ± 10 495 ± 9 464 ±13
DU3A 75.9 ± 3.6 72.2 ± 2.8 73.5 ± 2.2
74.3 ± 1.5B 74.9 ± 3.0 76.0 ± 3.5 73.4 ± 3.8
DU4A 1402 ± 15 1348 ± 13 1343 ± 12
1348 ± 31B 1333 ± 15 1306 ± 19 1353 ± 24
DU5A 282 ± 6 304 ± 7 305 ± 6
296 ± 9B 287 ± 7 294 ± 7 301 ± 6
The mean concentration 222Rn activity for several vials (PET, PEand GLASS) and the same cocktail (UGLLT) were determined:

Centro de Estudios y Experimentación de Obras Públicas
40
Liquid scintillation counting
Quoted uncertainties correspond to k =2. MDA: Minimum Detectable Activity.
Code Sample Vial PET &
UGLLTPET &UGAB
PET &OPH3 C0 (Bq/l)
DU6A 29.1 ± 3.6 27.5 ± 2.7 22.9 ± 2.7
26.7 ± 2.1B 26.9 ± 4.0 26.6 ± 3.6 27.4 ± 3.0
DU7A 234 ± 7 231 ± 7 238 ± 9
233.4 ± 3.4B 232 ± 10 236 ± 9 229 ± 8
DU8A 21.3 ± 3.2 17.5 ± 1.9 21.3 ± 3.9
20.1 ± 1.9B 20.4 ± 2.1 22.0 ± 1.7 18.1 ± 1.5
DU9A < MDA < MDA < MDA
< MDAB < MDA < MDA < MDA
The mean concentration 222Rn activity for several cocktails (UGLLT, UG AB and OptiPhase Hisafe 3) and the same vial (PET)were determined:

Centro de Estudios y Experimentación de Obras Públicas
41
Sample volume, efficiency, counting time and MDA forseveral 222Rn determination techniques in this work
Method DetectorType
In–situ measur.
Sample volume
(l)
Effic(%)
Count.time (s)
MDA(Bq/l)
Degassing method
Alpha Guard Yes 0.5 100 600 0.5
Gamma spectrometry
HPGedetector No 1.75 2 7200 3
Liquid scintillation
counting
Quantulus 1220 No 0.008 300 600 0.5
The limit of detection recommended by the E-DWD forRadon measurements is 10 Bq/l

Centro de Estudios y Experimentación de Obras Públicas
42
222Rn activity concentration (Bq/l) withdifferent methods
Samplecode
Degassing method
Gamma spectrometry
Liquid Scintillation counting
DU1 49.9 ± 2.5 43.2 ± 2.4 42.0 ± 2.7DU2 420 ± 11 504 ± 8 467 ± 26DU3 71.9 ± 1.5 70.5 ± 2.8 74.3 ± 1.5DU4 1379 ± 19 1338 ± 24 1348 ± 31DU5 290 ± 2 310 ± 5 296 ± 9DU6 27.3 ± 0.7 28.1 ± 1.8 26.7 ± 2.1DU7 246 ± 4 230 ± 2 233.4 ± 3.4DU8 12.8 ± 0.3 23.0 ± 2.2 20.1 ± 1.9DU9 N.D.* 3.4 ± 1.2 < MDA
Quoted uncertainties correspond to k =2.

Centro de Estudios y Experimentación de Obras Públicas
43

Centro de Estudios y Experimentación de Obras Públicas
44
The performance of the three methods used in this work isadequate for radon activity measurements in drinking water.All the methods of analysis used are capable of measuringactivity concentrations of radon with a limit of detectionabove 10 Bq/l, as recommended by the E-DWD.
All of these techniques present advantages and drawbacks.Therefore, whichever of these techniques may be chosen forradon measuring: either on-site systems for radon-in-wateranalysis, or laboratory measurement techniques such as LSCor gamma spectrometry.
The chosen technique will depend on the laboratorycapabilities or customer demands.
General comments

Centro de Estudios y Experimentación de Obras Públicas
45
Advantages and drawbacks of each technique
The advantage of LSC technique for radon in watermeasurements is that it allows processing a large number ofsamples with simple sampling procedure and low watervolumes. Furthermore, the use of automatic sample changerspermits the counting of numerous samples in a short time.
Field-based measurements of radon in water allow modifyingthe sampling strategy in almost real-time instead of having towait for laboratory results.
Gamma spectrometry presents a reduced counting efficiencyand consequently, the water volumes to be counted are large.The advantage of gamma counting is in the commoninstrumentation employed by environmental radioactivitylaboratories.

Centro de Estudios y Experimentación de Obras Públicas
46
Recommendations In any case, sampling technique is very important for all the
methods as it is necessary to limit contact between air andwater to reduce the radon escapes from the sample.
Beakers used in Gamma spectrometry in this work present animportant radon leakage (2% per day for 1.75 litresMarinelli). Therefore, it is recommended radon leakagecorrection in radon determination equation. Marinellis of 0.25litres are discarded for its high radon leakage.
Radon leakage from PET and glass vials is very slight, but issignificative from PE vials. Therefore, we recommend the useof PET or glass vials for radon determination. In our study,any cocktail may be used: UGLLT, UGAB or OPH3, althoughUGLLT and UGAB are more quench resistant.

Centro de Estudios y Experimentación de Obras Públicas
47