comparison of strength–maturity models accounting … · comparison of strength–maturity models...
TRANSCRIPT
Comparison of Strength–Maturity Models Accounting for HydrationHeat in Massive Walls
Keun-Hyeok Yang1),*, Jae-Sung Mun2), Do-Gyeum Kim3), and Myung-Sug Cho4)
(Received May 6, 2015, Accepted January 31, 2016, Published online February 19, 2016)
Abstract: The objective of this study was to evaluate the capability of different strength–maturity models to account for the effect
of the hydration heat on the in-place strength development of high-strength concrete specifically developed for nuclear facility
structures under various ambient curing temperatures. To simulate the primary containment-vessel of a nuclear reactor, three
1200-mm-thick wall specimens were prepared and stored under isothermal conditions of approximately 5 �C (cold temperature),
20 �C (reference temperature), and 35 �C (hot temperature). The in situ compressive strengths of the mock-up walls were
measured using cores drilled from the walls and compared with strengths estimated from various strength–maturity models
considering the internal temperature rise owing to the hydration heat. The test results showed the initial apparent activation
energies at the hardening phase were approximately 2 times higher than the apparent activation energies until the final setting. The
differences between core strengths and field-cured cylinder strengths became more notable at early ages and with the decrease in
the ambient curing temperature. The strength–maturity model proposed by Yang provides better reliability in estimating in situ
strength of concrete than that of Kim et al. and Pinto and Schindler.
Keywords: high-strength concrete, in situ strength, mock-up, hydration heat, maturity, curing temperature.
List of SymbolsD Diameter of coreEa(i) Apparent activation energy at time step iEi Initial apparent activation energy during the
hardening phaseEs Apparent activation energy until the final setting timeFd Correction factor to damage to the surface of the
core samplesFdia Correction factor to account for the diameter of the
core samplesFH/D Correction factor to account for the slenderness of
core samplesFmc Correction factor to account for the core moisture
content
fcore Compressive strength of core samplesH Height of core sampleskr Rate constant at the reference temperaturekt Rate constantR Universal gas constant (= 8.314 J/mol/K)Rsp High-range water-reducing agent–cementitious
material ratio by massS Compressive strenth of concrete at an age of tSu Limiting strength of concreteS28 28-day compressive strenth of concrete(S28)Tr 28-day compressive strenth of concrete under
reference curing temperatureTA3 Curing temperature at an age of 3 daysTc(i) Curing temperature of concrete at time step iTr Reference curing temperaturet Concrete agete Equivalent agets Final setting time at a given temperaturetsr Final setting time at the reference temperaturet0 Offset time at a given temperaturet0r Offset time at the reference temperaturew/cm Water–cementitious material ratio by massc Ratio between estimated compressive strength of
concrete and test resultscm Mean of the ratios between estimates and test resultscs Standard deviation of the ratios between estimates
and test resultscv Coefficient of variation of the ratios between
estimates and test results
1)Department of Plant Architectural Engineering,
Kyonggi University, Suwon 443-760, Korea.
*Corresponding Author; E-mail: [email protected])Department of Architectural Engineering, Graduate
School, Kyonggi University, Suwon 443-760, Korea.3)Structural Engineering & Bridges Research Division,
Korea Institute of Construction Technology,
Goyang 411-712, Korea.4)KHNP-Central Research Institute, Korea Hydro &
Nuclear Power Co., LTD, Daejeon 305-343, Korea.
Copyright � The Author(s) 2016. This article is published
with open access at Springerlink.com
International Journal of Concrete Structures and MaterialsVol.10, No.1, pp.47–60, March 2016DOI 10.1007/s40069-016-0128-9ISSN 1976-0485 / eISSN 2234-1315
47

1. Introduction
Construction schedules for concrete structures signifi-cantly depend on the minimum stripping time for the con-crete form work and shoring and the minimum concretestrength for applying a prestressing force to a structuralelement (Sofi et al. 2012; Vazquez-Herrero et al. 2012). Thusobtaining a higher strength gain of concrete at an early age isone of the most critical concerns for shortening the con-struction time for concrete structures. For this reason, the useof high-strength concrete (HSC) has been graduallyencouraged for the fast-track construction of nuclear facilitystructures, especially in South Korea. The strength devel-opment of HSC is more sensitive to the curing temperaturethan normal-strength concrete (NSC) because the hydrationrate of cement is greater at a lower water–cementitiousmaterials ratio and a higher curing temperature (Kim et al.2002a; Pinto and Schindler 2010). As a result, the strength–maturity models established from the NSC test data usingstandard cylinders are frequently pointed out to overestimatethe in situ strength of HSC, particularly under a cold tem-perature at an early age (Parsons and Naik 1985; Hulshizer2001). However, the strength–maturity relationship for HSCis still an equivocal issue because of the limited availabledata, although the maturity method is used as an effectivemeans of estimating strength development of in situ concrete(Sofi et al. 2012).The strength–maturity relationship of concrete is tradi-
tionally determined using standard cubic or cylindricalspecimens cured in a laboratory at standard temperature.However, as commonly recognized (Haug and Jakobsen1990; Puciontti 2013; Uva et al. 2013), the curing historiesof a standard-cured specimen and an in-place concretemember would not be identical. Thus, the strength devel-opment of a laboratory specimen would differ from that of astructure under construction. This difference may be pri-marily attributed to the heat of hydration, which produces ahigher internal temperature in structural members than thesurrounding environment (Kim et al. 2002b). Hence, a largedifference between a cylinder’s strength and the in situstrength is expected with an increase in the design strengthof the concrete and/or member thickness. However, availabledata (Harris et al. 2000; Schrader 2007) dealing with thedifference between standard-cured or field-cured cylinderstrength and in-place strength for a mass concrete elementare still scare, although the concept of equivalent age derivedfrom the Arrhenius function has been primarily used as amaturity function to describe the temperature sensitivity ofthe reaction of cementitious materials. Furthermore, to rea-sonably estimate construction schedules for mass concretestructures under various temperatures, the reliability of thestrength–maturity relationships needs to be ascertained forHSC used in massive concrete members.The purpose of this study was to examine the differences
in the compressive strength development between field-cured cylindrical specimens and a mass concrete elementmade using HSC with a design strength of 55 MPa. The
mixture proportions of the HSC were specifically determinedbased on its use in nuclear facility structures under differentambient temperatures in South Korea, while considering thehydration heat generation, economic efficiency and dura-bility of the concrete (Yang 2014). To simulate the primarycontainment-vessel of a nuclear reactor, three 1200-mm-thick mock-up wall specimens were prepared and curedunder isothermal ambient temperatures of approximately 5,20, and 35 �C. The in situ compressive strengths of themock-up walls were measured using cores drilled from thewall structures, in accordance with ASTM C42/C42 M(2011). The setting times, rate constants, and apparent acti-vation energies of the prepared mixtures were also measuredin accordance with ASTM procedures (2011) in order tocalculate the equivalent age based on the Arrhenius function.The measured core strength was compared with the com-panion cylinder strength and estimates obtained from dif-ferent maturity approaches (Kim et al. 2002a; Pinto andSchindler 2010; Yang 2014).
2. Experimental Details
2.1 Concrete MixturesTo improve the economic efficiency by shortening the
construction time and extending the expected service life ofnuclear facility structures, a target of 55 MPa was set for the28-day compressive strength of concrete. Considering theworkability and need to minimize the bleeding of concrete inthe primary containment-vessel of a nuclear reactor withlarge diameter reinforcing bars, a value of 150 ± 15 mmwas selected for the target initial slump of the fresh concrete.For the targeted concrete strength and initial slump, tests ofnumerous laboratory mixtures were previously conductedunder different ambient curing temperatures of approxi-mately 5, 20, and 35 �C. As a result, three mixture propor-tions were specifically determined for use at the threeambient temperatures, as listed in Table 1 (Yang 2014).According to the ambient curing temperatures, different
supplementary cementitious materials (SCMs) were added aspartial replacements for the cement. The heat of hydrationand the rate of heat evolution in concrete commonly increasewith increasing C3S and C3A contents of cement. On theother hand, the pozzolanic reaction is slower than C3Shydration and it produces less heat than does cementhydration (Nili and Salehi 2010). As a result, concretecontaining SCMs normally experiences slow hydration,accompanied by a lower temperature rise. Bamforth (1980)reported that ground granulated blast-furnace slag (GGBFS)as a partial replacement for ordinary portland cement (OPC)generates a lower temperature rise and a slower rate ofincrease than OPC mass concrete. The weight ratios of theSCMs selected for the three mixtures were as follows: 5 %silica fume (SF) for the ambient curing temperature of 5 �C,50 % GGBFS for a temperature of 20 �C, and a combinationof 65 % GGBFS and 5 % SF for a temperature of 35 �C.The three mixtures were identified as S5, G50, and G65S5
48 | International Journal of Concrete Structures and Materials (Vol.10, No.1, March 2016)
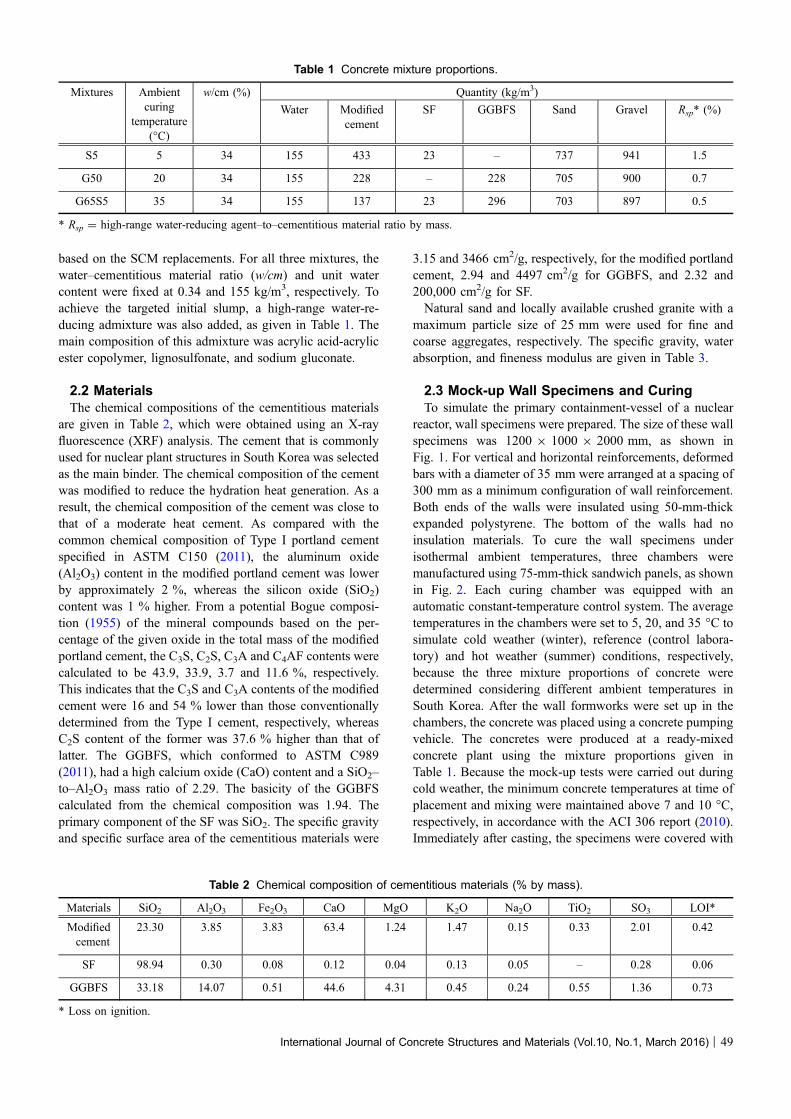
based on the SCM replacements. For all three mixtures, thewater–cementitious material ratio (w/cm) and unit watercontent were fixed at 0.34 and 155 kg/m3, respectively. Toachieve the targeted initial slump, a high-range water-re-ducing admixture was also added, as given in Table 1. Themain composition of this admixture was acrylic acid-acrylicester copolymer, lignosulfonate, and sodium gluconate.
2.2 MaterialsThe chemical compositions of the cementitious materials
are given in Table 2, which were obtained using an X-rayfluorescence (XRF) analysis. The cement that is commonlyused for nuclear plant structures in South Korea was selectedas the main binder. The chemical composition of the cementwas modified to reduce the hydration heat generation. As aresult, the chemical composition of the cement was close tothat of a moderate heat cement. As compared with thecommon chemical composition of Type I portland cementspecified in ASTM C150 (2011), the aluminum oxide(Al2O3) content in the modified portland cement was lowerby approximately 2 %, whereas the silicon oxide (SiO2)content was 1 % higher. From a potential Bogue composi-tion (1955) of the mineral compounds based on the per-centage of the given oxide in the total mass of the modifiedportland cement, the C3S, C2S, C3A and C4AF contents werecalculated to be 43.9, 33.9, 3.7 and 11.6 %, respectively.This indicates that the C3S and C3A contents of the modifiedcement were 16 and 54 % lower than those conventionallydetermined from the Type I cement, respectively, whereasC2S content of the former was 37.6 % higher than that oflatter. The GGBFS, which conformed to ASTM C989(2011), had a high calcium oxide (CaO) content and a SiO2–to–Al2O3 mass ratio of 2.29. The basicity of the GGBFScalculated from the chemical composition was 1.94. Theprimary component of the SF was SiO2. The specific gravityand specific surface area of the cementitious materials were
3.15 and 3466 cm2/g, respectively, for the modified portlandcement, 2.94 and 4497 cm2/g for GGBFS, and 2.32 and200,000 cm2/g for SF.Natural sand and locally available crushed granite with a
maximum particle size of 25 mm were used for fine andcoarse aggregates, respectively. The specific gravity, waterabsorption, and fineness modulus are given in Table 3.
2.3 Mock-up Wall Specimens and CuringTo simulate the primary containment-vessel of a nuclear
reactor, wall specimens were prepared. The size of these wallspecimens was 1200 9 1000 9 2000 mm, as shown inFig. 1. For vertical and horizontal reinforcements, deformedbars with a diameter of 35 mm were arranged at a spacing of300 mm as a minimum configuration of wall reinforcement.Both ends of the walls were insulated using 50-mm-thickexpanded polystyrene. The bottom of the walls had noinsulation materials. To cure the wall specimens underisothermal ambient temperatures, three chambers weremanufactured using 75-mm-thick sandwich panels, as shownin Fig. 2. Each curing chamber was equipped with anautomatic constant-temperature control system. The averagetemperatures in the chambers were set to 5, 20, and 35 �C tosimulate cold weather (winter), reference (control labora-tory) and hot weather (summer) conditions, respectively,because the three mixture proportions of concrete weredetermined considering different ambient temperatures inSouth Korea. After the wall formworks were set up in thechambers, the concrete was placed using a concrete pumpingvehicle. The concretes were produced at a ready-mixedconcrete plant using the mixture proportions given inTable 1. Because the mock-up tests were carried out duringcold weather, the minimum concrete temperatures at time ofplacement and mixing were maintained above 7 and 10 �C,respectively, in accordance with the ACI 306 report (2010).Immediately after casting, the specimens were covered with
Table 1 Concrete mixture proportions.
Mixtures Ambientcuring
temperature(�C)
w/cm (%) Quantity (kg/m3)
Water Modifiedcement
SF GGBFS Sand Gravel Rsp* (%)
S5 5 34 155 433 23 – 737 941 1.5
G50 20 34 155 228 – 228 705 900 0.7
G65S5 35 34 155 137 23 296 703 897 0.5
* Rsp = high-range water-reducing agent–to–cementitious material ratio by mass.
Table 2 Chemical composition of cementitious materials (% by mass).
Materials SiO2 Al2O3 Fe2O3 CaO MgO K2O Na2O TiO2 SO3 LOI*
Modifiedcement
23.30 3.85 3.83 63.4 1.24 1.47 0.15 0.33 2.01 0.42
SF 98.94 0.30 0.08 0.12 0.04 0.13 0.05 – 0.28 0.06
GGBFS 33.18 14.07 0.51 44.6 4.31 0.45 0.24 0.55 1.36 0.73
* Loss on ignition.
International Journal of Concrete Structures and Materials (Vol.10, No.1, March 2016) | 49

a vinyl chloride sheet to control evaporation. The wallspecimens were continuously cured in the chambers underthe previously set ambient temperature conditions. Forcomparison with the field-cured cylinder strength,100 9 200 mm cylinders molded from each concrete mix-ture were simultaneously cured with the wall specimens atthe same ambient temperatures. The cylinders and the wallspecimen cured under the cold condition were stripped out at
an age of 3 days, whereas the others cured under the refer-ence or hot condition were stripped out at 1 day.
2.4 TestingTemperatures were monitored using thermocouples within
the chambers and at eight different locations for the wallspecimens, including the center and near surface regions, asshown in Fig. 1. Temperature data were recorded using a
Table 3 Physical properties of aggregates.
Type Maximum size (mm) Bulk density (kg/m3) Specific gravity Water absorption (%) Fineness modulus
Coarse aggregates 25 1.557 2.59 0.78 6.64
Fine aggregates 5 1.668 2.56 1.34 2.80
Fig. 1 Details of mock-up wall specimens and location of thermocouples (All dimensions are in mm).
Fig. 2 Curing chambers equipped with constant-temperature control systems.
50 | International Journal of Concrete Structures and Materials (Vol.10, No.1, March 2016)
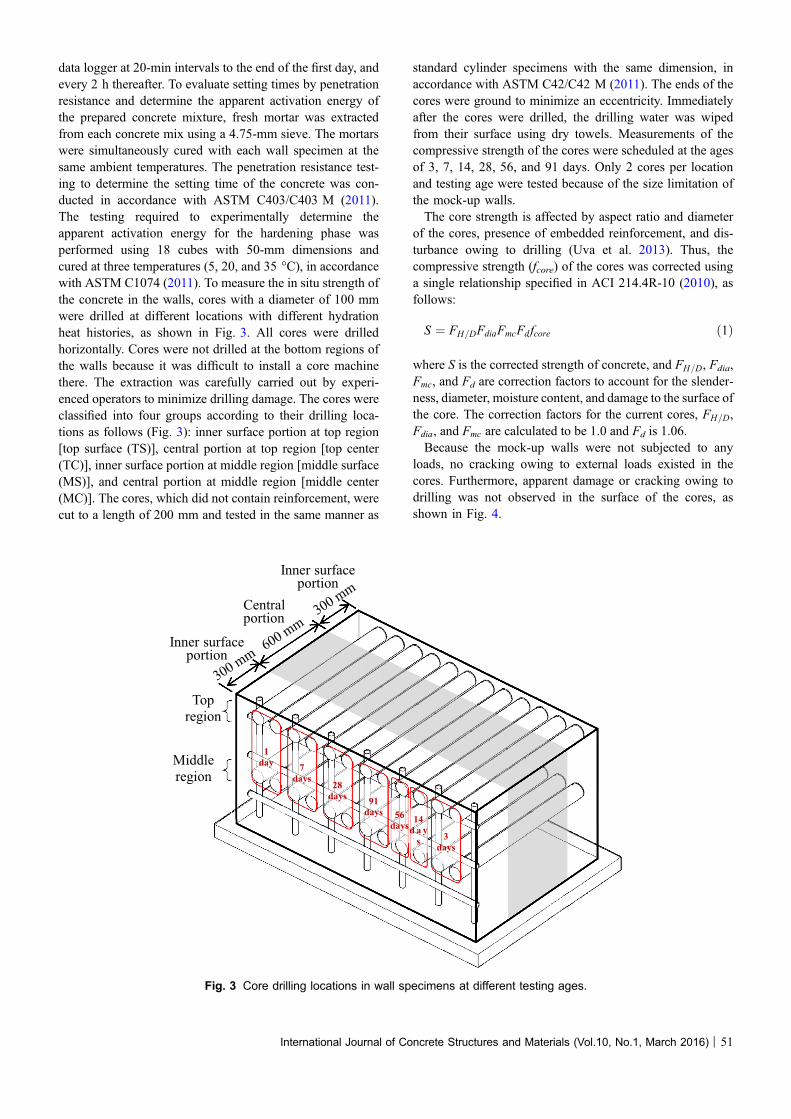
data logger at 20-min intervals to the end of the first day, andevery 2 h thereafter. To evaluate setting times by penetrationresistance and determine the apparent activation energy ofthe prepared concrete mixture, fresh mortar was extractedfrom each concrete mix using a 4.75-mm sieve. The mortarswere simultaneously cured with each wall specimen at thesame ambient temperatures. The penetration resistance test-ing to determine the setting time of the concrete was con-ducted in accordance with ASTM C403/C403 M (2011).The testing required to experimentally determine theapparent activation energy for the hardening phase wasperformed using 18 cubes with 50-mm dimensions andcured at three temperatures (5, 20, and 35 �C), in accordancewith ASTM C1074 (2011). To measure the in situ strength ofthe concrete in the walls, cores with a diameter of 100 mmwere drilled at different locations with different hydrationheat histories, as shown in Fig. 3. All cores were drilledhorizontally. Cores were not drilled at the bottom regions ofthe walls because it was difficult to install a core machinethere. The extraction was carefully carried out by experi-enced operators to minimize drilling damage. The cores wereclassified into four groups according to their drilling loca-tions as follows (Fig. 3): inner surface portion at top region[top surface (TS)], central portion at top region [top center(TC)], inner surface portion at middle region [middle surface(MS)], and central portion at middle region [middle center(MC)]. The cores, which did not contain reinforcement, werecut to a length of 200 mm and tested in the same manner as
standard cylinder specimens with the same dimension, inaccordance with ASTM C42/C42 M (2011). The ends of thecores were ground to minimize an eccentricity. Immediatelyafter the cores were drilled, the drilling water was wipedfrom their surface using dry towels. Measurements of thecompressive strength of the cores were scheduled at the agesof 3, 7, 14, 28, 56, and 91 days. Only 2 cores per locationand testing age were tested because of the size limitation ofthe mock-up walls.The core strength is affected by aspect ratio and diameter
of the cores, presence of embedded reinforcement, and dis-turbance owing to drilling (Uva et al. 2013). Thus, thecompressive strength (fcore) of the cores was corrected usinga single relationship specified in ACI 214.4R-10 (2010), asfollows:
S ¼ FH=DFdiaFmcFdfcore ð1Þ
where S is the corrected strength of concrete, and FH=D, Fdia,Fmc, and Fd are correction factors to account for the slender-ness, diameter, moisture content, and damage to the surface ofthe core. The correction factors for the current cores, FH=D,Fdia, and Fmc are calculated to be 1.0 and Fd is 1.06.Because the mock-up walls were not subjected to any
loads, no cracking owing to external loads existed in thecores. Furthermore, apparent damage or cracking owing todrilling was not observed in the surface of the cores, asshown in Fig. 4.
Centralportion
Inner surface portion
1day
Topregion
Middleregion
7days
28days 91
days
3days
56days
14d a ys
Inner surface portion
Fig. 3 Core drilling locations in wall specimens at different testing ages.
International Journal of Concrete Structures and Materials (Vol.10, No.1, March 2016) | 51

3. Test Results and Discussion
3.1 Temperature RiseThe temperature rise profiles of the concrete resulting from
the hydration of the cementitious materials are shown inFig. 5. The ambient temperature profile of each chamber isalso plotted on the same figure. As expected, peak temper-ature was higher at the central portion of the wall than at itsinner surface. The highest temperature was recorded in themiddle-center region. The differences between the peaktemperatures at the center and inner surface regions tendedto decrease with an increase in the ambient curing temper-ature. The peak temperature measured in the middle centerwas higher for S5 wall cured under 5 �C than for the otherwalls, whereas the peak temperature measured in the surfacewas higher for G65S5 wall cured under 35 �C than the otherwalls. A higher ambient curing temperature resulted in thehotter surface of the wall. This implies that the difference ofthe peak temperatures between the center and inner surfaceregions is more dependent on the ambient curing tempera-ture than the mixture proportions used in the present study. Itis also interesting that a greater slope at the ascending branchof the temperature rise curve was observed at the centralportion compared to the surface portion under the coldcuring condition, whereas this trend was reversed under thehot curing condition. The times required to reach the peaktemperature at the central portion were 1.5, 2, and 2 daysunder the cold, reference, and hot conditions, respectively,showing the potential for a faster strength development withthe S5 mixture under the cold temperature than the G65S5mixture under the hot temperature. This was because theaddition of GGBFS reduced the rate of hydration reactionsof the cementitious materials. On the other hand, the rate ofthe temperature drop after reaching the peak increased with adecrease in the ambient curing temperature.It is commonly known that the potential maximum heat
production of SCMs is lower than that of portland cement(Nili and Salehi 2010). As a result, using SCMs as cementreplacements in concrete reduces the temperature rise byreducing the cement content per a unit volume. Figure 5 also
clearly demonstrates that the peak temperature recorded inthe middle-center region of the G50 wall was lower than thatof the S5 wall, even though the G50 mixture was curedunder a higher ambient temperature than the S5 mixture. Thepeak temperature of the G65S5 wall was higher than that ofthe G50 wall, even though a higher amount of SCM wasused in the G65S5 concrete than in the G50 concrete. Theheat production rate at an early age in cement paste com-monly increases with an increase in the curing temperature(Zakoutsky et al. 2012), which results in a higher cumulativeheat production at an early age. The 35 �C ambient tem-perature increased the rate of hydration to compensate forthe reduced portland cement content. This implies that ahigher curing temperature produces a higher temperature risein concrete but leads to a lower differential between the coreand surface of concrete element.
Fig. 4 Typical surface state of core samples.
0
10
20
30
40
50
60
0 1 2 3 4 5 6 7 8 9 10 11 12 13
Tem
pera
true
()
Age (days)
Top centerTop surfaceMiddle centerMiddle surfaceAmbient temperature in chamber
(a) S5 mixture under cold condition
0
10
20
30
40
50
60
0 1 2 3 4 5 6 7 8 9 10 11 12 13
Tem
pera
true
()
Age (days)
Top centerTop surfaceMiddle centerMiddle surfaceAmbient temperature in chamber
(b) G50 mixture under reference condition
0
10
20
30
40
50
60
0 1 2 3 4 5 6 7 8 9 10 11 12 13
Tem
pera
true
()
Age (days)
Top centerTop surfaceMiddle centerMiddle surfaceAmbient temperature in chamber
(c) G65S5 mixture under hot condition
Fig. 5 Temperature rise profile for each concrete wall.
52 | International Journal of Concrete Structures and Materials (Vol.10, No.1, March 2016)
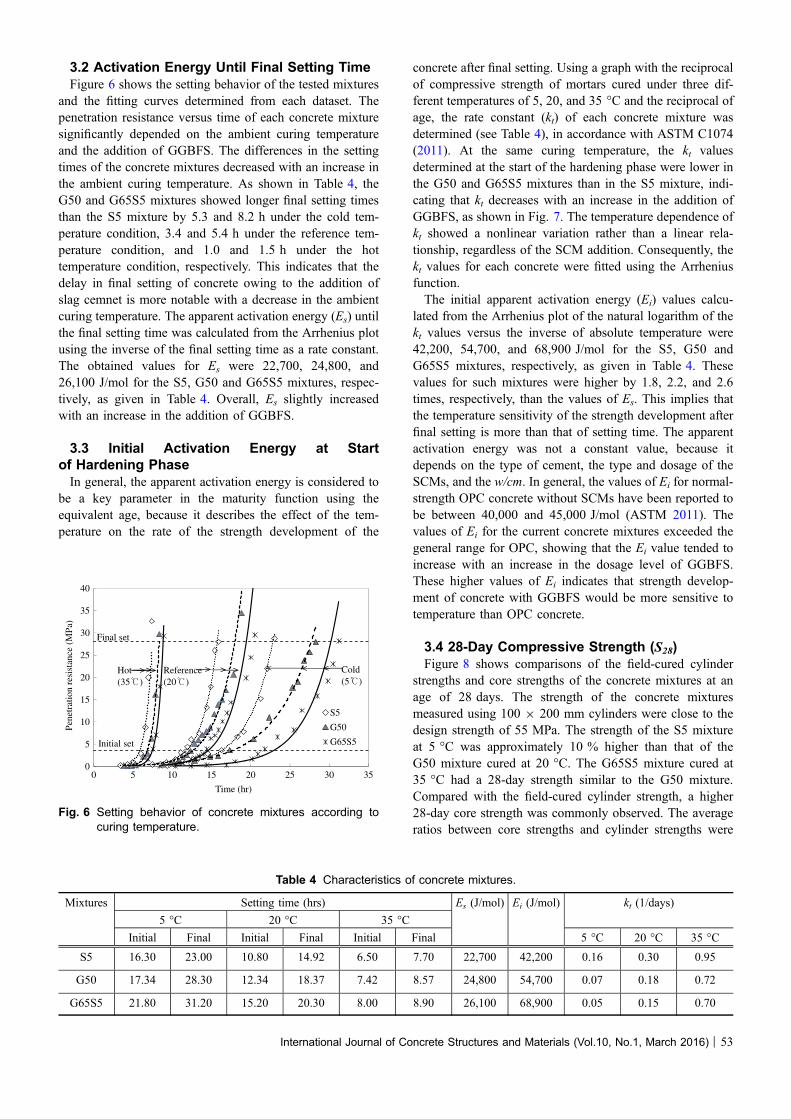
3.2 Activation Energy Until Final Setting TimeFigure 6 shows the setting behavior of the tested mixtures
and the fitting curves determined from each dataset. Thepenetration resistance versus time of each concrete mixturesignificantly depended on the ambient curing temperatureand the addition of GGBFS. The differences in the settingtimes of the concrete mixtures decreased with an increase inthe ambient curing temperature. As shown in Table 4, theG50 and G65S5 mixtures showed longer final setting timesthan the S5 mixture by 5.3 and 8.2 h under the cold tem-perature condition, 3.4 and 5.4 h under the reference tem-perature condition, and 1.0 and 1.5 h under the hottemperature condition, respectively. This indicates that thedelay in final setting of concrete owing to the addition ofslag cemnet is more notable with a decrease in the ambientcuring temperature. The apparent activation energy (Es) untilthe final setting time was calculated from the Arrhenius plotusing the inverse of the final setting time as a rate constant.The obtained values for Es were 22,700, 24,800, and26,100 J/mol for the S5, G50 and G65S5 mixtures, respec-tively, as given in Table 4. Overall, Es slightly increasedwith an increase in the addition of GGBFS.
3.3 Initial Activation Energy at Startof Hardening PhaseIn general, the apparent activation energy is considered to
be a key parameter in the maturity function using theequivalent age, because it describes the effect of the tem-perature on the rate of the strength development of the
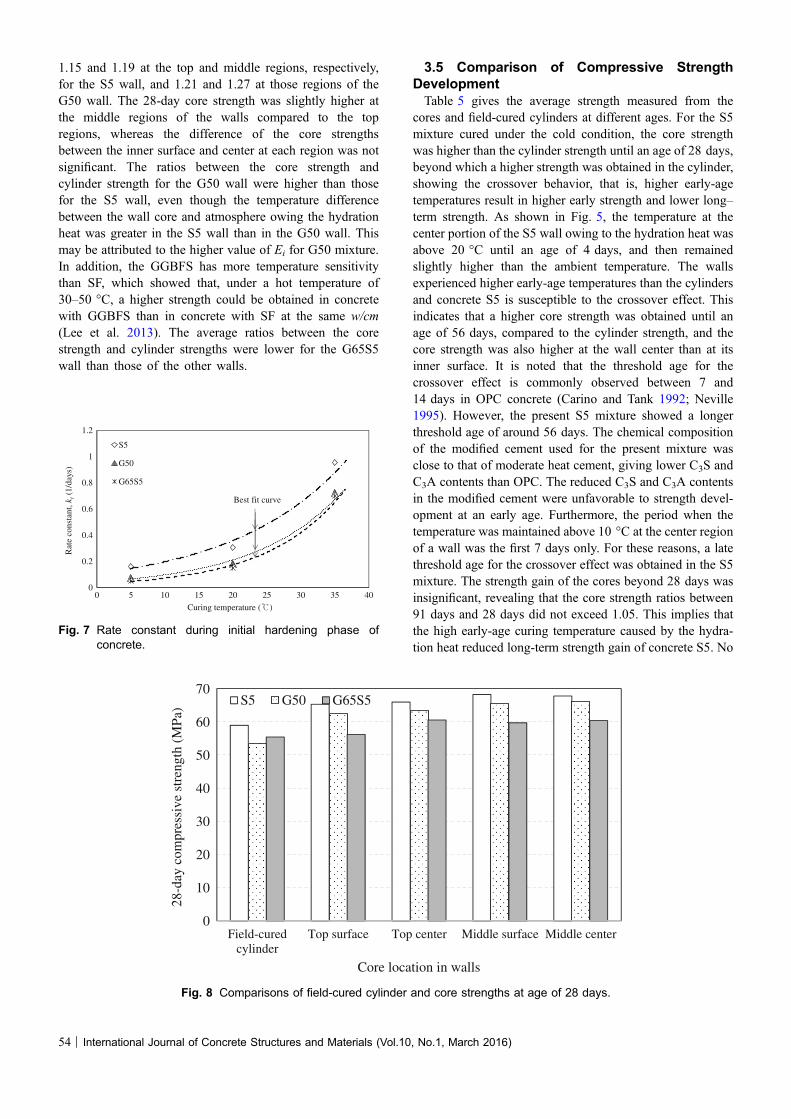
concrete after final setting. Using a graph with the reciprocalof compressive strength of mortars cured under three dif-ferent temperatures of 5, 20, and 35 �C and the reciprocal ofage, the rate constant (kt) of each concrete mixture wasdetermined (see Table 4), in accordance with ASTM C1074(2011). At the same curing temperature, the kt valuesdetermined at the start of the hardening phase were lower inthe G50 and G65S5 mixtures than in the S5 mixture, indi-cating that kt decreases with an increase in the addition ofGGBFS, as shown in Fig. 7. The temperature dependence ofkt showed a nonlinear variation rather than a linear rela-tionship, regardless of the SCM addition. Consequently, thekt values for each concrete were fitted using the Arrheniusfunction.The initial apparent activation energy (Ei) values calcu-
lated from the Arrhenius plot of the natural logarithm of thekt values versus the inverse of absolute temperature were42,200, 54,700, and 68,900 J/mol for the S5, G50 andG65S5 mixtures, respectively, as given in Table 4. Thesevalues for such mixtures were higher by 1.8, 2.2, and 2.6times, respectively, than the values of Es. This implies thatthe temperature sensitivity of the strength development afterfinal setting is more than that of setting time. The apparentactivation energy was not a constant value, because itdepends on the type of cement, the type and dosage of theSCMs, and the w/cm. In general, the values of Ei for normal-strength OPC concrete without SCMs have been reported tobe between 40,000 and 45,000 J/mol (ASTM 2011). Thevalues of Ei for the current concrete mixtures exceeded thegeneral range for OPC, showing that the Ei value tended toincrease with an increase in the dosage level of GGBFS.These higher values of Ei indicates that strength develop-ment of concrete with GGBFS would be more sensitive totemperature than OPC concrete.
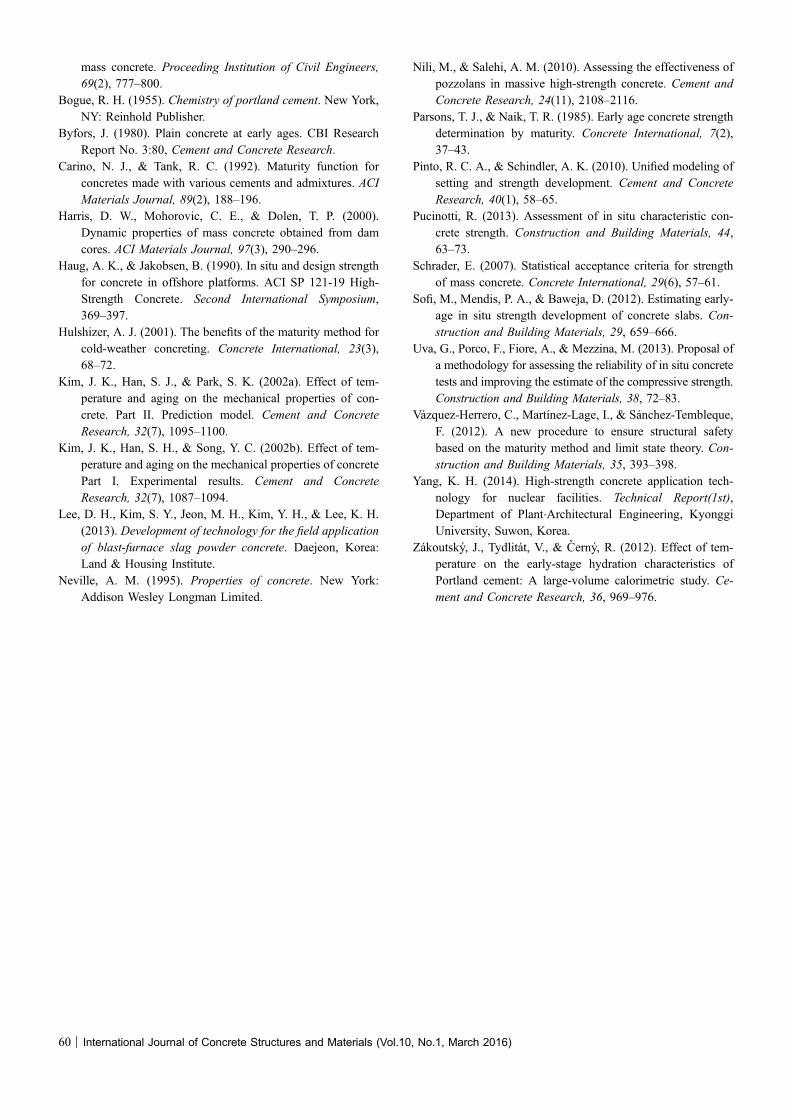
3.4 28-Day Compressive Strength (S28)Figure 8 shows comparisons of the field-cured cylinder
strengths and core strengths of the concrete mixtures at anage of 28 days. The strength of the concrete mixturesmeasured using 100 9 200 mm cylinders were close to thedesign strength of 55 MPa. The strength of the S5 mixtureat 5 �C was approximately 10 % higher than that of theG50 mixture cured at 20 �C. The G65S5 mixture cured at35 �C had a 28-day strength similar to the G50 mixture.Compared with the field-cured cylinder strength, a higher28-day core strength was commonly observed. The averageratios between core strengths and cylinder strengths were
0
5
10
15
20
25
30
35
40
0 5 10 15 20 25 30 35
Pen
etra
tion
resi
stan
ce (
MP
a)
Time (hr)
S5
G50
G65S5
Final set
Initial set
Hot(35 )
Reference(20 )
Cold(5 )
Fig. 6 Setting behavior of concrete mixtures according tocuring temperature.
Table 4 Characteristics of concrete mixtures.
Mixtures Setting time (hrs) Es (J/mol) Ei (J/mol) kt (1/days)
5 �C 20 �C 35 �CInitial Final Initial Final Initial Final 5 �C 20 �C 35 �C
S5 16.30 23.00 10.80 14.92 6.50 7.70 22,700 42,200 0.16 0.30 0.95
G50 17.34 28.30 12.34 18.37 7.42 8.57 24,800 54,700 0.07 0.18 0.72
G65S5 21.80 31.20 15.20 20.30 8.00 8.90 26,100 68,900 0.05 0.15 0.70
International Journal of Concrete Structures and Materials (Vol.10, No.1, March 2016) | 53
1.15 and 1.19 at the top and middle regions, respectively,for the S5 wall, and 1.21 and 1.27 at those regions of theG50 wall. The 28-day core strength was slightly higher atthe middle regions of the walls compared to the topregions, whereas the difference of the core strengthsbetween the inner surface and center at each region was notsignificant. The ratios between the core strength andcylinder strength for the G50 wall were higher than thosefor the S5 wall, even though the temperature differencebetween the wall core and atmosphere owing the hydrationheat was greater in the S5 wall than in the G50 wall. Thismay be attributed to the higher value of Ei for G50 mixture.In addition, the GGBFS has more temperature sensitivitythan SF, which showed that, under a hot temperature of30–50 �C, a higher strength could be obtained in concretewith GGBFS than in concrete with SF at the same w/cm(Lee et al. 2013). The average ratios between the corestrength and cylinder strengths were lower for the G65S5wall than those of the other walls.
3.5 Comparison of Compressive StrengthDevelopmentTable 5 gives the average strength measured from the
cores and field-cured cylinders at different ages. For the S5mixture cured under the cold condition, the core strengthwas higher than the cylinder strength until an age of 28 days,beyond which a higher strength was obtained in the cylinder,showing the crossover behavior, that is, higher early-agetemperatures result in higher early strength and lower long–term strength. As shown in Fig. 5, the temperature at thecenter portion of the S5 wall owing to the hydration heat wasabove 20 �C until an age of 4 days, and then remainedslightly higher than the ambient temperature. The wallsexperienced higher early-age temperatures than the cylindersand concrete S5 is susceptible to the crossover effect. Thisindicates that a higher core strength was obtained until anage of 56 days, compared to the cylinder strength, and thecore strength was also higher at the wall center than at itsinner surface. It is noted that the threshold age for thecrossover effect is commonly observed between 7 and14 days in OPC concrete (Carino and Tank 1992; Neville1995). However, the present S5 mixture showed a longerthreshold age of around 56 days. The chemical compositionof the modified cement used for the present mixture wasclose to that of moderate heat cement, giving lower C3S andC3A contents than OPC. The reduced C3S and C3A contentsin the modified cement were unfavorable to strength devel-opment at an early age. Furthermore, the period when thetemperature was maintained above 10 �C at the center regionof a wall was the first 7 days only. For these reasons, a latethreshold age for the crossover effect was obtained in the S5mixture. The strength gain of the cores beyond 28 days wasinsignificant, revealing that the core strength ratios between91 days and 28 days did not exceed 1.05. This implies thatthe high early-age curing temperature caused by the hydra-tion heat reduced long-term strength gain of concrete S5. No
0
0.2
0.4
0.6
0.8
1
1.2
0 5 10 15 20 25 30 35 40
Rat
e co
nsta
nt, k
t(1
/day
s)
Curing temperature ( )
S5
G50
G65S5
Best fit curve
Fig. 7 Rate constant during initial hardening phase ofconcrete.
0
10
20
30
40
50
60
70
Field-curedcylinder
Top surface Top center Middle surface Middle center
28-d
ay c
ompr
essi
ve s
tren
gth
(MPa
)
Core location in walls
S5 G50 G65S5
Fig. 8 Comparisons of field-cured cylinder and core strengths at age of 28 days.
54 | International Journal of Concrete Structures and Materials (Vol.10, No.1, March 2016)

crossover effect was observed in either the G50 or the G65Smixture. For the G50 mixture, which was stored at anambient temperature of 20 �C, higher core strengths com-pared to cylinder strengths were obtained throughout thetesting ages, showing the highest strength for the core drilledfrom the middle-center region of the wall, as given inTable 5. The G65S5 mixture, which was stored at 35 �C,showed smaller differences between the core and cylinderstrengths, compared with the other mixtures.
4. Comparisons of Maturity Functionsand Experiments
4.1 Review of Existing ModelsConsidering temperature variation by the heat of hydration
in mass concrete or the change of external environment, Kimet al. (2002a) proposed a modified strength–maturity rela-tionship for estimating strength development of concrete, assummarized in Table 6. Their modified maturity functionassumed that the value of Ei is constant with aging becausethe activation energy can be regarded to be the characteristicproperty of concrete, whereas the limiting strength (Su) is afunction of age and temperature under variable curing tem-perature. In the maturity function, the parameters were basedon regression analysis of test data. However, the value of Suunder variable temperature was not clearly identified, whichwould lead to additional hard task to obtain straightfor-wardly the strength development at a specified age.Pinto and Schindler (2010) proposed an extended maturity
approach to unify the distinctly different temperature sensi-tivities before setting and during the hardening period of
concrete, based on the Arrhenius maturity function. The effectof different activation energies on the strength–maturityrelationshipwas taken into account, as summarized in Table 6.This maturity approach also demonstrated that the settingbehavior needs to be taken into account in the strength–ma-turity relationship in order to improve the overall strengthestimation of concrete at all ages. Hence, different activationenergy values before and after the final setting of concretewere used in calculating equivalent age at the reference tem-perature. The offset time function (tsr) was introduced toaccount for the effect of temperature on the setting time of theconcrete. However, there are insufficient data for verificationof the Pinto and Schindler model for estimating strength gainunder variable temperature conditions.Yang (2014) proposed a modification for the strength–ma-
turity relationship proposed by Carino and Tank (1992) inorder to explain that the maturity is related to the relativestrength rather than the absolute strength. The maturity func-tion computes the equivalent age (te) at the reference tem-perature (Tr), including the setting and hardening phases.Because the offset time (t0r) at Tr is related to the settingbehavior of concrete, the offset time (t0) at a given temperaturewas assumed to be equal to the final setting time (ts) of concreteat that temperature. This maturity function considered thatduring the hardening phase, increments of equivalent age areproportional to the affinity ratio of the rate constants using Ea,whereas the offset time at the setting phase is inversely pro-portional to the affinity ratio determined using Es, because ahigher temperature would result in a shorter setting time.Furthermore, the temperature–dependent hydration reactionalso affects the value of the Ea at the hardening phase. Byfors(1980) showed that Ea decreases sharply beyond a certain age
Table 5 Compressive strength development of concrete mixtures.
Mixture Specimens Compressive strength (MPa) at different ages (days)
3 7 14 28 56 91
S5 Field-cured cylinder 21.5 37.9 50.9 58.9 67.5 75.8
Core (locationdrilled from
walls)
Top surface 32.4 49.2 61.9 65.3 65.5 66.7
Top center 34.4 48.5 62.8 66.0 66.6 67.0
Middle surface 36.6 51.4 64.7 68.3 68.3 69.7
Middle center 44.9 52.3 61.4 67.8 69.8 71.0
G50 Field-cured cylinder 18.4 37.5 45.5 53.4 55.4 58.9
Core (locationdrilled from
walls)
Top surface 27.8 44.2 50.2 62.6 63.4 65.4
Top center 35.9 50.0 56.0 63.5 64.6 65.7
Middle surface 29.4 43.7 56.4 65.5 65.5 67.1
Middle center 33.6 53.0 56.2 66.0 67.0 67.6
G65S5 Field-cured cylinder 30.7 45.3 52.2 55.4 55.1 58.3
Core (locationdrilled from
walls)
Top surface 32.7 48.4 54.5 56.2 56.8 58.3
Top center 43.3 54.9 57.0 60.6 58.3 60.6
Middle surface 35.8 48.3 55.8 59.7 61.3 62.8
Middle center 41.3 55.6 56.0 60.4 63.3 63.7
International Journal of Concrete Structures and Materials (Vol.10, No.1, March 2016) | 55

that varies with curing temperature. Therefore, Ea somewhatdepends on the curing temperature and age, which affects thevalue of equivalent age. However, the compressive strengthdevelopment of concrete is insignificantly affected by thevalue of the apparent activation energy. For the three concretemixtures tested, the estimates using the constant value of Ei
produced the approximately same strength–age curves as theestimates using the variable value Ea given in Table 6. Hence,the parameter Ea in Yang’s model needs to be replaced usingthe constant Ei for simpler calculation process. Yang (2014)showed that the strength development of HSC is independentof the curing temperature after an early critical age, and 3 dayscan be selected as this critical age. Considering the tempera-ture-dependence of the setting and hardening phases and theearly-age curing temperature effect until the critical period, tefor HSC was calculated as the sum of three terms, as given inTable 6. To straightforwardly calculate the strength develop-ment at different ages, the relationship between S28 and S28ð ÞTrneeds to be established for a given concrete. From theregression analysis of test data, Yang showed that the rela-tionship between S28 and S28ð ÞTr is significantly affected byw/cm and the temperature until the early age of 3 days as a criticalfactor to represent the whole temperature history.
4.2 Comparisons with Test ResultsFigure 9 shows some comparisons of estimated strength
based on strength–maturity relationships in Table 6 with
strength gain of concrete mixtures measured by the field-cured cylinders and cores drilled from the middle centerregions of the walls. Table 7 shows the mean (cm), standarddeviation (cs), and coefficient of variation (cv) of the ratios(c ¼ Sestimation=Stest) between estimated compressive strengthof concrete and test results. In estimating the in situ strengthsof walls using the reviewed maturity approaches, the tem-perature profile measured at each core location was used forthe curing temperature. The ambient temperature of eachchamber was also used for estimating the strength of field-cured cylinders. For the models proposed by Pinto andSchindler (2010) and Yang (2014), the experimental valuesgiven in Table 4 were used for key parameters such as tsr, kr,Ei, and Es. For the limiting strength in the models of Kimet al. and Pinto and Schindler, 91-day strength was used. Themodel proposed by Kim et al. (2002a) underestimated thestrength gain of the S5 mixture stored at 5 �C but tended tooverestimate the strength gain of the G50 and G65S5 mix-tures. This overestimation was greater for cylinder speci-mens than for cores, as shown in Fig. 9. The estimatesobtained from the Pinto and Schindler model (2010) werealso lower than the measured strength gain of the S5 mix-ture, but were in good agreement with the strength gain ofcores drilled from the G50 and G665S5 walls. However, thePinto and Schindler model still overestimated the field-curedcylinder strength of the G50 and G665S5 mixtures. Fur-thermore, this model gave no strength gain of cores at an age
Table 6 Summary of previous models for strength–maturity relationship.
Researcher Formulation of the relationship
Kim et al. (2002a)
SSu¼ 1� 1
ffiffiffiffiffiffiffiffiffiffiffiffiffiffiffiffiffiffiffiffiffiffiffiffiffiffiffiffiffiffiffiffiffiffiffiffiffiffiffiffiffiffiffiffiffiffiffiffiffiffiffiffiffiffiffiffiffiffiffiffiffiffiffiffiffiffiffiffiffiffiffiffiffiffiffiffiffiffiffiffiffi
1þP
n
i¼1
A e� EaðiÞR Tc ðiÞþ273½ �e
�atiþ e
� EaðiÞR TcðiÞþ273½ �e
�ati�1h i
ðti�ti�1Þ
r
8
>
>
<
>
>
:
9
>
>
=
>
>
;
where A ¼ 1� 107 (experimental constant); EaðiÞ ¼ 42830� 43TcðiÞ(in J/mol);
a ¼ 0:00017TcðiÞ; and to ¼ 0:66� 0:011TcðiÞ� 0
Pinto and Schindler (2010) SSu¼ krðt�e�tsrÞ
1þkrðt�e�tsrÞ
where tsr ¼ ts exp � Es
R1
TcðiÞþ273 � 1Trþ273
� �h i
; and
t�e ¼P
tsr
0exp � Es
R1
TcðiÞþ273 � 1Trþ273
� �h i
tiþP
t
0exp � Ei
R1
TcðiÞþ273 � 1Trþ273
� �h i
ti
Yang (2014) SS28
¼ b1krðte�torÞ
1þkrðte�torÞ
where b1 ¼ SuS28
¼ 1þ 1kr �28; kT ¼ kr exp � EaðiÞ
R1
TcðiÞþ273 � 1Trþ273
� �h i
;
tor ¼ tsr exp � Es
R1
TcðiÞþ273 � 1Trþ273
� �h i
;
te ¼P
tsr
0exp � Es
R1
TcðiÞþ273 � 1Trþ273
� �h i
Dti
þP
3
tsr
exp � EaðiÞR
1TcðiÞþ273 � 1
Trþ273
� �h i
DtiþP
t
3exp � EaðiÞ
R1
TA3þ273 � 1Trþ273
� �h i
Dti
S28 ¼ TA3Tr
� �2ðw=cmÞ4 þ 0:97
� �
ðS28ÞTr ; and
EaðiÞ ¼ Ei � expð�0:00017TcðiÞ � tÞ
56 | International Journal of Concrete Structures and Materials (Vol.10, No.1, March 2016)

0 30 60 90
Exp.Kim et al.Pinto and SchindlerYang
[Core at the middle centerof the wall]
0 30 60 90Age (days)
[Core at the middle surfaceof the wall]
0
10
20
30
40
50
60
70
80
90
100
0 30 60 90
Com
pres
sive
str
engt
h (M
Pa)
[Cylinder]
(a) S5 mixture under cold temperature condition
0 30 60 90
Exp.Kim et al.Pinto and SchindlerYang
[Core at the middle centerof the wall]
0 30 60 90Age (days)
[Core at the middle surfaceof the wall]
0
10
20
30
40
50
60
70
80
90
0 30 60 90
Com
pres
sive
str
engt
h (M
Pa)
[Cylinder]
(b) G50 mixture under reference temperature condition
0 30 60 90
Exp.
Kim et al.
Pinto and Schindler
Yang
[Core at the middle centerof the wall]
0 30 60 90Age (days)
[Core at the middle surfaceof the wall]
0
10
20
30
40
50
60
70
80
90
0 30 60 90
Com
pres
sive
str
engt
h (M
Pa)
[Cylinder]
(c) G65S5 mixture under hot temperature condition
Fig. 9 Comparisons of measured strengths and estimates based on strength–maturity relationships given in Table 6.
International Journal of Concrete Structures and Materials (Vol.10, No.1, March 2016) | 57

Table
7Statisticalva
luesofratio
sbetweenestim
atedandmeasu
redstrengths.
Mixtures
Statistics
Kim
etal.(200
2a)
Pinto
andSchindler
(201
0)Yang(201
4)
Age
(days)
Total
Age
(days)
Total
Age
(days)
Total
37
2891
37
2891
37
2891
S5
c m1.08
40.86
60.75
70.82
50.88
30.94
20.88
80.84
30.89
00.89
01.13
01.10
11.04
41.02
21.07
4
c s0.31
20.18
80.05
70.06
00.21
30.27
30.14
40.02
80.06
20.15
00.21
70.17
70.06
60.08
00.14
4
c v0.28
80.21
80.07
60.07
30.24
10.29
00.16
20.03
30.07
00.16
80.19
20.16
10.06
10.07
80.13
4
G50
c m1.47
51.09
80.99
21.07
21.15
90.98
00.96
90.97
41.04
00.99
11.06
31.02
10.96
50.98
61.00
9
c s0.10
30.04
20.06
60.04
30.20
10.03
50.03
00.06
00.04
00.04
90.07
20.07
90.03
70.02
40.06
5
c v0.06
90.03
80.06
70.04
00.17
30.03
60.03
10.06
20.03
900.04
90.06
70.07
70.03
90.02
40.06
4
G65
S5
c m1.39
31.15
11.14
71.17
01.21
50.85
51.01
01.110
1.14
11.02
91.21
51.08
61.05
31.07
61.10
7
c s0.12
20.06
20.03
70.04
00.12
50.08
00.04
60.03
40.03
90.12
40.10
90.04
60.02
90.04
00.08
7
c v0.08
70.05
40.03
20.03
40.10
30.09
40.04
50.03
00.03
40.12
00.09
00.04
20.02
80.03
70.07
9
c m,c s,andc v
indicate
themean,
standard
deviation,
andcoefficientof
variationof
theratios
(c¼
S estimation=S test)betweentheestimates
andmeasuredstreng
ths.
58 | International Journal of Concrete Structures and Materials (Vol.10, No.1, March 2016)

of 1 day. Pinto and Schindler model had lower values of csand cv than Kim et al.’s model. The maturity approachproposed by Yang (2014) tended to overestimate the earlystrength until the age of 3 days for the S5 mixture and theG65S5 mixture, beyond which the overestimation graduallydiminished. For the estimates based on Yang’s model, noclear trend was observed for the differences in the c valuesbetween the cylinders and cores. For the three mixtures atdifferent ages of 3, 7, 14, 28, 56, and 91 days, the overallvalues of cm, cs, and cv determined from the reviewedmodels were 1.057, 0.219, and 0.207, respectively, for Kimet al., 0.979, 0.127, and 0.130 for Pinto and Schindler, and1.058, 0.098, and 0.093 for Yang. This indicates that Yang’sapproach gives slightly more reliable estimates with lessscatter, even at early ages.
5. Conclusions
To evaluate the effect of the hydration heat on the in situstrength development of three HSC mixtures in a massivewall stored under different ambient temperatures andexamine the difference between field-cured cylinder strengthand in situ strength measured from cores, 1200-mm thickmock-up walls were prepared and stored in approximatelyisothermal chambers at 5 �C (cold condition), 20 �C (refer-ence condition), and 35 �C (hot condition). The HSC mix-ture proportions specifically determined for use in nuclearfacility structures were identified as S5 (with 5 % SF) forstorage under the cold condition, G50 (with 50 % GGBFS)for storage under the reference condition, and G65S5 (with65 % GGBFS and 5 % SF) for storage under the hot con-dition. The in situ compressive strength development in themock-up walls measured from core samples was comparedwith estimated strength based on three strength–maturityrelationship models, considering the temperature rise owingto the hydration heat. The following conclusions may bedrawn from this study:
1. The G50 and G65S5 mixtures had longer final settingtimes than the S5 mixture, regardless of the curingtemperature. The differences in the setting times of theconcrete mixtures increased with a decrease in theambient curing temperature.
2. The initial apparent activation energies at the hardeningphase were higher by 1.8, 2.2, and 2.6 times for the S5,G50 and G65S5 mixtures, respectively, than the appar-ent activation energies until the final setting, indicatingthat the temperature sensitivity of the strength develop-ment is more than that of setting time.
3. The differences in the 28-day strengths between thefield-cured cylinders and cores were higher for the G50wall than for the S5 wall. Meanwhile, the 28-daystrength measured by cores from the G65S5 wall wassimilar to that of the companion field-cured cylinders.
4. For the S5 mixture stored at 5 �C, the core strength wascommonly higher than the field-cured cylinder strengthuntil an age of 28 days, beyond which a higher strength
was obtained in the cylinders, showing the crossovereffect. Furthermore, the core strength at an early age washigher at the central region of the wall than at its innersurface region due to greater temperature rise from heatof hydration.
5. For the G65S5 mixture, a strength gain of more thanapproximately 80 % of design strength was achievedwithin the first 7 days, even for the field-cured strength.However, for the S5 mixtures stored at 5 �C, thecylinder strength at 7 days failed to meet the 80 %design strength level, whereas the core strengthsachieved this value.
6. The strength–maturity model proposed by Yang pro-vides better reliability in estimating in situ strength ofconcrete than that of Kim et al. and Pinto and Schindler,indicating that the internal curing effect owing to thehydration heat in a massive member needs to beconsidered to reasonably assess the early-age strengthof concrete.
Acknowledgments
This work was supported by a Nuclear Research andDevelopment program of the Korea Institute of EnergyTechnology Evaluation and Planning (KETEP) Grant fundedby the Korea Government Ministry of Knowledge Economy(2011T100200161).
Open Access
This article is distributed under the terms of the CreativeCommons Attribution 4.0 International License(http://creativecommons.org/licenses/by/4.0/), which per-mits unrestricted use, distribution, and reproduction in anymedium, provided you give appropriate credit to the originalauthor(s) and the source, provide a link to the CreativeCommons license, and indicate if changes were made.
References
ACI Committee 214. (2010). Guide for obtaining cores and
interpreting compressive strength results (ACI 214.4R-10).
American Concrete Institute, Farmington Hills, Michigan,
USA.
ACI Committee 306. (2010). Guide to cold weather concreting
(ACI 306R-10). American Concrete Institute, Farmington
Hills, Michigan, USA.
ASTM C42/C42 M, C150, C403/C403 M, C989, C1074.
(2011). Annual Book of ASTM Standards, V. 4.02, ASTM
International, West Conshohocken, PA. 2011.
Bamforth, P. B. (1980). In situ measurement of the effect of
partial Portland cement replacement using either fly ash or
ground granulated blast furnace slag on the performance of
International Journal of Concrete Structures and Materials (Vol.10, No.1, March 2016) | 59
mass concrete. Proceeding Institution of Civil Engineers,
69(2), 777–800.
Bogue, R. H. (1955). Chemistry of portland cement. New York,
NY: Reinhold Publisher.
Byfors, J. (1980). Plain concrete at early ages. CBI Research
Report No. 3:80, Cement and Concrete Research.
Carino, N. J., & Tank, R. C. (1992). Maturity function for
concretes made with various cements and admixtures. ACI
Materials Journal, 89(2), 188–196.
Harris, D. W., Mohorovic, C. E., & Dolen, T. P. (2000).
Dynamic properties of mass concrete obtained from dam
cores. ACI Materials Journal, 97(3), 290–296.
Haug, A. K., & Jakobsen, B. (1990). In situ and design strength
for concrete in offshore platforms. ACI SP 121-19 High-
Strength Concrete. Second International Symposium,
369–397.
Hulshizer, A. J. (2001). The benefits of the maturity method for
cold-weather concreting. Concrete International, 23(3),
68–72.
Kim, J. K., Han, S. J., & Park, S. K. (2002a). Effect of tem-
perature and aging on the mechanical properties of con-
crete. Part II. Prediction model. Cement and Concrete
Research, 32(7), 1095–1100.
Kim, J. K., Han, S. H., & Song, Y. C. (2002b). Effect of tem-
perature and aging on the mechanical properties of concrete
Part I. Experimental results. Cement and Concrete
Research, 32(7), 1087–1094.
Lee, D. H., Kim, S. Y., Jeon, M. H., Kim, Y. H., & Lee, K. H.
(2013). Development of technology for the field application
of blast-furnace slag powder concrete. Daejeon, Korea:
Land & Housing Institute.
Neville, A. M. (1995). Properties of concrete. New York:
Addison Wesley Longman Limited.
Nili, M., & Salehi, A. M. (2010). Assessing the effectiveness of
pozzolans in massive high-strength concrete. Cement and
Concrete Research, 24(11), 2108–2116.
Parsons, T. J., & Naik, T. R. (1985). Early age concrete strength
determination by maturity. Concrete International, 7(2),
37–43.
Pinto, R. C. A., & Schindler, A. K. (2010). Unified modeling of
setting and strength development. Cement and Concrete
Research, 40(1), 58–65.
Pucinotti, R. (2013). Assessment of in situ characteristic con-
crete strength. Construction and Building Materials, 44,
63–73.
Schrader, E. (2007). Statistical acceptance criteria for strength
of mass concrete. Concrete International, 29(6), 57–61.
Sofi, M., Mendis, P. A., & Baweja, D. (2012). Estimating early-
age in situ strength development of concrete slabs. Con-
struction and Building Materials, 29, 659–666.
Uva, G., Porco, F., Fiore, A., & Mezzina, M. (2013). Proposal of
a methodology for assessing the reliability of in situ concrete
tests and improving the estimate of the compressive strength.
Construction and Building Materials, 38, 72–83.
Vazquez-Herrero, C., Martınez-Lage, I., & Sanchez-Tembleque,
F. (2012). A new procedure to ensure structural safety
based on the maturity method and limit state theory. Con-
struction and Building Materials, 35, 393–398.
Yang, K. H. (2014). High-strength concrete application tech-
nology for nuclear facilities. Technical Report(1st),
Department of Plant�Architectural Engineering, Kyonggi
University, Suwon, Korea.
Zakoutsky, J., Tydlitat, V., & Cerny, R. (2012). Effect of tem-
perature on the early-stage hydration characteristics of
Portland cement: A large-volume calorimetric study. Ce-
ment and Concrete Research, 36, 969–976.
60 | International Journal of Concrete Structures and Materials (Vol.10, No.1, March 2016)