comparison of the corrosion protection effectiveness of ... · comparison of the corrosion...
TRANSCRIPT

Comparison of the Corrosion Protection Effectiveness of
Vapor Corrosion Inhibitors VpCI-337 and Dry Air
System
For:
CORTEC Corporation
by:
Behzad Bavarian, Yashar Ikder, Babak Samimi and Lisa Reiner
Dept. of Manufacturing Systems Engineering & Management
College of Engineering and Computer Science
California State University, Northridge, USA 91330
March 2015

Summary
With the price of oil at $50(US) a barrel, temporary shutdowns of petrol pipelines and exploration
equipment will become a more common occurrence. This will require mothballing equipment and
serious corrosion protection. Some of the techniques suitable for this type of protection are
examined in this investigation where the corrosion behavior of carbon and galvanized steel
samples were tested in two environments containing 200 ppm chloride solution. The first test
environment used 10% inhibitor and was compared with samples placed in dry air (at 20 psi
applied pressure) where moisture levels were maintained at less than 40% RH. The corrosion rate
of the exposed samples were monitored for more than six months using electrical resistance (ER)
probe techniques. The data demonstrated that the inhibitor provided superior corrosion protection
for the steel samples. The samples in the dry air system suffered corrosion attack and red rust
formation after 21 days. The ER probes showed a corrosion rate of less than 0.08 mpy with
inhibitor, while the dry air samples showed a 1.6 mpy corrosion rate and the ER probes were
heavily corroded.
Introduction
Over the past 20 years, various corrosion protection systems have been implemented to improve
structural longevity. These implementations have been worldwide, as corrosion concerns affect all
industrialized countries. Japan (with the Innoshima, Ohnaruto and Akashi-Kaikyo Bridges) [1],
Denmark (the Danish Faroe, Great Belt and Little Belt Bridges), Sweden (Högakusten Bridge) [1,
2] and South Wales (Severn Bridge) [3] have been studied to assess these corrosion concerns.
Several of the bridges in Japan with high strength cables (typically steel that has been hot dip
galvanized in zinc) suffered advanced states of corrosion (cracking and swelling) due to inadequate
paint coatings and high levels of humidity [1]. Subsequent bridge construction required the use of
a dehumidification system to force dry air in and limit moisture. Two countries, Norway
(Hálogaland and Hardanger Bridges) and Japan have required dehumidification systems in all
bridge construction since 2009 [2]. In the United States there are numerous complications
regarding infrastructure, military equipment and aging aircraft due to atmospheric corrosion.
It has been estimated that between $2 trillion and $4 trillion are lost to corrosion each decade [4].
In atmospheric corrosion, a material is subjected to air moisture and pollutants [5]. Corrosion, the
natural degradation of materials due to interactions with the environment can be uniform or
localized. The vast majority of natural degradation, however, is uniform, and atmospheric
corrosion is probably the most prevalent type [6]. Atmospheric corrosion is generally a serious
risk to metals that are exposed to the environment. The U.S. Government reports that corrosion
damage for military defense exceeds $20 billion per year [7]. Preservation and mothballing
equipment during storage is extremely important in maintaining military preparedness. The
Department of Defense (DoD) has an enormous amount of equipment and facilities that are
susceptible to corrosion. Military forces operate worldwide where corrosion related effects

including humidity, fluctuating temperature, salt spray and caustic desert environments with
abrasive sand can attack the surface of materials reducing availability and deteriorating
performance. Defense system maintenance involves roughly 300 ships, 15,000 aircraft, 900
strategic missiles and 350,000 ground combat and tactical vehicles, and the storage and operation
facilities (thousands of buildings, piers, runways, underground conduits and other items of military
infrastructure). DoD corrosion related maintenance costs are estimated at $23 billion each year
(approximately 40% of the defense system maintenance budget) [8].
Common techniques used to reduce humidity or isolate the metal from moisture including physical
barriers, such as paints and lubricants, will lessen the corrosion rate significantly. Concern for the
environment and desire to minimize use of hazardous chemicals has led to system modification
and the development of new technologies for barrier coatings. An alternative approach, controlled
humidity protection, focuses on the air moisture, specifically relative humidity (RH). RH is the
amount of moisture in the air, as compared to the amount of moisture it can hold at a given
temperature. Elimination of moisture is critical for suppressing the corrosion rate in atmospheric
corrosion. By extracting moisture from the air, RH can be reduced to a level where surface wetness
cannot form [9]. Dry air is recirculated around the equipment to prevent oxidation. The removal
of moisture from the air essentially eliminates the electrolyte from the corrosion process. It has
been determined that steel is much less likely to corrode in environments with less than 40%
humidity [2, 5]. Controlled Humidity Protection (CHP) has been extensively evaluated and is
applied by many nations as a maintenance technology for operational weapon systems.
Independent studies and analyses performed by DoD Inspector General and Army Cost and
Economic Analysis Center validated the significant benefits achieved with controlled humidity
protection [9]. Many foreign defense forces (Royal Netherlands Air Force and Royal Air Force)
currently use CHP as a maintenance technology for their operational weapon systems. An industry
analysis of eleven European defense forces [2, 10] showed that the majority have instituted CHP
technology in both operational and longer term applications. The U.S. Army relies on
dehumidification systems, special covers, composite materials and galvanizing techniques to
combat the damaging effects. Dehumidification systems are used inside military vehicles and
aircraft to reduce damage to electronics engines, radar and avionics, at the naval base in Kuwait
for the protection of Army watercraft and inside storage facilities. Typically the dehumidification
units are used in conjunction with other preventative measures and require portable systems with
hoses and fittings that can be connected and disconnected quickly. Despite positive data for
dehumidification systems, localized corrosion attacks have been reported. When a system is
breached and pollutants or contamination enter the dry air system, localized corrosion can occur.
Atmospheric corrosion is an electrochemical process initiated by a thin layer of moisture on the
metal surface. The electrolyte composition depends on the deposition rates of the air pollutants
and varies with the wetting conditions [11]. Corrosion severity is affected by humidity, pollutants
and temperature [6]. Humidity is a necessary component for corrosion to occur, but it is not the
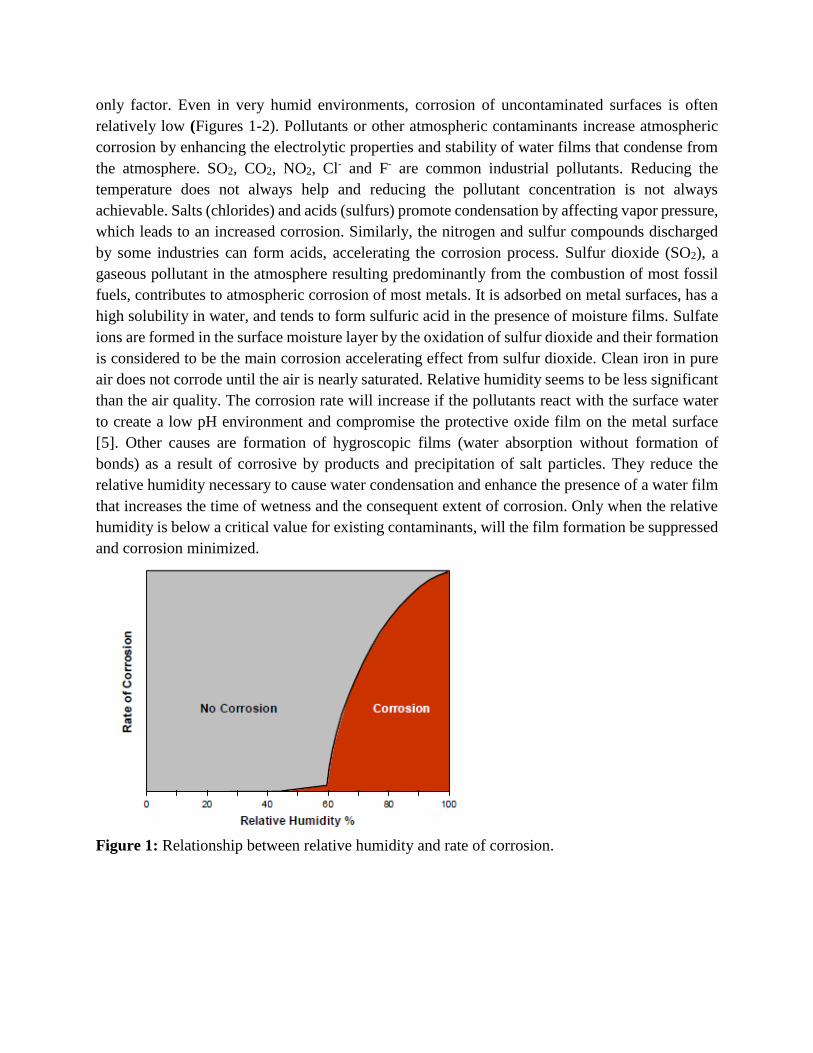
only factor. Even in very humid environments, corrosion of uncontaminated surfaces is often
relatively low (Figures 1-2). Pollutants or other atmospheric contaminants increase atmospheric
corrosion by enhancing the electrolytic properties and stability of water films that condense from
the atmosphere. SO2, CO2, NO2, Cl- and F- are common industrial pollutants. Reducing the
temperature does not always help and reducing the pollutant concentration is not always
achievable. Salts (chlorides) and acids (sulfurs) promote condensation by affecting vapor pressure,
which leads to an increased corrosion. Similarly, the nitrogen and sulfur compounds discharged
by some industries can form acids, accelerating the corrosion process. Sulfur dioxide (SO2), a
gaseous pollutant in the atmosphere resulting predominantly from the combustion of most fossil
fuels, contributes to atmospheric corrosion of most metals. It is adsorbed on metal surfaces, has a
high solubility in water, and tends to form sulfuric acid in the presence of moisture films. Sulfate
ions are formed in the surface moisture layer by the oxidation of sulfur dioxide and their formation
is considered to be the main corrosion accelerating effect from sulfur dioxide. Clean iron in pure
air does not corrode until the air is nearly saturated. Relative humidity seems to be less significant
than the air quality. The corrosion rate will increase if the pollutants react with the surface water
to create a low pH environment and compromise the protective oxide film on the metal surface
[5]. Other causes are formation of hygroscopic films (water absorption without formation of
bonds) as a result of corrosive by products and precipitation of salt particles. They reduce the
relative humidity necessary to cause water condensation and enhance the presence of a water film
that increases the time of wetness and the consequent extent of corrosion. Only when the relative
humidity is below a critical value for existing contaminants, will the film formation be suppressed
and corrosion minimized.
Figure 1: Relationship between relative humidity and rate of corrosion.

Figure 2: Effects of RH% on water droplet formation on substrate to complete an electrchemical
cell to initiate corrosion reations.
Vapor phase corrosion inhibitors (VPCI-337) are an alternative protection method that is both
effective at controlling corrosion and inexpensive. A vapor phase corrosion inhibitor is a volatile
compound and must form a stable bond at the interface of the metal, preventing penetration of
corrosive species [12-17]. VPCI-337 offers an alternative way to protect stored equipment,
facilities and their contents. These inhibitors are easy to apply, versatile and can be used to protect
multiple metal types in a variety of industries. The VPCI-337 substance (whether applied to paper,
film or foam supports, in a powder, spray or oil formulation) transforms to a gas phase and deposits
a film onto the metal surfaces. This transformation is independent of temperature or humidity
levels. These materials have stable passivating properties, strong tendencies toward surface
adsorption (stronger than the water molecules), and the ability to form a comparatively strong and
stable bond with the metal surface [18-19]. Compared to other methods of corrosion prevention
such as nitrogen gas blanketing and dehumidification systems, inhibitors (VPCI-337) provide
substantially better corrosion control at lower cost and require very low dosage rate. Controlled
humidity protection in combination with VPCI-337 injection has recently been used to control the
corrosion in main cables on suspension bridges, where traditional methods have been unable to
adequately protect [3]. The inhibitors are water-based and ideal for equipment with complex
geometries such as boilers, heat recovery steam generators and pressure vessels, for mothballing,
and short term storage applications. This method can also minimize corrosion attacks where there
are restricted geometries, notches, crevices, under deposits and laps. VPCI-337 forms a solution in
water and when applied by spraying or dipping, will protect ferrous and nonferrous metals,
including castings, tubular parts, finished parts, gears, pumps, housings, structural steel, sintered
metals, bars and roll stock. VPCI-337 has excellent wetting properties and forms a clear, dry,

hydrophobic film (Figure 3) of roughly 6.35 micron thick on the surface that is stable up to 176°C
[12].
Adsorption of the inhibitor on to the metal surface provides a protective inhibitor layer. As well,
the vapor phase action protects surfaces that have not been directly coated and are difficult to
reach. This type of corrosion inhibitor is useful when oil, grease or other adherent films are not
practical. The inhibitor is transmitted by vapor that is controlled by the crystal lattice structure and
atomic bond characteristics of the molecule [15-16]. The protective vapor expands within the
enclosed space until the equilibrium determined by its partial pressure is reached; the higher the
vapor pressure, the sooner the saturation. The VPCI-337 organic chemistry is free of hazardous
amines, nitrites and phosphate ester. There are no hazardous decomposition products. Furthermore,
it is biodegradable and non-flammable unlike some of the earlier chemicals tested in the 1940s and
1950s like dicyclohexyl ammonium nitrite, ammonium nitrite, urea, and acetamide [20].
The corrosion inhibition mechanism was determined to be the physical adsorption of inhibitor
molecules to the metal surfaces [21-22]. Physical adsorption requires energy between -5 and -20
kJ/mol [14-15]. The analysis of the inhibitor showed an enthalpy of adsorption in the range of -14
to -18 kJ/mol [20-21]. Generally, chemisorption requires more energy and results in stronger
bonding between the molecules and the surface of the substrate which forms a more stable
protective film [18]. The majority of corrosion damage to turbo-machinery systems, however,
occurs during the shutdown period due to chemistry changes and stagnant condition in localized
areas. Therefore, a corrosion inhibitor with strong physical adsorption to the metal surface will
provide satisfactory protection and does not require strong chemical bonding.
Figure 3: VCI uses compounds that work by forming a monomolecular film between the metal
and the water. In film forming inhibitors, one end of the molecule is hydrophilic and the other
hydrophobic.
The corrosion inhibition mechanism was determined to be the physical adsorption of inhibitor
molecules to the metal surfaces [21-22]. Physical adsorption requires energy between -5 and -20
kJ/mol [14-15]. The analysis of the inhibitor showed an enthalpy of adsorption in the range of -14
to -18 kJ/mol [20-21]. Generally, chemisorption requires more energy and results in stronger
bonding between the molecules and the surface of the substrate which forms a more stable
protective film [18]. The majority of corrosion damage to turbo-machinery systems, however,
occurs during the shutdown period due to chemistry changes and stagnant condition in localized
areas. Therefore, a corrosion inhibitor with strong physical adsorption to the metal surface will
provide satisfactory protection and does not require strong chemical bonding.
Materials and Methodology
Corrosion behavior of carbon steel and galvanized steel samples were studied in two different
controlled humidity protection conditions; the first environment contained 200 ppm chloride
solution + 10% inhibitor (VPCI-337), the second test environment included 200 ppm chloride
solution (injected into the environment every 48 hours) with a constant flow of dry air at less than
40% RH and 20 psi applied pressure. The corrosion rate of the exposed samples were monitored
for more than six months (roughly 4,500 hours) using electrical resistance (ER) probe techniques.
Relative humidity and the temperature of each test chamber were monitored by (Sensirion) sensors
and data logging software. The temperature sensor and the humidity sensor form a single unit that
enables an accurate and precise determination of the dew point, without incurring errors due to
temperature gradients between the humidity and the temperature sensors. The sensor elements are
integrated with a signal amplifier unit, an analog-to-digital converter and a calibration data
memory, yet the device is only a few square millimeters in size.
Electrochemical polarization standards per ASTM-G61 [23] and corrosion rate measurements
from electrical resistance (ER) techniques were used to evaluate the behavior of this inhibitor on
the steel alloy in 200 ppm chloride solution and to compare with a dry air system. A Metal Samples
MS3500E electrical resistance probe system with a remote data logger was used to collect and
store corrosion data. Further experiments were conducted using Gamry PC4/750 Potentiostat
/Galvanostat/ZRA instrumentation and DC105 corrosion test software. Samples were polished
(600 grit), placed in a flat cell and tested in deionized water solutions containing 200 ppm Cl- and
10% VPCI-337 inhibitor.
The corrosion test setup for the metal samples is shown in Figures 4-9. In each case, the ER probes
were installed in the chamber. The electrical resistance probe equipment measured the corrosion
rate for a UNS G10200 steel probe using 10%VPCI-337 and another probe for the dry air system.
The corrosion rate for the samples was monitored continuously for 4,464 hours (roughly 6
months). Samples were visually inspected on a daily basis, and their surface conditions were

documented on a monthly basis. SEM/EDAX analysis was conducted using a JEOL JSM-6480LV
and Thermo System Seven detector.
Figure 4: Test chambers for the controlled humidity evaluation of UNS G102000 carbon steel and
galvanized steel samples. Both chambers were controlled with dry air at 20 psi applied pressure.
One ER probe was protected with 10%VPCI-337.
Figure 5: Test chambers for the controlled humidity evaluation of UNS G102000 carbon steel and
galvanized steel samples. Corrosion rate was monitored using Metal Sample ER probes.

Figure 6: Test chambers for the controlled humidity evaluation of UNS G102000 carbon steel and
galvanized steel samples. Both chambers were controlled with dry air at 20 psi applied pressure.
Figure 7: Test chambers for the controlled humidity evaluation of UNS G102000 carbon steel and
galvanized steel samples. Both chambers were controlled with dry air at 20 psi applied pressure.
Relative humidity was maintained below 40% during test.

Figure 8: Test chambers for the controlled humidity evaluation of UNS G102000 carbon steel and
galvanized steel samples at Day 64. Both chambers were controlled with dry air at 20 psi applied
pressure. Relative humidity was maintained below 40% during test.

Figure 9: Test chambers for the controlled humidity evaluation of UNS G102000 carbon steel and
galvanized steel samples at Day 155. Both chambers were controlled with dry air at 20 psi applied
pressure. Relative humidity was maintained below 40% during test.
Results
Cyclic Polarization Behavior
Figure 10 shows the polarization behavior for UNS G10200 steel in 10% inhibitor (VPCI-337)
with 200 ppm chloride ions. The most noticeable changes are the positive shift in the breakdown
potential and expansion of the passive range for these alloys in the VPCI-337. The inhibitor
changed the reactivity by reducing the pH level, increased the passivation range significantly, and
was beneficial in reducing localized corrosion damages. As demonstrated in these polarization
curves, extension of the passive zone contributes to the stability of the protective oxide film over
a wider electrochemical range, resulting in a more stable passive film, and shift of the critical
pitting potential to higher levels.

Figure 10: Cyclic polarization for UNS G10200 steel and galvanized steel samples in standard
environment (200 ppm chloride ion solution and dry air system). The corrosion behavior was
compared when 10% VPCI-337 was added to the standard environment.
Figure 11: ER probes after 64 and 186 days exposure; the probes in Dry air + VpCI 337 showed
no sign of any corrosion, while Dry air exposed probes showed corrosion increasing trends.
1.00E-09
1.00E-08
1.00E-07
1.00E-06
1.00E-05
1.00E-04
1.00E-03
-1.500 -1.000 -0.500 0.000 0.500 1.000 1.500
Cu
rre
nt
De
nsi
ty,
A/c
m2
Potential, Vsce
galvanized steel in 200 ppm Cl-galvanized steel in VCI solutionUNS G10200 Steel 200ppm Cl-UNS G10200 Steel VCI solution
Dry air + 200 ppm Cl- Day 186
Dry air+ VpCI337 + 200 ppm Cl-
Dry air+ VpCI337 + 200 ppm Cl-
Day 64 Dry air + 200 ppm Cl-

Figure 11 shows the ER probes after 64 and 186 days exposure in both environments. The ER
probe protected by 10% VpCI 337 shows no corrosion damage. Corrosion rates for probes during
entire testing can be seen in Figure 12. The results show that the dry air system is unable to protect
the steel against corrosion. Figures 13-22 show the progression of corrosion damage to the metal
surface over time.
Figure 12: Comparison of corrosion on steel probes in VPCI-337 and dry air protection system.
There is a much lower corrosion rate for steel samples protected by VPCI-337 (average corrosion
rate of 0.04 - 0.08 mpy), while the dry air system resulted in increasing attack with corrosion rate
as high as 1.6 mpy.
Figure 13: UNS G10200 steel samples and galvanized steel samples in dry air for 28 days. Steel
samples showed red rust formation and white rust formation (galvanized samples) after 28 days.
0.000
0.200
0.400
0.600
0.800
1.000
1.200
1.400
1.600
1.800
0 500 1000 1500 2000 2500 3000 3500
Co
rro
sio
n R
ate
, mp
y
Exposure Time, hours
Corrosion Behavior of Carbon Steel ER Probes in Dry Air (RH<38%)
Dry air, VCI 337 + 200ppm Cl-
Dry Air, 200 ppm Cl-

Figure 14: UNS G10200 steel samples and galvanized steel samples in dry air + 10% VpCI-337
addition for 28 days. None of the exposed samples showed any corrosion after 28 days.
Figure 15: Comparison of VpCI-337 and Dry Air, 200 ppm Cl-, 20 psi, 34 RH%, after 28 days of
exposures.

Figure 16: Comparison of UNS G10200 steel samples protected with VpCI-337 inhibitor (left)
and steel samples in dry air (right) for 64 days. Severe corrosion attacks were observed on the Dry
Air samples.
Figure 17: Comparison of UNS G10200 steel samples protected with inhibitor (left) and steel
samples in dry air (right) for 96 days.
Dry Air Dry Air+10%VpCI 337

Figure 18: Comparison of UNS G10200 steel samples after 155 days: (left) inhibitor still protects
metal surface; (right) samples have significant corrosion when using dry air protection method.
a) b)
Figure 19: Comparison of galvanized steel samples in dry air and VpCI-337 after 155 days; a)
white rust formation is seen on dry air samples, while b)VPCI-337 exposed samples were corrosion
free.
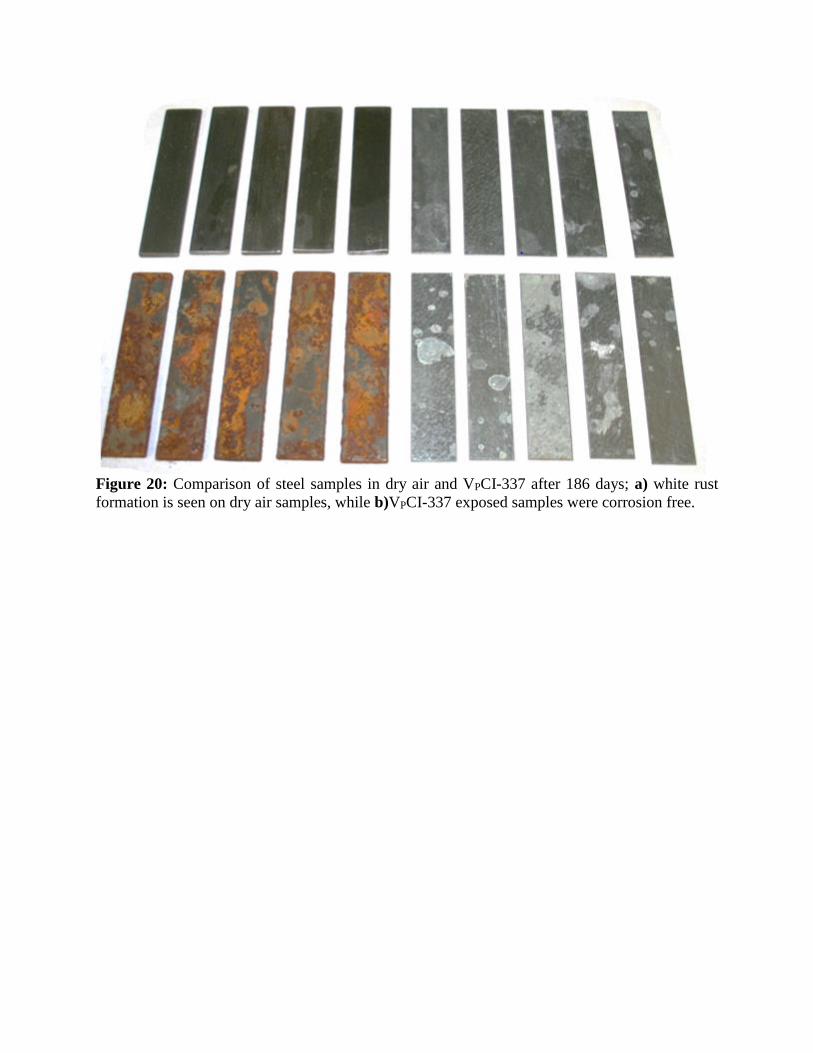
Figure 20: Comparison of steel samples in dry air and VPCI-337 after 186 days; a) white rust
formation is seen on dry air samples, while b)VPCI-337 exposed samples were corrosion free.
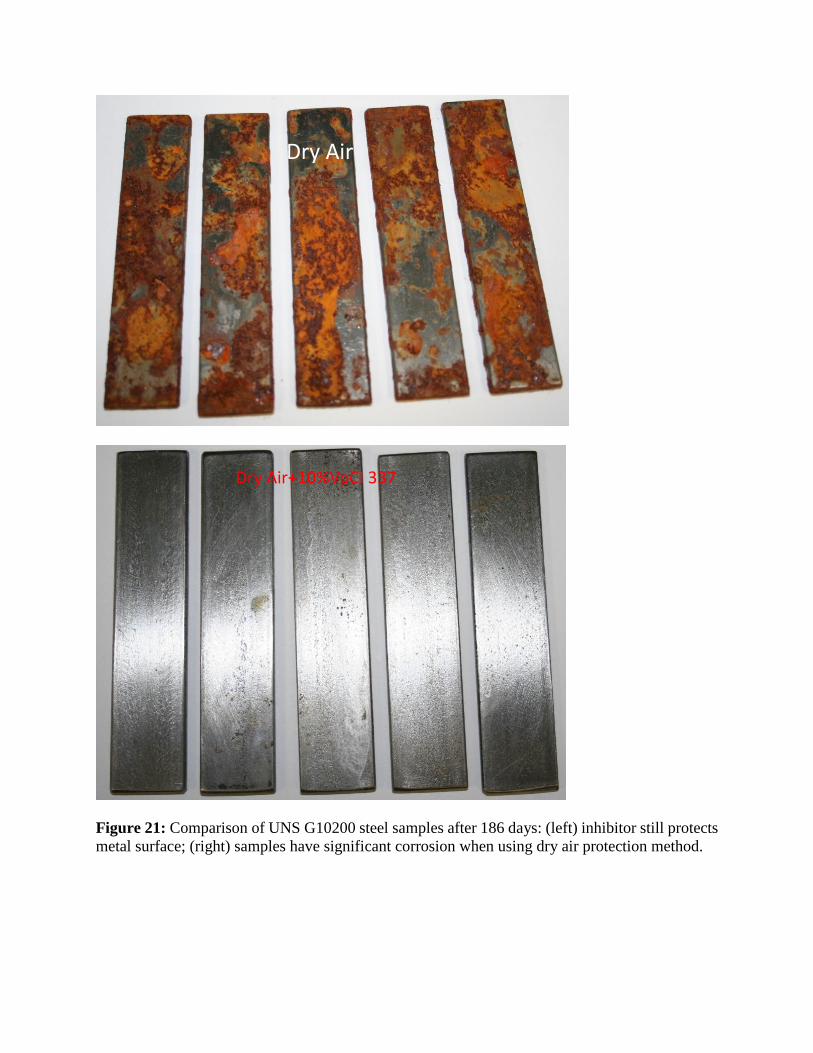
Figure 21: Comparison of UNS G10200 steel samples after 186 days: (left) inhibitor still protects
metal surface; (right) samples have significant corrosion when using dry air protection method.
Dry Air+10%VpCI 337
Dry Air

Figure 22: Comparison of galvanized steel samples in dry air and VPCI-337 after 186 days; a)
white rust formation is seen on dry air samples, while b)VPCI-337 exposed samples were corrosion
free.
Figures 23-25 show the SEM/EDAX analysis for the steel samples. The dry air system showed
severe corrosion products (chloride rich) while the presence of inhibitor suppressed the formation
of corrosion products on the steel surface. Similar results were observed for the galvanized steel
samples exposed to dry air only and dry air with inhibitor. The morphology of the corrosion
Dry Air
Dry Air+10%VpCI 337
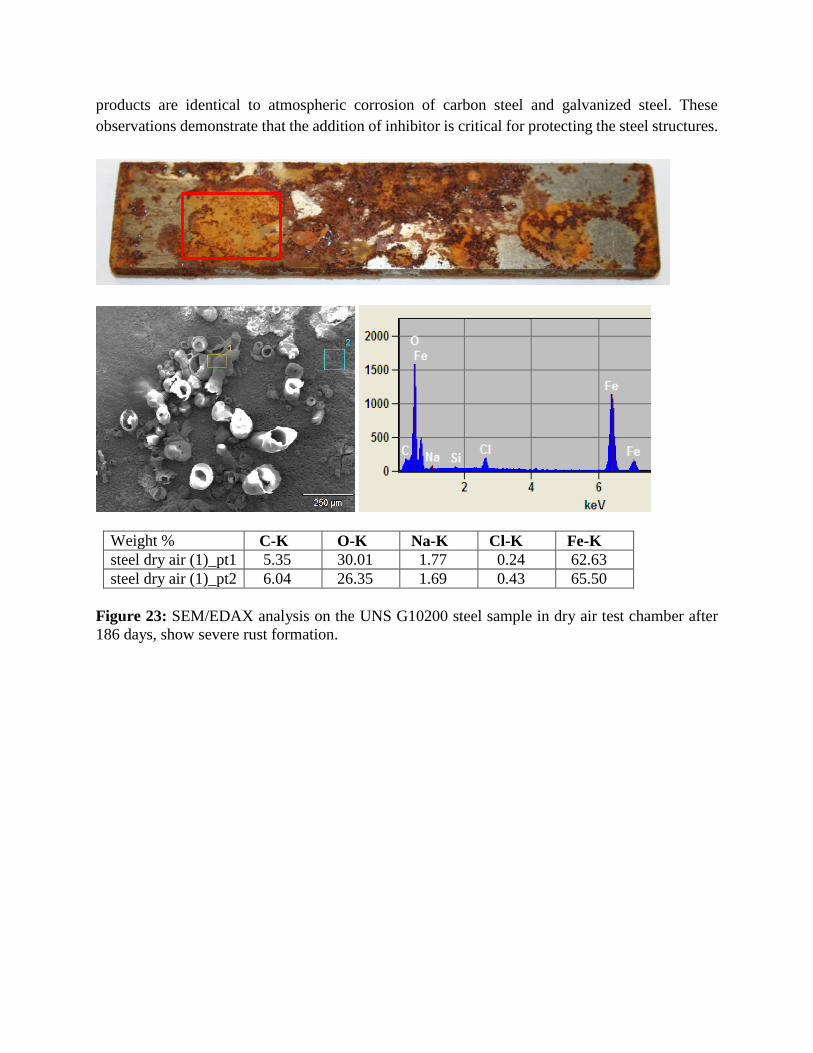
products are identical to atmospheric corrosion of carbon steel and galvanized steel. These
observations demonstrate that the addition of inhibitor is critical for protecting the steel structures.
Weight % C-K O-K Na-K Cl-K Fe-K
steel dry air (1)_pt1 5.35 30.01 1.77 0.24 62.63
steel dry air (1)_pt2 6.04 26.35 1.69 0.43 65.50
Figure 23: SEM/EDAX analysis on the UNS G10200 steel sample in dry air test chamber after
186 days, show severe rust formation.

Weight % C-K Si-K Mn-K Fe-K
steel dry VpCI-337 _pt1 4.40 0.40 0.57 94.63
Figure 24: SEM/EDAX analysis on the steel sample in dry air + VPCI-337 test chamber after 186
days, showing a corrosion free surface.
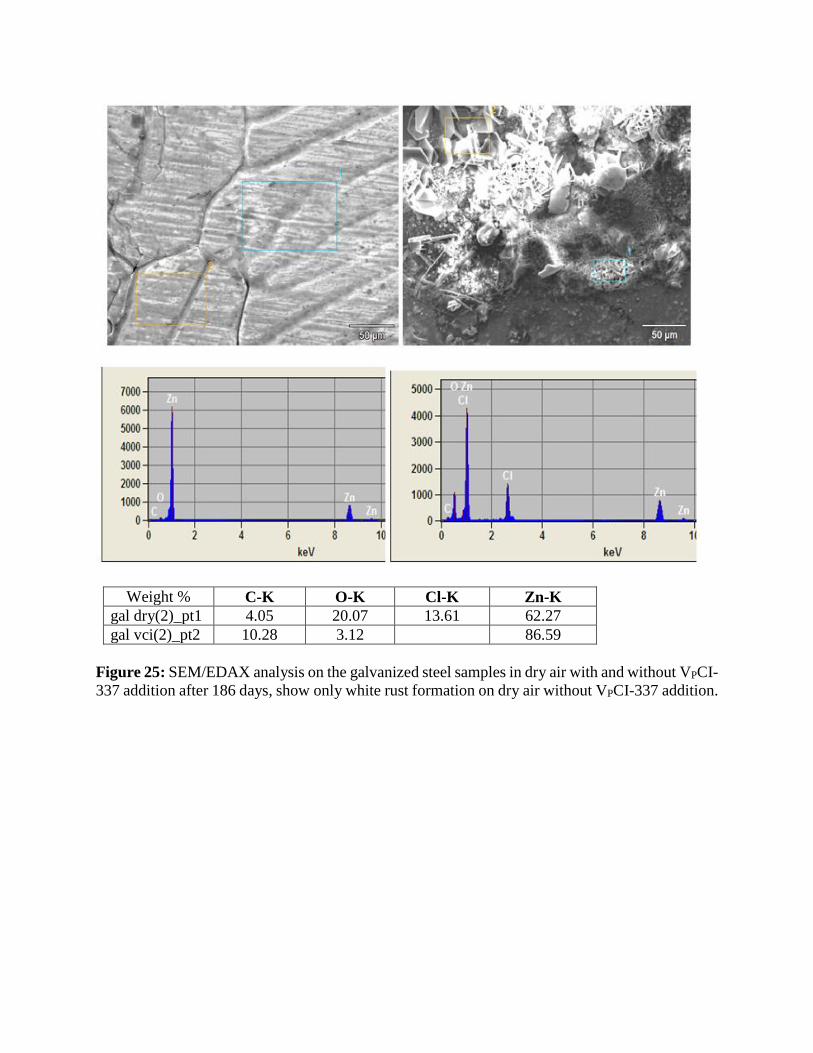
Weight % C-K O-K Cl-K Zn-K
gal dry(2)_pt1 4.05 20.07 13.61 62.27
gal vci(2)_pt2 10.28 3.12 86.59
Figure 25: SEM/EDAX analysis on the galvanized steel samples in dry air with and without VPCI-
337 addition after 186 days, show only white rust formation on dry air without VPCI-337 addition.

Figure 26: Langmuir adsorption isotherm shows the relationship between surface coverage and
temperature for VCI inhibitor on the surface of steel. Adsorption energy for the VCI inhibitor
was roughly -10 to -14 kJ/mol indicating a strong physical adsorption to the metal surface.
Conclusions
The corrosion test results have demonstrated that corrosion inhibitors have superior advantages
over the dry air system. Dry air samples showed corrosion attack and red rust formation after 21
days of exposure. ER probes showed a corrosion rate of 0.04-0.08 mpy (0.001-0.002 mm/yr) for
VPCI-337 treatment, while the dry air samples showed a 1.3-1.6 mpy (0.03- 0.04 mm/yr) corrosion
rate and ER probes were heavily corroded. Dry air samples showed an increasing corrosion trend,
indicating inability of controlled humidity protection to slow corrosion once the reaction had
begun.
Electrochemical polarization behavior showed the addition of VPCI-337 to the environment
expands the passive film stable region. The passive film breakdown potential for VPCI-337 treated
steel samples increased by nearly 1.0 volt, indicating less susceptibility to localized corrosion.
In summary, the vapor phase corrosion inhibitors provide effective corrosion protection for steel
materials exposed to the environment during short term storage. Although, controlled humidity
protection systems, in theory, can suppress the cathodic reaction and lower the corrosion rate, in
3
3.5
4
4.5
5
5.5
6
6.5
7
0.00315 0.0032 0.00325 0.0033 0.00335 0.0034 0.00345
Surf
ace
Co
vera
ge,
1/Temperture, K
Adsorption Mechanism for VpCI 337 Corrosion Inhibitor
Test 1
Test 2

reality, the amount of moisture and oxygen that is required to initiate the corrosion reaction for
steel is extremely low. A dry air controlled humidity system can reduce the moisture level, but it
will not be able to prevent corrosion and the steel will corrode. Furthermore, once corrosion begins,
the dry air system cannot impede the accelerating corrosion reaction. The advantage of the VPCI-
337 inhibitor is the creation of a strong physisorption (Figure 26) to the steel surface that minimizes
any surface contact with corrosive species due to its hydrophobic film. Therefore, vapor phase
corrosion inhibitors have superior advantages over the dry air or gas blanketing system in the
presence of aggressive environments that contain excessive salt, oxygen and moisture.
References
[1] T. Eguchi and T. Matusoka, Development of Corrosion Protection, Methods Using S-Shaped
Wire Wrapping System, Nippon Steel Technical Report No. 82, July 2000.
[2] M. L. Bloomstine, O. Sørensen, Prevention of Main Cable Corrosion by Dehumidification,
Modern Techniques in Bridge Engineering: Proceedings of 6th New York City, edited by Khaled
Mahmoud, CRC Press.
[3] J. Fisher and P. Lambert, Severn Bridge Cables Corrosion Models, Use of Inhibitors and their
Impact on the Cable Assessment, 8th International Cable Supported Bridge Operators Conference,
Edinburgh, June 2013.
[4] Research Opportunities in Corrosion Science and Engineering, Committee on Research
Opportunities in Corrosion Science and Engineering; National Research Council, 2011, National
Academies Press (US).
[5] M. Tullmin and P.R. Roberge, Chapter 18: Atmospheric Corrosion, Uhlig's Corrosion
Handbook, 2nd Ed., John Wiley & Sons, March 2000, pp. 305-321.
[6] D. Jones, Principles and Prevention of Corrosion (2nd Edition), Prentice Hall, Inc, 1996.
[7] G. Koch, M. Brongers, N. Thompson, P. Virmani, J. Payer, Corrosion Costs and Preventive
Strategies in the United States, CC Technologies Laboratories, Inc, Federal Highway
Administration (2001). Publication No. FHWA-RD-01-156.
[8] Department of Defense, Corrosion Prevention and Mitigation Strategic Plan, Corrosion
Policy and Oversight Office, February 2011.
[9] A. Timko, O. R. Thompson, Controlled Humidity Protection, Modifying the Environment to
Fight Corrosion, AMPTIAC Quarterly, Vol 7, No 4, 2003.
[10] L. Miskovic and T. Madzar, Environmentally Friendly Protection Methods Used by the
Armed Forces of the Republic of Croatia, Corrosion 2002, NACE paper 02324.
[11] J. R. Davis, editor, Corrosion: Understanding the Basics, Chapter 5, Atmospheric Corrosion,
ASM International, 2000.
[12] J. Holden, A. Hansen, A. Furman, R. Kharshan and E. Austin, Vapor Corrosion inhibitors in
Hydro-testing and Long Term Storage Applications, CORROSION/2010, paper # 10405, NACE
International, Houston, TX., 2010.
[13] M. Kharshan, and C. Cracauer, Applications for Biodegradable Vapor Phase Corrosion
Inhibitors, MP, NACE International March 2011.

[14] A. Furman, M. Kharshan, Methodology of 337 VPCIs for Water Treatment,
CORROSION/97, paper no. 182, NACE International, Houston, TX, 1997.
[15] B. A. Miksic, R. H. Miller, Fundamental Principals of Corrosion Protection with Vapor Phase
Inhibitors, 5th European Symposium on Corrosion Inhibitors, Italy, 1980.
[16] C. G. Moore, B.A. Miksic, Vapor Corrosion Inhibitors, CORROSION/95, paper no. 490,
NACE International, Houston, TX, 1995.
[17] C. Kraemer, A Procedure for Testing the Effect of Vapor Phase Corrosion Inhibitors on
Combined Multi Metals, paper no. 178, NACE International, Houston, TX, 1997.
[18] M. Lagrenée, B. Mernari, M. Bouanis, M. Traisnel and F. Bentiss, Study of the mechanism
and inhibiting efficiency of 3,5-bis(4-methylthiophenyl)-4H-1,2,4-triazole on mild steel corrosion
in acidic media, Corrosion Science, Vol 44, Issue 3, March 2002.
[19] F. Bentiss, B. Mernari, M. Traisnel, H. Vezin and M. Lagrenée, On the relationship between
corrosion inhibiting effect and molecular structure of 2,5-bis(n-pyridyl)-1,3,4-thiadiazole
derivatives in acidic media: AC Impedance and DFT studies, Corrosion Science 53 (2011).
[20] G. E. Fodor, The Inhibition of Vapor-Phase Corrosion: A Review, Interim Report BFLRF
No. 209, Belvoir Fuels and Lubricants Research Facility, SWRI 1985.
[21] B. Bavarian, L. Reiner and H. Youssefpour, Vapor Phase Inhibitors to Extend the Life of
Aging Aircraft, NACE Corrosion 2005, paper # 05329.
[22] B. Bavarian, J. Zhang and L. Reiner, SCC and Crevice Corrosion Inhibition of Steam
Turbines ASTM A470 and AA7050 Al-alloys using 337 VPCI, NACE Corrosion 2012
Conference, March 2012.
[23] ASTM G61, “Standard Test Method for Conducting Cyclic Potentiodynamic Polarization
Measurements for Localized Corrosion Susceptibility of Iron-, Nickel-, or Cobalt-Based Alloys”
(West Conshohocken, PA: ASTM).

Appendix A: SEM/EDAX analysis on test samples after 186 days of corrosion tests
Figure 27: SEM micrographs of the UNS G10200 steel sample in dry air test chamber after 186
days, show severe rust formation.

Figure 28: SEM micrographs of the UNS G10200 steel sample in dry air test chamber after 186
days, show severe rust formation.

Figure 29: SEM micrographs of the UNS G10200 steel sample in dry air test chamber after 186
days, show severe rust formation.

Figure 30: SEM micrographs of the steel sample in dry air + VPCI-337 test chamber after 186
days, showing a corrosion free surface.

Figure 31: SEM micrographs of the steel sample in dry air + VPCI-337 test chamber after 186
days, showing a corrosion free surface.

Figure 32: SEM micrographs of the galvanized steel samples in dry air without VPCI-337 addition
after 186 days, show only white rust formation on dry air without VPCI-337 addition.

Figure 33: SEM micrographs of the galvanized steel samples in dry air without VPCI-337 addition
after 186 days, show only white rust formation on dry air without VPCI-337 addition.
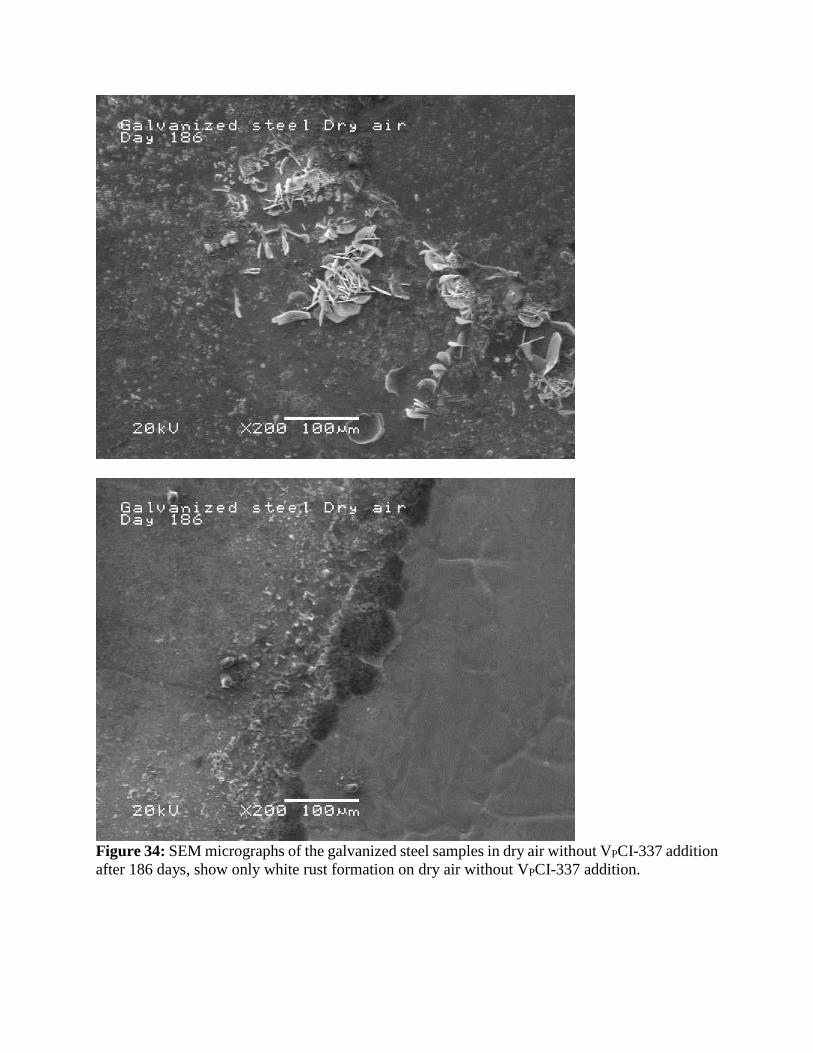
Figure 34: SEM micrographs of the galvanized steel samples in dry air without VPCI-337 addition
after 186 days, show only white rust formation on dry air without VPCI-337 addition.

Figure 35: SEM micrographs of the galvanized steel samples in dry air with VPCI-337 addition
after 186 days, show clean surface.

Figure 36: SEM micrographs of the galvanized steel samples in dry air with VPCI-337 addition
after 186 days, show clean surface.

Figure 37: SEM micrographs of the galvanized steel samples in dry air with VPCI-337 addition
after 186 days, show clean surface.

Weight %
C-K O-K Mg-K Si-K S-K Cl-K Mn-K Zn-K
gal dry(1)_pt1 15.22 22.27 5.66 0.75 0.49 1.34 0.12 54.15
gal dry(1)_pt2 5.14 3.21 0.41 91.23
Figure 38a: SEM/EDAX analysis on the galvanized steel samples in dry air without VPCI-337
addition after 186 days, show white rust formation on sample surfaces.

Figure 38b: SEM/EDAX analysis on the galvanized steel samples in dry air without VPCI-337
addition after 186 days, show white rust formation on sample surfaces.

Weight %
C-K O-K Cl-K Zn-K
gal dry(2)_pt1 4.05 20.07 13.61 62.27
gal dry(2)_pt2 4.34 18.92 10.86 65.88
Figure 39a: SEM/EDAX analysis on the galvanized steel samples in dry air without VPCI-337
addition after 186 days, show white rust formation on sample surfaces.

Figure 39b: SEM/EDAX analysis on the galvanized steel samples in dry air without VPCI-337
addition after 186 days, show white rust formation on sample surfaces.
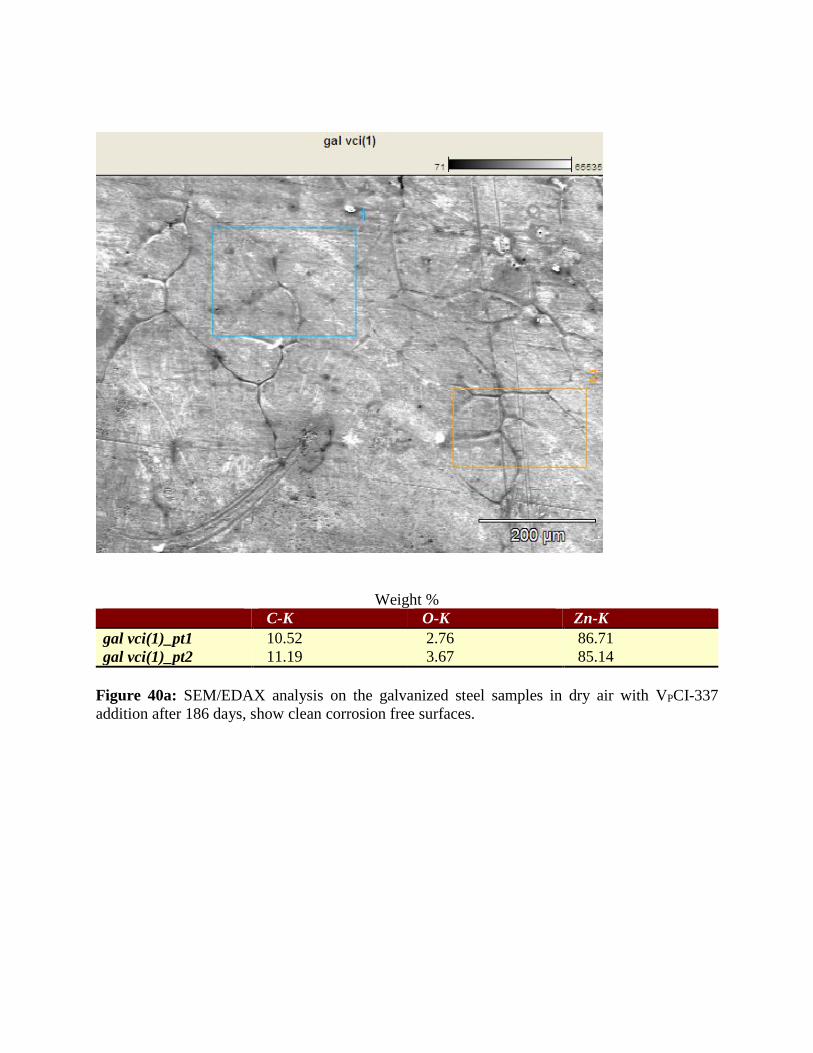
Weight %
C-K O-K Zn-K
gal vci(1)_pt1 10.52 2.76 86.71
gal vci(1)_pt2 11.19 3.67 85.14
Figure 40a: SEM/EDAX analysis on the galvanized steel samples in dry air with VPCI-337
addition after 186 days, show clean corrosion free surfaces.

Figure 40b: SEM/EDAX analysis on the galvanized steel samples in dry air with VPCI-337
addition after 186 days, show clean corrosion free surfaces.

Weight %
C-K O-K Zn-K
gal vci(2)_pt1 10.28 3.12 86.59
gal vci(2)_pt2 10.73 2.78 86.49
Figure 41a: SEM/EDAX analysis on the galvanized steel samples in dry air with VPCI-337
addition after 186 days, show clean corrosion free surfaces.

Figure 41b: SEM/EDAX analysis on the galvanized steel samples in dry air with VPCI-337
addition after 186 days, show clean corrosion free surfaces.

Weight %
C-K O-K Cl-K Zn-K
gal vci(3)_pt1 16.11 8.04 1.68 74.17
gal vci(3)_pt2 7.89 2.74 89.37
Figure 42a: SEM/EDAX analysis on the galvanized steel samples in dry air with VPCI-337
addition after 186 days, show clean corrosion free surfaces.

Figure 42b: SEM/EDAX analysis on the galvanized steel samples in dry air with VPCI-337
addition after 186 days, show clean corrosion free surfaces.

Weight %
C-K O-K Na-K Cl-K Fe-K
steel dry (1)_pt1 5.35 30.01 1.77 0.24 62.63
steel dry (1)_pt2 6.04 26.35 1.69 0.43 65.50
Figure 43a: SEM/EDAX analysis on the UNS G10200 steel sample in dry air test chamber after
186 days, show severe rust formation.
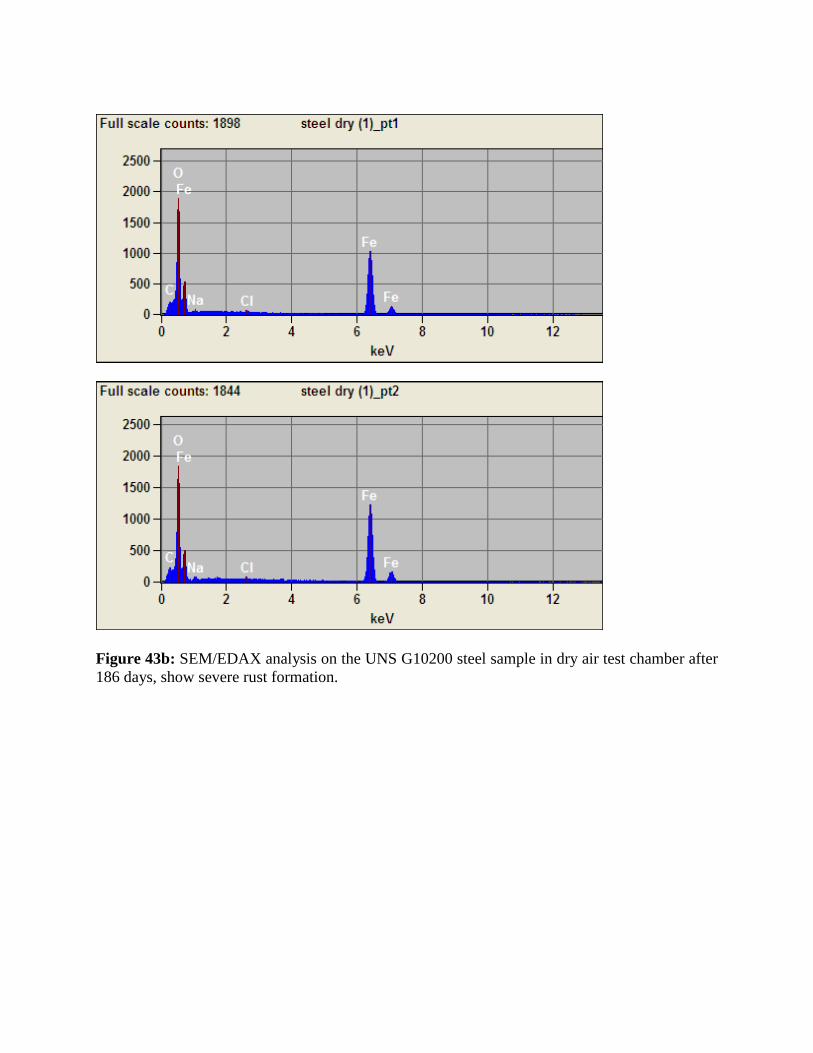
Figure 43b: SEM/EDAX analysis on the UNS G10200 steel sample in dry air test chamber after
186 days, show severe rust formation.

Weight %
C-K O-K Na-K Si-K Cl-K Fe-K
steel dry (2)_pt1 4.04 25.05 1.58 0.34 2.69 66.30
steel dry (2)_pt2 7.19 26.74 2.64 0.71 62.72
Figure 44a: SEM/EDAX analysis on the UNS G10200 steel sample in dry air test chamber after
186 days, show severe rust formation.
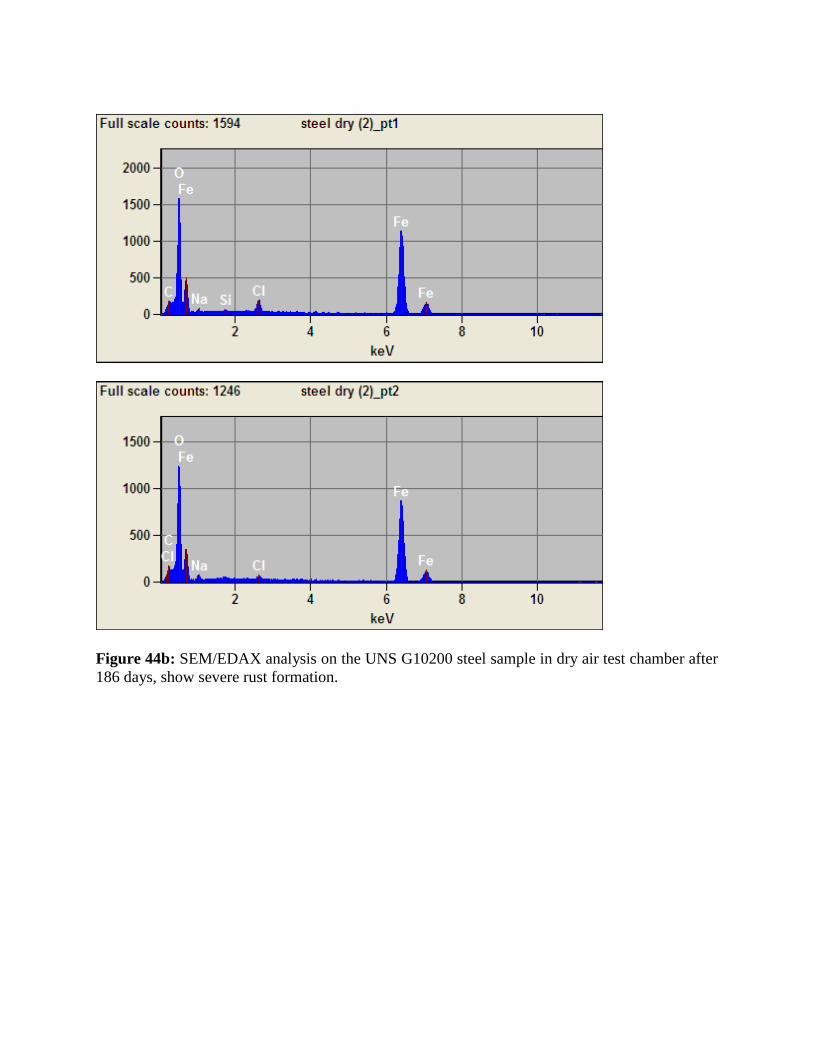
Figure 44b: SEM/EDAX analysis on the UNS G10200 steel sample in dry air test chamber after
186 days, show severe rust formation.

Weight %
C-K Si-K Mn-K Fe-K
steel dry vci(1)_pt1 4.40 0.40 0.57 94.63
Figure 45: SEM/EDAX analysis on the UNS G10200 steel sample in dry air with VPCI-337
addition after 186 days, show clean corrosion free surfaces.

Weight %
C-K O-K Si-K Mn-K Fe-K
steel dry vci(2)_pt1 5.34 0.56 0.54 93.55
steel dry vci(2)_pt2 10.42 8.68 0.81 0.38 79.71
Figure 46a: SEM/EDAX analysis on the UNS G10200 steel sample in dry air with VPCI-337
addition after 186 days, show clean corrosion free surfaces.

Figure 46b: SEM/EDAX analysis on the UNS G10200 steel sample in dry air with VPCI-337
addition after 186 days, show clean corrosion free surfaces.

Weight %
C-K O-K Si-K Mn-K Fe-K Ni-K
steel dry vci(3)_pt1 3.76 0.55 0.62 95.08
steel dry vci(3)_pt2 11.13 10.57 0.74 0.63 75.95 0.99
Figure 47a: SEM/EDAX analysis on the UNS G10200 steel sample in dry air with VPCI-337
addition after 186 days, show clean corrosion free surfaces.

Figure 47b: SEM/EDAX analysis on the UNS G10200 steel sample in dry air with VPCI-337
addition after 186 days, show clean corrosion free surfaces.

Weight %
C-K O-K Si-K Cl-K Mn-K Fe-K
steel dry vci(4)_pt1 13.37 21.15 0.59 0.51 0.61 63.77
steel dry vci(4)_pt2 6.69 0.80 0.42 92.09
Atom %
C-K O-K Si-K Cl-K Mn-K Fe-K
steel dry vci(4)_pt1 30.71 36.48 0.58 0.39 0.31 31.52
steel dry vci(4)_pt2 24.85 1.27 0.34 73.55
Figure 48a: SEM/EDAX analysis on the UNS G10200 steel sample in dry air with VPCI-337
addition after 186 days, show clean corrosion free surfaces.

Figure 48b: SEM/EDAX analysis on the UNS G10200 steel sample in dry air with VPCI-337
addition after 186 days, show clean corrosion free surfaces.