comparison of three t-wave delineation algorithms based on ... · comparison of three t-wave...
TRANSCRIPT
Comparison of three T-Wave Delineation Algorithms based on Wavelet
Filterbank, Correlation and PCA
T Baas1, F Gravenhorst1, R Fischer2, A Khawaja2, O Dossel1
1 Institute of Biomedical Engineering, Karlsruhe Institute of Technology (KIT), Karlsruhe, Germany2 BIOSIGNA - Medical Diagnostics, Munich, Germany
Abstract
There is a large interest in analysing the QT-interval,
as a prolonged QT-interval can cause the development of
ventricular tachyarrhythmias such as Torsade de Pointes.
One major part of QT-analysis is T-end detection. Three
automatic T-end delineation methods based on wavelet fil-
terbanks (WAM), correlation (CORM) and Principal Com-
ponent Analysis PCA (PCAM) have been developed and
applied to Physionet QT database.
All algorithms tested on Physionet QT database showed
good results, while PCAM produced better results than
WAM and CORM achieved best results. Standard de-
viation in sampling points (fs=250Hz) have been 33.3
(WAM), 8.0 (PTDM) and 7.8 (CORM). It could be shown
that WAM is prone to interference while CORM is the
most stable method even under bad conditions. Further-
more it was possible to detect significant QT-prolongation
caused by Moxifloxacin in Thorough QT Study # 2 us-
ing CORM. QT-prolongation is significantly correlated to
blood plasma concentration of Moxifloxacin.
1. Introduction
QT-prolongation can cause the development of ventric-
ular tachyarrhytmias such as Torsade de Pointes (TdP) and
ventricular fibrillation often leading to cardiac death. QT-
prolongation and TdP has been identified as a side effect of
many commonly used medications [1]. Thus QT-analysis
play a major role for pharmaceutical industries on their
way to developing new drugs.
ICH E14 is a set of guidelines for clinical evaluation of
QT/QTc interval prolongation and proarrhythmic potential
for nonarrhythmic drugs [2]. The guidelines endorse man-
ual QT measurement for ”thorough QT/QTc studies” and
highlight the need for further research before the use of
fully automated methods can be accepted in these studies
[3].
Automatic delineation of ECG signals is necessary for
Holter ECG analyses. While R-peak delineation can be
done very reliable and the following Q-point detection is
straight forward, the identification of the T-wave bound-
aries is much more complex. A delineation algorithm has
to handle the fact that the amplitude of the T-wave is low
at the wave boundaries and often obscured by noise waves
[4].
ICH E14 requests a further investigation on Tend delin-
eation which was partly done in recent years. A short
overview on important ECG delineation algorithms can be
found in [5]. In 2006, Computers in Cardiology (CinC)
presents the results of a challenge for measuring the QT-
interval [3].
This work presents three different methods for Tend detec-
tion which all are fully automated. Validation is done using
the physionet QT-database [6]. The method which shows
the best result is additionally used to detect drug induced
QT-prolongation in Thorough QT Study # 2 from THEW
[7].
2. Methods
Three delineation methods are introduced. For T-wave
delineation in a first step all algorithms need to detect the
R-peaks. This is achieved by a wavelet based algorithm
introduced in [8].
2.1. Wavelet based method (WAM)
First delineation algorithm evaluated in this study is a
revised version of the wavelet based algorithm presented
in [8]. To delineate the T-wave, a discrete wavelet trans-
formation (DWT) of the original signal using the Haar
wavelet is performed. The decomposition of the ECG sig-
nal into elementary building blocks that are well localized
both in time and frequency, characterize the local regu-
larity of signals [9]. DWT can be done very efficiently
by applying a multi rate filterbank implementation which
computes the approximation coefficients ck(l) and detail
coefficients dk(l) for all k levels recursively.
The approximation coefficients ck(i) and detail coef-
ficients dk(i) are equivalent to cascaded low- and band-
ISSN 0276−6574 361 Computing in Cardiology 2010;37:361−364.
pass filters. As the T-wave is always located between
two R-peaks, the detail coefficients of the corresponding
RR-interval are used to delineate the T-wave. The sam-
ple frequency dependent level kn, corresponding to a fre-
quency range below 15Hz is used. The characteristics
of the T-wave contribute a prominent signal in the detail
coefficients of this level. A positive T-wave generates a
minimum-maximum pair, while a negative one generates
a maximum-minimum pair. To detect the peak values an
amplitude threshold has to be calculated. It is calculated
by the RMS of a sliding window with the length L.
T (n) =
√
√
√
√
1
L+ 1·
n+0.5L∑
i=n−0.5L
d2nlevel(i) (1)
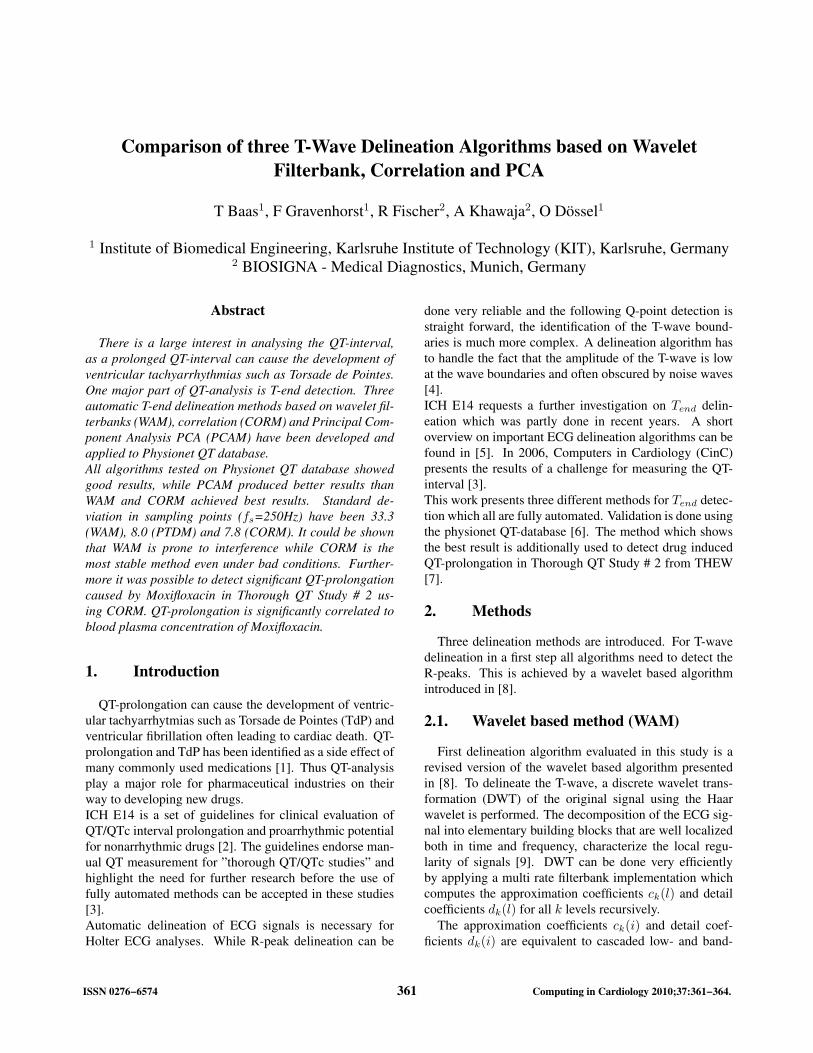
Either way, the second significant extremal to consider is
the one for the Tend detection. In particular, the signal
within the first half of the interval between this extremal
and the subsequent root is extracted. This is visualised in
Figure 1.
c0
0.1 0.15 0.2 0.25 0.3 0.35 0.4 0.45 0.5
d5
Time [s]
Tend
Am
pli
tud
e
Time [s]
Figure 1. Top: original time domain signal, bottom:
wavelet detail coefficients of level five, pink circles: roots,
red dotted lines: RMS threshold, blue cross: second sig-
nificant extreme values, green: least squares line, black
vertical line: Tend.
Subsequently, the coefficients for the straight line of the
form:
f(x) = c1 · x+ c0 (2)
are determined that fit best to the extracted signal inter-
val in a least squares sense. The zero-crossing of this line
is considered as the position of Tend:
Tend = −c0
c1(3)
2.2. Correlation based method (CORM)
The second Tend delineation algorithm compared in this
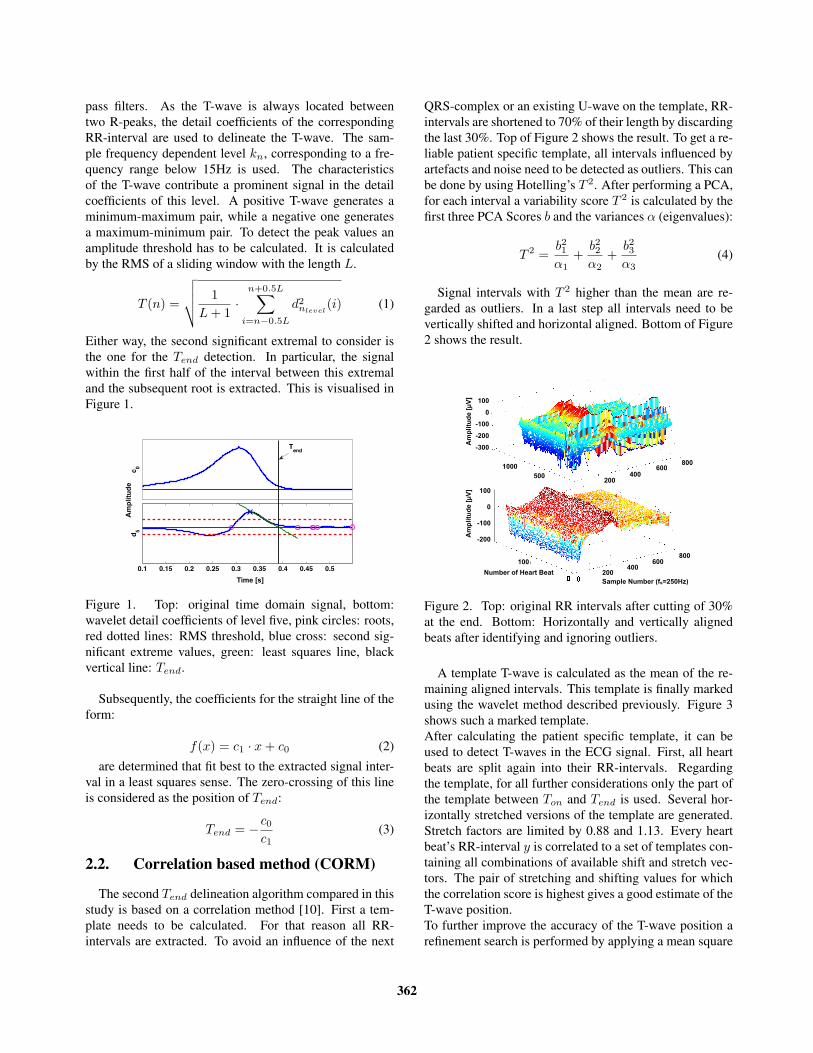
study is based on a correlation method [10]. First a tem-
plate needs to be calculated. For that reason all RR-
intervals are extracted. To avoid an influence of the next
QRS-complex or an existing U-wave on the template, RR-
intervals are shortened to 70% of their length by discarding
the last 30%. Top of Figure 2 shows the result. To get a re-
liable patient specific template, all intervals influenced by
artefacts and noise need to be detected as outliers. This can
be done by using Hotelling’s T 2. After performing a PCA,
for each interval a variability score T 2 is calculated by the
first three PCA Scores b and the variances α (eigenvalues):
T 2 =b21α1
+b22α2
+b23α3
(4)
Signal intervals with T 2 higher than the mean are re-
garded as outliers. In a last step all intervals need to be
vertically shifted and horizontal aligned. Bottom of Figure
2 shows the result.
100
0
-100
-200
-300
100
0
-100
-200
Am
pli
tud
e [µ
V]
Am
pli
tud
e [µ
V]
Number of Heart Beat
Sample Number (fs=250Hz)
100
200400
600800
200
1000
500
800600
400200
Figure 2. Top: original RR intervals after cutting of 30%
at the end. Bottom: Horizontally and vertically aligned
beats after identifying and ignoring outliers.
A template T-wave is calculated as the mean of the re-
maining aligned intervals. This template is finally marked
using the wavelet method described previously. Figure 3
shows such a marked template.
After calculating the patient specific template, it can be
used to detect T-waves in the ECG signal. First, all heart
beats are split again into their RR-intervals. Regarding
the template, for all further considerations only the part of
the template between Ton and Tend is used. Several hor-
izontally stretched versions of the template are generated.
Stretch factors are limited by 0.88 and 1.13. Every heart
beat’s RR-interval y is correlated to a set of templates con-
taining all combinations of available shift and stretch vec-
tors. The pair of stretching and shifting values for which
the correlation score is highest gives a good estimate of the
T-wave position.
To further improve the accuracy of the T-wave position a
refinement search is performed by applying a mean square
362

error (MSE) optimization. Keeping in mind, that the
falling edge of the T-wave is most important, this part of
the template gets a higher weight in MSE. The MSE score
is calculated for scaled and shifted templates ts,k in a small
range around the correlations estimation position:
MSE(s, k) =1
N
N∑
i=1
wN (i) · [y(i)− ts,k(i)]2
(5)
Due to its sensitivity to noise, changes of the shift and scale
vectors by the MSE optimization are limited. The pair
of stretching and shifting values (sbest,kbest) for which
MSE(s, k) is lowest, provides the best T-wave position.
Thus Tend is given by:
Tend = Tend,Template · sbest + kbest (6)
! ∀!! #!! ∃!! %!!(#!!
(∀!!
!
∀!!
&∋()∗+(,−
.(/0∋123)∗+µ4− Tend
Figure 3. Shortened RR interval with T-wave (red) and
template interval (blue) after correlation and refinement.
2.3. PCA based method (PCAM)
The third algorithm compared in this study is a PCA
based method. This method works similar to the correla-
tion method, but instead of using a correlation for com-
puting the T-wave estimation a PCA is applied. For that
reason, only the PCA based part of the algorithm is de-
scribed.
Similar to the correlation method, sbest and kbest have to
be found. To discover these heart beat dependent values,
two PCAs, one for sbest and one for kbest, have to be car-
ried out.
First a template for every scale factor sx has to be calcu-
lated. Next a PCA is carried out. The PCA transforms the
given data into a new coordinate system. The basis vectors
of the new coordinate system are chosen in a way that they
maximize the scores’ variance. The order is determined
according to the variance. Thus, the first few scores are
supposed to represent the most significant differences be-
tween the observed templates. In this case, these scores are
considered as uniquely indicating the T-wave’s scaling.
All template signals that were extracted as described in
section 2.2, are transformed into the new coordinate sys-
tem. The scale factor of the template having the lowest
distance in the first three dimensions to the heart beats sig-
nal interval represents sbest for that heart beat. Figure 6
shows the representation of the scaled templates in the first
three dimensions of the coordinate system as blue cycles.
A transformed heart beat of the ECG is shown as a green
triangle.
Following the same approach, a coordinate transformation
which results in shift-sensitive coefficients kbest has to be
found.
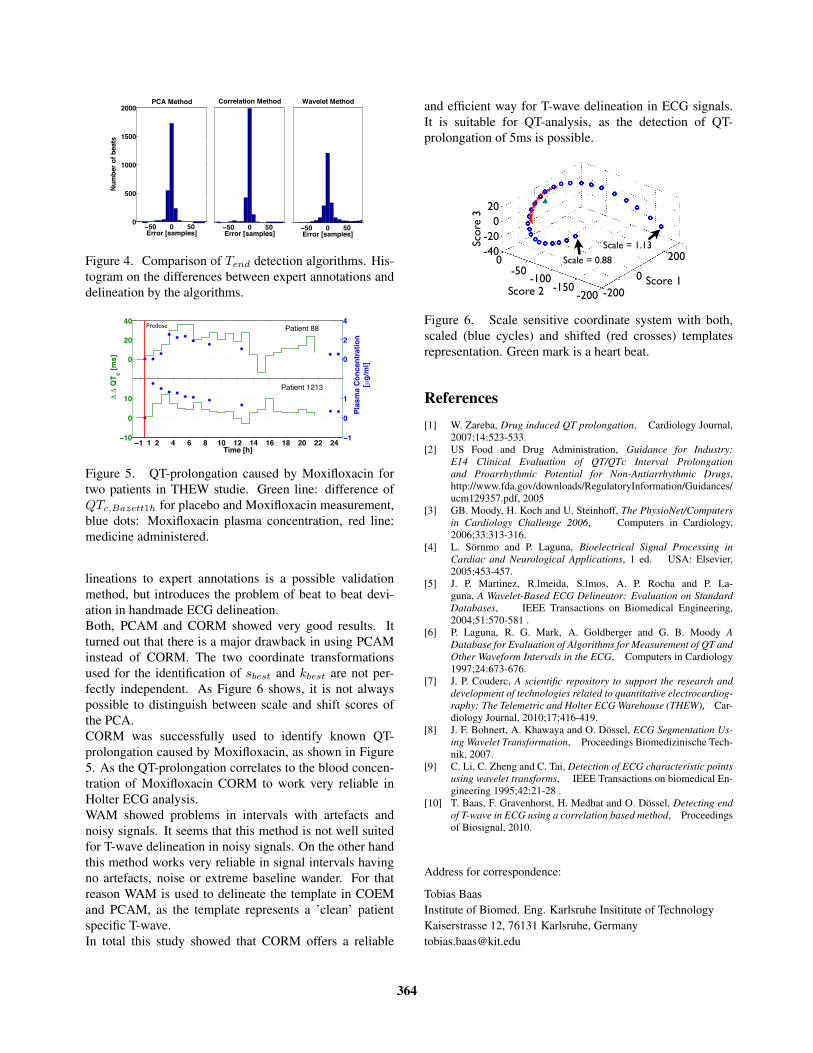
3. Results
To compare the quality of the three delineation methods
introduced before, the Physionet QT database [6] is used.
In this database, Tend is manually marked by an expert.
ECG records were sampled at 250Hz. In total a number
of 2647 heart beats have been considered. To validate the
acquired results, the difference in number of samples be-
tween the experts reference and the algorithms were cho-
sen. Standard deviation (SD) is smallest for the CORM.
PCAMs SD was little higher, while WAMs SD was signif-
icantly higher.
Mean error was smallest for PCAM and a little higher
for CORM. WAM was again significantly higher. Table
1 shows the exact values.
Table 1. Comparison of Tend detection algorithms
Value PCAM CORM WAM
mean error -1.8462 -1.9804 6.2862
standard deviation of error 8.0053 7.7751 33.3356
detection rate (e < 100ms) 97,65% 97,54% 77,22%
Figure 4 shows a histogram built from the results of all
three methods. Again the difference to the reference anno-
tations is considered. CORM has detected most Tend in a
range of ±5 sample points (±20ms) around expert marks.
Again PCAM is second, while WAM marked fewest heart
beats in this interval. Detection rate was measured con-
sidering all Tend in a range of 25 sample points (100ms)
around the reference marks as detected. Again PCAM and
CORM performed significant better than WAM.
To further confirm the results, CORM was successfully
used to detect drug induced QT prolongation in Thorough
QT Study # 2 from THEW [7]. Figure 5 shows the results
for two patients.
4. Discussion and conclusions
One major problem in Tend delineation is the missing
golden standard. Comparing automatically generated de-
363
(!∀ ∀ !∀∀
!∀∀
#∀∀∀
#!∀∀
∃∀∀∀
%&&∋&()∗+,−./∗0
12,3/&(∋4(3/+5∗
678(9/5:∋;
(!∀ ∀ !∀%&&∋&()∗+,−./∗0
7∋&&/.+5<∋=(9/5:∋;
(!∀ ∀ !∀%&&∋&()∗+,−./∗0
>+?/./5(9/5:∋;
Figure 4. Comparison of Tend detection algorithms. His-
togram on the differences between expert annotations and
delineation by the algorithms.
(! ! ∀ # ∃ % !& !∀ !# !∃ !% ∀& ∀∀ ∀#(∀&
&
∀&
#&
UU
(∀
&
∀
#
1)4+5670∗78948(67
Patient 88
(! ! ∀ # ∃ % !& !∀ !# !∃ !% ∀& ∀∀ ∀#(!&
&
!&
∀&
∋()∗+,−.
UU
0
(!
&
!
∀
2341)4
Patient 1213
Predose
((
U+U+/∋0+,)1.
(((
UU
(∀
&
∀
#
2341)4+5670∗78948(67
,!:;)3.
Figure 5. QT-prolongation caused by Moxifloxacin for
two patients in THEW studie. Green line: difference of
QTc,Bazett1h for placebo and Moxifloxacin measurement,
blue dots: Moxifloxacin plasma concentration, red line:
medicine administered.
lineations to expert annotations is a possible validation
method, but introduces the problem of beat to beat devi-
ation in handmade ECG delineation.
Both, PCAM and CORM showed very good results. It
turned out that there is a major drawback in using PCAM
instead of CORM. The two coordinate transformations
used for the identification of sbest and kbest are not per-
fectly independent. As Figure 6 shows, it is not always
possible to distinguish between scale and shift scores of
the PCA.
CORM was successfully used to identify known QT-
prolongation caused by Moxifloxacin, as shown in Figure
5. As the QT-prolongation correlates to the blood concen-
tration of Moxifloxacin CORM to work very reliable in
Holter ECG analysis.
WAM showed problems in intervals with artefacts and
noisy signals. It seems that this method is not well suited
for T-wave delineation in noisy signals. On the other hand
this method works very reliable in signal intervals having
no artefacts, noise or extreme baseline wander. For that
reason WAM is used to delineate the template in COEM
and PCAM, as the template represents a ’clean’ patient
specific T-wave.
In total this study showed that CORM offers a reliable
and efficient way for T-wave delineation in ECG signals.
It is suitable for QT-analysis, as the detection of QT-
prolongation of 5ms is possible.
jcu"vq"dg"hqwpf0"Vjku"yc{."vjg"jgctvdgcvÓu"ujkhv"xcnwg"倦長勅鎚痛岫嫌長勅鎚痛 ┸ 倦長勅鎚痛岻 岫嫌┸ 倦岻
<"REC"ogvjqfÓu"rtqdngo"vq"fkuvkpiwkuj"ujkhv"cpf"uecngVjg" uecngf" *wpujkhvgf+" vgorncvguÓ" tgrtgugpvcvkqp" *dnwg" ekte
血鎚 噺 などどど茎権
-200
0
Score 2
Score
3
Score 1
-200
-100 0
200
20
0
-20
-40
-50
-150
Scale = 0.88
Scale = 1.13
Figure 6. Scale sensitive coordinate system with both,
scaled (blue cycles) and shifted (red crosses) templates
representation. Green mark is a heart beat.
References
[1] W. Zareba, Drug induced QT prolongation, Cardiology Journal,
2007;14:523-533.
[2] US Food and Drug Administration, Guidance for Industry:
E14 Clinical Evaluation of QT/QTc Interval Prolongation
and Proarrhythmic Potential for Non-Antiarrhythmic Drugs,
http://www.fda.gov/downloads/RegulatoryInformation/Guidances/
ucm129357.pdf, 2005
[3] GB. Moody, H. Koch and U. Steinhoff, The PhysioNet/Computers
in Cardiology Challenge 2006, Computers in Cardiology,
2006;33:313-316.
[4] L. Sornmo and P. Laguna, Bioelectrical Signal Processing in
Cardiac and Neurological Applications, 1 ed. USA: Elsevier,
2005;453-457.
[5] J. P. Martinez, R.lmeida, S.lmos, A. P. Rocha and P. La-
guna, A Wavelet-Based ECG Delineator: Evaluation on Standard
Databases, IEEE Transactions on Biomedical Engineering,
2004;51:570-581 .
[6] P. Laguna, R. G. Mark, A. Goldberger and G. B. Moody A
Database for Evaluation of Algorithms for Measurement of QT and
Other Waveform Intervals in the ECG, Computers in Cardiology
1997;24:673-676.
[7] J. P. Couderc, A scientific repository to support the research and
development of technologies related to quantitative electrocardiog-
raphy: The Telemetric and Holter ECG Warehouse (THEW), Car-
diology Journal, 2010;17:416-419.
[8] J. F. Bohnert, A. Khawaya and O. Dossel, ECG Segmentation Us-
ing Wavelet Transformation, Proceedings Biomedizinische Tech-
nik, 2007.
[9] C. Li, C. Zheng and C. Tai, Detection of ECG characteristic points
using wavelet transforms, IEEE Transactions on biomedical En-
gineering 1995;42:21-28 .
[10] T. Baas, F. Gravenhorst, H. Medhat and O. Dossel, Detecting end
of T-wave in ECG using a correlation based method, Proceedings
of Biosignal, 2010.
Address for correspondence:
Tobias Baas
Institute of Biomed. Eng. Karlsruhe Insititute of Technology
Kaiserstrasse 12, 76131 Karlsruhe, Germany
364