comparison of trends in naep, massachusetts-naep, and … · stephen jirka and ronald k. hambleton...
TRANSCRIPT

Comparison of Trends in NAEP, Massachusetts-NAEP, and MCAS Results1,2
Stephen Jirka and Ronald K. Hambleton
University of Massachusetts Amherst
July 4, 2004
1 Center for Educational Assessment MCAS Validity Report No. 6. (CEA-537).
Amherst, MA: University of Massachusetts, Center for Educational Assessment. 2 This work was carried out under a contract between the University of Massachusetts
Center for Educational Assessment and Measured Progress, Dover, New Hampshire.
2
Comparison of Trends in NAEP, Massachusetts-NAEP, and MCAS Results
Stephen Jirka and Ronald K. Hambleton
University of Massachusetts, at Amherst
Introduction
For the last seven years the Commonwealth of Massachusetts has administered the
Massachusetts Comprehensive Assessment System (MCAS) tests to provide information to
students, teachers, parents, school administrators, policy-makers, and the public about the levels
of student learning and achievement gains from one year to the next. The MCAS tests in English
Language Arts (ELA) and Mathematics have been constructed to provide content valid measures
of the curriculum frameworks at selected grades. Currently, students are assessed at grades 4, 7,
and 10 in ELA and grades 4, 6, 8, and 10 in mathematics.
The National Assessment of Educational Progress (NAEP) is another assessment that the
Commonwealth of Massachusetts participates in, and here, the assessments are administered to
students at grades 4, 8, and 12. These tests are administered every two years, and the subjects
assessed vary from administration to administration, but reading and mathematics are the most
frequently assessed subjects. NAEP provides a basis for comparing Massachusetts students to
students in other states and the nation in terms of level of proficiency, and changes over time
since 1990, when the NAEP trial-state assessment was initiated. NAEP, itself, has a history
dating back to 1969.
One of the criticisms that is sometimes directed at states is that the academic
accomplishment and growth they report from year to year based on their state assessments are
inflated because schools narrowly teach to the portion of the curricula they expect to be on the
assessments, and students are prepped to maximize their scores by using test-taking skills. Some
critics feel that students would not do nearly as well on assessments such as those offered by
NAEP (see research by Koretz) where the content domains being assessed may be more
challenging and testing-taking skills would be less influential in the results. States can respond
to the criticism in several ways—they can demonstrate that the curricula they have in place are
demanding, being taught, and that their assessments reflect these curricula. Achieve, Inc. is an
organization that carries out such studies for states. Massachusetts, in fact, has undergone such a
review, and the findings reflected well on the curricula, test-curricula match, and the assessments

3
themselves (Achieve, 2001). A second state response would be to compare NAEP results with
state testing results and look for the similarities and differences, and try to explain them.
The purpose of this study was to compare average proficiency levels, proficiency
classifications, and trends between NAEP results for the country and NAEP results for
Massachusetts, and then NAEP results for Massachusetts and MCAS results. For NAEP we
have results as far back as 1992, one year prior to the passing of the Educational Reform Act in
Massachusetts, and for the MCAS, results in ELA and mathematics have been available since
1998. We note that these comparisons are not without their drawbacks (see, for example,
Reckase, 2002) several of which will be described in the next section. At the same time, when
state results are not generally in line with external indicators of achievement such as NAEP or
nationally normed standardized achievement tests, it would be useful to know that, and to try and
explain the differences. In some cases, those explanations may have implications for revising the
MCAS curriculum frameworks and tests, and other times, they may have no implications at all.
But, first the comparisons must be made, and that is the purpose of this study.
The remainder of the study is organized into four sections. First, some background on
NAEP and the possible drawbacks to NAEP-MCAS comparisons are offered. Second, the
design for the study is presented. Third, results of our study, and some discussion are provided.
Finally, several conclusions from the study are offered.
Background about NAEP
The National Assessment of Educational Progress (NAEP), also known as "the Nation's
Report Card," is the only nationally representative and continuing assessment of what students in
the United States know and can do in various subject areas. Assessments in subjects such as
reading, mathematics, and science have been conducted periodically since 1969. The No Child
Left Behind legislation requires that reading and mathematics tests be administered every other
year in grades 4 and 8, and that states must participate (it used to be voluntary) in the part of
NAEP that is used to obtain an estimate of student performance for assessing state level results.
In the past this had been voluntary, but it is now a condition of accepting Federal funds.
Development of the curriculum frameworks and test specifications is the responsibility of
the National Assessment Governing Board (NAGB). These frameworks reflect knowledge,
skills, and abilities commonly found in state curricula. It is important to keep in mind that

4
NAEP does not provide scores for individual students or schools, but does offer results regarding
subject-matter achievement and proficiency classifications for populations of students and
subgroups of those populations. NAEP results reported for both the country and the states are
based on samples. In contrast, most state assessments involve nearly all students at the selected
grades. “Full inclusion” is the goal, and states not assessing a very high percentage of their
students would be in violation of the NCLB legislation.
NAEP results provide information for the nation and specific geographic regions of the
country. It includes students drawn from both public and nonpublic schools and reports results
for student achievement at grades 4, 8, and 12. The assessments follow the framework
developed by NAGB, and use the latest advances in assessment methodology.
State-NAEP is the part of the program used to assess the performance of students in the
state and is based upon the same content as the national NAEP assessment. However, because
the national NAEP samples do not insure representative state level samples, separate
representative samples of students are selected for each participating jurisdiction/state.
Because of a redesign, a combined sample of public schools selected for both state and
national NAEP was implemented in 2002. From this group of schools, representing 50 states, a
subsample was identified to provide national results. Therefore, the national sample is a subset
of the combined sample of students assessed in each participating state, plus an additional
sample from the states that did not participate in the state assessment. This additional sample
ensures that the national sample is representative of the total national student population. The full
data set is analyzed together, allowing all data to contribute to the final results. There have been
few challenges to the legitimacy of the NAEP national and state sampling plans.

5
Drawbacks to NAEP-MCAS Comparisons
In order to compare the results from the MCAS and NAEP several issues need to be
considered.
Content Domain
NAEP attempts to measure what students know and can do with respect to content
domains that reflect state educational systems across the United States. NAEP uses curriculum
standards that are put forth by such organizations as the National Council of Teachers of
Mathematics and the National Council of Teachers of Reading so that the domains assessed will
be national in scope and of interest to states. Many states report that they have used the national
curriculum standards in developing their own curricula, or reviewing their own curricula.
However, there is no reason to believe that the curriculum frameworks in Massachusetts, or for
that matter, any states, are exactly in line with the national curriculum frameworks.
Evidence does exist to support the content validity of the Massachusetts assessment
system and its curriculum standards. Achieve, Inc. has done this work. At the request of the
Department of Education, this organization conducted an evaluation of the Massachusetts’ K–12
mathematics standards and grade 10 Massachusetts Comprehensive Assessment System (MCAS)
tests in English language arts and mathematics during the spring and summer of 2001. An
evaluation of the English language arts standards was not done because previously Achieve Inc.
had commended the state on them and said they were standards to be emulated by other states.
The results of this analysis by Achieve, Inc. were very positive toward Massachusetts and
indicated that the state had strong curriculum standards, and assessments that measured the
standards. The evaluation found that, overall, Massachusetts' standards and high school tests are
of high quality and are aligned, providing a solid foundation on which to build a state education
policy. This set Massachusetts apart from the other nine state standards and assessment programs
that Achieve, Inc. had reviewed up to that time because it was the only state that was judged to
have both strong curriculum standards and strong assessments (Achieve, 2001). Additionally, the
grade 10 tests were judged as “rigorous yet reasonable” and the most challenging of the exit-
level tests Achieve, Inc. had reviewed. At the same time, while the Achieve, Inc. report lends
strong credibility to the Massachusetts curriculum frameworks and the related assessments, there
is no assurance that the NAEP and MCAS curricula themselves are in alignment, and therefore,
it is not unreasonable to expect that the results may be different too.
6
Performance Categories
One of the ways in which NAEP reports results is by the percentages of examinees
estimated to be in each of four performance categories: Below Basic, Basic, Proficient, and
Advanced. But these performance categories are not going to be identical to those in use in
Massachusetts. NAGB developed its descriptors using national committees, and Massachusetts
developed its own using persons within the Commonwealth. If a future study were to be
encouraged by the Department, we would look carefully at the match in the descriptors, but we
have not done that for this initial study. For reference purposes, we have included the NAEP and
MCAS descriptors (pages 41 to 52). What is well-known is that the NAEP performance
standards are considered to be “world class” and so they are high.
Context of the Assessment
In comparing NAEP and MCAS scores, the context for the testing should be considered
too. The MCAS is called “high stakes,” at least at the grade 10 level, because these ELA and
Mathematics tests need to be passed by students for them to receive their high school diplomas.
It is likely that students will be motivated to do well, and the school staff, in general, will likely
do what they can to help the students perform at their best. In fact, in the first year, when
passing the grade 10 assessments was required for high school graduation, test results increased
substantially over the previous year (2000 versus 2001).
NAEP, on the other hand, is sometimes referred to as a “drop from the sky” assessment
with no stakes attached to student performance (see, the study by Forsyth, Hambleton, Linn,
Mislevy, & Yen, 1996). This point must be kept in mind when looking at the results from
NAEP. Until 2003, NAEP had no direct consequences for students or school staff because
NAEP results were not even reported at the school or student level. Students did not receive
scores, and schools did not receive summaries of student performance. These features of NAEP
make it a “low stakes” assessment at the school and student level. However, the No Child Left
Behind (NCLB) legislation has made the stakes higher for NAEP, but at least for now, NAEP
results reported in this study were obtained under low-stakes testing conditions.
At the same time, it might be expected that grade 4 and 8 students will not be too much
affected by tests being “high stakes” or “low stakes” (especially grade 4 students). And in
Massachusetts, at grades 4 and 8, the tests themselves are not really high stakes for students.
True Score Versus Observed Score Distributions
7
Observed score, or test score distributions are always a bit more variable than true score
distributions because of errors of measurement. This problem becomes especially important
when score reliability is modest. That’s not the case with MCAS scores; score reliability is quite
high (perhaps around .90), but with test score distributions when compared to true score
distributions, have a tendency to over estimate the number of candidates in the bottom and top
performance categories. Therefore, differences between NAEP and MCAS results where MCAS
results show more students in the bottom and top categories, may have more to do with test score
reliability considerations, than real differences in the NAEP and MCAS results. This point is
rarely considered when comparing NAEP and MCAS scores but it is an important consideration.
Summary
Clearly then, comparisons of NAEP and MCAS results are not without their drawbacks
or limitations: (1) curriculum frameworks for the two assessments are definitely not identical,
and so it would not be surprising to see students from Massachusetts performing better on tests
matched to their own curricula than to a national curricula, (2) the performance levels are not
necessarily the same for NAEP and the MCAS (NAEP performance levels were set by national
panels including 30 percent representation from the public, whereas MCAS performance levels
were set by Massachusetts educators with minimal input from the public) and so there is no
reason, for example, to expect that “Basic,” “Proficient,” and “Advanced” on NAEP correspond
exactly to “Needs Improvement,” “Proficient,” and “Advanced” on MCAS, (3) the assessment
context is very different—NAEP is a “drop from the sky” low-stakes assessment, involving
samples of students, whereas MCAS is an annual “high-stakes” assessment of all students at
selected grades in Massachusetts—students are unlikely to have heard of NAEP at the time of
assessment, just about all of them would be aware of MCAS, and finally (4) NAEP provides
estimates of true score distributions for states whereas MCAS provides observed score
distributions, and this difference has implications for comparing results across the two
assessments.
Method
Data
The data used in this study were obtained from the National Center for Educational
Statistics website and from the Massachusetts Department of Education website. The NAEP data

8
included the mean scaled scores for each grade and subject area for both the nation and the state
of Massachusetts, along with the performance category data. Break outs were also available for
the disaggregated groups required under the new NCLB legislation. These data were collected
on all NAEP administrations since 1992 in reading and mathematics where reporting was
available for the Commonwealth of Massachusetts. The MCAS data contained mean scaled
scores up until 2002 and performance level data for both the entire state and the various breakout
group categories required to be reported under current legislation since 1998.
Procedures and Analyses
After the data were collected, they were compiled and various graphical displays were
composed to see if changes were evident between the NAEP scores for the country and for
Massachusetts. Additionally, scores for MCAS were graphed and data were compared to
determine if there were trends across the years and between the various groups. During this
process, the NAEP and MCAS performance category descriptors were gathered and compared to
determine if roughly the same types of knowledge and skills were required. Our first impression
was that they were by and large similar but we will leave it up to curriculum specialists in the
Commonwealth to carry out a careful match at another time.
9
Results and Discussion
Analysis of NAEP Scaled Scores
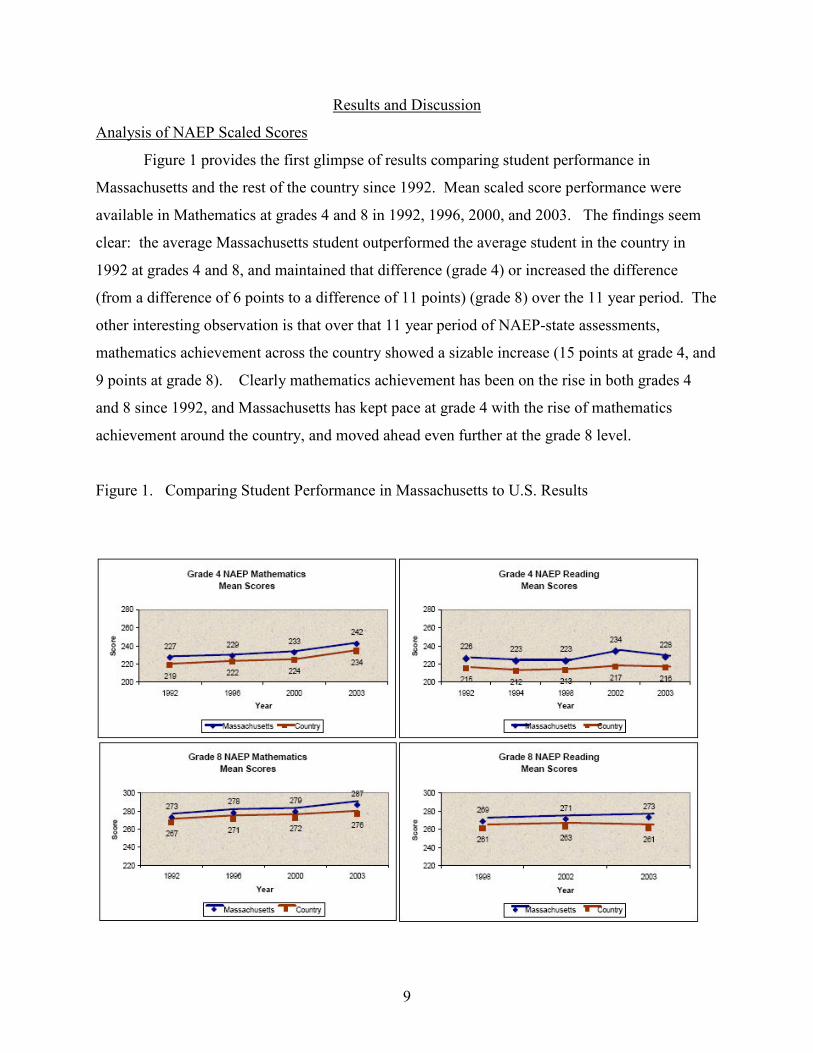
Figure 1 provides the first glimpse of results comparing student performance in
Massachusetts and the rest of the country since 1992. Mean scaled score performance were
available in Mathematics at grades 4 and 8 in 1992, 1996, 2000, and 2003. The findings seem
clear: the average Massachusetts student outperformed the average student in the country in
1992 at grades 4 and 8, and maintained that difference (grade 4) or increased the difference
(from a difference of 6 points to a difference of 11 points) (grade 8) over the 11 year period. The
other interesting observation is that over that 11 year period of NAEP-state assessments,
mathematics achievement across the country showed a sizable increase (15 points at grade 4, and
9 points at grade 8). Clearly mathematics achievement has been on the rise in both grades 4
and 8 since 1992, and Massachusetts has kept pace at grade 4 with the rise of mathematics
achievement around the country, and moved ahead even further at the grade 8 level.
Figure 1. Comparing Student Performance in Massachusetts to U.S. Results

10
Mean scaled score performance were available in reading at grade 4 from 1992 to 2003
and at grade 8 from 1998 to 2003. Again, the average Massachusetts student outperformed the
average student in the country, and maintained that advantage over the 11 years of testing.
Generally, the trends were flat in reading, though Massachusetts students did show a modest gain
(2 points) compared to other states at grade 4, and a moderate gain at grade 8 (4 points). (A one
point gain, is roughly equivalent to a single month of instruction, so a 4 point gain is roughly
equivalent to giving students an extra four months of instruction over four years of instruction or
about one extra month per year. An extra month of schooling per year seems practically
meaningful.)
The shortcoming of Figure 1 is that the results are in terms of scaled scores. Without
more benchmarks on the scaled score scale and standard deviations of scores, interpretations are
difficult to make because scaled scales are not meaningful without some benchmarks and effect
sizes cannot be calculated. What is clear is that scores in Massachusetts and other states are on
the increase, and at the grade 8 level especially, and in both Mathematics and Reading,
Massachusetts appears to be increasing its advantage over other states.
Mathematics
Figure 2 provides some of the same information about mathematics performance as
Figure 1, and in addition, indicates the percentage of students in Massachusetts and other states
in each performance category. At the grade 4 level, the percentage of Basic and above students
in Massachusetts increased from 68 to 84 percent between 1992 and 2003, an increase of 16
percent, and at the national level, the percentage of Basic and above students increased 19
percent. But with respect to Proficient and above students, the gain was 18 percent in
Massachusetts (23 to 41 percent) and 14 percent at the national level (17 to 31 percent).

11
Figure 2. Mathematics Summary Results
At the grade 8 level, the percentage of Basic and above students in Massachusetts
increased from 63 to 76 percent between 1992 and 2003, an increase of 13 percent, and at the
national level, the percentage of Basic and above students increased 11 percent (from 56 to 67
percent). But with respect to Proficient and above students the gain was 18 percent in
Massachusetts (23 to 41 percent) and 14 percent at the national level (17 to 31 percent). Clearly
Massachusetts has shown more growth at grade 8 than other states. Figure 3 shows the same
information graphically.
12
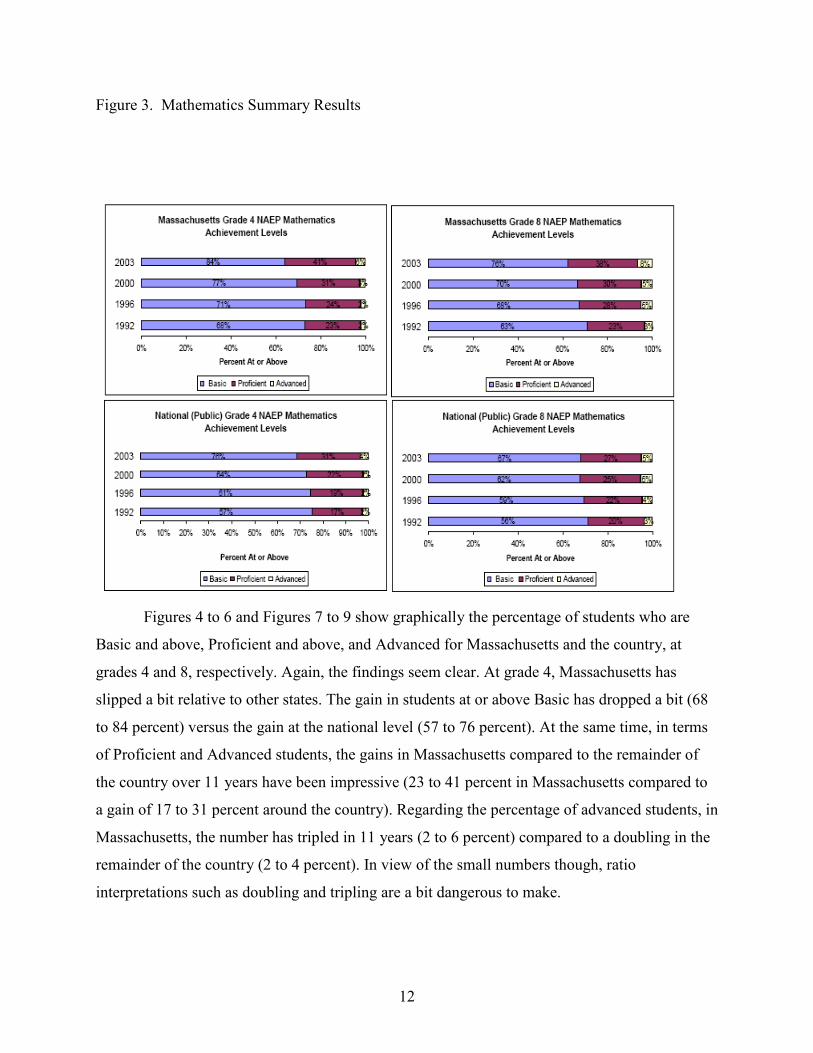
Figure 3. Mathematics Summary Results
Figures 4 to 6 and Figures 7 to 9 show graphically the percentage of students who are
Basic and above, Proficient and above, and Advanced for Massachusetts and the country, at
grades 4 and 8, respectively. Again, the findings seem clear. At grade 4, Massachusetts has
slipped a bit relative to other states. The gain in students at or above Basic has dropped a bit (68
to 84 percent) versus the gain at the national level (57 to 76 percent). At the same time, in terms
of Proficient and Advanced students, the gains in Massachusetts compared to the remainder of
the country over 11 years have been impressive (23 to 41 percent in Massachusetts compared to
a gain of 17 to 31 percent around the country). Regarding the percentage of advanced students, in
Massachusetts, the number has tripled in 11 years (2 to 6 percent) compared to a doubling in the
remainder of the country (2 to 4 percent). In view of the small numbers though, ratio
interpretations such as doubling and tripling are a bit dangerous to make.

13
Figure 4. Grade 4 NEAP Mathematics - Basic
14
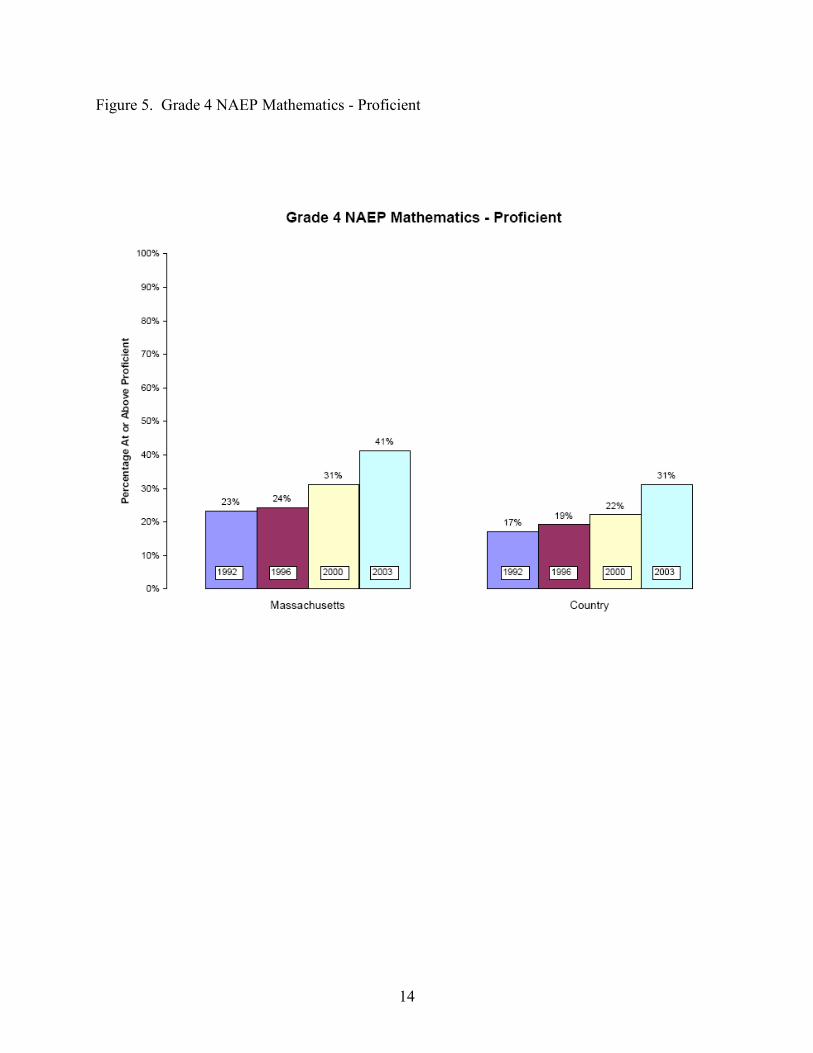
Figure 5. Grade 4 NAEP Mathematics - Proficient

15
Figure 6. Grade 4 NAEP Mathematics - Advanced

16
Figure 7. Grade 8 NAEP Mathematics - Basic
17
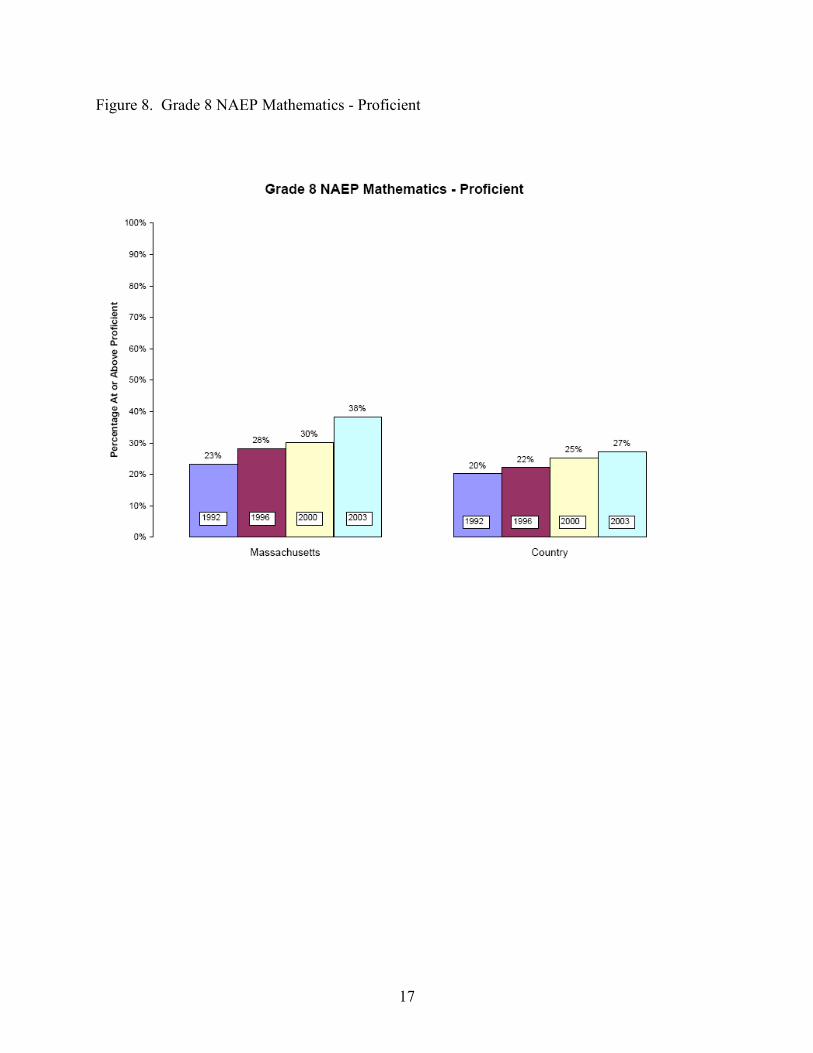
Figure 8. Grade 8 NAEP Mathematics - Proficient
18
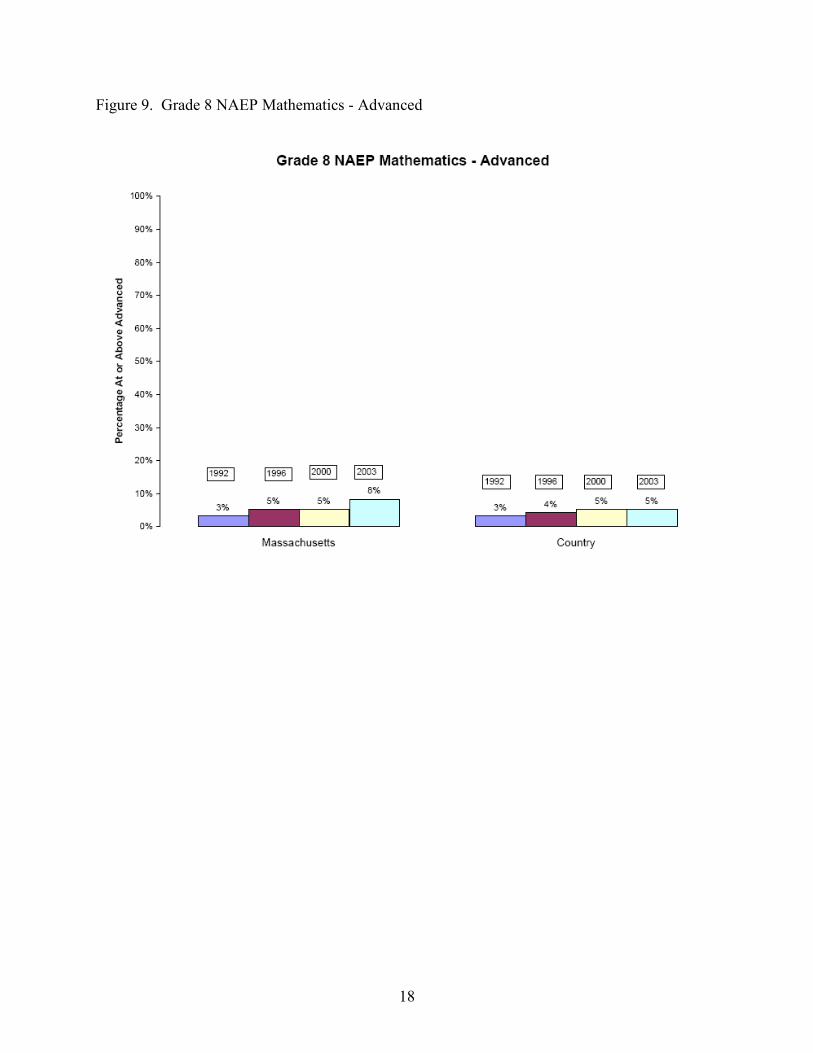
Figure 9. Grade 8 NAEP Mathematics - Advanced
19
An analysis of the grade 8 results shows that Massachusetts is gaining considerably in
mathematics achievement compared to the remainder of the country. The percentage of
Proficient students and above has increased from 23 to 38 percent in Massachusetts compared to
an increase from 20 to only 27 percent in the country. The gain is about double that of the rest of
the country. And again, sizeable gains were observed in the percentage of advanced students in
Massachusetts (3 to 8 percent) compared to the remainder of the country (3 to 5 percent).
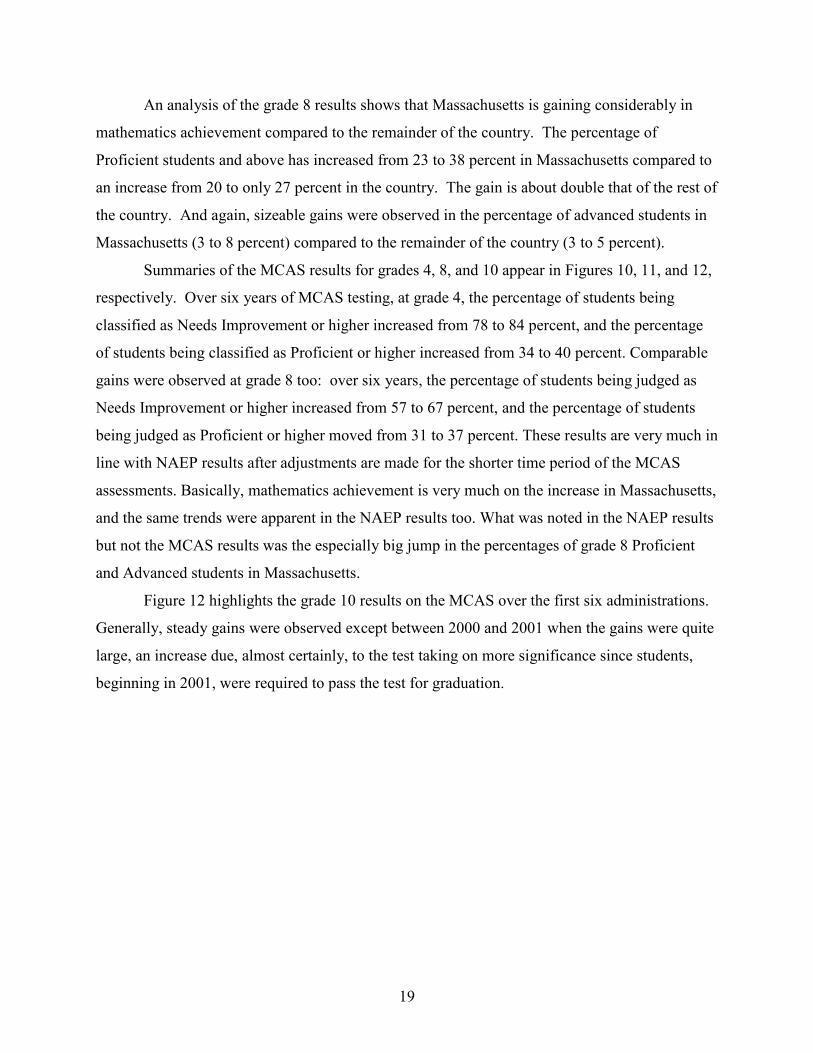
Summaries of the MCAS results for grades 4, 8, and 10 appear in Figures 10, 11, and 12,
respectively. Over six years of MCAS testing, at grade 4, the percentage of students being
classified as Needs Improvement or higher increased from 78 to 84 percent, and the percentage
of students being classified as Proficient or higher increased from 34 to 40 percent. Comparable
gains were observed at grade 8 too: over six years, the percentage of students being judged as
Needs Improvement or higher increased from 57 to 67 percent, and the percentage of students
being judged as Proficient or higher moved from 31 to 37 percent. These results are very much in
line with NAEP results after adjustments are made for the shorter time period of the MCAS
assessments. Basically, mathematics achievement is very much on the increase in Massachusetts,
and the same trends were apparent in the NAEP results too. What was noted in the NAEP results
but not the MCAS results was the especially big jump in the percentages of grade 8 Proficient
and Advanced students in Massachusetts.
Figure 12 highlights the grade 10 results on the MCAS over the first six administrations.
Generally, steady gains were observed except between 2000 and 2001 when the gains were quite
large, an increase due, almost certainly, to the test taking on more significance since students,
beginning in 2001, were required to pass the test for graduation.
20
Figure 10. Grade 4 MCAS Mathematics

21
Figure 11. Grade 8 MCAS Mathematics

22
Figure 12. Grade 10 MCAS Mathematics

23
English Language Arts/Reading
The results for English Language Arts/Reading are presented next. Similar to Figure 2,
Figure 13 gives an overall summary of the results for Reading grades 4 and 8 by providing the
mean and percentage of students in Massachusetts and other states in each performance category.
Overall, Massachusetts has higher means and percentages for each category in Reading. More
specifically, the Massachusetts percentages are at least 8 percent higher for grade 4 and grade 8
for the Basic and Proficient performance levels. For the percentage of Proficient and above, the
gap is as much as 17 percent for grade 4 (2002) and 13 percent for grade 8 (2003).
For the years 1992-2003, the Massachusetts grade 4 percentages fluctuate for the Basic
and above and show a slight overall decrease of 1 percent, but also have a maximum increase
from 1992 to 2002 of around 6 percent. Grade 8 shows that the largest increase was 2 percent (79
to 81 percent) for Basic and above. Proficient and above has a maximum gain of 5 percent (38 to
43 percent). The national NAEP results show similar fluctuations for both grade 4 and grade 8
within both the Basic and above and Proficient and above performance categories. Grade 8
percentages stay about the same for the years 1998 to 2003. Figure 14 shows the same
information graphically.
Figure 14. Reading Summary Results
24
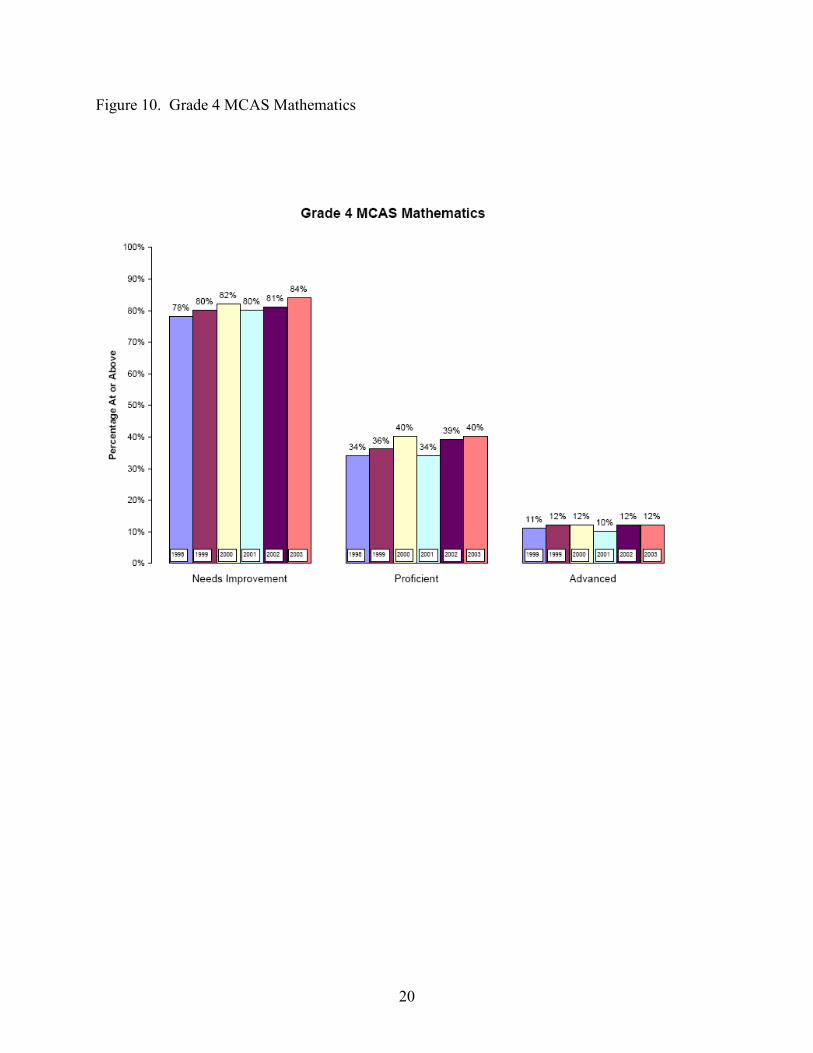
Figures 15 to 17 and Figures 18 to 20 show graphically the percentage of students who
are Basic and above, Proficient and above, and Advanced for Massachusetts and the country, at
grades 4 and 8 in Reading, respectively. The findings showing Massachusetts consistently
performing at a higher percentage than the Nation are again seen. At grade 4, Massachusetts and
the other states have remained relatively steady overall, but with some fluctuation. The gain in
students at or above Basic was highest in 2002 with 80 percent, but ended at slightly below the
starting year of 1992 (74 to 73 percent). The nation ended with a 2 percent gain from 1992 to
2003, but also had fluctuation in between. But recall that Massachusetts’s percentages were
always above those for the other states, and in 2002 there was an increase of 12 percentage
points. This is when new legislation came into effect. Again, there are now consequences
attached to the results because of the NCLB legislation taking effect. In terms of Proficient and
Advanced students, the gains in Massachusetts were higher overall when compared to the
remainder of the country over 11 years. The country gained approximately 3 percent while
Massachusetts gained 4 percent. There was a difference of 17 percent in 2002. The percentage of

25
Advanced students in Massachusetts has increased from 7 to 10 percent while the nation has only
increased by one percentage point (6 to 7 percent).
The trends for the grade 8 results are not as distinct between Massachusetts and the rest
of the country. The percentage of Basic and above students has slightly increased from 79 to 81
percent in Massachusetts compared to an increase from 71 to 72 percent for the rest of the
country. This 2 percent gain has been double that the rest of the country, though of course the
change has been small. The percentage of Proficient and above students has remained steadily
around 30 percent for the country, while Massachusetts has gone from 38 to 43 percent.
Relatively, this is a considerable increase. Again, however, Massachusetts has percentages above
those of the rest of the country.
Figure 15. Grade 4 NAEP Reading - Basic

26
Figure 16. Grade 4 NAEP Reading - Proficient

27
Figure 17. Grade 4 NAEP Reading - Advanced
28
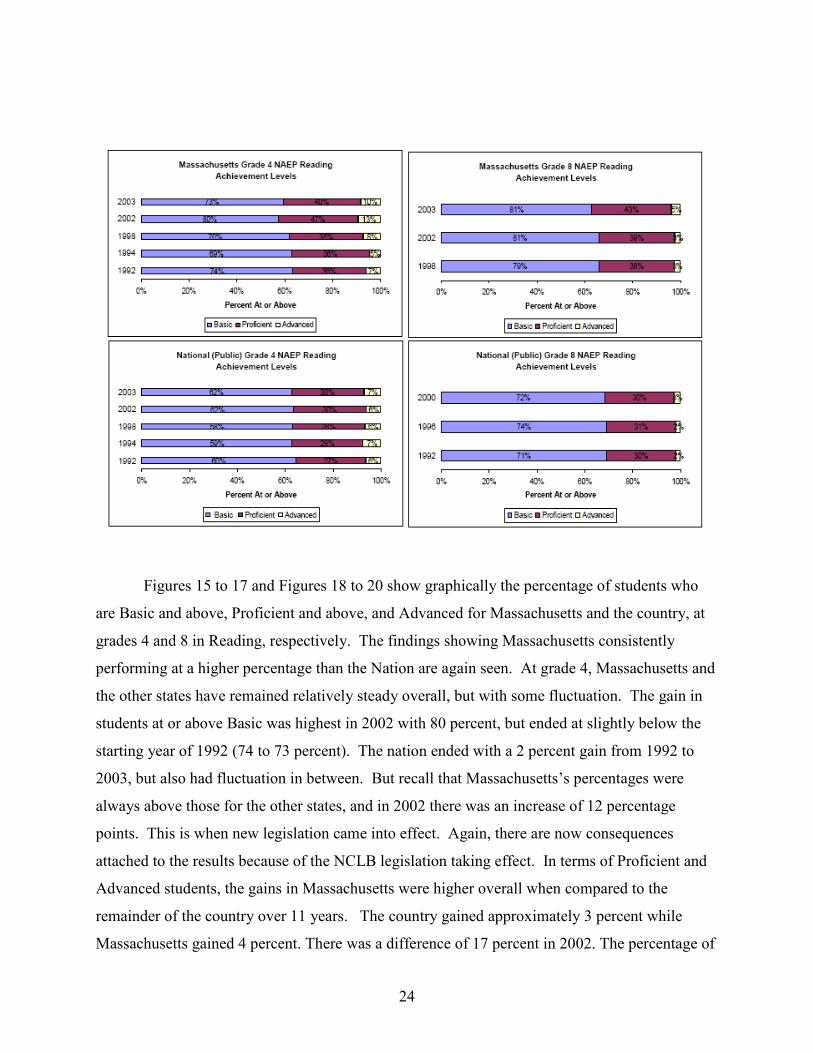
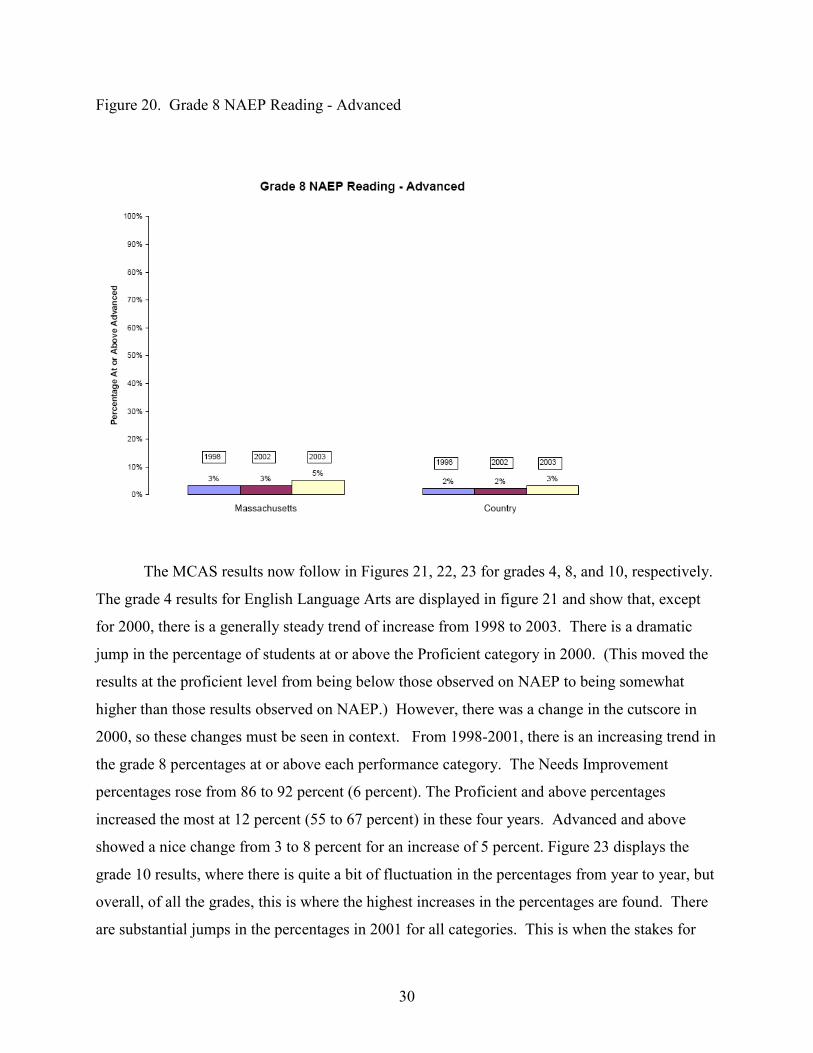
Figures 18 to 20 show the grade 8 results for Reading. Figure 18 shows the percentages
within this category remain about the same over the period of three years for both the state (81
percent) and national results (72 percent). Again, the Massachusetts percentages are always
higher than the national and the overall gain from 1998 to 2003 for Massachusetts is twice that of
the nation. Figure 19 displays the generally increasing trend of the percentage of students at or
above the proficient category in reading. Massachusetts has increasing percentages for each year
(38 to 43 percent), while the national percentages remain the same (30 percent). The results of
comparing the Advanced category show that the percentages remain the same until 2003 when
they increase for both the state and the nation. Yet again, the increase for Massachusetts is
higher (2 percent) than for the rest of the states (1 percent).
Figure 18. Grade 8 NAEP Reading - Basic

29
Figure 19. Grade 8 NAEP Reading - Proficient
30
Figure 20. Grade 8 NAEP Reading - Advanced
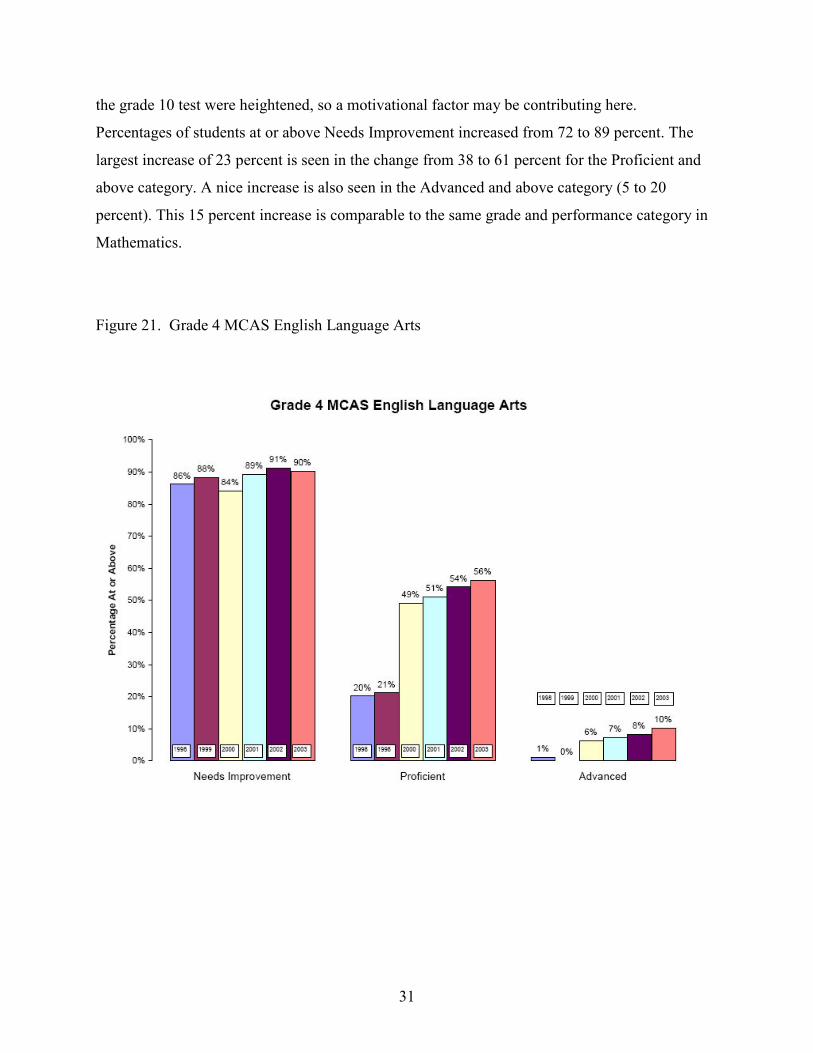
The MCAS results now follow in Figures 21, 22, 23 for grades 4, 8, and 10, respectively.
The grade 4 results for English Language Arts are displayed in figure 21 and show that, except
for 2000, there is a generally steady trend of increase from 1998 to 2003. There is a dramatic
jump in the percentage of students at or above the Proficient category in 2000. (This moved the
results at the proficient level from being below those observed on NAEP to being somewhat
higher than those results observed on NAEP.) However, there was a change in the cutscore in
2000, so these changes must be seen in context. From 1998-2001, there is an increasing trend in
the grade 8 percentages at or above each performance category. The Needs Improvement
percentages rose from 86 to 92 percent (6 percent). The Proficient and above percentages
increased the most at 12 percent (55 to 67 percent) in these four years. Advanced and above
showed a nice change from 3 to 8 percent for an increase of 5 percent. Figure 23 displays the
grade 10 results, where there is quite a bit of fluctuation in the percentages from year to year, but
overall, of all the grades, this is where the highest increases in the percentages are found. There
are substantial jumps in the percentages in 2001 for all categories. This is when the stakes for
31
the grade 10 test were heightened, so a motivational factor may be contributing here.
Percentages of students at or above Needs Improvement increased from 72 to 89 percent. The
largest increase of 23 percent is seen in the change from 38 to 61 percent for the Proficient and
above category. A nice increase is also seen in the Advanced and above category (5 to 20
percent). This 15 percent increase is comparable to the same grade and performance category in
Mathematics.
Figure 21. Grade 4 MCAS English Language Arts

32
Figure 22. Grade 8 MCAS English Language Arts

33
Figure 23. Grade 10 MCAS English Language Arts
Comparison of NAEP and MCAS Results at Grades 4 and 8
Figure 24 provides the comparison of NAEP and MCAS results in grade 4 mathematics.
For the Basic and above category, and the Proficient and above category, the increases in student
performance at the state level over time are actually higher on NAEP than on the MCAS, though
the latter spanned a testing period of only six years compared to an 11 year period on NAEP.
The results at grade 8 show basically the same pattern as the results at grade 4 (see Figure 25).
Clearly, the achievement gains in mathematics at both grades 4 and 8 on the MCAS are mirrored
on the NAEP. In fact, if anything, and even after the differences in time between the first and
last test administrations are taken into account, the gains shown in NAEP performance exceed
the performance gains on the MCAS.

34
Figure 24. Comparison of Massachusetts NAEP and MCAS Results - Grade 4 Mathematics

35
Figure 25. Comparison of Massachusetts NAEP and MCAS Results - Grade 8 Mathematics
Figure 26 provides the comparison of NAEP and MCAS results in grade 4 reading. For
the Basic and above category, and the Proficient and above category, the increases in student
performance at the state level over time are higher on the MCAS than on NAEP. At the lower
category, no gains were seen on the NAEP results, while there was a small gain on the MCAS
results (86 to 90 percent, compared to 74 to 73 percent). For proficient and above, there was a
small gain on NAEP (from 36 to 40 percent) whereas on the MCAS the gain was substantial (20
to 56 percent) over a much shorter time period. At the grade 8 level, the trends were more or less
the same (see Figure 27). At the needs improvement and above, NAEP and MCAS showed
about the same small increases (79 to 81 percent, versus 86 to 92 percent). At the proficient and
above category, the gains on the MCAS were somewhat larger (55 to 67 percent versus 38 to 43
percent). Overall, the trends in MCAS and NAEP reading scores were both positive, but by and
large, increases were larger on the MCAS, especially at the proficient and above category.

36
Figure 26. Comparison of Mathematics NAEP and MCAS Results - Grade 4 Reading ELA
Figure 27. Comparison of Massachusetts NAEP and MCAS Results - Grade 8 Reading
ELA
37
Conclusions
The NAEP results in Mathematics, at both grades 4 and 8, show clearly that sizeable
gains are being made around the country. And, in Massachusetts at grade 8, the gains are even
greater. These findings are reflected too in the MCAS results. Over six years of MCAS testing,
at grade 4, the percentage of students being classified as Needs Improvement or better increased
from 78 to 84 percent, and the percentage of students being classified as proficient or better has
increased from 34 to 40 percent. Comparable gains were observed at grade 8 too: over six years,
the percentage of students being judged as “Needing Improvement” or better moved from 57 to
67 percent, and the percentage of students being judged as “Proficient” or better moved from 31
to 37 percent. These results are very much in line with NAEP results after adjustments are made
for the shorter time period of MCAS assessments. In fact, probably the NAEP gains are
somewhat higher than the gains reflected on the MCAS.
The NAEP results in English Language Arts/Reading are not as clear. There are
moderate increases for grades 4 and 8 through the years. These gains are moderate, but they are
gains. Massachusetts has percentages that are above the nation on all grades and performance
levels. But, more substantial increases are seen for the MCAS results. Grade 8 has steady
increases from 86 to 92 percent for Needs Improvement, 55 to 67 percent for Proficient and
above, and 3 to 5 percent for the Advanced and above percentage of students. More fluctuation
is seen in grade 10, but here, overall gains are striking. Percentages of students at or above
Needs Improvement increased from 72 to 89 percent, from 38 to 61 percent for the Proficient
and above category, and from 5 to 20 percent for Advanced. These are gains of 23 and 15
percent, respectively. The size of gains shown on the MCAS are rather larger than those that
were observed on NAEP.
Follow-up studies from this one would include a study of the four proficiency levels from
NAEP and MCAS. Do the levels line up or is one set of performance descriptors higher than the
other? The data are available in this report but the question was not addressed. Another study
would focus on the sub-group results for minorities and other special populations. Are the gaps
regularly reported on NAEP similar to the gaps observed on the MCAS?

38
References
Achieve, Inc. (October 2001). Measuring Up: A report on educational standards and
assessment for Massachusetts. Washington, DC: Author.
Forsyth, R., Hambleton, R. K., Linn, R., Mislevy, R., & Yen, W. (1996). Design/feasibility of
NAEP. Washington, DC: National Assessment Governing Board.
National Center for Education Statistics. (2003). What is NAEP? Retrieved November 11, 2003,
from http://nces.ed.gov/nationsreportcard/about/
Reckase, M. D. (February 2002). Using NAEP to confirm state test results: Opportunities and
problems. In No Child Left Behind: What Will It Take? New York: Thomas B. Fordham
Foundation.

39
NAEP Mathematics Achievement Levels: Grade 4
Basic
Fourth-grade students performing at the Basic level should show some evidence of understanding the
mathematical concepts and procedures in the five NAEP content strands.
Fourth graders performing at the Basic level should be able to estimate and use basic facts to perform
simple computations with whole numbers, show some understanding of fractions and decimals, and solve
some simple real-world problems in all NAEP content areas. Students at this level should be able to use—
although not always accurately—four-function calculators, rulers, and geometric shapes. Their written
responses are often minimal and presented without supporting information.
Proficient
Fourth-grade students performing at the Proficient level should consistently apply integrated procedural
knowledge and conceptual understanding to problem solving in the five NAEP content strands.
Fourth-graders performing at the Proficient level should be able to use whole numbers to estimate,
compute, and determine whether results are reasonable. They should have a conceptual understanding of
fractions and decimals; be able to solve real-world problems in all NAEP content areas; and use four-
function calculators, rulers, and geometric shapes appropriately.
Students performing at the Proficient level should employ problem-solving strategies such as identifying
and using appropriate information. Their written solutions should be organized and presented both with
supporting information and with explanations of how they were achieved.
Advanced
Fourth-grade students performing at the Advanced level should apply integrated procedural knowledge
and conceptual understanding to complex and nonroutine real-world problem solving in the five NAEP
content strands.
Fourth graders performing at the Advanced level should be able to solve complex nonroutine real-word
problems in all NAEP content strands. They should display mastery in the use of four-function
calculators, rulers, and geometric shapes. The students are expected to draw logical conclusions and
justify answers and solution processes by explaining why, as well as how, they were achieved. They
should go beyond the obvious in their interpretations and be able to communicate their thoughts clearly
and concisely.

40
NAEP Mathematics Achievement Levels: Grade 8
Basic
Eighth-grade students performing at the Basic level should exhibit evidence of conceptual and procedural
understanding in the five NAEP content strands. This level of performance signifies an understanding of
arithmetic operations—including estimation—on whole numbers, decimals, fractions, and percents.
Eighth graders performing at the Basic level should complete problems correctly with the help of
structural prompts such as diagrams, charts, and graphs. They should be able to solve problems in all
NAEP content strands through the appropriate selection and use of strategies and technological tools—
including calculators, computers, and geometric shapes. Students at this level also should be able to use
fundamental algebraic and informal geometric concepts in problem solving.
As they approach the proficient level, students at the Basic level should be able to determine which of the
available data are necessary and sufficient for correct solutions and use them in problem solving.
However, these eighth graders show limited skill in communicating mathematically.
Proficient
Eighth-grade students performing at the Proficient level should apply mathematical concepts and
procedures consistently to complex problems in the five NAEP content strands.
Eighth graders performing at the Proficient level should be able to conjecture, defend their ideas, and give
supporting examples. They should understand the connections among fractions, percents, decimals, and
other mathematical topics such as algebra and functions. Students at this level are expected to have a
thorough understanding of basic-level arithmetic operations—an understanding sufficient for problem
solving in practical situations.
Quantity and spatial relationships in problem solving and reasoning should be familiar to them, and they
should be able to convey underlying reasoning skills beyond the level of arithmetic. They should be able
to compare and contrast mathematical ideas and generate their own examples. These students should make
inferences from data and graphs, apply properties of informal geometry, and accurately use the tools of
technology. Students at this level should understand the process of gathering and organizing data and be
able to calculate, evaluate, and communicate results within the domain of statistics and probability.
Advanced
Eighth-grade students performing at the Advanced level should be able to reach beyond the recognition,
identification, and application of mathematical rules to generalize and synthesize concepts and principles
in the five NAEP content strands.
Eighth graders performing at the Advanced level should be able to probe examples and counterexamples
to shape generalizations from which they can develop models.
Eighth graders performing at the Advanced level should use number sense and geometric awareness to
consider the reasonableness of an answer. They are expected to use abstract thinking to create unique
problem-solving techniques and explain the reasoning processes underlying their conclusions.

41
NAEP Mathematics Achievement Levels: Grade 12
Basic
Twelfth-grade students performing at the Basic level should demonstrate procedural and conceptual
knowledge in solving problems in the five NAEP content strands.
Twelfth-grade students performing at the Basic level should be able to use estimation to verify solutions
and determine the reasonableness of results as applied to real-world problems. Twelfth graders performing
at the Basic level should recognize relationships presented in verbal, algebraic, tabular, and graphical
forms, and demonstrate knowledge of geometric relationships and corresponding measurement skills.
They should be able to apply statistical reasoning in the organization and display of data and in reading
tables and graphs. They should also be able to generalize from patterns and examples in the areas of
algebra, geometry, and statistics. At this level, they should use correct mathematical language and
symbols to communicate mathematical relationships and reasoning processes and use calculators
appropriately to solve problems.
Proficient
Twelfth-grade students performing at the Proficient level should consistently integrate mathematical
concepts and procedures into the solutions of more complex problems in the five NAEP content strands.
Twelfth graders performing at the Proficient level should demonstrate an understanding of algebraic,
statistical, geometric, and spatial reasoning. They should be able to perform algebraic operations involving
polynomials, justify geometric relationships, and judge and defend the reasonableness of answers as
applied to real-world situations. These students should be able to analyze and interpret data in tabular and
graphical form; understand and use elements of the function concept in symbolic, graphical, and tabular
form; and make conjectures, defend ideas, and give supporting examples.
Advanced
Twelfth-grade students performing at the Advanced level should consistently demonstrate the integration
of procedural and conceptual knowledge and the synthesis of ideas in the five NAEP content strands.
Twelfth-grade students performing at the Advanced level should understand the function concept and be
able to compare and apply the numeric, algebraic, and graphical properties of functions. They should
apply their knowledge of algebra, geometry, and statistics to solve problems in more advanced areas of
continuous and discrete mathematics.
They should be able to formulate generalizations and create models through probing examples and
counterexamples. They should be able to communicate their mathematical reasoning through the clear,
concise, and correct use of mathematical symbolism and logical thinking.

42
Policy Definitions of NAEP Achievement Levels
Advanced
Superior performance.
Proficient
Solid academic performance for each grade assessed. Students reaching this level have demonstrated
competency over challenging subject matter, including subject-matter knowledge, application of
such knowledge to real-world situations, and analytical skills appropriate to the subject matter.
Basic
Partial mastery of prerequisite knowledge and skills that are fundamental for proficient work at each
grade.

43
NAEP Reading Achievement Levels: Grade 4
Advanced
Fourth-grade students performing at the Advanced level should be able to generalize about topics in
the reading selection and demonstrate an awareness of how authors compose and use literary
devices. When reading text appropriate to fourth grade, they should be able to judge texts critically
and, in general, give thorough answers that indicate careful thought.
For example, when reading literary text, Advanced-level students should be able to make
generalizations about the point of the story and extend its meaning by integrating personal
experiences and other readings with ideas suggested by the text. They should be able to identify
literary devices such as figurative language.
When reading informational text, Advanced-level fourth graders should be able to explain the
author’s intent by using supporting material from the text. They should be able to make critical
judgments of the form and content of the text and explain their judgments clearly.
Proficient Fourth-grade students performing at the Proficient level should be able to demonstrate an overall
understanding of the text, providing inferential as well as literal information. When reading text
appropriate to fourth grade, they should be able to extend the ideas in the text by making inferences,
drawing conclusions, and making connections to their own experiences. The connections between
the text and what the student infers should be clear.
For example, when reading literary text, Proficient-level fourth graders should be able to summarize
the story, draw conclusions about the characters or plot, and recognize relationships such as cause
and effect.
When reading informational text, Proficient-level students should be able to summarize the
information and identify the author’s intent or purpose. They should be able to draw reasonable
conclusions from the text, recognize relationships such as cause and effect or similarities and
differences, and identify the meaning of the selection’s key concepts.
Basic Fourth-grade students performing at the Basic level should demonstrate an understanding of the
overall meaning of what they read. When reading text appropriate for fourth graders, they should be
able to make relatively obvious connections between the text and their own experiences, and extend
the ideas in the text by making simple inferences.
For example, when reading literary text, they should be able to tell what the story is generally
about—providing details to support their understanding—and be able to connect aspects of the
stories to their own experiences.
When reading informational text, Basic-level fourth graders should be able to tell what the selection
is generally about or identify the purpose for reading it, provide details to support their
understanding, and connect ideas from the text to their background knowledge and experiences.

44
NAEP Reading Achievement Levels: Grade 8
Advanced
Eighth-grade students performing at the Advanced level should be able to describe the more abstract
themes and ideas of the overall text. When reading text appropriate to eighth grade, they should be able to
analyze both meaning and form and support their analyses explicitly with examples from the text, and
they should be able to extend text information by relating it to their experiences and to world events. At
this level, student responses should be thorough, thoughtful, and extensive.
For example, when reading literary text, Advanced-level eighth graders should be able to make complex,
abstract summaries and theme statements. They should be able to describe the interactions of various
literary elements (i.e., setting, plot, characters, and theme) and explain how the use of literary devices
affects both the meaning of the text and their response to the author’s style. They should be able to
critically analyze and evaluate the composition of the text.
When reading informational text, they should be able to analyze the author’s purpose and point of view.
They should be able to use cultural and historical background information to develop perspectives on the
text and be able to apply text information to broad issues and world situations.
When reading practical text, Advanced-level students should be able to synthesize information that will
guide their performance, apply text information to new situations, and critique the usefulness of the form
and content.
Proficient
Eighth-grade students performing at the Proficient level should be able to show an overall understanding
of the text, including inferential as well as literal information. When reading text appropriate to eighth
grade, they should be able to extend the ideas in the text by making clear inferences from it, by drawing
conclusions, and by making connections to their own experiences—including other reading experiences.
Proficient eighth graders should be able to identify some of the devices authors use in composing text.
For example, when reading literary text, students at the Proficient level should be able to give details and
examples to support themes that they identify. They should be able to use implied as well as explicit
information in articulating themes; to interpret the actions, behaviors, and motives of characters; and to
identify the use of literary devices such as personification and foreshadowing.
When reading informational text, they should be able to summarize the text using explicit and implied
information and support conclusions with inferences based on the text.
When reading practical text, Proficient-level students should be able to describe its purpose and support
their views with examples and details. They should be able to judge the importance of certain steps and
procedures.
Basic Eighth-grade students performing at the Basic level should demonstrate a literal understanding of what
they read and be able to make some interpretations. When reading text appropriate to eighth grade, they
should be able to identify specific aspects of the text that reflect the overall meaning, extend the ideas in
the text by making simple inferences, recognize and relate interpretations and connections among ideas in
the text to personal experience, and draw conclusions based on the text.

45
For example, when reading literary text, Basic-level eighth graders should be able to identify themes and
make inferences and logical predictions about aspects such as plot and characters.
When reading informational text, they should be able to identify the main idea and the author’s purpose.
They should make inferences and draw conclusions supported by information in the text. They should
recognize the relationships among the facts, ideas, events, and concepts of the text (e.g., cause and effect,
order).
When reading practical text, they should be able to identify the main purpose and make predictions about
the relatively obvious outcomes of procedures in the text.

46
MCAS Performance Level Definitions
General Performance Level Definitions
ADVANCED
Students at this level demonstrate a comprehensive and in-depth understanding of rigorous subject matter, and
provide sophisticated solutions to complex problems.
PROFICIENT
Students at this level demonstrate a solid understanding of challenging subject matter and solve a wide variety of
problems.
NEEDS IMPROVEMENT
Students at this level demonstrate a partial understanding of subject matter and solve some simple problems.
WARNING/FAILING
Students at this level demonstrate a minimal understanding of subject matter and do not solve simple problems.

47
Content-Specific Performance Level Definitions
English Language Arts
Student results on the MCAS tests are reported according to four performance levels: Warning/Failing, Needs
Improvement, Proficient, and Advanced. The selected descriptors below illustrate the kinds of knowledge and skills
students demonstrate on MCAS at each level. Knowledge and skills are cumulative at each level. No descriptors are
provided for the Warning/Failing performance level because student work at this level, by definition, does not meet
the criteria of the Needs Improvement level.
English Language Arts Curriculum Framework Core Concept: The goal of an English language arts curriculum is
to teach learners how to reason and use language purposefully as they comprehend, construct, and convey meaning.
Needs Improvement
On MCAS, a student
at this level:
Proficient On
MCAS, a student at
this level:
Advanced On MCAS, a student at this
level:
Language/ demonstrates a
modest reading
vocabulary and partial
understanding of word
parts and word
relationships (e.g.,
prefixes, roots,
suffixes, synonyms,
antonyms)
demonstrates a
solid reading
vocabulary and
general
understanding of
word parts and word
relationships (e.g.,
prefixes, roots,
suffixes, synonyms,
antonyms)
demonstrates a comprehensive reading
vocabulary and in-depth understanding of
word parts and word relationships (e.g.,
prefixes, roots, suffixes, synonyms,
antonyms)
Vocabulary
Comprehension demonstrates an
understanding of
concrete ideas, but
only partial
understanding of
abstract or implied
ideas, in grade-
appropriate texts
demonstrates an
understanding of
many concrete ideas,
and most abstract and
implied ideas, in
grade-appropriate
texts
demonstrates an in-depth understanding
of concrete and abstract ideas and complex
meanings in grade-appropriate texts
connects some ideas
within texts
connects ideas
within texts and
provides supporting
evidence
connects complex ideas within texts and
provides well-reasoned and well-supported
arguments

48
Text Elements shows partial
understanding of how
structure and genre
enhance the author’s
purpose or theme
shows clear
understanding of
structure and
elements of genre
and how they support
the author’s purpose
or theme
critically evaluates how structure and
elements of genre support the author’s
purpose or theme
and Techniques identifies obvious
examples of some
techniques authors use
(e.g., repetition,
exaggeration, and
figurative language)
identifies more
subtle examples of
techniques authors
use in a variety of
texts (e.g., repetition,
exaggeration, and
figurative language)
as grade-appropriate
identifies and critically evaluates
techniques authors use in a wide variety of
texts (e.g., repetition, exaggeration, and
figurative language)
Composition writes partially
organized
compositions with
modestly developed
ideas, some supporting
detail, and some
demonstration of focus
writes well-
organized
compositions with
logically developed
ideas, adequate
detail, and clear
focus
writes well-organized, richly developed
compositions with ideas that are clearly
expressed and supported by extensive detail
uses simplistic
language and sentence
structure
engages reader’s
interest through use
of a variety of
language choices and
sentence structures
provokes and sustains the reader’s
interest through effective and precise
language, sentence structure, and
vocabulary
Writing
Conventions
writes compositions
with partial control of
the standard English
conventions of
grammar, spelling,
punctuation, and usage
writes
compositions with
solid control of the
standard English
conventions of
grammar, spelling,
punctuation, and
usage
writes compositions with sophisticated
control of the standard English conventions
of grammar, spelling, punctuation, and
usage

49
Mathematics
Student results on the MCAS tests are reported according to four performance levels: Warning/Failing, Needs
Improvement, Proficient, and Advanced. The selected descriptors below illustrate the kinds of knowledge and skills
students demonstrate on MCAS at each level. Knowledge and skills are cumulative at each level. No descriptors are
provided for the Warning/Failing performance level because student work at this level, by definition, does not meet
the criteria of the Needs Improvement level.
Mathematics Curriculum Framework Core Concept: Students develop mathematical power through problem
solving, communication, reasoning, and connections.
Needs Improvement
On MCAS, a student
at this level:
Proficient On
MCAS, a student at
this level:
Advanced On MCAS, a student at this
level:
Conceptual demonstrates partial
understanding of our
numeration system
demonstrates solid
understanding of our
numeration system
connects concepts from various areas of
mathematics, and uses concepts to develop
generalizations
Understanding performs some
calculations and
estimations
performs most
calculations and
estimations
performs complex calculations and
estimations
and identifies examples of
basic math concepts
defines concepts and
generates examples
and counterexamples
of concepts
selects the best representation for a given
set of data and purpose
Procedural reads and constructs
graphs, tables, and
charts
represents data and
mathematical
relationships in
multiple forms (e.g.,
equations, graphs)
Knowledge
Problem applies learned
procedures to solve
routine problems
applies learned
procedures and
mathematical
concepts to solve a
variety of problems,
including multi-step
problems
generates unique strategies and
procedures to solve non-routine problems Solving
Mathematical applies some reasoning
methods to solve
simple problems
uses a variety of
reasoning methods to
solve problems
uses multiple reasoning methods to solve
complex problems
Reasoning explains steps and
procedures
justifies strategies and solutions

50
Mathematical identifies and uses
basic mathematical
terms
uses various forms
of representation
(e.g., text, graphs,
symbols) to illustrate
steps to a solution
uses various forms of representation (e.g.,
text, graphs, symbols) to justify solutions
and solution strategies Communication