comparison of two optical systems for protein ...xraysweb.lbl.gov › pxbeamline ›...
TRANSCRIPT

Comparison of two optical systems for protein crystallography: Sagittal focusing using crystal or mirror optics.
H. A. Padmore Feb 10th 2000
1. Introduction Previous studies have shown that employing an optical system for protein crystallography consisting of a parabolic cylinder M1 mirror to provide parallel light in the vertical direction, a plane 1st crystal (C1), a sagittallly focusing 2nd crystal (C2), and a 2nd parabolic cylinder mirror M2 to produce vertical focusing provides an aberration free image when used at 1:1 horizontal magnification. Such a system is shown in Fig. 1. The use of 1:1 horizontal magnification was initially chosen so as to avoid aberrations that would occur at other magnifications. It is well known that 3:1 demagnification offers the optimum matching of Bragg planes between the 1st and 2nd crystals but introduces optical aberrations. However, the 1:1 geometry for the small horizontal acceptances typical in protein crystallography provides near perfect Bragg angle matching with aberration free imaging. In this note we will examine the use of other magnifications to see their effect on aberrations. While the sagittal focusing crystal design has the advantage of near perfect focusing, it involves the difficult technology of bending a thin crystal, typically 1 mm thick, to a radius of typically 1 – 2 m. Assuming a premirror of length 800 mm with a grazing angle of 4 milliradians, and the monochromator at 15 m from the source with a horizontal acceptance of 3 milliradians, then the illuminated area on the sagittal crystal for Si[111] at 12.6 keV would be 20 mm (tangential) by 45 mm (sagittal). Assuming that we would like aberrations to be less than half of the design collimator size (0.1 mm) in the vertical direction (this criterion is used as the aberration free image size is very much smaller than the collimator), and less than half the image size in the horizontal direction, then assuming an image distance in the vertical direction of 3.25 m (2:1 demagnification) and an image distance in the horizontal direction of 15 m (1:1), then the slope error tolerance for Si[111] at 12.6 keV would be 8 µrad (FWHM) tangential by 42 µrad (FWHM) sagittal. While the sagittal tolerance is reasonably large, and in fact there are several examples of near perfect horizontal focusing for similar crystal sizes, the 8 µrad tolerance is much more difficult to achieve, and to my knowledge has not been demonstrated for similar conditions. This has led us to examine the mechanics of thin crystal bending in detail, and it is clear that while technologically possible, it may not provide the robust level of performance we would desire. In addition the beamlines we are considering are all optimized for MAD crystallography. This involves precise control of wavelength and ideally repeatable intensity passing through the collimator after wavelength changes. The latter requirement calls for precise bending of the sagittaly bent crystal for each wavelength, and highly stable pointing accuracy. If we assume that the roll tolerance of the crystal is given by a maximum motion of the beam of 1/10th of the beam size at 1:1 focusing (24 µm FWHM, with an image distance of 15 m), then the angular roll tolerance is approximately 5 µrads. This means that the bending mechanism would have to stay in the same orientation to this value, or level to 0.2 µm over the 45 mm width of the crystal. This is an extremely tight tolerance, and clearly for reliable operation the best way of proceeding would be to use the crystal roll in a servo loop with a horizontal position sensor close to the collimator. These and other difficulties have motivated a search for a more robust solution.
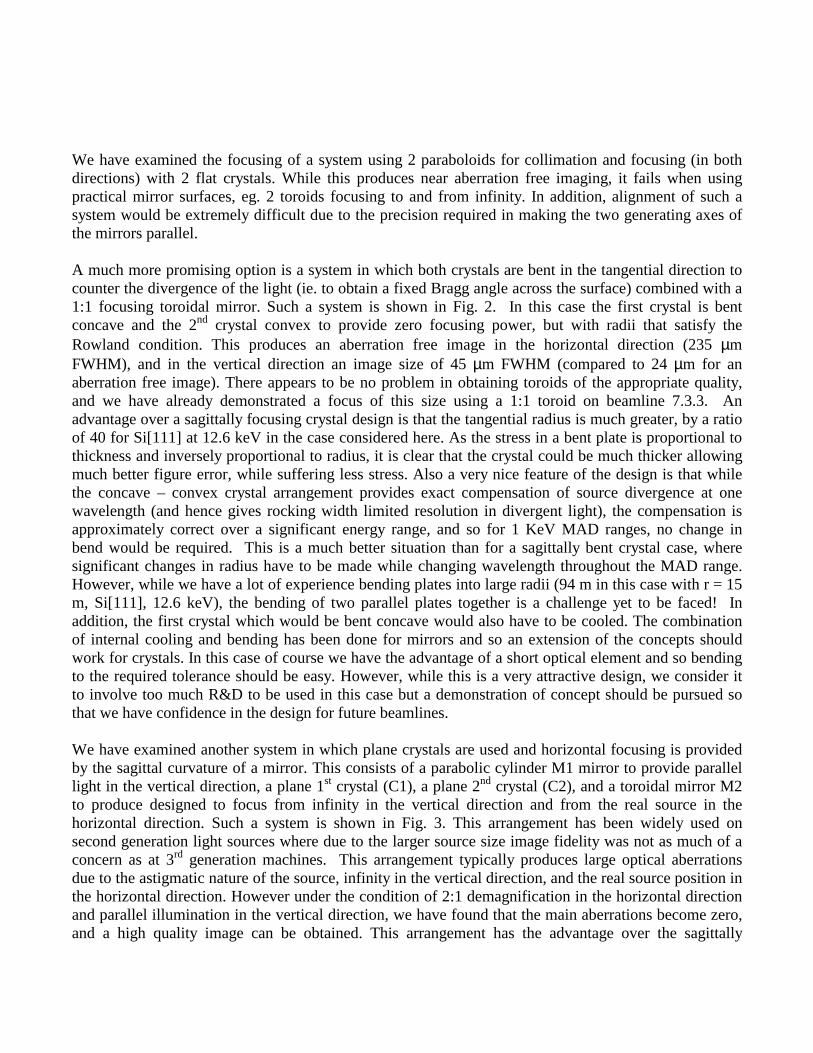
We have examined the focusing of a system using 2 paraboloids for collimation and focusing (in both directions) with 2 flat crystals. While this produces near aberration free imaging, it fails when using practical mirror surfaces, eg. 2 toroids focusing to and from infinity. In addition, alignment of such a system would be extremely difficult due to the precision required in making the two generating axes of the mirrors parallel. A much more promising option is a system in which both crystals are bent in the tangential direction to counter the divergence of the light (ie. to obtain a fixed Bragg angle across the surface) combined with a 1:1 focusing toroidal mirror. Such a system is shown in Fig. 2. In this case the first crystal is bent concave and the 2nd crystal convex to provide zero focusing power, but with radii that satisfy the Rowland condition. This produces an aberration free image in the horizontal direction (235 µm FWHM), and in the vertical direction an image size of 45 µm FWHM (compared to 24 µm for an aberration free image). There appears to be no problem in obtaining toroids of the appropriate quality, and we have already demonstrated a focus of this size using a 1:1 toroid on beamline 7.3.3. An advantage over a sagittally focusing crystal design is that the tangential radius is much greater, by a ratio of 40 for Si[111] at 12.6 keV in the case considered here. As the stress in a bent plate is proportional to thickness and inversely proportional to radius, it is clear that the crystal could be much thicker allowing much better figure error, while suffering less stress. Also a very nice feature of the design is that while the concave – convex crystal arrangement provides exact compensation of source divergence at one wavelength (and hence gives rocking width limited resolution in divergent light), the compensation is approximately correct over a significant energy range, and so for 1 KeV MAD ranges, no change in bend would be required. This is a much better situation than for a sagittally bent crystal case, where significant changes in radius have to be made while changing wavelength throughout the MAD range. However, while we have a lot of experience bending plates into large radii (94 m in this case with r = 15 m, Si[111], 12.6 keV), the bending of two parallel plates together is a challenge yet to be faced! In addition, the first crystal which would be bent concave would also have to be cooled. The combination of internal cooling and bending has been done for mirrors and so an extension of the concepts should work for crystals. In this case of course we have the advantage of a short optical element and so bending to the required tolerance should be easy. However, while this is a very attractive design, we consider it to involve too much R&D to be used in this case but a demonstration of concept should be pursued so that we have confidence in the design for future beamlines. We have examined another system in which plane crystals are used and horizontal focusing is provided by the sagittal curvature of a mirror. This consists of a parabolic cylinder M1 mirror to provide parallel light in the vertical direction, a plane 1st crystal (C1), a plane 2nd crystal (C2), and a toroidal mirror M2 to produce designed to focus from infinity in the vertical direction and from the real source in the horizontal direction. Such a system is shown in Fig. 3. This arrangement has been widely used on second generation light sources where due to the larger source size image fidelity was not as much of a concern as at 3rd generation machines. This arrangement typically produces large optical aberrations due to the astigmatic nature of the source, infinity in the vertical direction, and the real source position in the horizontal direction. However under the condition of 2:1 demagnification in the horizontal direction and parallel illumination in the vertical direction, we have found that the main aberrations become zero, and a high quality image can be obtained. This arrangement has the advantage over the sagittally

focusing crystal arrangement that wavelength changes do not move the horizontal focus, and so provides a more robust platform for MAD measurements. We will examine this arrangement in detail in this note. The light source for this study is a 5 T superconducting bending magnet source at the ALS, with assumed electron beam sizes of 100 µm (h) x 10 µm (v) rms, an electron energy of 1.9 GeV, and emittances of 6x10⁻⁹ m.rads (h) and 1x10⁻¹⁰ m.rads (v). The collimator size used to define the beam size depends on the size of crystal to be examined, and the angular convergence is dependent on the unit cell size. It appears that 0.1 mm collimator sizes are commonly used, and is in fact the standard size used on beamline 5.0.2. The required angular resolution is set by the mosaic spread of the crystal, and ultimately by the wavelength and unit cell size. These are crystal dependent, and so here we adopt the commonly used value of 3 mrads. The collimator size and the required angular convergence therefore set the phase space area at the sample, and therefore the useful phase space area at the source. In order to conserve the convergence on the sample at 3 mrads for differing demagnification ratios, the source acceptance must be adjusted. For example at 2:1 demagnification, a source acceptance of only 1.5 mrads could be used. This design rule is used throughout this note. We are primarily interested in optimizing the transmission through the collimator in the defined angular resolution of 3 mrads. However an important consideration is the shape of the beam on the detector; a beam can have good image properties at the focus, but could for example be curved at the detector, leading to problems in intensity integration. This issue is therefore also examined for both the sagittally focusing crystal and sagittally focusing mirror designs. 2. Sagittally focusing crystal design
The layout of this design is shown in Fig. 1. The M1 mirror is used to produce vertically collimated light, and is a parabolic shape in the tangential direction and plane in the sagittal direction. In practice it will be produced by bending a flat substrate into an approximation to a parabolic form by the application of unequal end couples. The crystal monochromator has a flat first crystal and a sagittally bent 2nd crystal designed to focus from the source to the sample. The M2 mirror is similar to M1 and is used to focus in the vertical direction from infinity to the sample. The intermediate planes shown as dotted lines in Fig. 1 are ‘continuation planes’ used within Shadow; in this case these planes were located typically half way between elements. ShadowVUI running under XOP (developed by M. del Rio, ESRF, as a graphical interface to Shadow) was used for the raytrace modeling. Note that the units given in the modeling output are in cm. Fig. 4 shows the raytrace result for the case of 1:1 horizontal focusing and 2:1 vertical focusing. The distance from the source to M1 was 6.5 m, from the source to the sagittally focusing crystal 15 m, the horizontal source acceptance was 3 mrads, the mirror grazing angles were 4 mrads, the M2 image distance was 3.25 m, and the sagittal crystal radius was 2.47 m. All optics were large enough to collect the full range of radiation angles, and a photon energy of 12 KeV was used. The image size fitted to a gaussian profile is 239 (h) x 12 (v) µm FWHM. This is almost exactly the value expected for an aberration free system. Examination of the energies in the focused beam gave a bandwidth of 1.57 eV, again very close to the expected value from the intrinsic rocking curve width. The throughput was compared to that of 2 flat

crystals and was found to be slightly lower at 93%. This is due to the imperfect Bragg angle matching between the two crystals when used at 1:1 magnification. To demonstrate this point, Fig. 5 shows an image 0.1 m downstream of the 2nd crystal. This shows the expected truncation at +/- 22.5 mm (+/- 1.5 mrads at 15 m from the source), but shows the intensity reduces slightly towards the outside of the beam. This is due to the increasingly imperfect Bragg angle matching at larger source angles. To emphasize this, Fig. 6 shows the same image but for a source aperture of 7 mrads. This should therefore extend to + / - 53 mm, but clearly has decreased to zero by this point due to the Bragg angles of the 2nd crystal at the edges not overlapping with the 1st crystal reflecting range. The intensity relative to a flat crystal system has reduced to 48% due to the Bragg angle mismatching. Fig. 7 shows the image 1 m downstream of the focus point for a horizontal source acceptance of 3 mrads. This is the expected width of + / - 1.5 mm with a roll off at the edges characteristic of the image size at the focus (240 µm). In the case where a collimator is used, the overall width would be the same (dominated by divergence) but the roll off at the edges would be approximately twice as sharp as given here. The beam width in the vertical direction is approximately 0.75 mm FWHM, given by the vertical divergence of the source and the vertical demagnification of 2:1. Overall the beam is reasonably symmetric in each plane and clearly it would be easy to integrate due to the lack of aberrations. We next will look at the same monochromator system with 2:1 horizontal focusing, and preserving the 2:1 vertical focusing we previously had. The object distance for the sagitally focusing crystal in this case is 20 m and the image distance 10m; this preserves the overall beamline length at 30 m.. Again a photon energy of 12 KeV is used, with a source to premirror distance of 6.5 m, and a sagittal crystal radius of 2.197 m. To preserve the horizontal convergence at 3 mrads, only 1.5 mrads is accepted from the source. The image at the focus point is shown in Fig. 8, and it can be seen that the image is aberration free in the horizontal direction (117 µm, FWHM), with a slightly enlarged image (17 µm FWHM) in the vertical direction. Fig 9 shows the image 0.1 m downstream of the sagittally bent crystal, and it can be see that it has the correct width of + / - 15 mm (+ / - 0.75 mrads at 20 m), and a flatter distribution. The latter is due to a better Bragg angle matching between the 1st and 2nd crystals, as we are now closer to the optimum demagnification for matching of 3:1. This increases the throughput relative to a 2 plane crystal case to 98.7% compared to 93% for the 1:1 demagnification case. Fig. 10 shows the image 1 m downstream of the focus. This is very similar to the 1:1 demagnification case, with a horizontal width of + / - 1.5 mm, and a vertical width of 0.75 mm FWHM. The role off at the edge of the horizontal image is slightly sharper in this case as the image width at the focus has been reduced by a factor of 2, and so this contributes less to the edges of the divergent beam. Finally we examine the same case with a source acceptance in the horizontal direction of 3 mrads (ie. 6 mrads horizontal convergence). Fig. 11 shows the image at the focus point; it is essentially the same as the 1.5 mrad source acceptance case in the horizontal direction, but now gives a significant aberration in the vertical direction; however the full width of this is still only 80µm with 50% of the intensity being within 30µm in the vertical direction. 3. Sagittally focusing mirror design The optical scheme is shown in Fig. 3, and consists of the same M1 parabolic premirror and flat C1 crystal, with now a flat C2 crystal and a toroidal mirror M2. The function of M2 is to focus from infinity in the vertical direction and from the real source in the horizontal direction to a stigmatic focus. The results are shown in Fig. 12 (1:1), Fig. 13 (1.5:1), Fig. 14 (2:1), Fig. 15 (2.5:1) where the number in

brackets is the demagnification. In each case the horizontal source acceptance was adjusted to give a horizontal convergence at the focus of 3 mrads. The input data and results are summarized in Table 1. D r r’ R ρ φ h core h fwzh v core v fwzh sym m m m cm mrads mm mm mm mm 1 15.75 15.75 7875 6.3 3 0.35 4 0.2 4.4 ^ 1.5 18.9 12.6 6300 6.048 2 0.2 2 0.1 1.1 ^ 2 21 10.5 5250 5.6 1.5 0.15 0.8 0.067 0.18 o 2.5 22.5 9 4500 5.143 1.2 0.12 0.6 0.1 0.6 v
Table 1. Input parameters (normal type) and output parameters (bold type) from the results given in Figs. 12 – 15, where D is the demagnification, r is the M2 horizontal object distance, r’ is the M2 image distance, R is the M2 tangential radius (focusing from infinity to the real stigmatic image), ρ is the M2 sagittal radius (focusing from the real source to real image), and φ is the horizontal acceptance from the source. h core is the fwhm size of the gaussian core of the image in the horizontal direction, h FWZH is the size of the extremes of the image in the horizontal direction, v core is the fwhm size of the gaussian core of the image in the vertical direction, v FWZH is the size of the extremes of the image in the vertical direction. Sym represents the symmetry of the image.
The striking conclusion is that there is a condition at 2:1 demagnification that eliminates all of the gross aberration present at other demagnifications. At 1:1 demagnification the image has huge tails in the vertical direction and has an inverted V symmetry. The image becomes almost symmetric at 2:1 demagnification and at 2.5 :1 demagnification the image has the symmetry of a V. Note that the estimation of the core width is only approximate, but in the horizontal direction shows the expected reduction as the demagnification increases. At 2:1 demagnification the horizontal beam size should be 0.117 mm FWHM, and in fact the image has a core of 0.15 mm FWHM and relatively small wings. In the vertical direction the beamsize is well represented by a gaussian of 0.067 mm FWHM. Note that in the vertical direction, unlike the sagittal focusing geometry chosen above, the system magnifies by a ratio of 10.5 m (M2 image distance) / 6.5 m (M1 object distance) = 1.62, and so we should expect to see a vertical beam size of 0.038 mm. Fig. 16 shows the image 1 m downstream from the focus. The image has a FWHM of 3 mm in the horizontal direction as expected for a 3 mrad divergent beam at 1m, but with wings extending to 4 mm. In the vertical direction the FWHM is 0.4 mm with wings extending to 0.8 mm. In all these simulations note the scale change between images, and between axes. In this case the vertical axis is extended by a factor of 5 relative to the horizontal, and so the curvature of the image is exaggerated. The image shape is less symmetric than in the sagittal focusing case, but due to the use of a magnifying geometry in this case, the area of the beam is less.

v FWHM v FWZH h FWHM h FWZH mm mm mm mm mirror 0.4 0.8 3 4.2 crystal 0.8 1.6 3 3.6
Table 2. Image size 1 m downstream of the focus for horizontal focusing with a toroidal mirror and with a sagittally focusing crystal, both with 3 mrads horizontal convergence.
This comparison is summarized in Table 2. The main difference is that the vertical extent of the toroidal mirror case is much smaller than the sagittally focusing crystal case. This is due to the fact that the toroidal mirror case magnifies by 1.62 in the vertical direction, whereas the sagittally focusing crystal case demagnifies in the vertical direction by 2:1. It would be possible to reduce the demagnification in the latter case, or even to magnify, but a high demagnification reduces the slope error requirement for the tangential direction of the C2 sagittally bent crystal. As the tolerance for this is already extremely hard to meet, increasing the M2 image distance to lower the demagnification is not really a practical option. From these arguments it can be see that the toroidal mirror system is desirable from the point of view of image shape at the detector. Figs. 17 and 18 show the image 0.5 and 0.25 m downstream of the focus respectively. The results from these images and the case of 1 m are given in Table 3. Image plane v FWHM v FWZH h FWHM h FWZH to focus (m) mm mm mm mm 1 0.4 0.8 3 4.2 0.5 0.23 0.4 1.6 2.6 0.25 0.13 0.26 0.8 1.6
Table 3. Image size at 1, 0.5 and 0.25 m downstream of the focus for horizontal focusing with a toroidal mirror and 3 mrads horizontal convergence.
Figs. 19 – 21 show the same cases as above, but for the case where the horizontal convergence angle has been reduced to 1 mrad from 3 mrads (ie. a source acceptance in the horizontal direction of 0.5 mrad). The results from these images are shown in Table 4. As before we have characterized the images by their full width at half maximum (FWHM) and their full width at zero height (ie. most extreme rays; FWZH). Image plane v FWHM v FWZH h FWHM h FWZH to focus (m) mm mm mm mm 1 0.24 0.49 1 1.6 0.5 0.14 0.27 0.5 0.85 0.25 0.075 0.19 0.24 0.52
Table 4. Image size at 1, 0.5 and 0.25 m downstream of the focus for horizontal focusing with a toroidal mirror and 1 mrads horizontal convergence.

The appropriate camera length (sample – detector) and convergence is dependent on the unit cell size. In tables 3 and 4 we have highlighted the two extreme conditions, small unit cell dimensions (eg.10 nm) with the detector close and a 3 mrad convergence angle, and large unit cells (eg. 50 nm) with the detector at 1 m and a 1 mrad convergence angle. 4. Relative flux for the sagittally focusing mirror and crystal cases. There will be differences in the relative flux for the two designs due to the following effects;
a. mismatch of the Bragg angles on the sagittally bent crystal b. reduction in effective aperture due to the toroid sagittal curvature c. focusing quality relative to the 0.1 mm diameter collimator size
We will make this comparison for both designs operating at a horizontal demagnification of 2:1 at 12 KeV. At 2:1 demagnification the Bragg angles are well matched in the sagittally bent crystal case, and as shown before, the relative transmission in comparison to a 2 plane crystal monochromator is 0.987 (compared to 0.93 for 1:1 magnification). The raytraces up to this point have been done with optical elements sized to accept the whole range of angles from the source. As the toroid has a deep sagittal curvature, this effectively reduces the vertical aperture for a finite length mirror. The mirror is at 21 m from the source and intercepts 1.5 mrads and so the width on the mirror is + / - 15.75 mm from the center. The sagittal radius of curvature is 56 mm, and so the depth of the toroidal surface is 2.21mm. The length of the arc on the toroid surface in the tangential direction of the mirror made by the intersection of a plane with the mirror surface is 2.21mm / 0.004 where the latter term is the grazing incidence angle. The arc length is therefore 552 mm. As the pre-mirror is 800 mm, to ensure no loss due to the sagittal curvature effect, the mirror would have to be 1352 mm long. This is longer than generally made, and in addition we have to consider the details of the source distribution in the vertical direction to decide what is a reasonable length for the mirror. In order to investigate the optimum length of mirror and the overall transmission, we have examined 3 cases, with M2 being 800 mm, 1000 mm and 1200 mm long. The results are given in Table 5. M2 length C1 (inf) C1(M1) C2 (inf) C2 (M1) M2 (M1) 100µµµµm ap. 800 mm 2456 2198 1878 1679 1301 625 1000 mm 2456 2198 1878 1679 1447 659 1200 mm 2456 2198 1878 1679 1555 667
Table 5. The table shows the transmission of the system at a photon energy of 12 keV using toroidal mirror focusing.
The table shows the transmission after the first crystal (C1), second crystal (C2), the toroidal mirror (M2) and a 100 micron square aperture. (inf) means that the M1 mirror is sufficient in length to collect all the radiation and (M1) means that the real length of the M1 mirror (800 mm) has been included. The
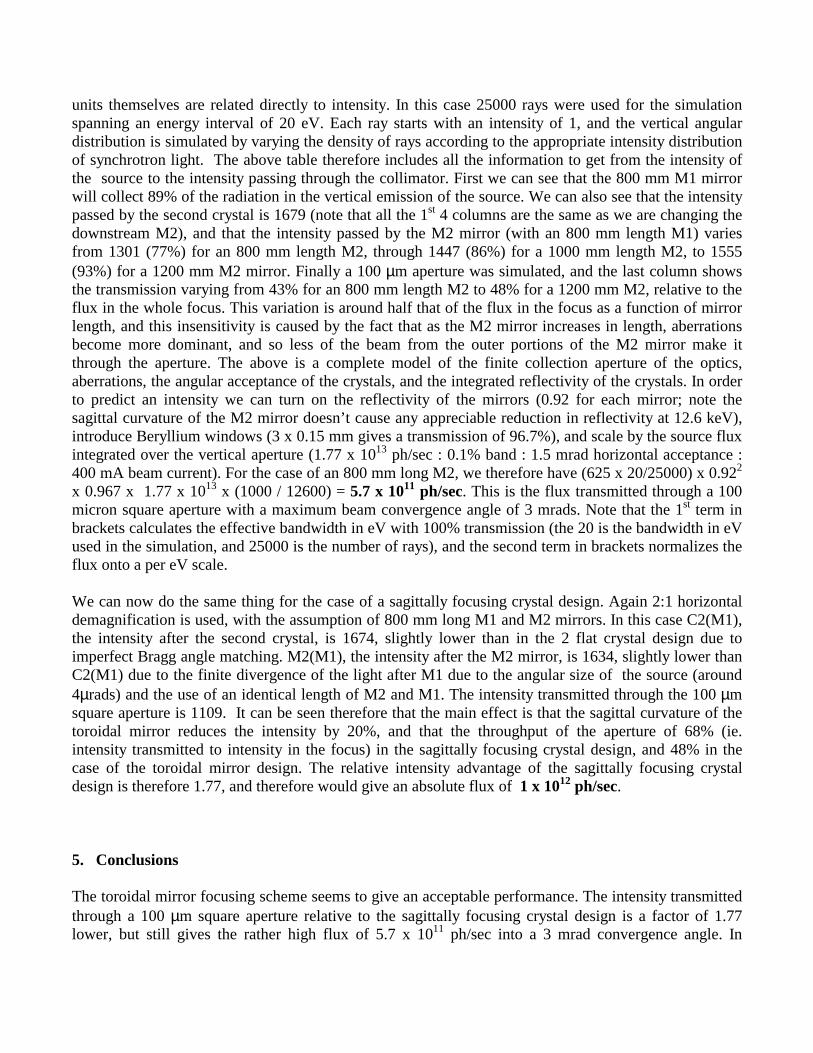
units themselves are related directly to intensity. In this case 25000 rays were used for the simulation spanning an energy interval of 20 eV. Each ray starts with an intensity of 1, and the vertical angular distribution is simulated by varying the density of rays according to the appropriate intensity distribution of synchrotron light. The above table therefore includes all the information to get from the intensity of the source to the intensity passing through the collimator. First we can see that the 800 mm M1 mirror will collect 89% of the radiation in the vertical emission of the source. We can also see that the intensity passed by the second crystal is 1679 (note that all the 1st 4 columns are the same as we are changing the downstream M2), and that the intensity passed by the M2 mirror (with an 800 mm length M1) varies from 1301 (77%) for an 800 mm length M2, through 1447 (86%) for a 1000 mm length M2, to 1555 (93%) for a 1200 mm M2 mirror. Finally a 100 µm aperture was simulated, and the last column shows the transmission varying from 43% for an 800 mm length M2 to 48% for a 1200 mm M2, relative to the flux in the whole focus. This variation is around half that of the flux in the focus as a function of mirror length, and this insensitivity is caused by the fact that as the M2 mirror increases in length, aberrations become more dominant, and so less of the beam from the outer portions of the M2 mirror make it through the aperture. The above is a complete model of the finite collection aperture of the optics, aberrations, the angular acceptance of the crystals, and the integrated reflectivity of the crystals. In order to predict an intensity we can turn on the reflectivity of the mirrors (0.92 for each mirror; note the sagittal curvature of the M2 mirror doesn’t cause any appreciable reduction in reflectivity at 12.6 keV), introduce Beryllium windows (3 x 0.15 mm gives a transmission of 96.7%), and scale by the source flux integrated over the vertical aperture (1.77 x 10¹³ ph/sec : 0.1% band : 1.5 mrad horizontal acceptance : 400 mA beam current). For the case of an 800 mm long M2, we therefore have (625 x 20/25000) x 0.922 x 0.967 x 1.77 x 1013 x (1000 / 12600) = 5.7 x 10¹¹ ph/sec. This is the flux transmitted through a 100 micron square aperture with a maximum beam convergence angle of 3 mrads. Note that the 1st term in brackets calculates the effective bandwidth in eV with 100% transmission (the 20 is the bandwidth in eV used in the simulation, and 25000 is the number of rays), and the second term in brackets normalizes the flux onto a per eV scale. We can now do the same thing for the case of a sagittally focusing crystal design. Again 2:1 horizontal demagnification is used, with the assumption of 800 mm long M1 and M2 mirrors. In this case C2(M1), the intensity after the second crystal, is 1674, slightly lower than in the 2 flat crystal design due to imperfect Bragg angle matching. M2(M1), the intensity after the M2 mirror, is 1634, slightly lower than C2(M1) due to the finite divergence of the light after M1 due to the angular size of the source (around 4µrads) and the use of an identical length of M2 and M1. The intensity transmitted through the 100 µm square aperture is 1109. It can be seen therefore that the main effect is that the sagittal curvature of the toroidal mirror reduces the intensity by 20%, and that the throughput of the aperture of 68% (ie. intensity transmitted to intensity in the focus) in the sagittally focusing crystal design, and 48% in the case of the toroidal mirror design. The relative intensity advantage of the sagittally focusing crystal design is therefore 1.77, and therefore would give an absolute flux of 1 x 10¹² ph/sec. 5. Conclusions The toroidal mirror focusing scheme seems to give an acceptable performance. The intensity transmitted through a 100 µm square aperture relative to the sagittally focusing crystal design is a factor of 1.77 lower, but still gives the rather high flux of 5.7 x 10¹¹ ph/sec into a 3 mrad convergence angle. In

comparison to the measured flux on beamline 5.0.2 of 5 x 10¹⁰ ph/sec into nominally the same convergence angle, this is a factor of 11 higher. In terms of radiation damage, if we assume that the radiation is uniformly distributed over the 100 µm square aperture, we would expect the typical threshold for damage at 0.3 nm resolution of 1 x 10¹⁰ ph/µm2 integrated incident flux to be reached in 175 seconds. In the case of large unit cell crystals, the horizontal convergence angle will be reduced to around 1 mrad, corresponding to a collection angle from the source of 0.5 mrads. This will increase data collection times by a factor of 3, but these still will be significantly shorter than at present. In view of these considerations, given the robustness of a mirror focusing system over a sagittally bent crystal design, it is recommended that we adopt a toroidal mirror focusing system for future protein crystallography beamlines. The issue of alignment needs to be considered in detail, especially for the M2 toroidal mirror. In general, the assumption is usually made that the yaw tolerance is the most critical and should be set within ½ of the horizontal angular subtense of the source to achieve good focusing. In this case, we have a small vertical beam size and so we have to carefully consider whether this is a valid approximation. From a practical standpoint we need to consider how many degrees of freedom are necessary for the mirror motion, taking into account expected source motion. Finally, we ought to consider the issue of the optimum crystal separation, and whether x-y adjustment of the crystals will be required. Due to the small vertical beam size at the C1 crystal (due to the fact that the collimating mirror is inside the shield wall), it appears to be unnecessary to change the x – y position of the 2nd crystal to keep constant exit height, if the crystal separation is kept small. This in principle means that one could use a channel-cut crystal design with no adjustments except rotation. This in turn opens the possibility of easy cryo-cooling of the crystals with the benefit of stability that this will bring. A downside of this is that changes in horizontal beam position would have to corrected by small rolls of the channel-cut crystal pair, or the whole monochromator. As these motions involve rotations of typically 30 µrad for one image width at the collimator, these could be done simply by using a high precision jack screw on one of the supports of the monochromator. The above issues will be subject of a future note.
s a b c d e f g
i
M1 C1 C2 M2
s i
PLAN
ELEVATION
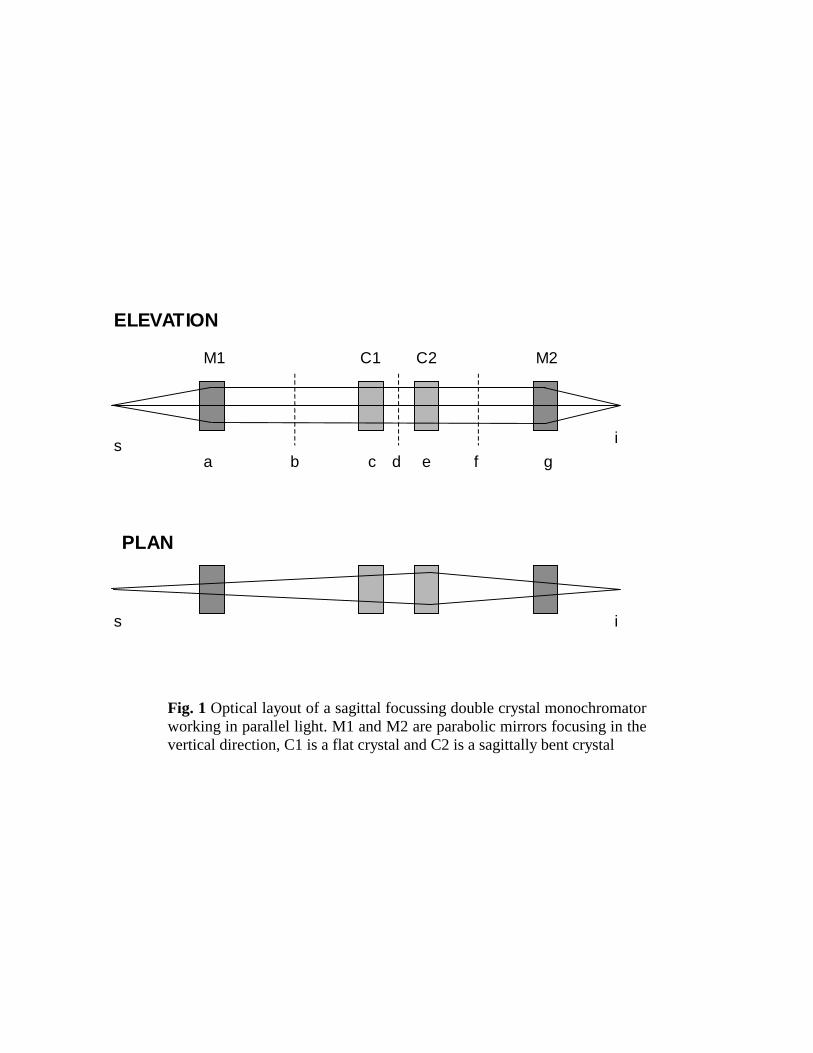
Fig. 1 Optical layout of a sagittal focussing double crystal monochromator working in parallel light. M1 and M2 are parabolic mirrors focusing in the vertical direction, C1 is a flat crystal and C2 is a sagittally bent crystal
s a b c d e f
i
C1 C2 M1
s i
PLAN
ELEVATION
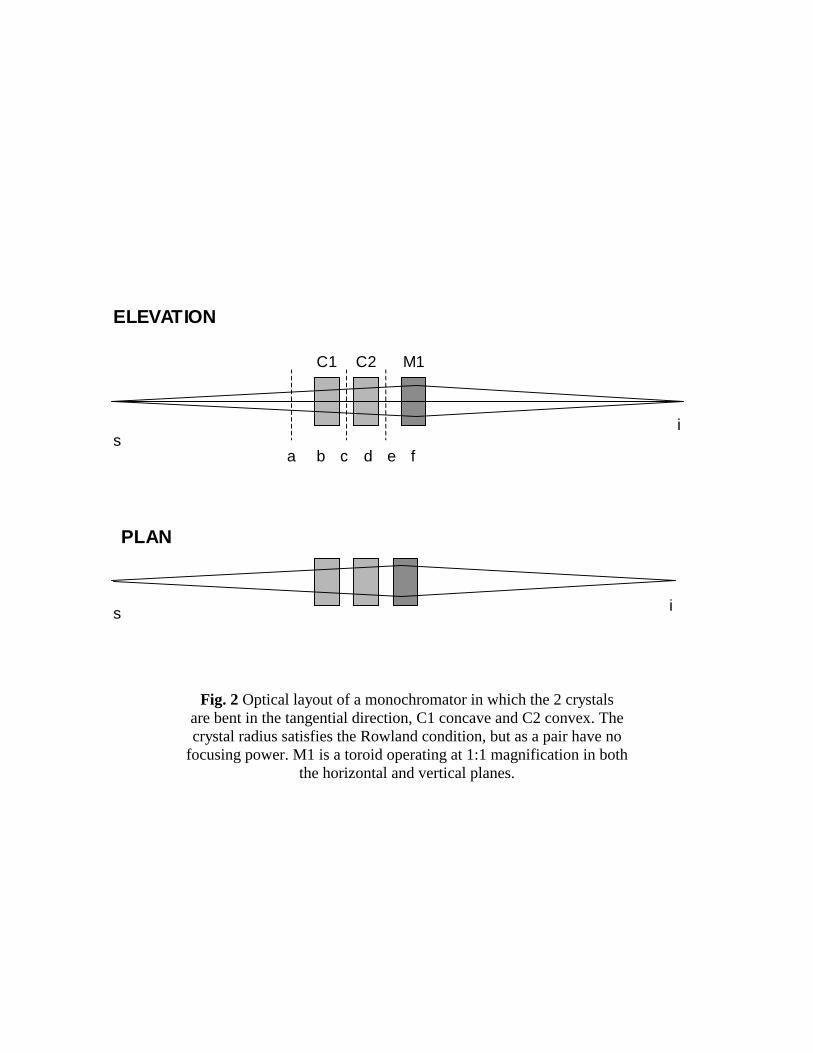
Fig. 2 Optical layout of a monochromator in which the 2 crystals are bent in the tangential direction, C1 concave and C2 convex. The crystal radius satisfies the Rowland condition, but as a pair have no
focusing power. M1 is a toroid operating at 1:1 magnification in both the horizontal and vertical planes.

s a b c d e f g
i
M1 C1 C2 M2
s i
PLAN
ELEVATION
Fig. 3 Optical layout of a 2 plane crystal monochromator working in parallel light with a toroidal mirror M2 providing focusing from infinity in the vertical direction, and from the
real source in the horizontal direction.

-0.04 -0.02 0.00 0.02 0.04
-0.002
-0.001
0.000
0.001
0.002
-0.04 -0.02 0.00 0.02 0.040
20406080
100120140
0 20 40 60 80 100120140
-0.002
-0.001
0.000
0.001
0.002
C:\PROGRA~1\XOP2.0\tmp\star.04
INTERNAL LIMITS
--ALL RAYS
INTENS = 1812.09TOT = 25000LOST = 0
Horizontal: 1: X [user unit]Vertical: 3: Z [user unit]
FitHorizFWHM: 0.0239825
FitVertFWHM: 0.00118691
HistoHorizFWHM: 0.0231334
HistoVertFWHM: 0.00125519
command: plotxy,star.04,1,3,NBINS=50,HISTO=2,GAUSSFIT=2
Fig. 4 Sagittal focusing monochromator system (Fig. 1) with a horizontal de-magnification of 1:1,and vertical de-magnification of 2:1. Source acceptance 3 mrads in the horizontal direction. Image simulated at the stigmatic focus point i. Image size 240 (h) x 12 (v) microns FWHM.

-2 -1 0 1 2
-0.3
-0.2
-0.1
0.0
0.1
0.2
0.3
-2 -1 0 1 20
10
20
30
40
50
60
0 20 40 60 80 100
-0.3
-0.2
-0.1
0.0
0.1
0.2
0.3
C:\PROGRA~1\XOP2.0\tmp\star.03
INTERNAL LIMITS
--ALL RAYS
INTENS = 1789.18TOT = 25000LOST = 0
Horizontal: 1: X [user unit]Vertical: 3: Z [user unit]
command: plotxy,star.03,1,3,NBINS=50,HISTO=2
Fig. 5 Sagittally focusing monochromator as in Fig. 4, but image viewed 0.1 m downstream of the 2nd crystal
for a 3 mrad horizontal acceptance. Object distance 15 m.

-6 -4 -2 0 2 4 6
-0.2
0.0
0.2
-6 -4 -2 0 2 4 60
10
20
30
40
50
0 20 40 60
-0.2
0.0
0.2
C:\PROGRA~1\XOP2.0\tmp\star.03
INTERNAL LIMITS
--ALL RAYS
INTENS = 1182.04TOT = 25000LOST = 0
Horizontal: 1: X [user unit]Vertical: 3: Z [user unit]
command: plotxy,star.03,1,3,NBINS=50,HISTO=2
Fig. 6 Sagittally focusing monochromator as in Fig. 4, but image viewed 0.1 m downstream of the 2nd crystal
for a horizontal acceptance of 7 mrads.

-0.2 -0.1 0.0 0.1 0.2
-0.05
0.00
0.05
0.10
-0.2 -0.1 0.0 0.1 0.20
200
400
600
800
0 20040060080010001200
-0.05
0.00
0.05
0.10
C:\PROGRA~1\XOP2.0\tmp\star.05
INTERNAL LIMITS
--ALL RAYS
INTENS = 1789.18TOT = 25000LOST = 0
Horizontal: 1: X [user unit]Vertical: 3: Z [user unit]
command: plotxy,star.05,1,3,NBINS=50
Fig. 7 Sagittally focusing monochromator as in Fig. 4, but image viewed at 1m downstream of the focus for a
horizontal acceptance of 3 mrads.

-0.020 -0.010 0.000 0.010 0.020
-0.0020
-0.0010
0.0000
0.0010
0.0020
0.0030
0.0040-0.020 -0.010 0.000 0.010 0.020
0
50
100
150
0 20 40 60 80 100120140
-0.0020
-0.0010
0.0000
0.0010
0.0020
0.0030
0.0040
C:\PROGRA~1\XOP2.0\tmp\star.04
INTERNAL LIMITS
--ALL RAYS
INTENS = 1870.42TOT = 25000LOST = 0
Horizontal: 1: X [user unit]Vertical: 3: Z [user unit]
FitHorizFWHM: 0.0117191
FitVertFWHM: 0.00168379
HistoHorizFWHM: 0.00992368
HistoVertFWHM: 0.00170601
command: plotxy,star.04,1,3,NBINS=50,HISTO=2,GAUSSFIT=2
Fig. 8 Sagittal focusing monochromator system (Fig. 1) with a horizontal de-magnification of 2:1,and vertical de-magnification of 2:1. Source
acceptance 1.5 mrads in the horizontal direction. Image simulated at the stigmatic focus point i. Image size 117 (h) x 17 (v) microns FWHM.

-2 -1 0 1 2
-0.3
-0.2
-0.1
0.0
0.1
0.2
0.3
-2 -1 0 1 20
20
40
60
0 20 40 60 80 100
-0.3
-0.2
-0.1
0.0
0.1
0.2
0.3
C:\PROGRA~1\XOP2.0\tmp\star.03
INTERNAL LIMITS
--ALL RAYS
INTENS = 1870.42TOT = 25000LOST = 0
Horizontal: 1: X [user unit]Vertical: 3: Z [user unit]
command: plotxy,star.03,1,3,NBINS=50,HISTO=2
Fig. 9 Sagittally focusing monochromator as in Fig. 8, 2:1 demagnification in the horizontal and vertical directions.
Image viewed 0.1 m downstream of the 2nd crystal for a 1.5 mrad horizontal acceptance. Object distance 20m.

-0.2 -0.1 0.0 0.1 0.2
-0.05
0.00
0.05
0.10-0.2 -0.1 0.0 0.1 0.2
0
20
40
60
0 20 40 60 80 100
-0.05
0.00
0.05
0.10
C:\PROGRA~1\XOP2.0\tmp\star.05
INTERNAL LIMITS
--ALL RAYS
INTENS = 1870.42TOT = 25000LOST = 0
Horizontal: 1: X [user unit]Vertical: 3: Z [user unit]
command: plotxy,star.05,1,3,NBINS=50,HISTO=2
Fig. 10 Sagittally focusing monochromator as in Fig. 8, 2:1 demagnification in the horizontal and vertical directions.
Image viewed 1 m downstream of the focus for a 1.5 mrad horizontal acceptance. Object distance 20m
-0.020 -0.010 0.000 0.010 0.020
-0.002
0.000
0.002
0.004
0.006
0.008
-0.020 -0.010 0.000 0.010 0.0200
20406080
100120140
0 20 40 60 80 100120140
-0.002
0.000
0.002
0.004
0.006
0.008
C:\PROGRA~1\XOP2.0\tmp\star.04
INTERNAL LIMITS
--ALL RAYS
INTENS = 1818.97TOT = 25000LOST = 0
Horizontal: 1: X [user unit]Vertical: 3: Z [user unit]
FitHorizFWHM: 0.0121637
FitVertFWHM: 0.00167215
HistoHorizFWHM: 0.0120361
HistoVertFWHM: 0.00258191
command: plotxy,star.04,1,3,NBINS=50,HISTO=2,GAUSSFIT=2
.
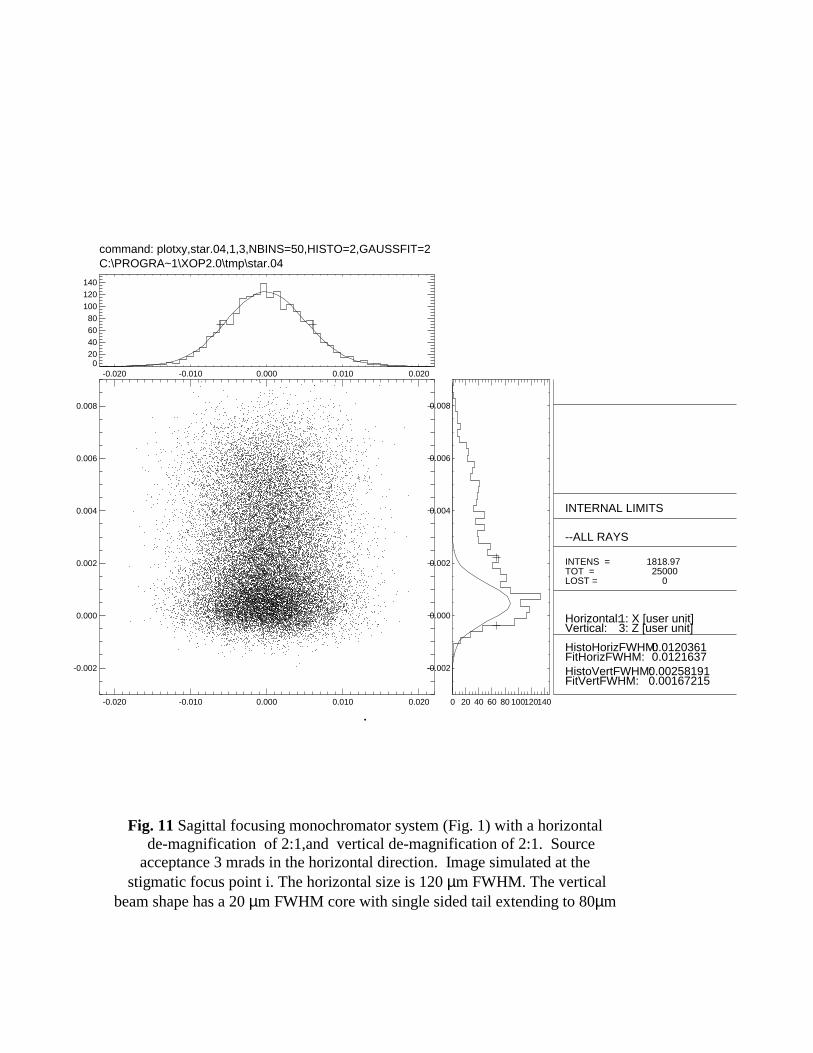
Fig. 11 Sagittal focusing monochromator system (Fig. 1) with a horizontal de-magnification of 2:1,and vertical de-magnification of 2:1. Source acceptance 3 mrads in the horizontal direction. Image simulated at the
stigmatic focus point i. The horizontal size is 120 µm FWHM. The vertical beam shape has a 20 µm FWHM core with single sided tail extending to 80µm

-0.3 -0.2 -0.1 0.0 0.1 0.2 0.3
-0.50
-0.40
-0.30
-0.20
-0.10
0.00
-0.3 -0.2 -0.1 0.0 0.1 0.2 0.30
100
200
300
400
0 50 100 150 200 250
-0.50
-0.40
-0.30
-0.20
-0.10
0.00
C:\PROGRA~1\XOP2.0\tmp\star.04
INTERNAL LIMITS
--ALL RAYS
INTENS = 1803.41TOT = 25000LOST = 24996
Horizontal: 1: X [user unit]Vertical: 3: Z [user unit]
FitHorizFWHM: 0.0353496
FitVertFWHM: 0.0192515
HistoHorizFWHM: 0.0360660
HistoVertFWHM: 0.0204833
command: plotxy,star.04,1,3,NBINS=50,HISTO=2,GAUSSFIT=2
Fig. 12 Parabolic mirror – 2 flat crystals – toroidal mirror system (Fig. 3). Horizontal demagnification 1:1, with source – M1 of 6.5 m, source – M2
of 15.75 m and M2 – focus of 15.75 m with a horizontal source acceptance of 3 mrads. M2 tangential radius 7875 m, sagittal radius 6.3 cm.
Image simulated at the stigmatic focus point i.

-0.10 -0.05 0.00 0.05 0.10-0.15
-0.10
-0.05
0.00
-0.10 -0.05 0.00 0.05 0.100
50
100
150
200
250
300
0 50 100 150 200-0.15
-0.10
-0.05
0.00
C:\PROGRA~1\XOP2.0\tmp\star.04
INTERNAL LIMITS
--ALL RAYS
INTENS = 1876.30TOT = 25000LOST = 24979
Horizontal: 1: X [user unit]Vertical: 3: Z [user unit]
FitHorizFWHM: 0.0202302
FitVertFWHM: 0.00641998
HistoHorizFWHM: 0.0211359
HistoVertFWHM: 0.00941612
command: plotxy,star.04,1,3,NBINS=50,HISTO=2,GAUSSFIT=2
Fig. 13 Parabolic mirror – 2 flat crystals – toroidal mirror system (Fig. 3). Horizontal demagnification 1.5:1, with source – M1 of 6.5 m, source – M2
of 18.9 m and M2 – focus of 12.6 m, and horizontal source acceptance of 2 mrads. M2 tangential radius 6300 m, sagittal radius 6.048 cm.
Image simulated at the stigmatic focus point i.

-0.06 -0.04 -0.02 0.00 0.02 0.04
-0.010
0.000
0.010
0.020
-0.06 -0.04 -0.02 0.00 0.02 0.040
50
100
150
200
0 50 100 150 200
-0.010
0.000
0.010
0.020
C:\PROGRA~1\XOP2.0\tmp\star.04
INTERNAL LIMITS
--ALL RAYS
INTENS = 1876.12TOT = 25000LOST = 21302
Horizontal: 1: X [user unit]Vertical: 3: Z [user unit]
FitHorizFWHM: 0.0151259
FitVertFWHM: 0.00672154
HistoHorizFWHM: 0.0152212
HistoVertFWHM: 0.00670051
command: plotxy,star.04,1,3,NBINS=51,HISTO=2,GAUSSFIT=2
Fig. 14. Parabolic mirror – 2 flat crystals – toroidal mirror system (Fig. 3). Horizontal demagnification 2:1, with source – M1 of 6.5 m, source – M2
of 21 m and M2 – focus of 10.5 m, and horizontal source acceptance of 1.5 mrads. M2 tangential radius 5250m, sagittal radius 5.6 cm.
Image simulated at the stigmatic focus point i.

-0.04 -0.02 0.00 0.02 0.04
0.00
0.02
0.04
0.06
0.08
-0.04 -0.02 0.00 0.02 0.040
50
100
150
200
250
0 50 100 150 200
0.00
0.02
0.04
0.06
0.08
C:\PROGRA~1\XOP2.0\tmp\star.04
INTERNAL LIMITS
--ALL RAYS
INTENS = 1876.03TOT = 25000LOST = 24977
Horizontal: 1: X [user unit]Vertical: 3: Z [user unit]
FitHorizFWHM: 0.0123694
FitVertFWHM: 0.0109075
HistoHorizFWHM: 0.0117883
HistoVertFWHM: 0.0115114
command: plotxy,star.04,1,3,NBINS=50,HISTO=2,GAUSSFIT=2
Fig. 15. Parabolic mirror – 2 flat crystals – toroidal mirror system (Fig. 3). Horizontal demagnification 2.5:1, with source – M1 of 6.5 m, source – M2
of 22.5 m and M2 – focus of 9 m, and horizontal source acceptance of 1.2 mrads. M2 tangential radius 4500 m, sagittal radius 5.143 cm
Image simulated at the stigmatic focus point i.

-0.2 -0.1 0.0 0.1 0.2
-0.08
-0.06
-0.04
-0.02
0.00
0.02-0.2 -0.1 0.0 0.1 0.2
0
500
1000
1500
0 5001000150020002500
-0.08
-0.06
-0.04
-0.02
0.00
0.02
C:\PROGRA~1\XOP2.0\tmp\star.05
INTERNAL LIMITS
--ALL RAYS
INTENS = 1876.12TOT = 25000LOST = 21302
Horizontal: 1: X [user unit]Vertical: 3: Z [user unit]
command: plotxy,star.05,1,3
Fig. 16. Parabolic mirror – 2 flat crystals – toroidal mirror system (Fig. 3). Horizontal demagnification 2:1, with source – M1 of 6.5 m, source – M2
of 21 m and M2 – focus of 10.5 m, and horizontal source acceptance of 1.5 mrads. M2 tangential radius 5250m, sagittal radius 5.6 cm.
Image simulated 1 m downstream of the focus.

-0.15 -0.10 -0.05 0.00 0.05 0.10 0.15
-0.050
-0.040
-0.030
-0.020
-0.010
0.000
0.010
-0.15 -0.10 -0.05 0.00 0.05 0.10 0.150
500
1000
1500
2000
0 50010001500200025003000
-0.050
-0.040
-0.030
-0.020
-0.010
0.000
0.010
C:\PROGRA~1\XOP2.0\tmp\star.05
INTERNAL LIMITS
--ALL RAYS
INTENS = 1876.12TOT = 25000LOST = 7613
Horizontal: 1: X [user unit]Vertical: 3: Z [user unit]
command: plotxy,star.05,1,3
Fig. 17. Parabolic mirror – 2 flat crystals – toroidal mirror system (Fig. 3). Horizontal demagnification 2:1, with source – M1 of 6.5 m, source – M2
of 21 m and M2 – focus of 10.5 m, and horizontal source acceptance of 1.5 mrads. M2 tangential radius 5250m, sagittal radius 5.6 cm.
Image simulated 0.5 m downstream of the focus.

-0.10 -0.05 0.00 0.05 0.10
-0.030
-0.020
-0.010
0.000
0.010-0.10 -0.05 0.00 0.05 0.10
0
500
1000
1500
2000
2500
3000
0 1000 2000 3000 4000
-0.030
-0.020
-0.010
0.000
0.010
C:\PROGRA~1\XOP2.0\tmp\star.05
INTERNAL LIMITS
--ALL RAYS
INTENS = 1876.12TOT = 25000LOST = 7613
Horizontal: 1: X [user unit]Vertical: 3: Z [user unit]
command: plotxy,star.05,1,3
Fig. 18. Parabolic mirror – 2 flat crystals – toroidal mirror system (Fig. 3). Horizontal demagnification 2:1, with source – M1 of 6.5 m, source – M2
of 21 m and M2 – focus of 10.5 m, and horizontal source acceptance of 1.5 mrads. M2 tangential radius 5250m, sagittal radius 5.6 cm.
Image simulated 0.25 m downstream of the focus.

-0.04 -0.02 0.00 0.02 0.04
-0.020
-0.015
-0.010
-0.005
0.000
0.005
-0.04 -0.02 0.00 0.02 0.040
1000
2000
3000
4000
0 10002000300040005000
-0.020
-0.015
-0.010
-0.005
0.000
0.005
C:\PROGRA~1\XOP2.0\tmp\star.05
INTERNAL LIMITS
--ALL RAYS
INTENS = 1875.87TOT = 25000LOST = 3138
Horizontal: 1: X [user unit]Vertical: 3: Z [user unit]
command: plotxy,star.05,1,3
Fig. 19. Parabolic mirror – 2 flat crystals – toroidal mirror system (Fig. 3). Horizontal demagnification 2:1, with source – M1 of 6.5 m, source – M2
of 21 m and M2 – focus of 10.5 m, and horizontal source acceptance of 0.5 mrads. M2 tangential radius 5250m, sagittal radius 5.6 cm.
Image simulated 0.25 m downstream of the focus.

-0.08 -0.06 -0.04 -0.02 0.00 0.02 0.04 0.06
-0.030
-0.020
-0.010
0.000
0.010
-0.08 -0.06 -0.04 -0.02 0.00 0.02 0.04 0.060
500
1000
1500
2000
2500
3000
0 1000 2000 3000 4000
-0.030
-0.020
-0.010
0.000
0.010
C:\PROGRA~1\XOP2.0\tmp\star.05
INTERNAL LIMITS
--ALL RAYS
INTENS = 1875.87TOT = 25000LOST = 3138
Horizontal: 1: X [user unit]Vertical: 3: Z [user unit]
command: plotxy,star.05,1,3
Fig. 20. Parabolic mirror – 2 flat crystals – toroidal mirror system (Fig. 3). Horizontal demagnification 2:1, with source – M1 of 6.5 m, source – M2
of 21 m and M2 – focus of 10.5 m, and horizontal source acceptance of 0.5 mrads. M2 tangential radius 5250m, sagittal radius 5.6 cm.
Image simulated 0.5 m downstream of the focus.

-0.10 -0.05 0.00 0.05 0.10
-0.040
-0.030
-0.020
-0.010
0.000
0.010
0.020-0.10 -0.05 0.00 0.05 0.10
0
500
1000
1500
2000
2500
0 5001000150020002500
-0.040
-0.030
-0.020
-0.010
0.000
0.010
0.020
C:\PROGRA~1\XOP2.0\tmp\star.05
INTERNAL LIMITS
--ALL RAYS
INTENS = 1875.87TOT = 25000LOST = 3138
Horizontal: 1: X [user unit]Vertical: 3: Z [user unit]
command: plotxy,star.05,1,3
Fig. 21. Parabolic mirror – 2 flat crystals – toroidal mirror system (Fig. 3). Horizontal demagnification 2:1, with source – M1 of 6.5 m, source – M2
of 21 m and M2 – focus of 10.5 m, and horizontal source acceptance of 0.5 mrads. M2 tangential radius 5250m, sagittal radius 5.6 cm.
Image simulated 1 m downstream of the focus.