competition between national company and global...
TRANSCRIPT

1
Shuai Du & Elodie Lu
Competition Between National Company and Global
Company in the Swedish Fast Food Industry: A Case
Study of MAX
Master thesis in Business Administration
30ECTS
Term: Spring 2014
Supervisor: Lars Haglund

2
Preface
The content of this thesis has been produced through the joint efforts of Shuai Du and Elodie
Lu. All work has been done together throughout the research process. Each chapter is
thoroughly written, revised and edited by each other.
We would like to thank all the people who supported us throughout this research. First, we
want to thank our supervisor Prof. Lars Haglund, whose suggestions had been very helpful for
our work and his quick response solved many problems in time. The questionnaire design
would not have been as well-formulated nor as efficient if it had not been for his aid. We also
learned a lot from him regarding SPSS and how the data should be analyzed.
Second, we would like thank to Prof. Maria Sundberg, Elisabet Mellroth and Ling Xin, who
helped us contact three different schools located in Karlstad, Storfors and Hammarö for our
study. And we would like to thank all the teachers there who offered us opportunities to
conduct our surveys in their classrooms and gave us useful information and suggestions.
We would also like to thank all the students who answered our questionnaires and accepted
our interviews. They offered us an opportunity to gain a deeper understanding of the research
questions. Furthermore, our data is all based on their support.
Finally, we would like to show our appreciation for the helpful suggestions our opponents
Johanna Zimmerman and David Lundberg, have provided, allowing us to improve our thesis
and make it complete.

3
Abstract
Most believe global brands present high quality and they usually have a good reputation in the
minds of customers. Global brands are often adjusted to appeal to the tastes of local customers
and win in the local market. This is a challenge for national companies. If national companies
want to win market share, they must do something better than global players. Considering the
intense competition between national companies and global players, this research aims to
examine how a national brand can remain competitive against larger international labels
through a case study of the Swedish hamburger chain Max and its rival, McDonald’s, the
world’s leading brand in the industry. McDonald’s has good reputation worldwide, however,
Max as a national brand that makes fresh burgers with a homemade taste, which fit the
preferences of Swedish customers more. It is hard to say which one is better. These questions
are thus becoming more important for Max: What do they need to do to win? What factors do
they need to improve?
In order to find the answers to the research questions, 322 questionnaires and 26 personal
interviews are used to collect the information. The results show that both Max and
McDonald’s have its own the advantages and disadvantages. The authors believe they are
significant for future studies.
Keywords: national brand, fast food restaurant, competition, customer satisfaction, service
quality.
4
Table of Contents
Preface ............................................................................................................................................................. 2
Abstract ........................................................................................................................................................... 3
1.Introduction .................................................................................................................................................. 7
1.1 Background: A national brand against a global player ...................................................................... 7
1.2 The Swedish fast food industry ......................................................................................................... 8
1.2.1 Max......................................................................................................................................... 8
1.2.2 McDonald’s ............................................................................................................................ 9
1.3 The research aim and research questions ........................................................................................ 11
2. Theory ....................................................................................................................................................... 12
2.1 Brand choice .................................................................................................................................... 12
2.2 Service quality ................................................................................................................................. 14
2.3 Customer satisfaction ...................................................................................................................... 17
2.4 Customer loyalty ............................................................................................................................. 19
2.5 National brand preferences .............................................................................................................. 22
2.6 Research model ............................................................................................................................... 25
3. Research Methodology .............................................................................................................................. 27
3.1 Research design ............................................................................................................................... 27
3.2 Hypotheses ...................................................................................................................................... 28
3.3 Determination of target group ......................................................................................................... 29
3.4 Data collecting method .................................................................................................................... 30

5
3.5 Determination of sample size .......................................................................................................... 30
3.6 Questionnaire design ....................................................................................................................... 31
3.6.1 Introduction .......................................................................................................................... 31
3.6.2 Screening questions .............................................................................................................. 31
3.6.3 Warm-up questions ............................................................................................................... 32
3.6.4 Perception questions ............................................................................................................. 32
3.7 Questionnaire distribution ............................................................................................................... 34
3.8 Data coding ..................................................................................................................................... 34
3.9 Interview questions design .............................................................................................................. 34
3.10 Reliability and validity .................................................................................................................. 35
3.11 Limitation ...................................................................................................................................... 35
4. Data Analysis and Hypothesis Testing ...................................................................................................... 37
4.1 Demographic of the sample ............................................................................................................. 38
4.2 General question data analysis ........................................................................................................ 39
4.3 Service quality analysis ................................................................................................................... 42
4.4 Customer satisfaction analysis ........................................................................................................ 45
4.5 National brand preference analysis ................................................................................................. 48
4.6 Customer loyalty analysis ............................................................................................................... 48
4.7 Hypothesis testing ........................................................................................................................... 48
5. Interview Results ....................................................................................................................................... 54
6.Discussion .................................................................................................................................................. 60
6
6.1 Managerial implications of service quality questionnaire and interview results ............................. 60
6.2 Managerial implications of national food preference questionnaire and interview results ............. 61
6.3 Managerial implications of demographic factors ............................................................................ 62
7.Conclusion .................................................................................................................................................. 63
7.1Suggestion for Max .......................................................................................................................... 64
7.2 Suggestion for McDonald’s ............................................................................................................. 65
7.3 Future studies: Improvement and sustainable development ............................................................ 66
References ..................................................................................................................................................... 68
Appendix ....................................................................................................................................................... 71

7
1.Introduction
1.1 Background: A national brand against a global player
By winning in the global market, international brands are often perceived as having superior
quality and aspirational values by consumers. For instance, Tantiwongwat’s research (2013)
found that consumers believe global brands are usually higher quality; and while expensive,
paying more for it is reasonable because it is higher quality. In the favor of national brands is
their higher understanding of the local market. But this can be overcome if the foreign
company does its research well. For instance, the loyalty of ethnocentric customers to their
own countries products may make them avoid foreign labels (Durvasula et al., 1997; cited in
Shu et al. 2013, p.45). However, this does not always mean a negative bias towards foreign
brands in countries where consumers tend to be ethnocentric, especially when the foreign
brand appeals to emotional values (Shu et al. 2013). So, how can a national brand compete
with this in their local market?
The authors of this thesis are international students who have lived in many different
countries, and experienced the differences in culture. In some countries, global players are
very strong in local market. In others, customers prefer local brands. Now as they study in
Sweden, have taken an interest in the Swedish market. They would like to know what attracts
more local customers, and why.
The fast food industry is particularly interesting because the writers have traveled around a lot
and they often eat fast food for convenience. Quick service restaurants, such as McDonald’s,
are seen everywhere and can be found easily. When the writers came to Sweden, they tried the
Swedish hamburger chain Max and they thought the taste was very good. Therefore, the
writers looked more into Max, becoming very interested in the process about how it competes
with its international rivals.
Max is a possible example of success of how a national brand can win. On its company
website (Max Hamburgerrestauranger AB [Max] 2012c; Max 2012e), it claims to be the
“most profitable restaurant in Sweden outperforming both McDonald's and Burger King” and
having the “best taste thanks to our own secret recipes, first class ingredients, product
development, production process and food handling.” USA Today lists Max as one of the top
10 foreign chains Americans would like to have (Morse 2013). If this Swedish hamburger
8
chain is doing as well as it claims, the writers would like to see why it is preferred by
consumers over the world’s most well-known brands in its own market. To do so, the writers
must gain an understanding of what quality in a service industry means for consumers, and
whether if it is what gives them satisfaction and earns their loyalty. Also of interest is if
consumers’ loyalty to their own country’s products would help a national company win in its
market. To explore these topics, the writers will study Max and the leading fast food label in
the world, McDonald’s, and examine how a national brand win.
The current research will compare the quality of Max to McDonald’s through a questionnaire
and interview study to examine if, and how Max wins in its local market against the world’s
#1 brand in the fast food industry. The results may provide some interesting managerial
implications and possible suggestions for similar businesses when competing against brand
names with worldwide reputations.
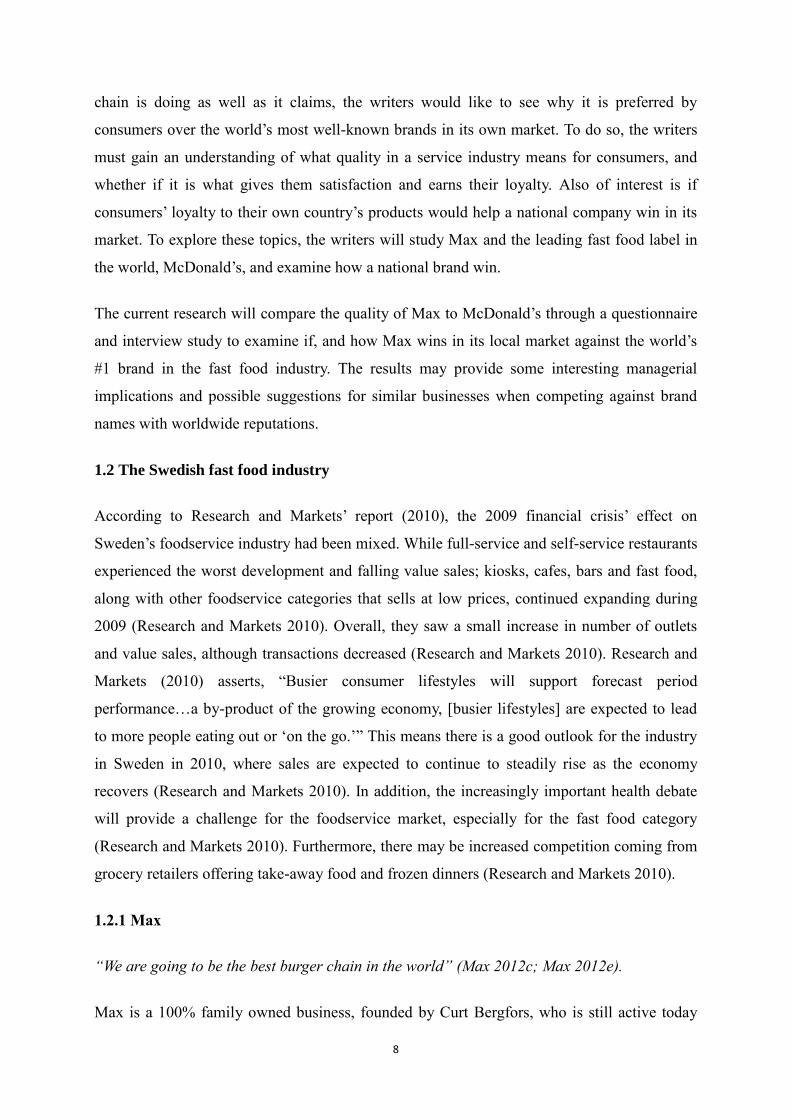
1.2 The Swedish fast food industry
According to Research and Markets’ report (2010), the 2009 financial crisis’ effect on
Sweden’s foodservice industry had been mixed. While full-service and self-service restaurants
experienced the worst development and falling value sales; kiosks, cafes, bars and fast food,
along with other foodservice categories that sells at low prices, continued expanding during
2009 (Research and Markets 2010). Overall, they saw a small increase in number of outlets
and value sales, although transactions decreased (Research and Markets 2010). Research and
Markets (2010) asserts, “Busier consumer lifestyles will support forecast period
performance…a by-product of the growing economy, [busier lifestyles] are expected to lead
to more people eating out or ‘on the go.’” This means there is a good outlook for the industry
in Sweden in 2010, where sales are expected to continue to steadily rise as the economy
recovers (Research and Markets 2010). In addition, the increasingly important health debate
will provide a challenge for the foodservice market, especially for the fast food category
(Research and Markets 2010). Furthermore, there may be increased competition coming from
grocery retailers offering take-away food and frozen dinners (Research and Markets 2010).
1.2.1 Max
“We are going to be the best burger chain in the world” (Max 2012c; Max 2012e).
Max is a 100% family owned business, founded by Curt Bergfors, who is still active today

9
being Chairman of the Board. Max is also run by franchise partners, including the Nilsen
family, its Norwegian master franchisee (Max 2012c). Currently, Max has operations in
Norway, Denmark and the UAE, in addition to its main operations in Sweden, and it is
seeking a new franchise partner for Poland (Max 2012a; Max 2012e).
Currently, Max operates in 86 restaurants across Sweden, with around 3000 people in its
employment (Max 2012c). According to Datamonitor’s report (2010), this Swedish QSR is
the second-largest hamburger chain, and the only one that guarantees nationally-produced
meat in the country. In 2008, Max recorded 1040 million SEK (approx. $137 million)
revenue, and a net profit of 85 million SEK (approx. $11.1 million); and had planned to
expand to 100 outlets by 2012 (Datamonitor 2010). This is the most current financial
information to be found on the company.
1.2.2 McDonald’s
“At McDonald's, we strive to be more than just a restaurant - we're a first job for many, a
community partner, a model for other restaurants around the world, and a company seeking
new ways to fulfill our brand promise of Quality, Service, Cleanliness, and Value.”
-McDonald’s 2014b
Operating fast food restaurants throughout the entire world, the company is the leading brand
in the industry. Similar to Max, McDonald’s restaurants is run by both the company and by
franchisees. Although, instead of being family-owned like Max, McDonald’s is a corporation
owned by shareholders.
According to the company’s 2013 Annual Report, McDonald’s recorded revenues of $28,106
million, with an increase of 2% that year; and a net income of $5,586 million, with an
increase of 2% (McDonald’s Corporation 2013).
Being amongst the world's biggest foodservice retailing chains with 1.9 million employees,
McDonald’s is mainly known for its burgers and fries, that it distributes through some 35,000
locations in more than 100 countries (Datamonitor 2010; MarketLine 2014; McDonald’s
2014a). As of the end of 2013, its operations are divided into the USA, APMEA, Europe and
other countries divisions (McDonald’s Corporation 2013). Most of the year’s total revenues
($11,300 million) come from its European division, with an increase of 4% (McDonald's
10
Corporation, 2013).
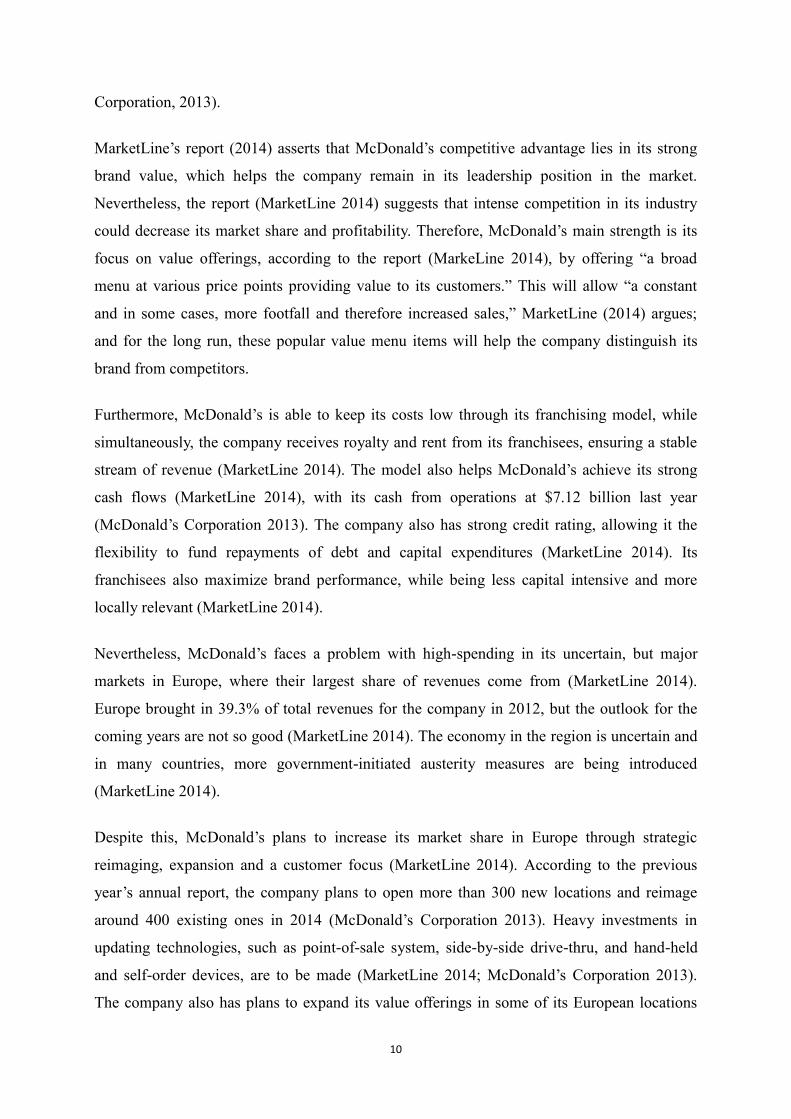
MarketLine’s report (2014) asserts that McDonald’s competitive advantage lies in its strong
brand value, which helps the company remain in its leadership position in the market.
Nevertheless, the report (MarketLine 2014) suggests that intense competition in its industry
could decrease its market share and profitability. Therefore, McDonald’s main strength is its
focus on value offerings, according to the report (MarkeLine 2014), by offering “a broad
menu at various price points providing value to its customers.” This will allow “a constant
and in some cases, more footfall and therefore increased sales,” MarketLine (2014) argues;
and for the long run, these popular value menu items will help the company distinguish its
brand from competitors.
Furthermore, McDonald’s is able to keep its costs low through its franchising model, while
simultaneously, the company receives royalty and rent from its franchisees, ensuring a stable
stream of revenue (MarketLine 2014). The model also helps McDonald’s achieve its strong
cash flows (MarketLine 2014), with its cash from operations at $7.12 billion last year
(McDonald’s Corporation 2013). The company also has strong credit rating, allowing it the
flexibility to fund repayments of debt and capital expenditures (MarketLine 2014). Its
franchisees also maximize brand performance, while being less capital intensive and more
locally relevant (MarketLine 2014).
Nevertheless, McDonald’s faces a problem with high-spending in its uncertain, but major
markets in Europe, where their largest share of revenues come from (MarketLine 2014).
Europe brought in 39.3% of total revenues for the company in 2012, but the outlook for the
coming years are not so good (MarketLine 2014). The economy in the region is uncertain and
in many countries, more government-initiated austerity measures are being introduced
(MarketLine 2014).
Despite this, McDonald’s plans to increase its market share in Europe through strategic
reimaging, expansion and a customer focus (MarketLine 2014). According to the previous
year’s annual report, the company plans to open more than 300 new locations and reimage
around 400 existing ones in 2014 (McDonald’s Corporation 2013). Heavy investments in
updating technologies, such as point-of-sale system, side-by-side drive-thru, and hand-held
and self-order devices, are to be made (MarketLine 2014; McDonald’s Corporation 2013).
The company also has plans to expand its value offerings in some of its European locations

11
(MarketLine 2014), as well as its premium menu, coffee and breakfast options and limited
time offers (McDonald’s Corporation 2013). Also, seeing how successful its McCafe frappes
and smoothies sales has been in the UK, McDonald’s plans for 4,500 more European
locations to have these blended-ice items on their menus by this year’s end (McDonald’s
Corporation 2013).
However, MarketLine (2014) is certain that McDonald’s pricing power has little influence in
Europe, because of the slowdown in spending on eating out. Therefore, the report
(MarketLine 2014) concludes that increased spending in Europe may not result in the gains
McDonald’s expect.
1.3 The research aim and research questions
In most markets, the competition between national and global players is intense. Through
evaluating Max’s service quality, the researchers would to like examine the strategic
implications for a national brand’s survival against global competition and how it can keep
competitive advantage. The writers would also like to examine, for the more specific research
questions, the factors in which Max can improve to win customer satisfaction and loyalty.
The general research questions the writers would like to answer for the purpose of this thesis
are as follows: How do national brands face competition from larger global brands? Does
consumer loyalty to their own country’s products play a large role in addition to service
quality? Do country of origin preferences also play a role?
Specifically, the writers want to apply the research questions to Max in the fast food industry
in Sweden and its main competitor, McDonald’s.
12
2. Theory
When the writers think about what makes a restaurant an enjoyable experience, several factors
comes to mind: taste, price, opening hours, quick service, clean facilities, helpful employees,
friendly service and the general atmosphere.
The writers believe the above fits well with the SERVQUAL model, which is amongst the
most common ones used in both academic and industry research for evaluating service
quality; and it consists of five dimensions: tangibles, reliability, responsiveness, assurance,
and empathy (Bogomolova 2010; Cheng & Rashid 2013; Lau et al. 2005; Parasuraman et al.
1985; Parasuraman et al., 1988; cited in Lee et al., 2004, p.75; Ting et al., 2011; cited in
Cheng & Rashid, 2013, p.101). Therefore, in the current study, the researchers will use this
framework to examine competition between a national and a foreign international brand in the
Swedish QSR market.
The Theory chapter will review relevant literature, looking at different frameworks to how
opinions on brands are formed and how customers choose brands based on service quality.
Another subject relevant to the current study are national brand preference, since sometimes
consumers may be loyal to their country’s own products for patriotic reasons, disregarding
their perceptions on the product in question’s quality (Shu et al. 2013). This thesis will
explore how different service quality factors and national brand preference will influence
satisfaction and loyalty.
2.1 Brand choice
For the present study’s literature review, the researchers will start with the topic of brand
choice. Brands are what sets otherwise similar products and services apart from their
competition, at least in the eyes of the consumer. This is often purely psychological; however,
it is very advantageous when a business is able to differentiate in a way that cannot be easily
imitated.
In the book Creating Powerful Brands in Consumer, Service and Industrial Markets, de
Chernatony and McDonald (1998) describes products and services as being problem solvers.
While solving customers’ problems, at the same time, these offerings help the business
achieve its goals (de Chernatony & McDonald 1998). Organizations must think in terms of
customer benefits and not just physical products; otherwise, it will lose to competition (de

13
Chernatony & McDonald 1998). This is because, when customers purchase goods, what they
really buy is “a particular bundle of benefits which they perceive as satisfying their own
particular needs and wants” (de Chernatony & McDonald, 1998, p.4).
A brand, on the other hand, personifies the customer’s relationship with the product (de
Chernatony & McDonald 1998). It is distinguished from a commodity by its added values, or
additional attributes generally not considered to be tangible, that it represents for its customers
(de Chernatony & McDonald 1998). These added values are oftentimes emotional values that
consumers can find hard to describe because they are attached to a product through the
marketing mix; in which all elements of the mix may be used to develop a distinctive position
for the product in the mind of the consumer (de Chernatony & McDonald 1998). Customers
are less likely to accept substitutes when the brand position is very distinctive, therefore,
competitive advantage is gained through the superior added values compared to rival brands
(de Chernatony & McDonald 1998). De Chernatony and McDonald’s text summarizes in the
below figure (1998, p.13) how added values contribute to the physical good, the core product
being the offering’s purely tangible aspects – usually easy for competitors to imitate – and the
added values – or the product surround - being what enhances the product, thus distinguishing
it from competition. The offering is more likely to be strongly differentiated if its product
surround is large in proportion to its core product (de Chernatony & McDonald 1998).
Figure 1: How added values contribute to the physical good

14
2.2 Service quality
As the demand for quality in products and services grew in the 1980s, there was still a general
lack of research on the concept of service quality (Parasuraman et al. 1985). Parasuraman, et
al.’s study (1985) was an attempt on rectifying the situation. For the current study, it is first
important to note that services must not be treated the same as goods when developing a
strategy. Parasuraman, et al.’s research (1985) identifies three unique aspects of services that
must be taken into account when evaluating quality: intangibility, heterogeneity and
inseparability.
Services are performances rather than physical objects; hence, due to their intangible nature, it
can be difficult for businesses to understand how their customers perceive and evaluate the
quality of their services (de Chernatony & McDonald 1998; Parasuraman et al. 1985). Fewer
tangible cues to judge quality, such as color, texture, style, packaging, feel and fit, exist when
purchasing services, mostly limiting themselves to the service provider’s equipment,
personnel and physical facilities (de Chernatony & McDonald 1998; Parasuraman et al.
1985).
Next, services are heterogeneous, so it would vary with each different sale (de Chernatony &
McDonald 1998; Parasuraman et al. 1985). It is difficult service providers to set exact
manufacturing specifications in order to obtain uniform, standardized quality (de Chernatony
& McDonald 1998; Parasuraman et al. 1985). Thus, what the customer receives may not be
the same as what the business had intended to deliver (Parasuraman et al. 1985).
Finally, services are performed at the same time as their consumption takes place; in this way,
they have an inseparable nature, meaning it would not be possible for a service provider to
hide mistakes, nor can most services be pre-checked for quality before selling it (de
Chernatony & McDonald 1998; Lau et al. 2005; Parasuraman, et al. 1985). Additionally, the
customer’s involvement is a critical part of the performance because quality and service
delivery occurs simultaneously, most often through interaction between customers and
personnel where the customers’ input affects the performance (Parasuraman, et al. 1985).
Likewise, service brands must focus on their customers. In agreement with Conrad Free’s
contention (1996; cited in de Chernatony & McDonald, 1998, p.209), with all the things a
company does, consumers are regarded as central. The service must be performed consistent

15
with the brand promise by all employees (de Chernatony & McDonald 1998). McDonalds, for
instance have sophisticated systems and highly reputed training centers to guarantee
consistency (de Chernatony & McDonald 1998).
As a service that prides itself in personal touch, the restaurant industry must place great
emphasis on its customer relationships (Vanniarajan & Meharajan 2012). It is a demanding
sector; in which, superior customer service and quality are critical to success, for these are
what encourages visitors to come eat at a restaurant (Vanniarajan & Meharajan 2012). For this
study, the overall service quality will be defined as the customers perception on the service,
that can be evaluated by comparing the service with its competitors (de Chernatony &
McDonald 1998; Vanniarajan & Meharajan 2012).
The quality of services are much more difficult for customers to evaluate than goods,
according to de Chernatony and McDonald (1998). The reason for this can be drawn out by
the classification schemes developed by economists (Zeithaml & Bitner, 1996; cited in de
Chernatony & McDonald, 1998, p.216-217), where goods and services can lie in a spectrum,
from physical goods that are high in easy to evaluate search qualities, to those pure services
high in credence qualities, where even after being consumed, customers would not have
enough knowledge to completely evaluate these offerings.
For this study, a restaurant would lie in the middle of the spectrum, as an offering that is
characterized by experience qualities, where differentiating attributes are mainly evaluated
while being used (de Chernatony & McDonald, 1998). The hospitality industry is similar in
this regard, as great emphasis is put on customer experience; and therefore, evaluating
customers’ perception and satisfaction of service quality, then improving it accordingly would
be effective towards raising profitability in the face of intense competition (Cheng & Rashid,
2013; Lau, et al., 2005).
According to Cheng and Rashid’s research (2013), the SERVQUAL model is widely cited in
service marketing literature as an effective instrument in measuring organizational service
performance. Despite some criticism, SERVQUAL has become in literature, the model with
the widest application, and a popular model various service industries use to evaluate service
quality, such as the hospitality industry (Bogomolova 2010; Cheng & Rashid 2013; Lau et al.
2005; Ting et al., 2011; cited in Cheng & Rashid, 2013, p.101).

16
Service quality improvement programs, or SQIPs, are commonplace; with many being based
on the SERVQUAL model developed by Parasuraman et al. (1985; Parasuraman et al., 1988;
cited in Lee et al., 2004, p.75). In their first study, Parasuraman et al. (1985) defines service
quality by which customers form expectations and perceptions of services in ten major
dimensions, with service quality being the gap between scores assigned to customers’
expectations (E) and their perception of the actual performance (P). Therefore, service quality
(Q) can be given a score by subtracting E from P (Parasuraman, et al. 1985). Parasuraman et.
al’s study (1985) describes perceived service quality as existing in a continuum ranging from
ideal to completely unacceptable quality, with satisfactory quality at some point in-between.
According to Peter and Olson’s book (2010) on consumer behavior, this satisfaction gap is
disconfirmation, or the difference between post-purchase perceptions and pre-purchase
expectations, in which there are three types: positive, negative and neutral. Golder et al.’s
article (2012) “What is Quality? An Integrative Framework of Processes and States” defines
quality disconfirmation as an offering’s perceived performance as a whole relative to the
consumer’s “should” expectation. Disconfirmation is positive when perceived performance is
greater than expectations and negative when they do not meet expectations (Golder et al.
2012; Peter & Olson 2010). Golder et al. (2012) argues it is important to use “should”
expectations as reference for determining satisfaction by comparing the difference in
perceived performance between competing offerings versus only taking into account offering-
specific “will” expectations.
In a second study, Parasuraman revised their definition of service quality into five dimensions,
as follows:
Tangibles: appearance of physical facilities, equipment, personnel and communication materials.
Reliability: ability to perform the promised service dependably and accurately. Responsiveness:
willingness to help customers and provide prompt service. Assurance: knowledge and courtesy of
employees and their ability to inspire trust and confidence. Empathy: caring, individualized attention
the firm provides its customers (Parasuraman et al. 1988; cited Parasuraman et al., 1992, p.338).
The SERVQUAL model has also been developed to apply specifically to the food service
industry, in the form of a new model called DINESERV (Knutson et al., 1991; cited in Lee, et
al., 2004, p.75). An Indian study (Vanniarajan & Meharajan 2012) confirmed that there are
six DINESERV factors in restaurant industry: tangibles, empathy, relationship benefits,
communication, food quality and price fairness; and by emphasizing variables such as tasty

17
food and friendly service, restaurants increase their overall service quality, therefore gaining
competitive advantage.
Vanniarajan and Meeharajan’s Indian study (2012) on the DINESERV model showed that
food quality had the strongest influence on the overall service quality. Meanwhile, individual
item analysis concluded that personal relationship and friendly service in relationship benefits
is a very important attribute to restaurant-goers (Vanniarajan and Meeharajan 2012).
Therefore, restaurants are advised to provide their staffs with orientation or counseling
programs to provide quick and friendly service to improve their overall service quality
(Vanniarajan & Meharajan, 2012). In addition, Vanniarajan and Meeharajan’s analysis (2012)
showed that it is important for the restaurant to adjust their prices with competitive conditions
and the target market in mind. Also having a strong positive impact on overall service quality
are the tangibles, particularly clean and visually appealing dining equipment (Vanniarajan and
Meeharajan 2012). Finally, communication is of great importance in enhancing overall service
quality, because the restaurant’s ability to provide consistent communication to its customers
through advertising will help improve the customers perceptions of the business (Vanniarajan
and Meeharajan 2012).
2.3 Customer satisfaction
In marketing theory, customer satisfaction is a critical concept because when customers are
satisfied, they are more likely to repurchase the same product or service and tell others of their
good impressions with it (Peter & Olson 2010). On the other hand, if customers are not
satisfied, they are likely to switch to a competing brand and complain about their negative
experiences (Peter & Olson 2010).
Golder et al.’s article (2012) defines customer satisfaction as a comparison between quality
and a standard of quality, whereas each quality state is a comparison of attribute performance
with a performance standard (i.e., attribute design or ‘ideal’ expectations). A customer’s
aggregation level for quality disconfirmation will match the aggregation level for evaluated
aggregate quality, so these two concepts can be compared easily in forming customer
satisfaction.” (Golder, et al. 2012). This is the definition of customer satisfaction this study
will assume in the respondents rankings.
The significance of customer satisfaction can be further explored through examining how the

18
buying decision is made. Kotler and Armstrong (2008; cited in Tantiwongwat, 2013, p.15-16)
and de Chernatony and McDonald (1998) identify five stages in which consumers make
purchase decisions where there are many choices available: need recognition, information
search, evaluation of alternatives, purchase decision and post purchase. According to
Tantiwongwat’s research (2013), the process starts when the customer realizes a need, which
can be an internal stimuli such as hunger or external such as an advertisement. The next stages
are heavily affected by the presence of a favorite brand, in which the process will be cut short
and the customer will default to that choice; nevertheless, the particular situation would also
be an important factor, for example, if the customer is making the purchase for a friend who
has different preferences (Tantiwongwat 2013). Finally, after consumption, customers will
their received satisfaction with their expected satisfaction to determine whether they are
satisfied or not (Tantiwongwat, 2013).
Meanwhile, customers must make many decisions in a given day, so they find shortcuts to
make these decisions (Tantiwongwat, 2013). Businesses must then strive to satisfy their
customers, because that shortcut for many consumers is to buy the brand that had satisfied
them in the past (Butterfield, 1999, cited in Tantiwongwat, 2013, p.16) – in other words,
default to that brand instead of looking at all the alternatives competitors are offering.
Lau, et al.’s study (2005) had analyzed the relationship between the overall satisfaction and
the five SERVQUAL service quality factors in the context of Malaysia’s luxury hotels as part
of their research. Consistent with their findings in previous literature, their results showed that
tangibility is the most important factor (Lau et al. 2005).
However Lee, et al.’s study (2004), which applied the CSQI approach to a fast-food case
study and some key attributes of competitive differentiation were identified, showed that
tangible aspects including visually appealing facilities and materials, employee appearance,
and up-to-date equipment ranked very low in importance. In contrast, the attributes that are
considered most significant are spread across the other four SERVQUAL dimensions, with a
common theme identified that relates to personalized service centered around retaining
customers, which includes solving problems, giving customers personal attention, always
having their best interests at heart and being willing to respond to their requests (Lee et al.
2004). Lee, et al.’s (2004) findings suggest that it is the more personalized aspects of service
that help organizations gain competitive advantage, especially if they are very difficult to
replicate. Not included in the study (Lee, et al., 2004) is taste, which is most important

19
according to other studies on restaurants and other business selling food products
(Tantiwongwat 2013; Vanniarajan & Meharajan 2012).
2.4 Customer loyalty
Also critical to understanding marketing theory is analyzing the pattern in which consumers
make brand choices; because in the face of intense competition, keeping customers is crucial
for survival, as this is much more profitable than continuously competing with rival firms for
new customers (Peter & Olson 2010). Yet, due to other factors like the availability of
information, the demand for value, the variety of choices available, the similarity of many
alternatives and the lack of time for customers to always find their favorite brand, evidence
suggests that there is a general decline in brand loyalty in today’s marketplace (Peter & Olson
2010). Peter and Olson’s book (2010) names four categories which describe consumer
purchasing patterns in terms of the degree of commitment and the number of different brands
bought in a particular time frame: brand loyalty, variety seeking, repeat purchase behavior and
derived varied behavior.
Brand loyal customers not only repeatedly buy the same brands, but unlike repeat purchase
behavior, they also a cognitive commitment to buy these brands, which have sufficient
meanings or represent important values or benefits for them (Peter & Olson 2010). Customers
who exhibit repeat purchase behavior, though, would choose that same brand repeatedly for
reasons such as convenience or deals (Peter & Olson 2010).
The antithesis of brand loyalty is variety seeking, the cognitive commitment to buy different
brands so that customers can satisfy their curiosity, their desire for novelty or their wish to
overcome boredom (Peter & Olson 2010). This is different from derived varied behavior,
which customers do not actively seek variety, but purchase different brands because of
external cues such as a store being out of stock (Peter & Olson 2010).
Furthermore, Bogomolova’s research on service quality perceptions of solely loyal customers
(2010) identifies a type of customer who would use one provider for most their needs in a
category of offerings, versus one who has divided loyalties and use multiple providers. This
type of customer would not be as common in some markets as others, for instance Cannon et
al. (1970; cited in Bogomolova, 2010; p.795) states that FMCG markets have less than 10%
of their customers that show such a degree of loyalty, as they tend to prefer variety.

20
Peter and Olson (2010) also places the relationship between brand loyalty and usage rate into
four categories: brand-loyal light users, brand-indifferent light users, brand-loyal heavy users
and brand-indifferent heavy users, in which different strategies are useful for each of the
categories. First, heavy users are more valuable as brand-loyal customers than brand-
indifferent ones; and comparative advertising, such as the one MAX uses in the Picture 2.4,
can be a useful strategy for switching heavy users (Peter & Olson 2010). For brand-loyal light
users, on the other hand, an appropriate strategy would to encourage them to increase their
usage, by for instance, demonstrating alternative uses for the product (Peter & Olson 2010).
However, if the market is dominated by variety-seekers instead, whether light or heavy users,
Peter & Olson (2010) recommends strategies that attempt to develop a new relative advantage
or raise the prominence of the brand name, such as Walmart’s low prices or Oscar Mayor’s
use of advertising and its successful development of the market for cheese hot dogs to
increase sales.
Figure 2: Max Advertisement
Tantiwongwat (2013) identifies recognition, preference, and insistence as the three levels of
brand loyalty. The lowest level of loyalty is brand recognition, in which the customer knows
of the brand’s existence and sees it as an alternative; and next is brand preference, where the
brand becomes the customer’s favorite and will always choose it over others if available
(Tantiwongwat 2013). Finally, there is brand insistence, the highest degree of loyalty where
the customer would avoid substitutions and go out of their way to look for their preferred
brand (Tantiwongwat 2013).

21
Cheng and Rashid’s study (2013) aimed to evaluate the relationship between service quality,
customer satisfaction and customer loyalty, as well as, how corporate image mediates the
relationship between satisfaction and loyalty, in Malaysia’s hotel industry. Consistent with the
results of a similar study in the past (Lau et al. 2005), Cheng and Rashid’s research (2013)
found a positive relationship between service quality and customer satisfaction; the results
confirming the theory that customers’ perception of overall service quality significantly
affects their satisfaction. Therefore, service quality is crucial towards influencing the
customers’ attitudes towards a service’s superiority (Cheng & Rashid 2013). Cheng and
Rashid’s findings (2013) also indicate that satisfied hotel guests tend to become loyal
customers, confirming there is a positive relationship between customer satisfaction and
customer loyalty. According to literature (Pulman, 2002; cited in Cheng & Rashid, 2013, p.
108; Rosenberg, 1983; cited in Cheng & Rashid, 2013, p.108), the costs of gaining new
customers is 6 to 15 times more than sustaining repeat buyers; therefore, loyal customers are
highly valuable to businesses, especially in the face of intense competition.
However, many researchers are skeptical about customer satisfaction being the sole predictor
of customer loyalty; therefore Cheng & Rashid (2013) also studied corporation image as a
mediating effect, and it was discovered that corporate image accounted for almost 64 percent
of customer satisfaction’s effect on loyalty, while 34 percent is directly influenced by
satisfaction. Hence, if satisfied hotel guests also perceive the hotel’s corporate image
positively, then they are even more likely to become loyal (Cheng & Rashid 2013).
On the other hand, a study conducted by Bogomolova et al. (2009; cited in Bogomolova,
2010, p.795) revealed that customers who experienced a service more recently generally gave
more positive feedback on service quality evaluations than those who experienced it longer
ago. Further research by Bogomolova (2010) found that customers who are solely loyal give
more positive evaluations, about 10% higher than those who use multiple service providers.
Bogomolova (2010) believes this could be explained by Parasuraman et al.’s (1985)
disconfirmation paradigm - because solely loyal customers have no competitor to compare the
service to, having only used one service provider, they have less expectations. Meanwhile,
those who had experienced a greater variety of services would hence have higher expectations
and be more critical (Bogomolova 2010). It is important to note that Bogomolova’s study
(2010) focuses on services in the banking and telecommunications industry. Customers may
not be as variety seeking, as they would in the restaurant industry. Also being more pure

22
services and requiring more knowledge to fully understand how good performance should be,
the quality of banking and telecommunications services would be more difficult for the
consumers to evaluate.
2.5 National brand preferences
The writers would also like to examine the impact of national brand preferences on customer
satisfaction and loyalty for the Swedish fast food industry. When McDonald’s first entered
Sweden more than 40 years ago, the market had been difficult to penetrate because consumers
preferred Max for its “Swedishness.”1
Nonetheless, McDonald’s is ranked #8 in the world’s most valuable brands, according to an
evaluation conducted by the Interbrand Corporation in 2008 (Peter & Olson 2010). Eight out
the top ten on the list are American companies, and 52 are in the top 100, despite many global
consumers being anti-American (Peter & Olson 2010). For instance, although one young
Parisian interviewed claims “he will never eat a Big Mac because McDonald’s stands for
American imperialism”, he did not seem aware that the Nike sneakers he wore and the
Marlboro he smoked are also American brands (Peter & Olson, 2010, p. 391). The
organization evaluates brands based on likely earnings in the future, and McDonalds currently
ranks seventh place with “69 million daily consumers through greater choice and localization,
consistent global brand expression, and customer experience” (Interbrand 2014).
Loyalty for one’s country’s own products can be a motive for national brand preferences. In
China, for instance, two opposing consumption motives predominate amongst consumers
regarding Western brands, according to Dong and Tian’s research (2009). While the first
group seeks to advance their social status by purchasing Western products; the latter resists
them instead, finding them undesirable and oppressive to their nationalistic ideals (Dong &
Tian 2009).
According to Shu et al. (2013), consumer ethnocentrism plays a major role in the purchase
decision; because consumers distinguish products based on if they are from their home
country, or from a foreign country. Nationalistic emotions would affect a consumer’s attitudes
and therefore, their decision making process (Shu et al. 2013). More ethnocentric consumers
tend to avoid buying foreign goods, either perceiving them harmful to the national economy
1 Discussion with a respondent the writers had pretested the questionnaire with

23
or simply seeing such actions as unpatriotic (Durvasula et al., 1997; cited in Shu et al., 2013,
p.45). Likewise, these consumers may choose local products regardless of their perceptions
on whether these products are superior in quality compared to their foreign competitors,
because they believe local brands are more in line with their identity as a citizen of their
country (Shua, et al. 2013). In addition, the consumers’ self-concept also has an important role
in deciding their brand preferences (Shua, et al. 2013). Consumers choose brands not only for
the products’ functional purposes, but also for their various symbolic meanings – they choose
products that align with their self-image - and thus the products are for them, a means to
expressing themselves (Shu et al. 2013). Therefore, consumer ethnocentrism within a country
does not necessarily mean a negative bias towards foreign brands; meaning international
businesses should place great emphasis on their brand’s personality and how it can meet the
emotional needs of local consumers, while also remaining sensitive towards their nationalistic
tendencies (Shu et al. 2013).
Shu et al.’s study (2013) had evaluated the effect of both consumer ethnocentrism and self-
image congruity on brand preference in Japan, Taiwan and South Korea - which are known to
be collectivistic cultures – for three separate types of products, PCs, beer and cosmetics. They
conclude that the effect of both factors varies according to the nationality of the consumer and
the product category. (Shu et al. 2013). Taiwanese consumers’ preferences for all categories,
for instance, are based on ethnocentrism – they tend to believe buying their own local brands
will support national interests and offer national identity value; whereas for Japanese
consumers, self-image congruity has a stronger impact – they will prefer a local brand
because it suits themselves and not because it is Japanese (Shu et al. 2013). In contrast,
Korean consumers are only ethnocentric when buying beer and cosmetics and not with PCs;
according to the study, these being more visible products likely to be consumed in public
settings could be the explanation (Shu et al. 2013).
Product knowledge had also proved to have an impact on national brand preference in Shu et
al.’s study (2013). When buying PCs, this factor is significant to Japanese consumers, but not
to the Koreans nor the Taiwanese; because in Japanese culture, local PC brands such as Sony
and Toshiba are icons for their country’s technological superiority. Hence, the study (Shu et
al. 2013) concludes that ethnocentric consumers who have higher product knowledge may
feel that if a local becomes an international leader, then the brand’s image also aligns with
their own self-image as an expert on the product.
24
Further research (Ozsomer, 2012; cited in Winit et al., 2014, p.103) suggests many aspects
give global brands a favorable position in the marketing environment, including higher
perceived quality, lower cost due to economy of scale and standardization, and aspirational
benefits and prestige gained from widespread recognition and distribution. A distinction
between local brands that are distributed globally and those that are distributed only
domestically must also be made (Winit et al. 2014). Winit et al. (2014) asserts that because it
is often assumed that local brands are owned and distributed domestically and global brands
are distributed internationally and foreign-owned, some mixed findings on national brand
preference have occurred due to this false dichotomy. In agreement with Shu et al. (2013),
Winit et al. (2014) concludes that consumers who are ethnocentric may prefer local brands,
but they may like local brands that have an international scope more. By winning in the global
market, these brands give them a sense of pride for their country (Shu et al. 2013). In that
sense, an emphasis on a brand’s globalness can be valuable for local products because
consumers perceive a global scope as sign of quality; and companies can create a global
image for their brand by using global cues to gain competitive advantage (Winit et al. 2014).
It is worth mentioning that while Max mainly operates in Sweden, it also has locations in
Denmark, Norway and the UAE (Max 2012e).
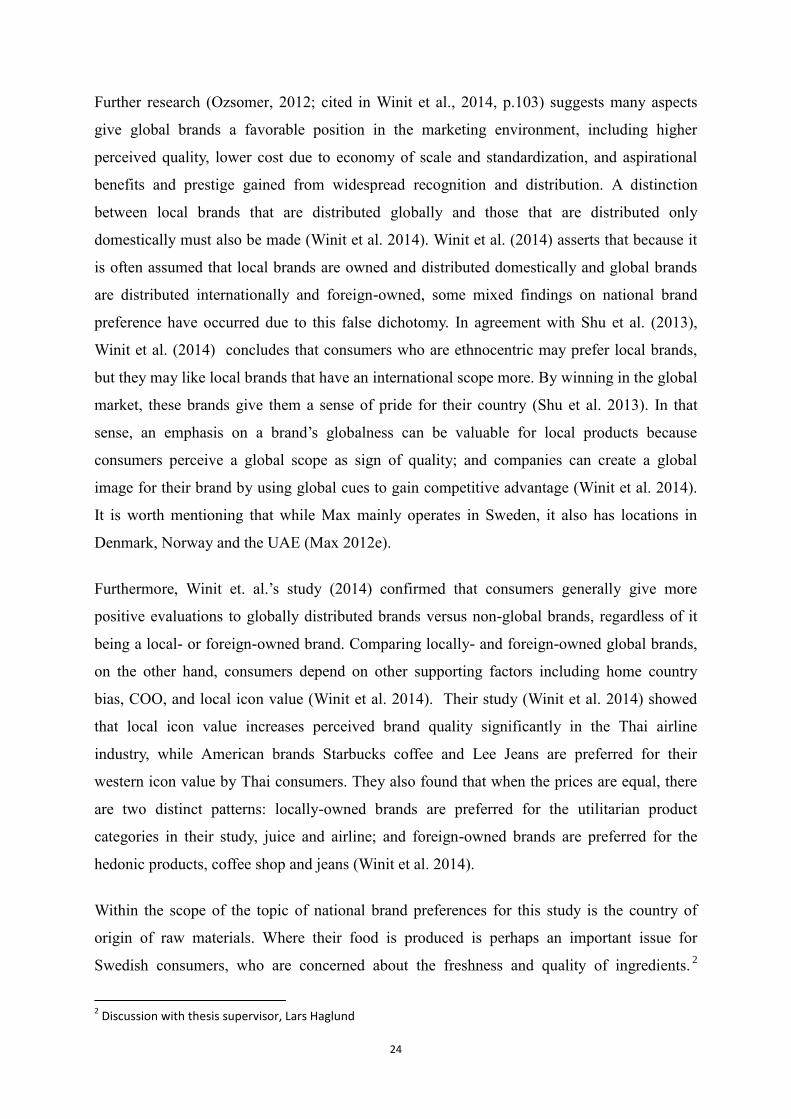
Furthermore, Winit et. al.’s study (2014) confirmed that consumers generally give more
positive evaluations to globally distributed brands versus non-global brands, regardless of it
being a local- or foreign-owned brand. Comparing locally- and foreign-owned global brands,
on the other hand, consumers depend on other supporting factors including home country
bias, COO, and local icon value (Winit et al. 2014). Their study (Winit et al. 2014) showed
that local icon value increases perceived brand quality significantly in the Thai airline
industry, while American brands Starbucks coffee and Lee Jeans are preferred for their
western icon value by Thai consumers. They also found that when the prices are equal, there
are two distinct patterns: locally-owned brands are preferred for the utilitarian product
categories in their study, juice and airline; and foreign-owned brands are preferred for the
hedonic products, coffee shop and jeans (Winit et al. 2014).
Within the scope of the topic of national brand preferences for this study is the country of
origin of raw materials. Where their food is produced is perhaps an important issue for
Swedish consumers, who are concerned about the freshness and quality of ingredients.2
2 Discussion with thesis supervisor, Lars Haglund

25
According to a study on COO effects on willingness to pay (Koschate-Fischer et al. 2012), the
origin of a product can effect customers’ perceptions on their quality. For example, after many
scandals and recalls associated with products made overseas occurred, U.S. consumers
became more concerned about product origins, and prefer products “Made in the USA” as a
result (Martin, 2007; cited in Koschate-Fischer et al., 2012, p.19).
Koschate-Fischer et al.’s study (2012) confirms that the buyers’ willingness to pay increases
when the product’s COO is from a more reputable country, regardless of whether or not it is
produced in the brand’s home country. Moreover, if the customer is more involved, showing a
great deal of interest in the offering, but is not quite familiar with the brand; then they will use
external clues, i.e. COO, until they become more familiar with the brand, and start using
internal cues like previous experience, in which they will base their willingness to pay on that
(Koschate-Fischer et al. 2012). Likewise, brand commitment also had a positive influence on
the determination of the customers’ willingness to pay, according to the study (Koschate-
Fischer et al. 2012). Their results furthermore emphasizes the COO’s significance as a cue for
consumer behavior, and its influence on the consumer’s perception, as well as their purchase
decision (Koschate-Fischer et al. 2012). Hence, consumers generally will spend more for a
brand with a good image that is also produced in a country with a good image (Koschate-
Fischer et al. 2012).
2.6 Research model
An important goal of the current study’s model is to make the questionnaire study short and
simple. A framework based on the SERVQUAL and DINESERV models discussed above will
be used; in which the effects on customer satisfaction and loyalty of five factors of service
quality will be analyzed: tangibles, reliability, responsiveness, assurance and empathy. Price
and taste will added into the tangibles category, because the writers consider these attributes
to be part of the physical product sold in Max and McDonald’s. Additionally, the writers will
include national brand preference in the current study. The writers believe national brand
preference, including COO effects, may also have a significant effect on customer satisfaction
and loyalty in the Swedish fast-food industry; because the foreign or local ownership of a
brand is shown in previous research to be a part of the brand’s image, having a significant
impact on how consumers perceive it.
It is worth mentioning that Sweden has a high score of 71 as an individualistic culture,

26
according to the Hofstede website (2012), where “people are supposed to look after
themselves and their direct family only, [while] In Collectivist societies people belong to ‘in
groups’ that take care of them in exchange for loyalty.” On the contrary, most of the studies
above are conducted in collectivist countries, such as China, Malaysia and India. There is a
lack of literature to be found on this study’s topics in the case of a Western, developed
economy. Hence, the findings of the current research can serve to provide some new insight.

27
3. Research Methodology
Based on the research questions, this section first describes how a research model was
designed to analyze the collected data and reach the research aim. According to the research
questions and model, this chapter then presents the research hypotheses and decides the target
group and sample size. The following part is the questionnaire design, where the writers will
describe how they made the questionnaire based on their research model and case study. After
that, based on the selected target group, the questionnaire is conducted and the data is
collected. In the end of this section is a short conclusion and the reliability, validity and
limitations of this study.
3.1 Research design
The research model is designed based on the aim of this research, which is to find out how
national companies compete with global players. This research will focus on a case study:
how Swedish fast food company Max competes with a strong global company like
McDonald’s, how Max can keep competitive advantage and what factors Max can improve to
remain competitive. Thus, the research attempts to evaluate customer satisfaction and loyalty
and the find out which factors have a significant effect on customer satisfaction and loyalty.
According SERVQUAL Model in the theory part, service quality including Tangibles,
Reliability, Responsiveness, Assurance, and Empathy is a good tool for evaluating Max and
McDonald’s performance in the customers’ mind. In addition, national brand preference may
also be an important element for customer satisfaction and loyalty. Thus, the research model
is shown as follows.

28
Figure 3: Research Model
3.2 Hypotheses
According to the research model and research questions, this study attempts to find out if
service quality has a positive relationship with customers’ satisfaction and loyalty. Thus, the
first two hypotheses are as follows.
H1: Service quality of MAX will have a positive relationship with customer satisfaction.
H1-1: Tangibles of MAX will have a positive relationship with customer satisfaction.
H1-2: Reliability of MAX will have a positive relationship with customer satisfaction.
H1-3: Responsiveness of MAX will have a positive relationship with customer satisfaction.
H1-4: Assurance of MAX will have a positive relationship with customer satisfaction.
H1-5: Empathy of MAX will have a positive relationship with customer satisfaction.
H2: Service quality of MAX will have a positive relationship with customer loyalty.
H2-1: Tangibles of MAX will have a positive relationship with customer loyalty.
H2-2: Reliability of MAX will have a positive relationship with customer loyalty.
Service Quality: Tangibles Reliability
Responsiveness Assurance Empathy
Customer Satisfaction
Customer loyalty
H1
H2
H3 National food
preference
H4
H5
29
H2-3: Responsiveness of MAX will have a positive relationship with customer loyalty.
H2-4: Assurance of MAX will have a positive relationship with customer loyalty.
H2-5: Empathy of MAX will have a positive relationship with customer loyalty.
The writers believe there is also a relationship between customer satisfaction and customer
loyalty. Thus, the next hypotheses is:
H3: Customer satisfaction will have a positive relationship with customer loyalty.
As the previously mentioned, Swedish people might prefer local food brands, thus this paper
has these next two hypotheses:
H4: Swedish food brand preference will have a positive relationship with customer
satisfaction.
H5: Swedish food brand preference will have a positive relationship with customer loyalty.
3.3 Determination of target group
To design the questionnaire, the target group must first be decided. The target group should
be defined as accurately as possible. Based on the above hypotheses, the following section
will describe how the research target group is selected.
According to the hypotheses, the target population has to be the fast food restaurant customers
who have experience with both Max and McDonald’s. Thus, they can evaluate service quality,
customer satisfaction and loyalty objectively. In addition, to define national brand preference,
most respondents should be Swedish. With these target group necessary characteristics
defined, the sample population can be decided. Thus, the target group can be university
students and customers who are eating in fast food restaurants. It is easy to collect data within
this population. However, many previous studies have defined university students and
customers as the target group and their analysis data is based on these group responses. One
objective of this paper is to find out some special things to examine the strategic implications
for Max’s survival against global competition through evaluating the service quality of Max
and McDonalds. Thus, this study uses high school students as the research target group, being
the current and future consumers of fast food. In addition, most of them are Swedish, so it will

30
be possible to test national brand preference. Also when they grow up, the attitude of them
towards fast food brands and experiences can also influence people of the future generation,
such as their kids. Through their responses, the writers can discuss the future trends in the fast
food industry and make some significant contributions to Max and McDonald’s, as well as
other local fast food companies and global players in the industry.
3.4 Data collecting method
There are two different approaches to collecting data: quantitative and qualitative. This study
is mainly quantitative, where 322 Likert-scale questionnaires are collected. 26 respondents are
asked afterwards to answer some interview questions, which are analyzed using a qualitative
approach.
Questionnaire and interviews are two important types of the self-report approach (Leary
2012). According to Leary (2012, p.85), “Many dependent variables in experimental research
are assessed via questionnaires on which participants provide information about their
cognitive or emotional reactions to the independent variable.” As this research has to focus on
customer experiences based on the research questions and the hypotheses including many
dependent variables and independent variables, the writers have chosen to conduct both a self-
completion questionnaire and interviews.
Before designing the questionnaire, an online survey has been considered. As the target group
has to be defined as high school students, the writers realize it is more difficult to do an online
questionnaire, even it is more convenient for data analysis. The high return rate is the main
advantage for using a paper questionnaire. In addition, it is also the cheapest and quickest way
to collect data.
To gain a deep understanding of the research questions, the writers also plan to interview
some students. Interview questions will include more details which are mentioned in the
questionnaires to get the real feeling of fast food in the students’ mind.
3.5 Determination of sample size
After defining target group and data collecting method, the writers have to decide the sample
size. Being university students of an international program, it is difficult to contact many high
school teachers. In addition, there are only around 25 students in one class. Thus, the writers

31
have contacted with teachers who working at different schools and visited 8 classes to
conduct questionnaires. The writers have also gone to secondary school and conducted the
survey with students passer-bys. The plan is to collect around 300 questionnaires in total and
interview around 25 students.
3.6 Questionnaire design
This section aims to provide an overview how the writers designed the questionnaire. Overall,
this questionnaire consists of four parts including introduction, screening questions, warm-up
questions and perception questions.
3.6.1 Introduction
The questionnaire begins with a short introduction:
Hi, we are students studying at Karlstad University. This research aims to examine the
strategic implications for Max’s survival against global competition through evaluation of
service quality of MAX and McDonalds. We would appreciate if you answer following
questions and thank you for your cooperation. –Shuai and Elodie
First, the writers introduce themselves, letting the participants know who they are. Then, the
research aim and why the questionnaire is being conducted is explained.
After the introduction, the writers have added two demographic questions about gender and
age. As the target group is high school students, questions regarding other factors such as
nationality and income are not asked.
3.6.2 Screening questions
To identify the respondents’ value to this survey, screening questions could select right
population to distribute this research and eliminate unsuitable participants (RobertA, 2000).
This survey needs the respondents to have experiences for fast food. Thus, the first questions
would be:
1. Do you eat fast food?
□Yes if respondents choose this, they would be right people this study

32
□No (Please return the questionnaire)if respondents choose this, they would be
unsuitable participants
This question could pre-select right the participants suited for the study and eliminate those
who are not. The respondents who choose Yes will continue to answer the following questions.
3.6.3 Warm-up questions
These questions aim to warm-up participants who choose Yes in the screening question. The
next part focuses on general and simple questions and develops the theme before perception
questions.
2. How often do you eat fast food?
□More than once per week □About once a week □A few times a month □Once a month □Less
than once a month
The second question can examine how the customers like to eat fast food. If high school
students choose relevant front options such as More than once per week or About once a
week, it means overall they like fast food and are satisfied with the industry. Otherwise, the
Swedish are not satisfied with their fast food restaurants.
3. Have you ever tried fast food restaurant MAX? □Yes □No
4. Have you ever tried fast food restaurant McDonalds? □Yes □No
5. Which restaurant do you prefer of these two?
□MAX □McDonalds □About the same
These three questions give the possibility to test how many people prefer Max or McDonalds.
The writers believe most fast food customers have experiences in Max or McDonalds.
3.6.4 Perception questions
According to the research model, this part can be divided by three parts: evaluation of service
quality and satisfaction, customer loyalty, national brand preference. Respondents are asked

33
their own perception and satisfaction of Max and McDonalds. The opinions of customers
would be important for future analysis.
First of all, to test the service quality of Max and McDonald’s, the following questions are
formulated to evaluate the high school students’ perception based on five factors of service
quality.
6. When you eat at fast food restaurant, which factor do you think is the most important?
(Please choose one answer)
□Location □Friendly Service □Atmosphere□Cleanliness □Opening hours □Quick Service
□Employees are helpful when you have problems or complaints □Price □Taste
The above nine elements are deemed important for fast food restaurant services through
interviewing some friends and researching previous studies on the topic. Question 6 can test
which factor would be the most important for Max, McDonald’s, and other restaurants in the
industry.
Based on the SERVQUAL and DINESERV models, the writers study five elements, tangibles,
reliability, responsiveness, assurance, and empathy to evaluate consumer perceptions on Max
and McDonald’s by using the Likert scale. In terms of tangibles, the customers’ perception of
location, taste, price, cleanliness are measured. Opening time and quick service are used to
measure reliability. The statement “Employees are helpful when you have problems or
complaints” is used to measure responsiveness; and for assurance and empathy, friendly
service and atmosphere are measured also by using the Likert scale. In Question 7, the last
statement “Overall I am satisfied with restaurant,” used to test the general customer
satisfaction.
Lastly, four questions are designed in order to test national brand preference and customer
loyalty. Degree of general preference for Swedish products and preference for Swedish origin
production of food ingredients are asked to evaluate the customers’ attitude towards national
brands. In terms of customer loyalty, two questions regarding the customers’ intention of
coming MAX again and recommending to friends are designed.
The whole questionnaire questions are showed by Appdenix1.

34
3.7 Questionnaire distribution
To conduct the study, the writers have asked for help from three teachers working at different
high schools and visited eight classes. In exchange for the students completing of the
questionnaires, the writers have given the classes presentations about the Chinese and
American education system. In order to keep the data random, the questionnaires are collected
from three different schools were contacted, including Älukullegymnasiet located in Karlstad,
Lundsbergskola in Storfors, and Hammarlunden in Hammarö Kommun.
3.8 Data coding
After collecting all questionnaires, the data must then be inputted to SPSS in order to be
analyzed. With the help of their supervisor, Professor Lars Haglund, the writers have made a
specific code for every answer. The coding table is shown in Appendix 2.
3.9 Interview questions design
After the questionnaire is finished by the respondent, sometimes he or she would be asked
some interview questions. This smaller sample of respondents is selected at random, 26 total
due to time restraints. The aim of this interview part of the survey is to clarify some of the
data collected from the questionnaire, and to gain a further understanding of the respondents’
perceptions as they answered the following four items on the questionnaire.
Taste:
1. What is taste? What sort of flavors/textures do you look for in a
burger/fries/salads/desserts/other menu items?
Atmosphere:
2. What is atmosphere? Do your friends affect your choice of eating out? Where would you
go for a typical lunch out with friends? If you like going out for coffee, what do you think
about the coffee and cake menus of MAX and McDonald’s?
National Brand Preference:

35
3. Why do you prefer Swedish products or larger international brands? Does it depend on the
particular product? Is it a matter of quality, price or style?
Country of Origin Preference:
4. Does country of origin matter to you? Are ingredients fresher that way? Are they healthier?
Are they generally higher quality if they are locally produced
These items are better explained with some open ended questions, where the respondents
describe what they believe these ideals to be for them personally.
3.10 Reliability and validity
The authors of this thesis wants to ensure trustworthiness of the whole project. Their findings
are based on 322 questionnaires and 26 personal interviews. Reliability means when future
researchers conduct the same questionnaire or test, the results would be the same (Miller
2009). Thus, to make sure the responses trustworthy, the authors use simple English words
when formulating the questionnaire so the respondents easily understand it. In addition, most
of time when the questionnaires are conducted, the teachers are also in the classroom. If there
is a language barrier, the teachers helped translate and explain the questions in Swedish. If
the students have some questions or a problem they do not understand, the authors are also
there to explain and discuss it with them. Thus, it can be guaranteed that the questions are, on
the most part, answered appropriately.
To increase the validity and to avoid mistakes and error as much as possible, the interview
questions are based on the questionnaires and the structure is very simple. The objective is to
gather further information on how participants make their decision for questions and gain a
deeper understanding the questionnaire results. Most students, when interviewed, become
more interested in the topic. The commentary they provide also increases validity of this
project.
3.11 Limitation
The target group is defined as high school students, however, because of time limitations,
samples are only collected from schools in Värmland. This sample is not widespread enough
to accurately represent Sweden. If there had been more time, questionnaires could be

36
conducted in other different cities such as Stockholm, Goteborg etc. That can allow the
samples to be more random.
Also, regarding the scales, it is generally considered inappropriate to treat the Likert scale as
an interval scale in theory. Using ordinal scale like Likert scale as an interval scale has always
been controversial (Jamieson 2004; Knapp 1990). Jamieson (2004) argues that “if the wrong
statistical technique is used, the researcher increases the chance of coming to the wrong
conclusion about the significance (or otherwise) of his.” However, some papers published in
Medical Education so use ordinal scales, such as the Likert scale, as interval scales, and
ANOVA tests. This method is commonly used in practice, and considered valid in practice,
but the writers also believe that is a possible limitation.

37
4. Data Analysis and Hypothesis Testing
A total of 322 samples are collected. 309 samples are available for data analysis. 13 samples
are unavailable because some of these students do not eat fast food and some of them had not
tried both MAX and McDonalds, thus they cannot evaluate factors and answer following
questions. To do the next data analysis by using SPSS20, the options of question 7-11 in the
questions are described in the next paragraph.
In the question 7, there are 5 options.
1. Strongly disagree
2. Disagree
3. Neither agree nor disagree
4. Agree
5. Strongly agree.
When this question is formulated, the interval between each option is equal. As the following
picture shows, the interval between 1, 2, 3, 4 and 5 is equal.
Strongly disagree strongly agree
It is assumed that if respondents choose option 1 strongly disagree, and then this answer will
get 1 point. If respondents choose option 2 disagree, and then this answer will get 2 points.
Option 3 Neither agree nor disagree represents 3 points and option 4 agree means 4 points. If
respondents answer option 5 strong agree, then they will get 5 points for this question.
As with Question 7, the interval between options in Questions 8 and 9, is equal like the
following chart shows. The points system is also used for these 2 questions.
Sometimes
No, never Yes, always
1 2 3 4 5
1 2 3 4 5

38
For the question 10 and 11, same with question 7, the interval between options is equal as the
following chart shows. Points system is also used in these 2 questions.
Maybe, not sure
No Yes, definitely
According to Knapp (1990), using an ordinal scale as an interval scale has always been
controversial. Previous research have assumed that Likert scales can be treated as an interval
scale, but Jamieson (2004) disagrees with this practice, arguing that while it is common
practice to treat the Likert scale as an interval scale to measure data, however, the numbers of
the Likert scale represents verbal statements, and it cannot accurately represent interval data.
Nevertheless, some published works, such as in Medical Education, has used the Likert scale,
while describing data in terms of standard deviation and means, as well as, using ANOVA
tests (Jamieson, 2004).
The authors of the current research asserts that it is indeed valid to use the Likert scale as an
interval scale. While Jamieson (2004) paraphrases Kuzon Jr et al.’s argument, “the average of
fair and good is not fair and a half, this is true even when one assigns integers to represent
fair and good!” (1996; cited in Jamieson, 2004, p.1218) the authors believe, on the contrary,
that it is reasonable to say there is an in-between of fair and good, at least in practice. It is fair
to say that on average, the consumers are leaning towards satisfied, but not quite there yet.
4.1 Demographic of the sample
As the research target group is high school students, in this part only gender and age are asked
in the questionnaire. Appendix 3 shows frequencies table of these two factors. Males account
for 46 percent of total students while female account for 54 percent of samples. There is a
little bit difference between them, but it seems to be a balance between males and females. In
addition, according to the age frequency table (see Appendix 3), 62.8 percent of students are
between 16 and 18 years old. Most of samples belong to 14-20 groups. This is the target
group the writers have wanted.
1 2 3 4 5
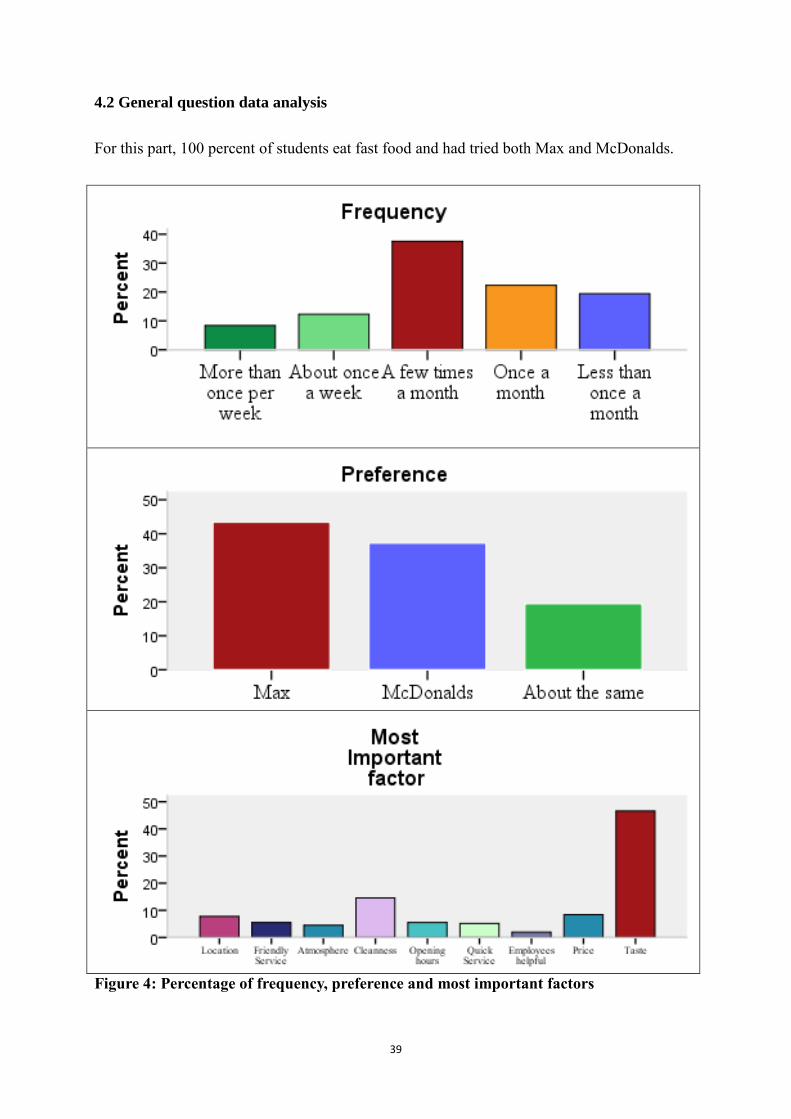
39
4.2 General question data analysis
For this part, 100 percent of students eat fast food and had tried both Max and McDonalds.
Figure 4: Percentage of frequency, preference and most important factors

40
The figure shows most of students eat fast food at least once a month. Preference and most
important factor are important for the research. According to the chart, 43.4 percent of
students prefer Max while 37.2 percent of them like McDonalds more. Also, around 20
percent of students think they are same. In addition, 46.6 percent of students think taste is the
most important factor for fast food restaurant, cleanliness account for second place. And price
and location take almost 8 percent respectively.
Crosstab and Chi-square in SPSS20 are used in order to test if there is a difference in
preferences between gender and age groups.
Table 1: Difference of preference between genders
Preference Total
Max McDonalds About the same
Gender Male 68 44 30 142
Female 66 71 30 167
Total 134 115 60 309
Chi-Square Tests
Value Df Asymp. Sig. (2-sided)
Pearson Chi-Square 4,375a 2 ,112
As the Chi-Square tests show, P-value=0.112>0.005. By that, it means gender has no
significant effect on preference. However, does age affect customers preference?
Table 2: Difference of preference between age groups
Preference Total
Max McDonalds About the same
AgeGroup
under 15 17 34 14 65
16-18 90 67 37 194
19plus 27 14 9 50
Total 134 115 60 309

41
Chi-Square Tests
Value df Asymp. Sig. (2-sided)
Pearson Chi-Square 11,861a 4 ,018
As P-value=0.018<0.05, the outcome shows age has a significant effect on customer
preference. From the crosstab, clearly shows students under 15 prefer McDonalds while the
16-18 and 19 plus age groups like Max more.
In short, the preference is rather equal between Max and McDonald’s and they have different
age loyal customers. This indicates the overall services in Max and McDonald’s is rather
similar in the customers’ mind and it clearly shows that the competition between them is quite
intense. Thus, the research on which factors can affect customer satisfaction looks more
important. Max must consider the following questions to win the market in the future.
1. Which factors are relatively important in customers mind?
2. Is there difference between the factors and gender, age group?
3. Which factors impact customer satisfaction and loyalty?
4. Which factors Max is doing well so far?
5. Which factors McDonalds is doing better so far?

42
4.3 Service quality analysis
In order to see the competition between Max and McDonald’s, the writers try to find out
which factors Max is doing better on and which McDonald’s is doing better on through
comparing the means of Max and McDonald’s service quality evaluation scores. Second, this
section will try to find out the differences of in perception towards the service quality factors
between genders and age groups in both restaurants.
To compare the customer attitudes towards Max and McDonald’s, particularly in the
evaluations of different service quality factors, the writers use the mean to analyze the
preference of customers. Table 3 describes the difference in average scores in each restaurants
between factors.
Table 3: Difference in average scores between factors
Factors Mean
Max Location 2,78
McDonald’s Location 4,34
Max Atmosphere 3,37
McDonald’s Atmosphere 2,64
Max Cleanliness 3,54
McDonald’s Cleanliness 2,90
Max Opening Hours 3,86
McDonald’s Opening Hours 4,33
Max Price 3,55
McDonald’s Price 3,93
Max Taste 4,05
McDonald’s Taste 3,62
The table shows McDonald’s location, opening hours and price are better than Max’s, while
Max scores better in taste, atmosphere, and cleanliness. There is no big difference for other
factors which are showed by Appendix 4. However, in order to find more interesting facts, the
difference in perception between gender and age groups regarding the service quality factors
of Max and McDonald’s is tested. A significance level of 5% have been chosen for the
statistical tests. Only significant results are shown in the tables. The complete results,
including the p-values, are shown in the appendices.
First, to examine the difference of Max service quality evaluations between genders, an
independent samples test is used. Table 4 only shows significant results (Appendix 5 shows

43
the complete tables).
Table 4: Difference of Max’s taste score between genders
Group Statistics
Gender N Mean Std. Deviation
Max
Taste
Male 142 4,19 ,97
Female 167 3,93 1,12
Only taste has a significant different score between genders. The data clearly shows that the
male respondents (M=4.19, SE=0.97) think the taste of Max is better than the female
respondents do on average (M=3.93, SE=1.12).
Even though the difference is not very much, it may still be important for Max to improve the
taste for its female customers, because taste is the most influential factor towards overall
satisfaction.
Second, Table 5 shows the significant differences in the evaluation of McDonald’s service
quality factors between genders. Only cleanliness has showed a significant difference.
(Appendix 6 shows the complete tables)
Table 5: Difference of McDonald’s cleanliness score between genders
Group Statistics
Gender N Mean Std. Deviation
McDonalds Cleanliness Male 142 3,02 1,01
Female 167 2,79 ,90
The above tables clearly shows male respondents (M=3.02, SE=1.01) think the cleanliness of
McDonald’s is better than the female respondents do (M=2.79, SE=0.90).
The result also indicates that most females think the cleanliness of McDonald’s is not as good,
or more likely, female consumers are more critical when it comes to clean facilities. In fact,
neither gender group are particularly satisfied with McDonald’s cleanliness. McDonald’s
usually has its store locations near train and bus stations, as well as other central locations.
These busy, often crowded, areas can affect the cleanliness of restaurant. However,
cleanliness being a very important factor for fast food restaurant should be improved to attract
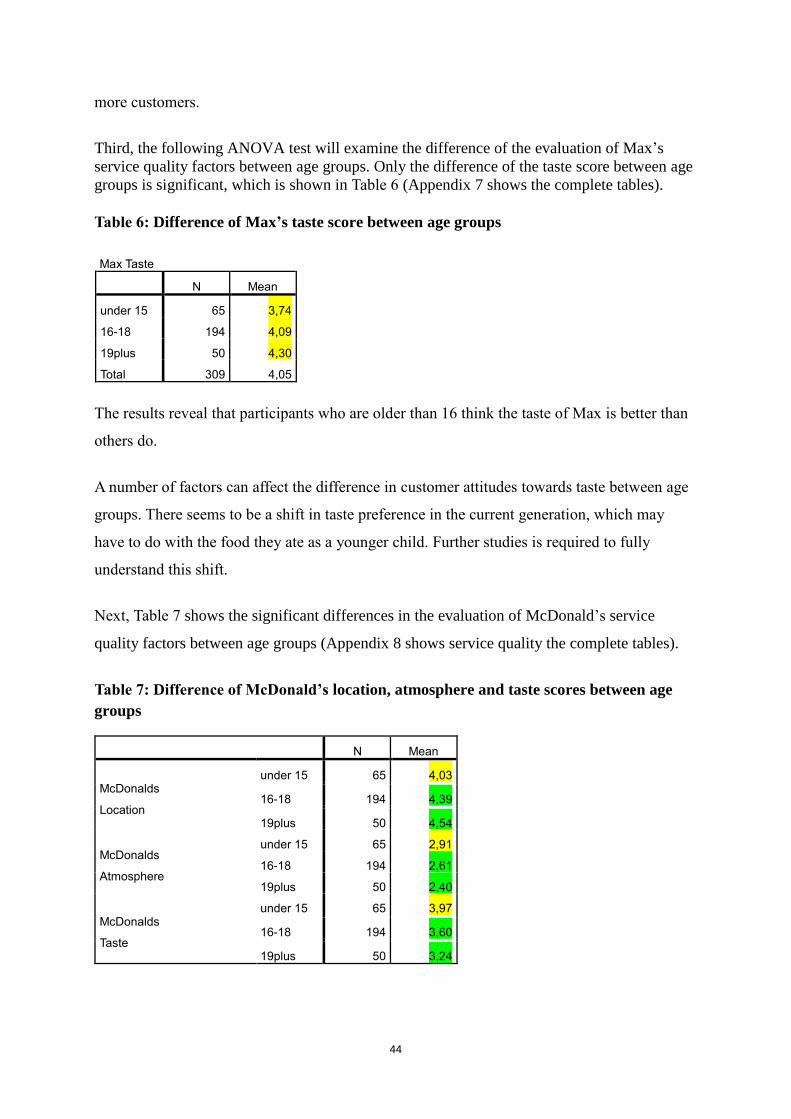
44
more customers.
Third, the following ANOVA test will examine the difference of the evaluation of Max’s
service quality factors between age groups. Only the difference of the taste score between age
groups is significant, which is shown in Table 6 (Appendix 7 shows the complete tables).
Table 6: Difference of Max’s taste score between age groups
Max Taste
N Mean
under 15 65 3,74
16-18 194 4,09
19plus 50 4,30
Total 309 4,05
The results reveal that participants who are older than 16 think the taste of Max is better than
others do.
A number of factors can affect the difference in customer attitudes towards taste between age
groups. There seems to be a shift in taste preference in the current generation, which may
have to do with the food they ate as a younger child. Further studies is required to fully
understand this shift.
Next, Table 7 shows the significant differences in the evaluation of McDonald’s service
quality factors between age groups (Appendix 8 shows service quality the complete tables).
Table 7: Difference of McDonald’s location, atmosphere and taste scores between age
groups
N Mean
McDonalds
Location
under 15 65 4,03
16-18 194 4,39
19plus 50 4,54
McDonalds
Atmosphere
under 15 65 2,91
16-18 194 2,61
19plus 50 2,40
McDonalds
Taste
under 15 65 3,97
16-18 194 3,60
19plus 50 3,24
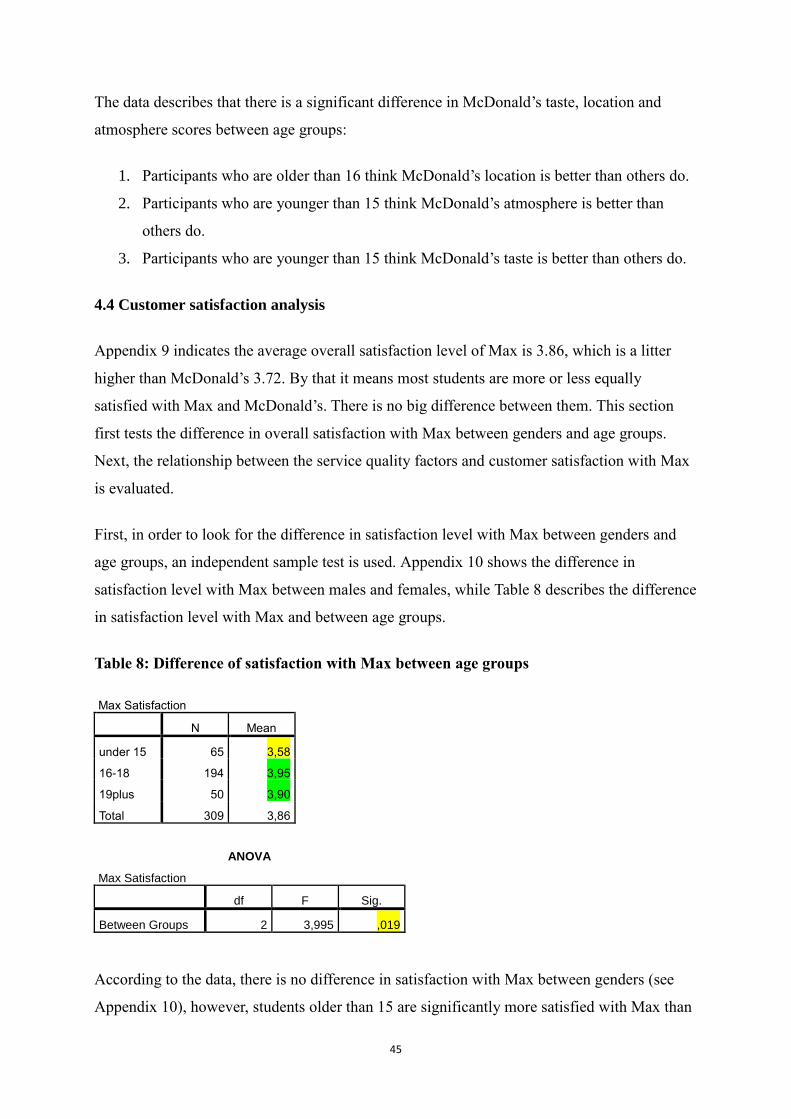
45
The data describes that there is a significant difference in McDonald’s taste, location and
atmosphere scores between age groups:
1. Participants who are older than 16 think McDonald’s location is better than others do.
2. Participants who are younger than 15 think McDonald’s atmosphere is better than
others do.
3. Participants who are younger than 15 think McDonald’s taste is better than others do.
4.4 Customer satisfaction analysis
Appendix 9 indicates the average overall satisfaction level of Max is 3.86, which is a litter
higher than McDonald’s 3.72. By that it means most students are more or less equally
satisfied with Max and McDonald’s. There is no big difference between them. This section
first tests the difference in overall satisfaction with Max between genders and age groups.
Next, the relationship between the service quality factors and customer satisfaction with Max
is evaluated.
First, in order to look for the difference in satisfaction level with Max between genders and
age groups, an independent sample test is used. Appendix 10 shows the difference in
satisfaction level with Max between males and females, while Table 8 describes the difference
in satisfaction level with Max and between age groups.
Table 8: Difference of satisfaction with Max between age groups
Max Satisfaction
N Mean
under 15 65 3,58
16-18 194 3,95
19plus 50 3,90
Total 309 3,86
ANOVA
Max Satisfaction
df F Sig.
Between Groups 2 3,995 ,019
According to the data, there is no difference in satisfaction with Max between genders (see
Appendix 10), however, students older than 15 are significantly more satisfied with Max than

46
the younger students are, with a p-value of less than .05.
Appendix 11 shows the difference in satisfaction level with McDonald’s between genders;
and the following table describes the significant differences in overall satisfaction of
McDonald’s between age groups.
Table 9: Difference of satisfaction with McDonald’s between age groups
McDonalds Satisfaction
N Mean
under 15 65 3,88
16-18 194 3,76
19plus 50 3,38
Total 309 3,72
ANOVA
McDonalds Satisfaction
df F Sig.
Between Groups 2 4,516 ,012
The significant results are that younger students who are under 15 years old are more satisfied
with McDonalds than others are. There is no difference in satisfaction with McDonald’s
between genders (see Appendix 11).
Second, to test which service quality factors have a significant impact on satisfaction, a
regression model is used. Table 10 and Table 11 describe Max and McDonald’s data
respectively.
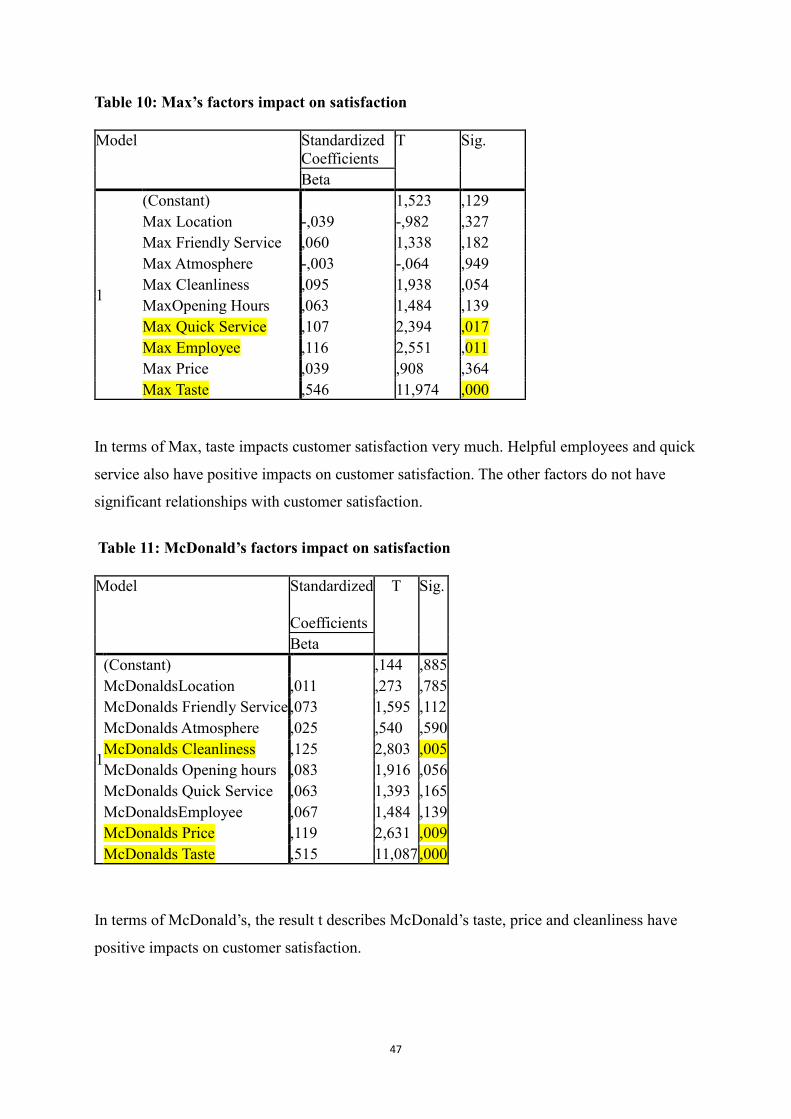
47
Table 10: Max’s factors impact on satisfaction
Model Standardized
Coefficients
T Sig.
Beta
1
(Constant) 1,523 ,129
Max Location -,039 -,982 ,327
Max Friendly Service ,060 1,338 ,182
Max Atmosphere -,003 -,064 ,949
Max Cleanliness ,095 1,938 ,054
MaxOpening Hours ,063 1,484 ,139
Max Quick Service ,107 2,394 ,017
Max Employee ,116 2,551 ,011
Max Price ,039 ,908 ,364
Max Taste ,546 11,974 ,000
In terms of Max, taste impacts customer satisfaction very much. Helpful employees and quick
service also have positive impacts on customer satisfaction. The other factors do not have
significant relationships with customer satisfaction.
Table 11: McDonald’s factors impact on satisfaction
Model Standardized
Coefficients
T Sig.
Beta
1
(Constant) ,144 ,885
McDonaldsLocation ,011 ,273 ,785
McDonalds Friendly Service ,073 1,595 ,112
McDonalds Atmosphere ,025 ,540 ,590
McDonalds Cleanliness ,125 2,803 ,005
McDonalds Opening hours ,083 1,916 ,056
McDonalds Quick Service ,063 1,393 ,165
McDonaldsEmployee ,067 1,484 ,139
McDonalds Price ,119 2,631 ,009
McDonalds Taste ,515 11,087 ,000
In terms of McDonald’s, the result t describes McDonald’s taste, price and cleanliness have
positive impacts on customer satisfaction.

48
4.5 National brand preference analysis
Appendix 12 frequency tables of national food preference show most of student like Swedish
products in general and they like Swedish origin food.
In order to test if there is a difference of Swedish food brand preference between genders, age
groups, t-tests and one-way ANOVAs are used in SPSS20 (see Appendix13). Both male and
female like Swedish brands and country origin and the different age groups like Swedish
brands and country origin as well. There is no significant difference of Swedish food
preference between genders, age groups. This gives the Swedish company Max a competitive
advantage against the foreign-owned McDonald’s.
4.6 Customer loyalty analysis
According to frequency table of customer loyalty (see Appendix 14), 22.7% of students do not
want to go Max next time and only 11.3% of them do not want to recommend Max to their
friends. However, 51.5 percent of young people will advise their friends to Max if they want
to eat fast food.
To test if there is a difference in customer loyalty between genders , age groups, different tests
run in SPSS. A t- test is used to examine the difference in customer loyalty between genders.
The data (see Appendix 15 ) shows there is no difference between them. A one-way ANOVA
is used to test the difference in customer loyalty between age groups, where the results
revealed a significant difference. The data describes that students who are older than 15 years
old have higher loyalty to Max than younger students do (under 15). This finding could
indicate a shift in preference in the current generation. While it may be unlikely the children
and family approach of McDonald’s is what appeals to younger adolescents, it is possible that
the under 15 group would visit fast food restaurants accompanied with their parents more
often than the older age groups would. The writers believe developing a preference for Max
or McDonald’s could happen at an earlier age. Therefore, further studies with a broader
sample is needed to understand the difference between age groups. But if Max can appeal to a
younger audience too, they will have a larger customer base, such as parents.
4.7 Hypothesis testing
As discussed in the Methodology chapter, there are 5 hypotheses in this research. The

49
following part will test them by using SPSS.
Hypotheses 1 testing
H1: Service quality of MAX will have a positive relationship with customer satisfaction.
H1-1: Tangibles of MAX will have a positive relationship with customer satisfaction.
H1-2: Reliability of MAX will have a positive relationship with customer satisfaction.
H1-3: Responsiveness of MAX will have a positive relationship with customer satisfaction.
H1-4: Assurance of MAX will have a positive relationship with customer satisfaction.
H1-5: Empathy of MAX will have a positive relationship with customer satisfaction.
Table 12: Hypotheses 1 testing
Model Standardized
Coefficients
t Sig.
Beta
1
(Constant) ,670 ,504
MaxTangibles ,397 6,936 ,000
MaxReliability ,108 2,128 ,034
MaxResponsiveness ,153 2,938 ,004
MaxAssurance ,088 1,713 ,088
MaxEmpathy ,069 1,309 ,192
According to the regression model’s outcome, Max’s tangibles, reliability and responsiveness
have a significantly positive relationship with customer satisfaction with a P-value less than
0.05. And the chart describes Max’s tangibles with Beta=0.397, by that it means Max
tangibles has a very strong positive relationship with customer satisfaction. Thus, hypotheses
H1-1, H1-2 and H1-3 cannot be rejected while hypotheses H1-4 and H1-5 can be rejected.

50
Hypotheses 2 testing
H2: Service quality of MAX will have a positive relationship with customer loyalty.
H2-1: Tangibles of MAX will have a positive relationship with customer loyalty.
H2-2: Reliability of MAX will have a positive relationship with customer loyalty.
H2-3: Responsiveness of MAX will have a positive relationship with customer loyalty.
H2-4: Assurance of MAX will have a positive relationship with customer loyalty.
H2-5: Empathy of MAX will have a positive relationship with customer loyalty.
Table 13: Hypotheses 2 testing
Model Standardized
Coefficients
T Sig.
Beta
1
(Constant) -,997 ,320
MaxTangibles ,460 7,353 ,000
MaxReliability -,007 -,131 ,896
MaxResponsiveness -,033 -,575 ,566
MaxAssurance ,111 1,971 ,050
MaxEmpathy ,036 ,622 ,534
Based on the outcome given by the regression model, only Max’s tangibles have a positive
relationship with customer loyalty, with P-value=0.000<0.05, Beta =0.46, showing a strong
positive relationship. As the P-value of Max’s reliability, responsiveness, assurance and
empathy exceeds 0.05, hypotheses H2-2, H2-3, H2-4 and H2-5 can be rejected and only
hypotheses H2-1 is not rejected.
Hypotheses 3 testing
H3: customer satisfaction will have a positive relationship with customer loyalty.

51
Table 14: Hypothesis 3 testing
Model Standardized
Coefficients
T Sig.
Beta
1
(Constant) 4,962 ,000
Max
Satisfaction
,392 7,462 ,000
According to the outcome, P-value =0.000<0.05, Beta=0.392, Max’s customer satisfaction
has strong relationship with its customer loyalty. Thus, hypotheses 3 is not rejected.
Hypotheses 4 testing
H4: Swedish food brand preference will have a positive relationship with customer
satisfaction.
Table15: Hypotheses 4 testing
Model Standardized
Coefficients
t Sig.
Beta
1
(Constant) 12,741 ,000
NationalBrandPreferenc
e ,016 ,286 ,775
The P-value shows brand preference is not significant to customer satisfaction, thus
hypotheses 4 can be rejected.
Hypotheses 5 testing
H5: Swedish food brand preference will have a positive relationship with customer loyalty

52
Table 16: Hypotheses 5 testing
Model Summary
Model R R Square Adjusted R
Square
Std. Error of
the Estimate
1 ,183a ,033 ,030 1,22292
Predictors: (Constant), NationalBrandPreference
Model Standardized
Coefficients
T Sig.
Beta
1
(Constant) 5,531 ,000
NationalBrandPreferenc
e ,183 3,253 ,001
Model summary describes 3.3% of customer loyalty can be explained by national food
preference. Based on the outcome, P-value =0.001<0.05, B =0.325 and Beta=0.183, the data
shows national food preference has a significantly positive relationship with Max’s customer
loyalty. Thus, hypotheses 5 cannot be rejected.
In short, according to data, these are some facts the writers found from data analysis, and they
are shown as follows:
1. The preference is rather equal between MAX and McDonald’s
2. Students under 15 prefer McDonalds while the 16-18 and 19 plus age group students like
Max more.
3. Most important factor ranking: 1. Taste 2. Cleanliness 3. Price 4. Location 5. Opening
hours and Friendly service 6. Quick service 7. Atmosphere 8. Helpful employees.
4. The factors which MAX is doing better than McDonald’s: Taste, cleanliness, Atmosphere
5. The factors which McDonald’s is doing better than MAX: Price, Location, Opening hours.
6. The factors which impact MAX’s customer satisfaction: Taste, Helpful employee, quick
service.
7. The factors which impact McDonalds customer satisfaction: Taste, price, cleanliness.
8. Males like the taste of Max more.

53
9. Males respondents think the cleanliness of McDonalds is better than female respondents
tend to.
10. The students who are older than 15 think the taste of Max is very good.
11. Participants who are older than 15 think McDonalds location is significantly better than
others do (P-value=0.002<0.05).
12. Participants who are younger than 15 think McDonalds atmosphere is significantly better
than others do (P-value=0.029<0.05).
13. Participants who are younger than 15 think McDonalds taste is significantly better than
others do (P-value=0.029<0.05).
14. Younger students who are under 15 are more satisfied overall with McDonalds than Max,
and they show high loyalty to McDonalds.
15. Older students (15 plus) are more satisfied overall with Max than McDonalds, and they
show high loyalty to Max.
16. Tangibles of MAX will have a positive relationship with customer satisfaction and loyalty.
17. Swedish food brand preference has a positive relationship with customer loyalty for Max.

54
5. Interview Results
Ten groups of up to five students, with a total of 26 interviewees, were asked interview
questions after they have filled in the survey. The questions are as follows:
1. What is taste? What sort of flavors/textures do you look for in a
burger/fries/salads/desserts/other menu items?
2. What is atmosphere? Do your friends affect your choice of eating out? Where would you
go for a typical lunch out with friends? If you like going out for coffee, what do you think
about the coffee and cake menus of MAX and McDonald’s?
3. Why do you prefer Swedish products or larger international brands? Does it depend on the
particular product? Is it a matter of quality, price or style? Do Swedish brands make you
proud of your country?
4. Does country of origin matter to you? Are ingredients fresher that way? Are they healthier?
Are they generally higher quality if they are locally produced?
The researchers asked students who are on break outside the classrooms. Some are alone,
while others are with their friends. The researchers believe in this creates a more natural
setting, where their friends responses may influence the interviewee’s answers, as it would if
they, at the moment, are choosing a place to go out and eat together.
Groups with more than three students tend to have a spokesperson, one or two interviewees
who are quite opinionated and their friends would agree their responses.
Group 1 (3 females): One interviewee describes the taste of McDonald’s burgers as “wet, like
it’s been sitting there for a while - MAX is more fresh, but McDonald’s taste better,” and she
likes “crispy, salty fries, that are not too oily.” The other two interviewees in the group agree.
That interviewee describes MAX’s Lyxshake as “very good,” and another interviewee
preferred McDonald’s ice cream. All three interviewees liked McDonald’s salads, because
there is a variety of flavors available and while they believe salads to be a healthy choice,
taste is usually more important to them. One interviewee liked Max’s salads, the others never
tried it.
55
One interviewee orders take-out meals usually, and she likes ice cream in the summer. She
goes to McDonalds more often for a quick lunch with friends, because it is closer and has
more opening outs. Another interviewee likes McDonald’s for travel, while the third adds that
it provides a simple meal, although she does go often.
Whether or not their purchases “Swedish” only matter to one of the interviewees in this
group. She likes Swedish brands because they are more environment friendly and higher
quality, plus “you are used to it.” However, this also depends on the product. It is only
important to her when it comes to food. Nevertheless, all three agree that food should be
produced in Sweden.
Group 2 (1 male, 19 to 20): The interviewee prefers Max burgers, which are “more filled,
have more dressing, juicier, and therefore tastier.” He describes Max is more expensive, but
the portion sizes are larger. So, it evens out in that sense. He usually does not order other
menu items in MAX besides burgers, fries and a drink, but he likes to go to McDonald’s for a
value menu cheeseburger and their ice cream. To him, McDonald’s is cheaper, more
convenient, but not as good.
It is his belief that “McDonald’s is a cheap convenient place to hang out with friends, but of
course not for a date. Max more suited for that, being fancier and having more style. Max is
original.”
He does not feel there is a difference between Swedish and foreign brands, but fresh
ingredients are important. For instance, he believes “meat should not have to come from
Argentina and travel to China, then Germany, etc. before finally making it to Sweden.”
Although it is sometimes more expensive to buy Swedish origin food, he thinks they are “not
processed” and “fancier” this way.
Group 3 (3 males, 16-18): This group is not particularly enthusiastic about neither MAX nor
McDonald’s. One of the interviewees said he liked his burgers with bacon, in which another
interviewee responded by saying he did not like bacon at all. The third interviewee like lots of
cheese. One gave Max a very low score in taste, where “he only ate at once or twice.” The
group almost never order other menu items other than the main course and they prefer Burger
King’s charbroiled flavor.
An interviewee often goes to McDonald’s with his friends, because of the convenient

56
location. However the group is generally not particular about their choice of eating out. “As
long as it’s not dirty,” one of them says.
Neither the “Swedishness” of the brand nor country of origin is not important to any of the
three. It is all “the same” to them.
Group 4 (1 male and 1 female, 16-18): The female interviewee likes hamburgers in general,
and some side dishes and desserts if she has more time to eat. She describes herself as “not
picky” and “just likes to eat.” The male interviewee prefers Chinese food to hamburgers. Price
is more important to him, so he would order more extra items if he’s not paying.
The male interviewee says “McDonald’s is crowded and not as clean, but the location is
better,” and the female interviewee agrees with the statement. They also agree that they like to
go for fast food with others – never alone or they “just feel fat.” Their choice of restaurants
depends mostly on where they are and which place is closer.
Price is also important to them when buying other things. They perceive smaller, local brands
as being cheaper; but of course they’d “buy big brands, like Ralph Lauren, NIKE and H&M if
they can be afforded.” The male interviewee owns a Lyle & Scott jacket that he really likes.
He does not know of the brand’s origin, nor does he care, he just really likes the brand. The
female interviewee believes Swedish products are better for the environment, and the male
interviewee agrees that it is better when the food “haven’t been in a truck for 58 days.”
Group 5 (3 females, 16-18): This group believes it is important “how the meat is cooked” that
makes a burger taste good. Max is fresher, but a little more expensive, according to them.
However, they agree that Max gives more food for that price. One interviewee likes Max’s
salads. They all usually don’t eat at Max, preferring McDonald’s “cheapness” and more
varied menu.
They live close to a McDonald’s, so they “go there often for a quick meal, and [they] also like
to hang out with friends there.” They “eat around town a lot” and if not McDonald’s they go
to cafes and sometimes, fancier restaurants. They like Thai food and the salads and pastas at
Wayne’s Coffee. One likes McDonalds’ coffee, but “only takeaway.” The others prefer going
to a café instead, and don’t order coffee at McDonald’s.
The group likes “H&M being cheap, because they don’t have money.” Swedish-origin

57
ingredients, to them, are expensive but tastier. Otherwise, not a lot of other products are
produced in Sweden.
Group 6 (3 males and 2 females, mixed age group): To this group, the two fast food
restaurants are “just different.” Max is “slower and more expensive.” They prefer the taste of
Max because they are “made as you order it.” If they have more money, they would choose
Max.
They often go to McDonald’s because it is easier to find, but they prefer Max if “it’s
available.” They enjoy going to a café instead if they have more time. A female respondent
says, “McDonald’s coffee is gross,” however the other interviewees in the group claims, “it’s
not so bad.”
Some interviewees feel that Swedish brands are “fresher” and they give them “a sense of
pride for their country.” They also believe Swedish brands are better for the environment,
especially when they are also produced in Sweden. They think “food that travels, does not
sound very nice, it’s gross. A local farm would be a nice place to get ingredients from.” One
mentioned hearing an account from a friend that works at McDonald’s about “feathers” in the
burgers.
Group 7 (1 female and 1 male, 16-18): When they eat fast food, they both say they “just eat”
and “want it fast.” Taste is not important to them. In general, they do not like burgers. They
like other menu items, such as salads, but they “just don’t eat fast food often.”
When eating out, they prefer something nice. Fast food restaurants are “kind of crowded” and
“not a nice hang-out” to them.
Brands are not too important to this interview group. “It’s how the individual product looks, I
don’t buy things for the brand,” the female interviewee said. Nonetheless, they do like “local
food that hasn’t traveled” because that is “environmental and you know the exact process.”
The female interviewee claims the COO of the food is very important to her family – they do
the research and are quite careful about it. However, this isn’t always the case with herself,
although she thinks she should pay more attention.
Group 8 (1 male, 16-18): This interviewee prefers Max’s fries, because they are “crispy”; and
MAX’s ice cream, because of its “richer chocolate.”

58
He eats out in fast food restaurants often with friends, but not alone. He likes a “happy
location” that is “not too quiet.”
National brands and origin are not important to him when choosing between products.
Group 9 (4 females and 1 male, 16-18): They agree Max is better because of it is “fresh” -
the restaurant “makes it as you order it” – and the burgers have more vegetables in it. One
interviewee prefers McDonald’s chicken nuggets – they are “crispy unlike the ones at Max.”
The interviewees often like to eat out with friends, and “it depends on our mood what we get.
It doesn’t really matter,k but fast food is cheaper, cafes are more cozy but pricier, and both
McDonald’s and Max offers cheap and quite tasty café items.”
It is also unimportant to them if the brand is Swedish or not. They buy things based on price
mostly, but they also like high quality and fashionable brands, such as Levi’s, Apple, and
Samsung. An interviewee mentioned H&M as “Swedish” but she doesn’t like it because “it
has come under criticism, for example, they treat their employees badly.” Another liked H&M
for being cheap, but he agrees with the previous statement. The group believes goods should
be produced in Sweden, It is better for the environment this way. Although, it is not always
possible.
Group 10 (1 male, 20): He claims, “McDonald’s meat is mostly soy. It is not real meat. Max
has real meat. It fees real.” This interviewee would “choose Max all the time, if the price
would the same.” He usually only orders a burger. “No fries. Too fat,” he says, “Sometimes
ice cream. I like BK’s brownie cakes with their soft centers and ice cream on top.”
For him, fast food restaurants are “not a proper eating place.” It’s more about “quick” and
“the design is functional – just squeeze people in. It’s not very comfortable.”
Regarding brand choices, the interviewee believes “Brand is status. It gives you a good first
impression. You only get one chance at a first impression. It’s superficial, but it’s true.” If he
could afford it, he would definitely choose a luxury brand, such as Audi “a German brand that
since 2005 have gone from a working to mediocre to now recently, a luxury brand.” The
interviewee is from Russia, and he claims to have “no national pride,” especially not for
“Russian brands, because buying crappy products is not a way to care about your people.” He
feels that food from his home country are “unnatural,” while Swedish-produced food is “more

59
eco, not completely environment friendly, though, because they still slaughter cows.”
There is a general preference for the taste of Max burgers, for being freshly-made, if they are
specific about how their burgers taste. Additional menu items not as important. Ice cream is a
popular choice if something other than the main course is ordered. Interviewees tend to
choose to eat at McDonald’s for being cheaper, although not necessarily as good as Max.
The students tend to prefer to eat fast food with friends. It’s more about convenience than any
particular interior design. Several interviewees described both McDonald’s and Max’s
environment as not very clean nor comfortable. However, this is not a problem because they
only want a quick meal. The opinion on café menu items is divided. Some consider them to be
a cheap alternative to going to a coffee shop, while others would never order coffee or cake at
neither fast food restaurant. They prefer the cozier environment of cafes such as Wayne’s
coffee, or think Max’s and McDonald’s coffee do not taste very good.
Most interviewees agree that food should be produced in Sweden, because it is fresher and
more environmental friendly that way. However, the ownership of the brand is not so
important. They choose based more on price, quality or personal style, and sometimes status,
than for ethnocentric reasons.

60
6.Discussion
6.1 Managerial implications of service quality questionnaire and interview results
From the questionnaire, helpful employees (responsiveness), friendly service (assurance) and
atmosphere (empathy) ranked last in importance, and these factors are never mentioned in the
interviews as being important to the respondents’ choice of burgers. On the contrary, attributes
such as giving customers personal attention and solving problems are considered very
important to the customer’s perceived quality of the offering in the established literature
regarding service quality (Vanniarajan & Meharajan, 2012; Lee, et al., 2004). Max and
McDonald’s are a subcategory of restaurants known as a quick service restaurant, or fast food,
which may explain the results of this study.
As mentioned in de Chernatony and McDonald (1998), restaurants lie in the middle of the
spectrum of products and services, being high in experience qualities. The writers believe a
fast food restaurant may lean towards being more focused on the physical product. According
to many interviewees, emphasis is placed on taste, but often price and location are considered
to affect their decisions even more; however, neither Max nor McDonald’s is regarded as
“fancy” or “cozy and comfortable.” They would pay more if they wanted to go somewhere
“nicer.” Moreover, they order individual menu items according to their budgets. Often, they
will say that they are unwilling to spend much on fast food. This is in agreement with the
findings of Lau et al. (2005), where the tangibles are shown to be most important to overall
satisfaction; and that of Vanniarajan and Meharajan (2012), where for a restaurant service,
cleanliness, quick service, taste and price are shown to have strong impacts on perceived
overall service quality. Not mentioned in the literature is location, which proved to be very
important to overall satisfaction in this study. Many interviewees have said they eat what is
nearby when getting fast food. Thus, the writers conclude that in the fast food industry,
customers are more concerned about the physical offering and the convenience of getting it,
while caring less about responsiveness, assurance and empathy attributes.
The results also imply that the Swedish fast industry is one where consumers seek variety, and
as Bogomolova (2010) asserts, this will make them more critical. The competition between
Max and McDonalds is rather equal, with an overall satisfaction average score of 3.86 and
3.72, respectively – meaning that the sample population almost agree that they are overall
satisfied with each fast food restaurant. According to the questionnaire's results, most students
61
are not sure if they will go to Max next time (47,9%), while 22.7% say they won't and 29.4%
say they definitely will. The questionnaire results indicate that customers are not completely
satisfied with neither Max nor McDonalds, and that they tend to seek variety instead of
sticking with a favorite brand in the Swedish fast food industry. However, the results does
show that customer satisfaction has a strong relationship with customer loyalty.
Additionally, the results indicate that it is possible that the two fast food restaurants use
different strategies, McDonald’s low cost versus Max’s high quality.
Max’s strengths are its perceived higher quality, superior taste, cleanliness, and general
atmosphere; although the last is not significantly important to satisfaction. Taste, according to
the study’s results, is the most important factor for this industry, and cleanliness ranks second.
Max’s weakness lies in its lack of service speed. However, many interviewees assert Max’s
superior taste lies in the fact they are made as they are ordered. From the researchers’ personal
observation, this may be overcome by better trained employees, as often service seems to be
slow due to their unresponsiveness and inefficiency. Also to its disadvantage is Max’s
inconvenient location. While McDonald’s is all over the place, you must go out of your way
to go to Max. This is very bad for FAST food, where consumers seek a quick meal.
In contrast, McDonald’s has a training program that is regarded highly worldwide; and its
value menu gives them a competitive edge with their low prices, as does its convenient,
widespread locations and longer opening hours. All three factors are significant to customer
satisfaction, ranking 3rd
, 4th
and 5th
in importance. However, McDonald’s did not do as well in
taste and cleanliness, the two most important factors to customer satisfaction. If they improve
these factors, they may easily have very good overall satisfaction.
6.2 Managerial implications of national food preference questionnaire and interview
results
Swedish people like Swedish food according to statistical tests, but the interview reveal
different results when it comes to brands in general. Only members of one interview group
have expressed ethnocentric motives for liking Swedish brands. Price seems to be the most
important factor, and if they do not put money into consideration, the students like brands
with prestige.

62
The interviewees also tend to be concerned about the environment, if the country of origin
(COO) of food is of importance to them. They believe food should be Swedish for freshness,
as well as eco-friendliness, but this cannot be realistically expected of other products. In
agreement with Koschate-Fischer et al.’s findings (2012), many interviewees are willing to
pay more for products produced in a country with a favorable image. For them, this is
Sweden.
This is good news for Max, being the only hamburger restaurant in Sweden that guarantees
Swedish ingredients (Datamonitor 2010); however, the advantage is small and it does not pose
a huge threat for McDonald’s. Swedish food preference has significantly positive relationship
with customer loyalty, but it is not a strong positive with a correlation of only 3.3%. Max
cannot rely on this to win in the Swedish market.
McDonald’s may be able to beat Max if they improve taste by making to order, if COO does
not matter too much. No interviewees mentioned COO when choosing fast food, saying Max
is fresh because it makes as its food is ordered. However, through one interview group claims
that parents are very concerned about product origins, and they themselves feel they should
care more, and choose products more carefully, but they sometimes do not.
6.3 Managerial implications of demographic factors
The research indicates most of younger students like McDonald’s very much, especially the
atmosphere, taste, and location. Because McDonald’s focus is on children and family, they
offer food quickly, and fun, collectible toys that are of recognizable characters. There seems
to be a shift in preference in the current generation, as shown by the older student respondents
preferring Max while the younger students preferring McDonald’s. It is possible that fast food
preference develops early in childhood, which explains why McDonald’s has a strong focus
on children and family. Further research can be done to analyze this sudden shift in
preference.
This is a threat for Max. because when the younger students and children grow up, they are
likely to become loyal to McDonalds and buy McDonalds for their children and influence
their fast food preferences. Thus, even though older students prefer the taste of Max, they also
should focus more on younger people and target children and family more.

63
7.Conclusion
Based on the theory and data analysis, to answer the general questions, both national
companies, such as Max, and global companies, like McDonalds, have advantages and
disadvantages. The competition is often very close, particularly when customers seek variety.
However, the general questions are very broad, while this research is very focused on a
particular case. The writers cannot draw many general conclusions with the limited
information, because as discussed in the previous chapter, fast food restaurants in itself is
quite different from the restaurant industry as a whole. The writers can say, though, that
Swedish consumers are somewhat loyal to their own country’s products when it comes to
food, and they perceive Swedish produced ingredients as higher quality. The conclusions that
the writers draw from the study will focus on the Swedish case study about national and
international fast food services.
In the Swedish market, most customers prefer national food products because they perceive
them as having higher quality and always being fresh. Furthermore, the data shows more than
half students will recommend Max to a friend. Concerning this point, national food brands
have an advantage over international ones. However, the study results show only significant,
but not strong relationship between national brand preference and customer loyalty. Being
Swedish or not in itself does not influence brand choice very much. On the contrary, the data
analysis has showed a strong positive relationship between customer satisfaction and
customer loyalty.
Thus, if national companies want to win the competition in the future, they cannot rely on
consumers’ loyalty to their own country’s products. Therefore, national companies must
understand their strengths and weakness, and also opportunities and threats in their
environment; in order to improve what they can to attract customers and develop the right
strategy to fit for the changing business environment.
In the following charts, a SWOT analysis for both Max and McDonald’s is used to illustrate
how each can compete in a local Swedish market.

64
7.1 Suggestion for Max
Table 17: SWOT Analysis for Max
Strengths:
Taste
High quality products
Fresh
cleanliness
general atmosphere
Weakness:
Location
Quick service
Opening hours
Opportunity:
National food preference
Female think taste still have space to
improved
Threats:
Strong global player (McDonalds, Burger
King)
Competition is intense
Lack of younger students preference and
loyalty
As shown in Picture 2 in the Theory chapter, Swedish consumers have voted Max’s
hamburger as the best brand. The findings of this study indicate Max’s freshly-made food
gives it its superior taste and therefore, many people are loyal to Max. However, in the fast
food industry, location and opening hours are also very important for customer. When the
students are interviewed, some state that they want to eat Max, but they have to go far away,
so they choose to eat at McDonald’s instead. The limitation of this study, though, is that the
sample population only live around the Karlstad area. Max does have good locations in other
parts of Sweden, such as near the Stockholm main station, but the writers suggest better
locations should be chosen if Max plans to open new stores. Second, customers in Karlstad
are not very satisfied with the opening hours. Thus, the writers also recommend that if Max
extend their opening time at least on weekends, it would improve overall satisfaction and
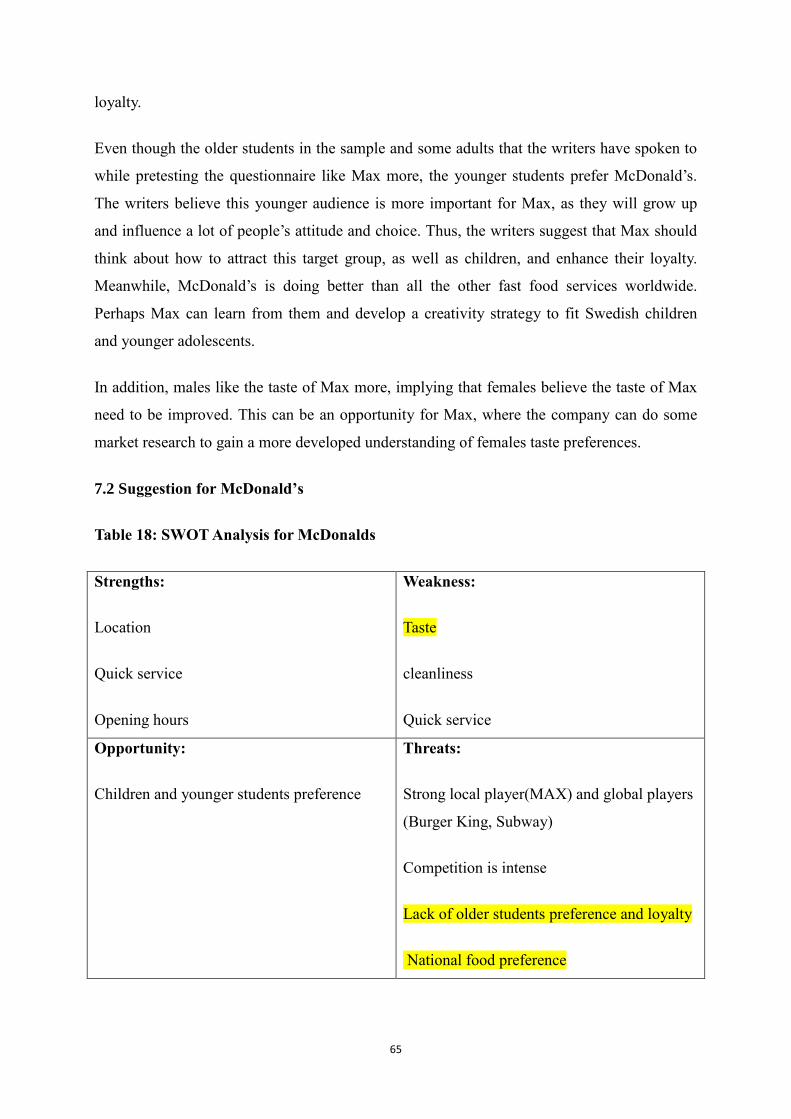
65
loyalty.
Even though the older students in the sample and some adults that the writers have spoken to
while pretesting the questionnaire like Max more, the younger students prefer McDonald’s.
The writers believe this younger audience is more important for Max, as they will grow up
and influence a lot of people’s attitude and choice. Thus, the writers suggest that Max should
think about how to attract this target group, as well as children, and enhance their loyalty.
Meanwhile, McDonald’s is doing better than all the other fast food services worldwide.
Perhaps Max can learn from them and develop a creativity strategy to fit Swedish children
and younger adolescents.
In addition, males like the taste of Max more, implying that females believe the taste of Max
need to be improved. This can be an opportunity for Max, where the company can do some
market research to gain a more developed understanding of females taste preferences.
7.2 Suggestion for McDonald’s
Table 18: SWOT Analysis for McDonalds
Strengths:
Location
Quick service
Opening hours
Weakness:
Taste
cleanliness
Quick service
Opportunity:
Children and younger students preference
Threats:
Strong local player(MAX) and global players
(Burger King, Subway)
Competition is intense
Lack of older students preference and loyalty
National food preference

66
National food preference can be seen as a threat for McDonalds. While the company cannot
change the fact it is not a Swedish brand, it can probably ensure Swedish produced
ingredients. Yet, the results show that these factors do not influence the customers’ choice so
much.
The critical issue is that customers are not satisfied with the taste of McDonald’s. The
company may do some research to make the taste fit for the preferences of local consumers
more.
The results also show that atmosphere and cleanliness are not satisfactory, especially for the
older students in the sample. McDonald’s would have to pay more attention to their older
target groups in the future.
7.3 Future studies: Improvement and sustainable development
Both national companies and international companies hope to have sustainable development
in the Swedish market for fast food. And they have their own strategy to meet the demands of
the local market. From the findings of this research, the writers believe good strategies make a
difference for the success of a fast food restaurant.
Both Max and McDonald’s have areas in which they can improve, and target groups that are
not satisfied with them in different areas. For instance, Max can improve the convenience of
their locations by having a store in the city center.
In the event of an opportunity for future studies, the writers would like to conduct the survey
and interviews with broader sample population, for instance in more Swedish cities and with
more age and other demographic groups. As previously discussed, studying the taste
preferences of younger children and older adults not included in the study can provide insight
on how this preference is developed, and if it affects their preferences throughout their lives
life. Also, while Max does have many healthy menu items, such as low fat burgers, salads and
desserts (Max 2012b; Max 2012d), and McDonald’s has been forced to adapt to the growing
demand for healthy alternatives in the past decade, their efforts does not seem to appeal to
consumers based on the interview results. Although, as previously mentioned in the
Introduction chapter, Research and Markets’ report (2010) asserts that the health debate is
becoming a challenge for the fast food industry in Sweden. A sample including adult age
groups, and an additional interview question regarding the importance of healthy options,

67
would perhaps yield more telling results.
Next, the samples are only collected from Karlstad, Storfors and Hammarö due to time
constraints. If there had been more time, data would be collected from Stockholm, Goteborg
and other, maybe smaller, cities in Sweden as well. Furthermore, this research only compared
Max with McDonald’s. In future studies, other major fast food chains, such as Burger King
and Subway, can be added to the research. For example, in northern Sweden, other old-
fashioned Swedish fast food chains, such as Frasses and Sibylla are very popular.3 Frasses’
menu includes a “Viltburgare” made with “algstek” (Hamburgers in North Marketing AB
2014). As a traditional Swedish food service, traditional Swedish menu items, like venison,
can be a possible way for Max to attract more local customers, as well as foreigners who want
to try something new.
Furthermore, as previously mentioned, helpful employees (responsiveness), friendly service
(assurance) and atmosphere (empathy) are not very important in customers mind so far.
However, a fast food restaurant would need to improve its eating experience in the long run.
Thus, if similar research is done, say ten years from now, the results reveal some interesting
findings about these attributes.
Thus, if time allows, a larger, more in-depth study will be helpful towards gaining more
insight of the research questions and analyzing how Max can compete. Overall, the writerss
believe excellent service quality, especially its tangible attributes, will keep Max’s sustainable
development. Continuous improvement is important and it will help MAX to win the future.
3 Suggestion from thesis opponents

68
References
Bogomolova, S. (2010). Service quality perceptions of solely loyal customers. International
Journal of Market Research, [Online], 53(6), 793-810.
Cheng, B.L. & Rashid, Z. A. (2013). Service quality and the mediating effect of corporate
image on the relationship between customer satisfaction and customer loyalty in the
Malaysian hotel industry. Gadjah Mada International Journal of Business, [Online], 15(2),
99-112.
Datamonitor (2010). Foodservice in Sweden, London: Datamonitor.
de Chernatony, L. & McDonald, M. (1998). Creating Powerful Brands in consumer, Service
and Industrial Markets. 2nd ed. London: The Chartered Institute of Marketing.
Dong, L. & Tian, K. (2009). The use of western brands in asserting national identity in China.
Journal of Consumer Research, [Online], Volume 36, 504-523.
Golder, P. N., Mitra, D. & Moorman, C. (2012). What Is Quality? An Integrative Framework
of Processes and States. Journal of Marketing, [Online], Volume 76, 1-23.
Hofstede (2012). The Hofstede Center: What about Sweden? Available: http://geert-
hofstede.com/sweden.html [2014-05-10].
Interbrand (2014). Best Global Brands of 2013: McDonald's. Available:
http://www.interbrand.com/en/best-global-brands/2013/McDonalds [2014-04-20].
Miller, J.M. (2009). Reliability and Validity. Graduate Research Methods, [Online], 1-3.
Jamieson, S. (2004). Likert scales: how to use them. Medical Education, [Online], Volume
38, 1212-1218.
Knapp, T.R. (1990). Treating ordinal scales as interval scales: an attempt to resolve the
controversy. Nursing Research, [Online], 39(2), 121-123.
Koschate-Fischer, N., Diamantopoulos, A. & Oldenkotte, K. (2012). Are consumers really
willing to pay more for a favorable country image? A study of country-of-origin effects on
willingness to pay. Journal of International Marketing, [Online], 20(1), 19-41.
Lau, P. M., Akbar, A. K. & Fie, D. Y. (2005). Service quality: a study of the luxury hotels in
malaysia. The Journal of American Academy of Business, Cambridge, [Online], 7(2), 46-55.
Leary, M. (2012). Introduction to behavioral research methods. Approaches to Psychological
Mesaurement. 6th ed. s.l.: Pearson Press, 80-81.

69
Lee, S.H., Kim, Y.P., Hemmington, N. & Yun, D.K. (2004). Competitive service quality
improvement (CSQI): a case study in the fast-food industry. Food Service Technology,
[Online], Volume 4, 75-84.
MarketLine (2014). McDonald's Corporation SWOT Analysis, s.l.: MarketLine.
Max Hamburgerrestauranger AB [Max] (2012a). Max Burgers: Franchising. Available:
http://www.maxburgers.com/franchising/ [2014-03-12].
Max Hamburgerrestauranger AB [Max] (2012b). MAX Burgers: Health. Available:
http://www.maxburgers.com/health/ [2014-03-12].
Max Hamburgerrestauranger AB [Max] (2012c). MAX Burgers: Home. Available:
http://www.maxburgers.com/max/ [2014-03-12].
Max Hamburgerrestauranger AB [Max] (2012d). MAX Burgers: Nutritional Values.
Available: http://www.max.se/sv/Maten/Naringsvarden/ [2014-03-12].
Max Hamburgerrestauranger AB [Max] (2012e). Max Burgers: We are going to be the burger
chain in the world. Available: http://www.maxburgers.com/ [2013-03-12].
McDonald's Corporation (2013). 2013 Annual Report, Oak Brook: McDonald's.
McDonald's (2014a). Our Company: Vision, Responsibility and Leadership Tastefully Done.
Available: http://www.aboutmcdonalds.com/mcd/our_company.html [2014-03-12].
McDonald's (2014b). Our Journey Together. For Good. Available:
http://www.aboutmcdonalds.com/mcd.html [2014-03-12].
Morse, C. (2013). Fast-food freedom: Top foreign chains we want in the USA. Available:
http://www.usatoday.com/story/travel/destinations/2013/07/25/fast-food-freedom-top-foreign-
chains-we-want-in-the-usa/2584855/ [2014-03-12].
Parasuraman, A., Berry, L. L. & Zeithaml, V. A. (1992). Perceived service quality as a
customer-based performance measure: an empirical examination of organizational barriers
using an extended service quality model. Human Resource Management, [Online], 30(3),
335-364.
Parasuraman, A., Zeithaml, V. A. & Berry, L. L. (1985). A conceptual model of service and
its implications for future research. The Journal of Marketing, [Online], 49(4), 41-50.
Peter, J. P. & Olson, J. (2010). Consumer Behavior & Marketing Strategy. 9th ed. New York:
McGraw-Hill/Irwin.
Research and Markets (2010). Consumer foodservice in Sweden - to
2014 illustrate how the market is set to change - McDonalds the clear leader in foodservice.
Business Wire, [Online], 11. Available:
http://eds.b.ebscohost.com/eds/detail?vid=4&sid=20c8062a-fae1-4478-9093-

70
c9d5d9789f54%40sessionmgr110&hid=116&bdata=Jmxhbmc9c3Ymc2l0ZT1lZHMtbGl2ZQ
%3d%3d#db=bwh&AN=bizwire.c30564263 [2014-04-19].
Robert A. P. (2000). Constructing effective questionnaires. Thousand Oaks Carlifornia: Sage
Publication.
Shu, S.T., Strombeck, S. & Hsieh, C.L. (2013). Consumer ethnocentrism, self-image
congruence and local brand preference: a cross-national examination. Asia Pacific
Management Review, [Online], 18(1), 43-61.
Tantiwongwat, U. (2013). Local brand versus global brand: a case study of the cola. Diss.
Karlstad: Karlstad Business School.
Vanniarajan, T. & Meharajan, T. (2012). Dineserv: a tool for measuring service quality in
restaurants. Journal of Marketing & Communication, [Online], 8(2), 4-11.
Winit, W., Gregory, G., Cleveland, M. & Verlegh, P. (2014). Global vs local brands: how
home country bias and price differences impact brand evaluations. International Marketing
Review, [Online], 31(2), 102-128.
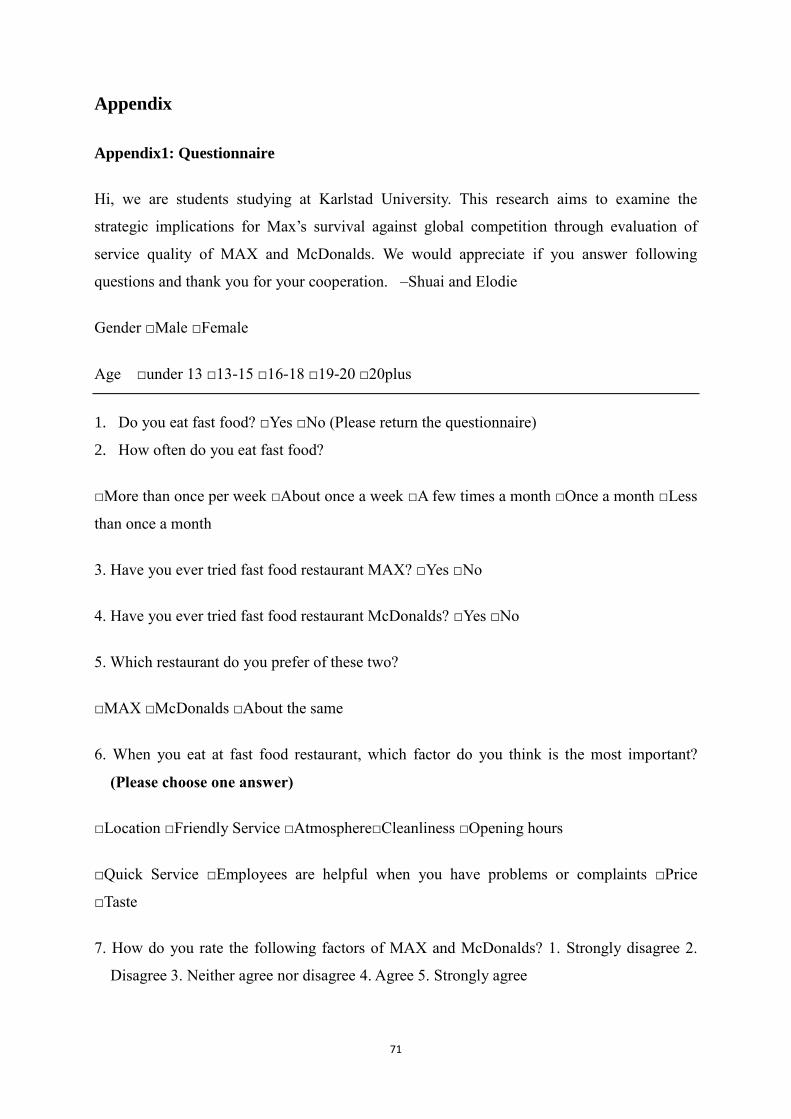
71
Appendix
Appendix1: Questionnaire
Hi, we are students studying at Karlstad University. This research aims to examine the
strategic implications for Max’s survival against global competition through evaluation of
service quality of MAX and McDonalds. We would appreciate if you answer following
questions and thank you for your cooperation. –Shuai and Elodie
Gender □Male □Female
Age □under 13 □13-15 □16-18 □19-20 □20plus
1. Do you eat fast food? □Yes □No (Please return the questionnaire)
2. How often do you eat fast food?
□More than once per week □About once a week □A few times a month □Once a month □Less
than once a month
3. Have you ever tried fast food restaurant MAX? □Yes □No
4. Have you ever tried fast food restaurant McDonalds? □Yes □No
5. Which restaurant do you prefer of these two?
□MAX □McDonalds □About the same
6. When you eat at fast food restaurant, which factor do you think is the most important?
(Please choose one answer)
□Location □Friendly Service □Atmosphere□Cleanliness □Opening hours
□Quick Service □Employees are helpful when you have problems or complaints □Price
□Taste
7. How do you rate the following factors of MAX and McDonalds? 1. Strongly disagree 2.
Disagree 3. Neither agree nor disagree 4. Agree 5. Strongly agree

72
- MAX + - McDonalds +
Location is good 1 2 3 4 5 1 2 3 4 5
Employees are friendly to provide you
with their services
1 2 3 4 5 1 2 3 4 5
The atmosphere is relaxing 1 2 3 4 5 1 2 3 4 5
Restaurant is always clean 1 2 3 4 5 1 2 3 4 5
I am satisfied with the opening hours 1 2 3 4 5 1 2 3 4 5
Service waiting time is short 1 2 3 4 5 1 2 3 4 5
Employees are helpful when you have
problems or complaints
1 2 3 4 5 1 2 3 4 5
Price is reasonable 1 2 3 4 5 1 2 3 4 5
Taste is good 1 2 3 4 5 1 2 3 4 5
Overall, I am satisfied with restaurant 1 2 3 4 5 1 2 3 4 5
8. Do you prefer Swedish products in general?
□No, never □No,almost never □Sometimes □Yes, rather often □Yes, always
9. Do you prefer Swedish origin for food products?
□No, never □No,almost never □Sometimes □Yes, rather often □Yes, always
10. Next time you want to eat fast food, would you choose MAX?
□No □Maybe, not sure □Yes, definitely
11. Do you recommend MAX to a friend?
□No □Maybe, not sure □Yes, definitely

73
Appendix2:Data coding
Question No. Answer Detail Code Variable Name
in SPSS
Type of Variables
General questions
Gender 1=Male
2=Female
Gender Dichotomous
Age 1=under 14
2=14-15
3=16-18
4=19-20
5=20 plus
Age Ratio
Research Questions
No.
1 1=Yes
2=No
Fast food
eating
Nominal
2 1= More than once per
week
2= About once a week
3= A few times a
month
4= Once a month
5= Less than once a
month
Frequency Ratio
3 1=Yes
2=No
Max Tried Nominal

74
4 1=Yes
2=No
McDonalds
Tried
Nominal
5 1= Max
2= McDonalds
3=About the same
Preference Nominal
6 1= Location
2=Friendly Service
3= Atmosphere
4= Cleanliness
5=Opening hours
6=Quick Service
7= Employees are
helpful when you have
problems or
complaints
8= Price
9= Taste
Most
Important
factor
Nominal
7.1 1=Strongly disagree
2=Disagree
Max Location Ordinal
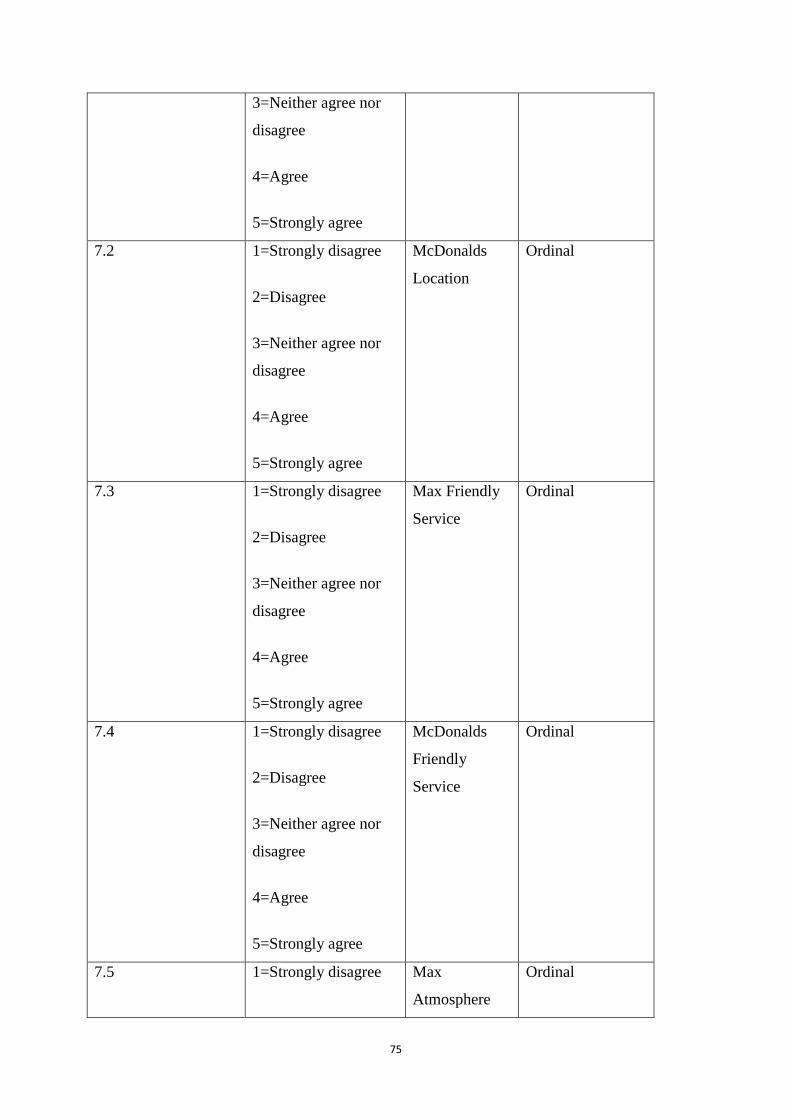
75
3=Neither agree nor
disagree
4=Agree
5=Strongly agree
7.2 1=Strongly disagree
2=Disagree
3=Neither agree nor
disagree
4=Agree
5=Strongly agree
McDonalds
Location
Ordinal
7.3 1=Strongly disagree
2=Disagree
3=Neither agree nor
disagree
4=Agree
5=Strongly agree
Max Friendly
Service
Ordinal
7.4 1=Strongly disagree
2=Disagree
3=Neither agree nor
disagree
4=Agree
5=Strongly agree
McDonalds
Friendly
Service
Ordinal
7.5 1=Strongly disagree Max
Atmosphere
Ordinal

76
2=Disagree
3=Neither agree nor
disagree
4=Agree
5=Strongly agree
7.6 1=Strongly disagree
2=Disagree
3=Neither agree nor
disagree
4=Agree
5=Strongly agree
McDonalds
Atmosphere
Ordinal
7.7 1=Strongly disagree
2=Disagree
3=Neither agree nor
disagree
4=Agree
5=Strongly agree
Max
Cleanliness
Ordinal
7.8 1=Strongly disagree
2=Disagree
3=Neither agree nor
McDonalds
Cleanliness
Ordinal
77
disagree
4=Agree
5=Strongly agree
7.9 1=Strongly disagree
2=Disagree
3=Neither agree nor
disagree
4=Agree
5=Strongly agree
Max Opening
hours
Ordinal
7.10 1=Strongly disagree
2=Disagree
3=Neither agree nor
disagree
4=Agree
5=Strongly agree
McDonalds
Opening hours
Ordinal
7.11 1=Strongly disagree
2=Disagree
3=Neither agree nor
disagree
4=Agree
5=Strongly agree
Max Quick
Service
Ordinal
7.12 1=Strongly disagree McDonalds
Quick Service
Ordinal

78
2=Disagree
3=Neither agree nor
disagree
4=Agree
5=Strongly agree
7.13 1=Strongly disagree
2=Disagree
3=Neither agree nor
disagree
4=Agree
5=Strongly agree
Max
Helpful
Employee
Ordinal
7.14 1=Strongly disagree
2=Disagree
3=Neither agree nor
disagree
4=Agree
5=Strongly agree
McDonalds
Helpful
Employee
Ordinal
7.15 1=Strongly disagree
2=Disagree
3=Neither agree nor
Max Price Ordinal

79
disagree
4=Agree
5=Strongly agree
7.16 1=Strongly disagree
2=Disagree
3=Neither agree nor
disagree
4=Agree
5=Strongly agree
McDonalds
Price
Ordinal
7.17 1=Strongly disagree
2=Disagree
3=Neither agree nor
disagree
4=Agree
5=Strongly agree
Max Taste Ordinal
7.18 1=Strongly disagree
2=Disagree
3=Neither agree nor
disagree
4=Agree
5=Strongly agree
McDonalds
Taste
Ordinal
7.19 1=Strongly disagree Max
Satisfaction
Ordinal

80
2=Disagree
3=Neither agree nor
disagree
4=Agree
5=Strongly agree
7.20 1=Strongly disagree
2=Disagree
3=Neither agree nor
disagree
4=Agree
5=Strongly agree
McDonalds
Satisfaction
Ordinal
8 1=No, never
2=No, almost never
3=Sometimes
4=Yes, rather often
5=Yes, always
Swedish
products
preference
Ordinal
9 1=No, never
2=No, almost never
3=Sometimes
Swedish origin
preference
Ordinal

81
4=Yes, rather often
5=Yes, always
10 1=No
3=Maybe, not sure
5=Yes, definitely
Max next time Ordinal
11 1=No
3=Maybe, not sure
5=Yes, definitely
Recommend to
Friends
Ordinal
Appendix 3: Frequency of gender and age group
Gender frequency table
Gender Frequency Percent
Male 142 46,0
Female 167 54,0
Total 309 100,0
Age frequency table
Age Frequency Percent
under 15 65 21,0
16-18 194 62,8
19plus 50 16,2
Total 309 100,0

82
Appendix4: The difference of Max and McDonalds Mean
Descriptive Statistics
N Minimum Maximum Mean Std.
Deviation
Max Location 309 1 5 2,78 1,030
McDonaldsLocation 309 1 5 4,34 ,843
Max Friendly Service 309 1 5 3,76 ,869
McDonalds Friendly Service 309 1 5 3,53 ,870
Max Atmosphere 309 1 5 3,37 1,154
McDonaldsAtmosphere 309 1 5 2,64 1,043
Max Cleanliness 309 1 5 3,54 1,014
McDonalds Cleanliness 309 1 5 2,90 ,958
Max Opening hours 309 1 5 3,86 1,000
McDonalds Opening hours 309 1 5 4,33 ,965
Max Quick Service 309 1 5 3,47 ,903
McDonalds Quick Service 309 1 5 3,61 ,970
Max Employee 309 1 5 3,59 ,916
McDonaldsEmployee 309 1 5 3,55 ,988
Max Price 309 1 5 3,55 ,913
McDonalds Price 309 1 5 3,93 ,935
Max Taste 309 1 5 4,05 1,059
McDonalds Taste 309 1 5 3,62 1,040
Valid N (listwise) 309

83
Appendix5: Difference of Max factors between genders.
Group Statistics
Gender N Mean Std. Deviation Std. Error Mean
MaxLocation Male 142 2,73 1,060 ,089
Female 167 2,83 1,004 ,078
Max Friendly Service Male 142 3,79 ,882 ,074
Female 167 3,73 ,860 ,067
Max Atmosphere Male 142 3,45 1,218 ,102
Female 167 3,31 1,096 ,085
Max Cleanliness Male 142 3,59 1,012 ,085
Female 167 3,50 1,017 ,079
Max Opening hours Male 142 3,83 1,031 ,087
Female 167 3,88 ,974 ,075
Max Quick Service Male 142 3,46 ,943 ,079
Female 167 3,48 ,870 ,067
Max Employee Male 142 3,60 ,968 ,081
Female 167 3,59 ,873 ,068
Max Price Male 142 3,50 ,951 ,080
Female 167 3,59 ,880 ,068
Max Taste Male 142 4,19 ,967 ,081
Female 167 3,93 1,120 ,087

84
Independent Samples Test
Levene's Test for
Equality of
Variances
t-test for Equality of Means
F Sig. t df Sig. (2-
tailed)
Mean
Difference
Std. Error
Difference
Max
Location
Equal variances
assumed 1,194 ,275 -,910 307 ,364 -,107 ,118
Equal variances
not assumed
-,906 293,275 ,366 -,107 ,118
Max Friendly
Service
Equal variances
assumed ,048 ,827 ,586 307 ,558 ,058 ,099
Equal variances
not assumed
,585 296,576 ,559 ,058 ,100
Max
Atmosphere
Equal variances
assumed 1,359 ,245 1,103 307 ,271 ,145 ,132
Equal variances
not assumed
1,094 286,613 ,275 ,145 ,133
Max Cleanness
Equal variances
assumed ,023 ,880 ,816 307 ,415 ,095 ,116
Equal variances
not assumed
,817 299,571 ,415 ,095 ,116
Max
Opening
hours
Equal variances
assumed ,310 ,578 -,431 307 ,667 -,049 ,114
Equal variances
not assumed
-,429 292,940 ,668 -,049 ,115
Max
Quick
Service
Equal variances
assumed ,952 ,330 -,138 307 ,890 -,014 ,103
Equal variances
not assumed
-,137 289,996 ,891 -,014 ,104
Max Employee
Equal variances
assumed 1,279 ,259 ,112 307 ,911 ,012 ,105
Equal variances
not assumed
,111 286,896 ,911 ,012 ,106
Max
Price
Equal variances
assumed ,662 ,416 -,833 307 ,406 -,087 ,104
Equal variances
not assumed
-,828 290,315 ,408 -,087 ,105
Max
Taste
Equal variances
assumed 2,499 ,115 2,131 307 ,034 ,256 ,120
Equal variances
not assumed
2,156 306,924 ,032 ,256 ,119
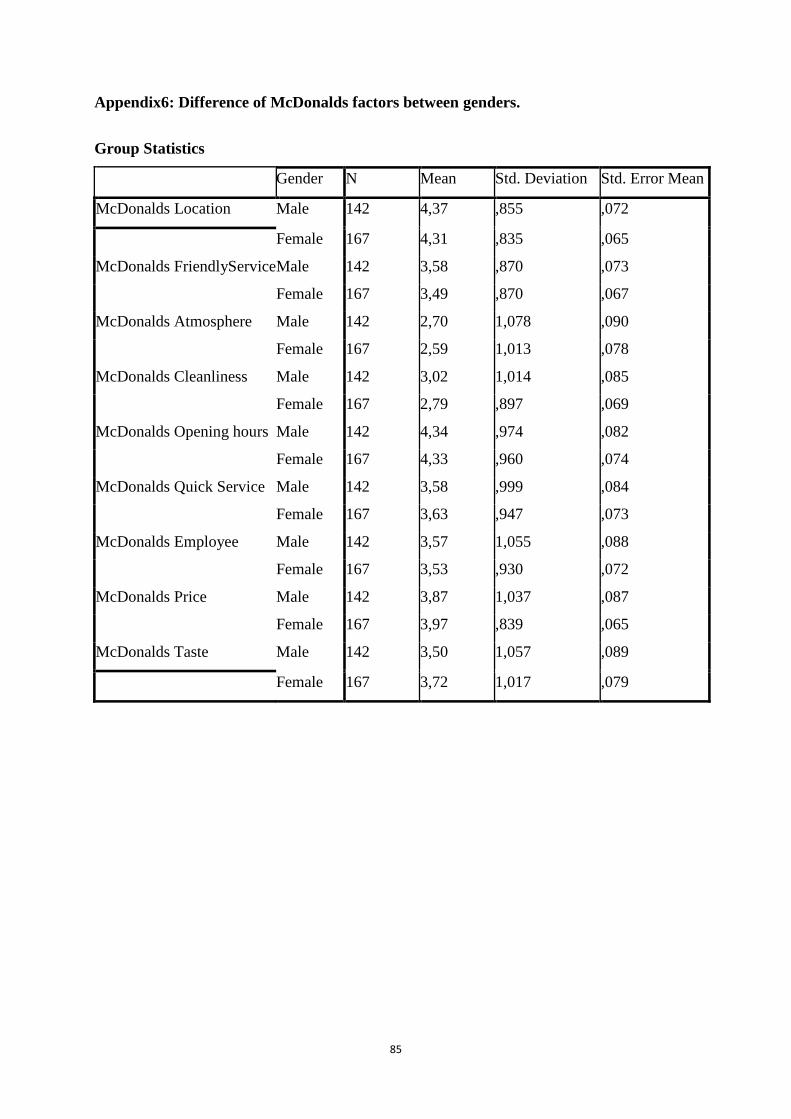
85
Appendix6: Difference of McDonalds factors between genders.
Group Statistics
Gender N Mean Std. Deviation Std. Error Mean
McDonalds Location Male 142 4,37 ,855 ,072
Female 167 4,31 ,835 ,065
McDonalds FriendlyService Male 142 3,58 ,870 ,073
Female 167 3,49 ,870 ,067
McDonalds Atmosphere Male 142 2,70 1,078 ,090
Female 167 2,59 1,013 ,078
McDonalds Cleanliness Male 142 3,02 1,014 ,085
Female 167 2,79 ,897 ,069
McDonalds Opening hours Male 142 4,34 ,974 ,082
Female 167 4,33 ,960 ,074
McDonalds Quick Service Male 142 3,58 ,999 ,084
Female 167 3,63 ,947 ,073
McDonalds Employee Male 142 3,57 1,055 ,088
Female 167 3,53 ,930 ,072
McDonalds Price Male 142 3,87 1,037 ,087
Female 167 3,97 ,839 ,065
McDonalds Taste Male 142 3,50 1,057 ,089
Female 167 3,72 1,017 ,079

86
Independent Samples Test
Levene's Test for
Equality of
Variances
t-test for Equality of Means
F Sig. t df Sig. (2-
tailed)
Mean
Difference
Std. Error
Difference
McDonalds
Location
Equal variances
assumed ,009 ,924 ,569 307 ,570 ,055 ,096
Equal variances
not assumed
,568 296,780 ,571 ,055 ,097
McDonalds
Friendly Service
Equal variances
assumed ,014 ,907 ,870 307 ,385 ,086 ,099
Equal variances
not assumed
,870 299,133 ,385 ,086 ,099
McDonalds
Atmosphere
Equal variances
assumed 1,008 ,316 ,876 307 ,382 ,104 ,119
Equal variances
not assumed
,872 292,213 ,384 ,104 ,120
McDonalds
Cleanness
Equal variances
assumed ,311 ,577 2,122 307 ,035 ,231 ,109
Equal variances
not assumed
2,101 284,266 ,037 ,231 ,110
McDonalds
Opening
hours
Equal variances
assumed ,120 ,729 ,079 307 ,937 ,009 ,110
Equal variances
not assumed
,079 297,607 ,937 ,009 ,110
McDonalds
Quick
Service
Equal variances
assumed 1,071 ,302 -,462 307 ,644 -,051 ,111
Equal variances
not assumed
-,461 293,404 ,645 -,051 ,111
McDonalds
Employee
Equal variances
assumed 2,443 ,119 ,332 307 ,740 ,037 ,113
Equal variances
not assumed
,329 283,750 ,743 ,037 ,114
McDonalds
Price
Equal variances
assumed 4,502 ,035 -,907 307 ,365 -,097 ,107
Equal variances
not assumed
-,892 270,420 ,373 -,097 ,109
McDonalds
Taste
Equal variances
assumed ,474 ,492
-
1,849 307 ,065 -,219 ,118
Equal variances
not assumed
-
1,843 295,094 ,066 -,219 ,119
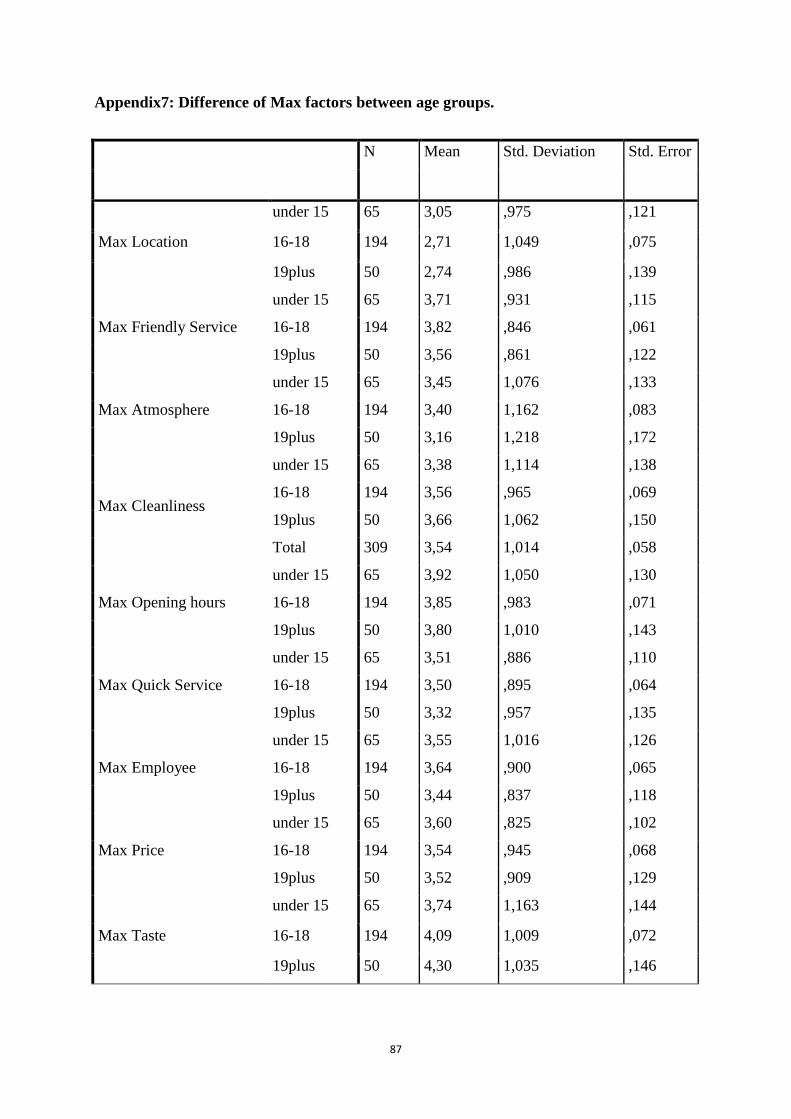
87
Appendix7: Difference of Max factors between age groups.
N Mean Std. Deviation Std. Error
Max Location
under 15 65 3,05 ,975 ,121
16-18 194 2,71 1,049 ,075
19plus 50 2,74 ,986 ,139
Max Friendly Service
under 15 65 3,71 ,931 ,115
16-18 194 3,82 ,846 ,061
19plus 50 3,56 ,861 ,122
Max Atmosphere
under 15 65 3,45 1,076 ,133
16-18 194 3,40 1,162 ,083
19plus 50 3,16 1,218 ,172
Max Cleanliness
under 15 65 3,38 1,114 ,138
16-18 194 3,56 ,965 ,069
19plus 50 3,66 1,062 ,150
Total 309 3,54 1,014 ,058
Max Opening hours
under 15 65 3,92 1,050 ,130
16-18 194 3,85 ,983 ,071
19plus 50 3,80 1,010 ,143
Max Quick Service
under 15 65 3,51 ,886 ,110
16-18 194 3,50 ,895 ,064
19plus 50 3,32 ,957 ,135
Max Employee
under 15 65 3,55 1,016 ,126
16-18 194 3,64 ,900 ,065
19plus 50 3,44 ,837 ,118
Max Price
under 15 65 3,60 ,825 ,102
16-18 194 3,54 ,945 ,068
19plus 50 3,52 ,909 ,129
Max Taste
under 15 65 3,74 1,163 ,144
16-18 194 4,09 1,009 ,072
19plus 50 4,30 1,035 ,146

88
ANOVA
Sum of
Squares
df Mean Square F Sig.
Max
Location
Between Groups 5,738 2 2,869 2,737 ,066
Within Groups 320,734 306 1,048
Total 326,472 308
Max Friendly Service
Between Groups 2,989 2 1,494 1,990 ,138
Within Groups 229,807 306 ,751
Total 232,796 308
Max
Atmosphere
Between Groups 2,780 2 1,390 1,044 ,353
Within Groups 407,421 306 1,331
Total 410,201 308
Max Cleanness
Between Groups 2,382 2 1,191 1,159 ,315
Within Groups 314,362 306 1,027
Total 316,744 308
Max
Opening
hours
Between Groups ,454 2 ,227 ,226 ,798
Within Groups 307,280 306 1,004
Total 307,735 308
Max
Quick
Service
Between Groups 1,390 2 ,695 ,852 ,428
Within Groups 249,626 306 ,816
Total 251,016 308
Max Employee
Between Groups 1,781 2 ,891 1,061 ,347
Within Groups 256,840 306 ,839
Total 258,621 308
Max
Price
Between Groups ,242 2 ,121 ,145 ,865
Within Groups 256,327 306 ,838
Total 256,570 308
Max
Taste
Between Groups 9,788 2 4,894 4,465 ,012
Within Groups 335,384 306 1,096
Total 345,172 308

89
Appendix8: Difference of McDonalds factors between age groups.
N Mean Std. Deviation Std. Error
McDonalds Location
under 15 65 4,03 ,951 ,118
16-18 194 4,39 ,827 ,059
19plus 50 4,54 ,646 ,091
McDonalds Friendly Service
under 15 65 3,63 ,821 ,102
16-18 194 3,49 ,847 ,061
19plus 50 3,54 1,014 ,143
McDonalds Atmosphere
under 15 65 2,91 1,086 ,135
16-18 194 2,61 1,023 ,073
19plus 50 2,40 1,010 ,143
McDonalds Cleanliness
under 15 65 2,86 ,998 ,124
16-18 194 2,93 ,947 ,068
19plus 50 2,82 ,962 ,136
McDonalds Opening hours
under 15 65 4,28 1,139 ,141
16-18 194 4,38 ,868 ,062
19plus 50 4,24 1,080 ,153
McDonalds Quick Service
under 15 65 3,54 ,985 ,122
16-18 194 3,65 ,982 ,071
19plus 50 3,52 ,909 ,129
McDonalds Employee
under 15 65 3,72 ,976 ,121
16-18 194 3,54 ,982 ,071
19plus 50 3,38 1,008 ,143
McDonalds Price
under 15 65 4,11 ,753 ,093
16-18 194 3,93 ,941 ,068
19plus 50 3,68 1,077 ,152
McDonalds Taste
under 15 65 3,97 ,790 ,098
16-18 194 3,60 1,040 ,075
19plus 50 3,24 1,188 ,168

90
ANOVA
Sum of
Squares
Df Mean
Square
F Sig.
McDonalds Location Between
Groups 8,633 2 4,317 6,279 ,002
McDonalds Friendly
Service
Between
Groups ,905 2 ,452 ,596 ,551
McDonalds
Atmosphere
Between
Groups 7,675 2 3,837 3,586 ,029
McDonalds
Cleanliness
Between
Groups ,563 2 ,281 ,305 ,737
McDonalds Opening
hours
Between
Groups 1,000 2 ,500 ,536 ,586
McDonalds Quick
Service
Between
Groups 1,033 2 ,516 ,547 ,579
McDonalds Employee Between
Groups 3,430 2 1,715 1,767 ,173
McDonalds Price Between
Groups 5,172 2 2,586 2,996 ,051
McDonalds Taste Between
Groups 15,241 2 7,620 7,340 ,001
Appendix9: Average score of customer satisfaction in both MAX and McDonalds
Descriptive Statistics
N Minimum Maximum Sum Mean Std.
Deviation
Max Satisfaction 309 1 5 1194 3,86 ,912
McDonalds Satisfaction 309 1 5 1151 3,72 ,936
Valid N (listwise) 309

91
Appendix 10: Difference of Max satisfaction between genders
Group Statistics
Gender N Mean Std. Deviation Std. Error Mean
Max
Satisfaction
Male 142 3,94 ,869 ,073
Female 167 3,80 ,946 ,073
Independent Samples Test
Levene's Test for
Equality of
Variances
t-test for Equality of Means
F Sig. t df Sig. (2-
tailed)
Mean
Difference
Std. Error
Difference
Max
Satisfaction
Equal variances
assumed 3,424 ,065 1,290 307 ,198 ,134 ,104
Equal variances
not assumed
1,299 305,148 ,195 ,134 ,103
Appendix 11: Difference of McDonalds satisfaction between genders.
Group Statistics
Gender N Mean Std. Deviation Std. Error
Mean
McDonalds
Satisfaction
Male 142 3,69 1,005 ,084
Female 167 3,75 ,874 ,068

92
Independent Samples Test
Levene's Test for
Equality of
Variances
t-test for Equality of Means
F Sig. t df Sig. (2-
tailed)
Mean
Difference
Std. Error
Difference
McDonalds
Satisfaction
Equal variances
assumed 2,164 ,142 -,602 307 ,548 -,064 ,107
Equal variances
not assumed
-,595 281,805 ,552 -,064 ,108
Appendix12: Frequency of national food preference(question8 and 9)
Frequency Percent
Valid
No, never 1 ,3
No, almost never 4 1,3
Sometimes 101 32,7
Yes, rather often 141 45,6
Yes, always 62 20,1
Total 309 100,0
Frequency Percent
Valid
No, never 1 ,3
No, almost never 3 1,0
Sometimes 90 29,1
Yes, rather often 122 39,5
Yes, always 93 30,1
Total 309 100,0

93
Appendix13: Difference of Swedish food preference between genders, age group
Group Statistics
Gender N Mean Std. Deviation Std. Error
Mean
NationalBrandPreference Male 142 3,8697 ,73581 ,06175
Female 167 3,9431 ,66182 ,05121
Independent Samples Test
Levene's Test for
Equality of
Variances
t-test for Equality of Means
F Sig. t df Sig.
(2-
tailed)
Mean
Difference
Std. Error
Difference
NationalBrandPreference
Equal
variances
assumed
2,274 ,133 -
,923 307 ,357 -,07340 ,07954
Equal
variances not
assumed
-
,915 286,538 ,361 -,07340 ,08022
Descriptives
NationalBrandPreference
N Mean Std.
Deviation
Std.
Error
95% Confidence
Interval for Mean
Minimum Maximum
Lower
Bound
Upper
Bound
under
15 65 3,8000 ,56458 ,07003 3,6601 3,9399 2,50 5,00
16-18 194 3,9098 ,73995 ,05313 3,8050 4,0146 1,00 5,00
19plus 50 4,0500 ,66432 ,09395 3,8612 4,2388 3,00 5,00
Total 309 3,9094 ,69661 ,03963 3,8314 3,9874 1,00 5,00

94
ANOVA
NationalBrandPreference
Sum of
Squares
df Mean Square F Sig.
Between
Groups 1,766 2 ,883 1,830 ,162
Within Groups 147,696 306 ,483
Total 149,463 308
Appendix14: Frequency of customer loyalty(question 10 and 11)
Frequency Percent
Valid
No, never 1 ,3
No, almost never 3 1,0
Sometimes 90 29,1
Yes, rather often 122 39,5
Yes, always 93 30,1
Total 309 100,0
Frequenc
y
Percent
Valid
No 35 11,3
Maybe, not
sure 115 37,2
Yes, definitely 159 51,5
Total 309 100,0

95
Appendix15: Difference of customer loyalty between genders, age groups
Group Statistics
Gender N Mean Std. Deviation Std. Error
Mean
Customerloyalty Male 142 3,5704 1,22270 ,10261
Female 167 3,3832 1,25505 ,09712
Independent Samples Test
Levene's Test for
Equality of
Variances
t-test for Equality of Means
F Sig. t df Sig. (2-
tailed)
Mean
Difference
Std. Error
Difference
Customerloyalty
Equal variances
assumed ,402 ,527 1,322 307 ,187 ,18719 ,14158
Equal variances
not assumed
1,325 301,360 ,186 ,18719 ,14128
Descriptives
Customerloyalty
N Mean Std.
Deviation
Std.
Error
95% Confidence
Interval for Mean
Minimum Maximum
Lower
Bound
Upper
Bound
under
15 65 3,0308 1,27438 ,15807 2,7150 3,3465 1,00 5,00
16-18 194 3,5361 1,21785 ,08744 3,3636 3,7085 1,00 5,00
19plus 50 3,7800 1,16567 ,16485 3,4487 4,1113 1,00 5,00
Total 309 3,4693 1,24180 ,07064 3,3303 3,6083 1,00 5,00

96
ANOVA
Customerloyalty
Sum of
Squares
df Mean Square F Sig.
Between
Groups 18,192 2 9,096 6,094 ,003
Within Groups 456,766 306 1,493
Total 474,958 308