competitive markets & how they work ocr economics as level f581 microeconomics
Post on 18-Dec-2015
239 views
TRANSCRIPT

Competitive markets & how they work
OCR Economics AS Level F581Microeconomics
Lesson 1 Objectives
• To be able to explain what exactly we mean by a market
• To be able to explain the difference between notional and effective demand
• To be able to explain the relationship between price and quantity demanded, using a graph to display a demand curve

To begin
• You have 5 minutes to come up with as many uses of the word ‘market’ as you can (in relation to the world of Business, Commerce & Economics)
Definition of ‘Market’
Market: where or when buyers and sellers meet to trade or exchange products & services
Examples include the stock market, housing market, local high streets, e-bay, the labour (jobs) market
Within markets the level of demand and supply fluctuate and as a result so do prices

Who would like one of these?

Who can afford to buy one of these?
Definitions of Notional & Effective Demand
Notional Demand : the desire for a product
Effective Demand : desire for a product backed up by a willingness and ability to pay
Demand : the quantity of a product that consumers are able & willing to purchase at various prices over a period of time
Relationship between price & quantity demanded
• We assume ceterus paribus (that all other factors remain equal)
• We focus on a period of time (e.g. a day, a week, a month, a year)
• We assume that consumers are rational, seeking the cheapest purchase
• There is an inverse relationship between price and quantity demanded – as prices rise, demand falls

Task:
• Look at table 2.1 and Fig 2.1 on Page 25• Turn over to Page 26 and complete the
Benidorm holiday activity
Definitions of Demand Curve & Demand Schedule
Demand curve : this shows the relationship between the quantity demanded and the price of a product
Demand schedule : the data that is used to draw up a demand curve
Movements along the demand curve : a change in quantity demanded in response to a change in price

Pass the BuckWhat can you recall from Lesson
1?
Lesson 2 Objectives
• To be able to define and explain what we mean by consumer surplus
• To recognise how price and quantity demanded can be used to calculate total revenue/total expenditure
• To be able to describe the range of factors other than price that influence demand

How much would you pay to use Facebook or Twitter?
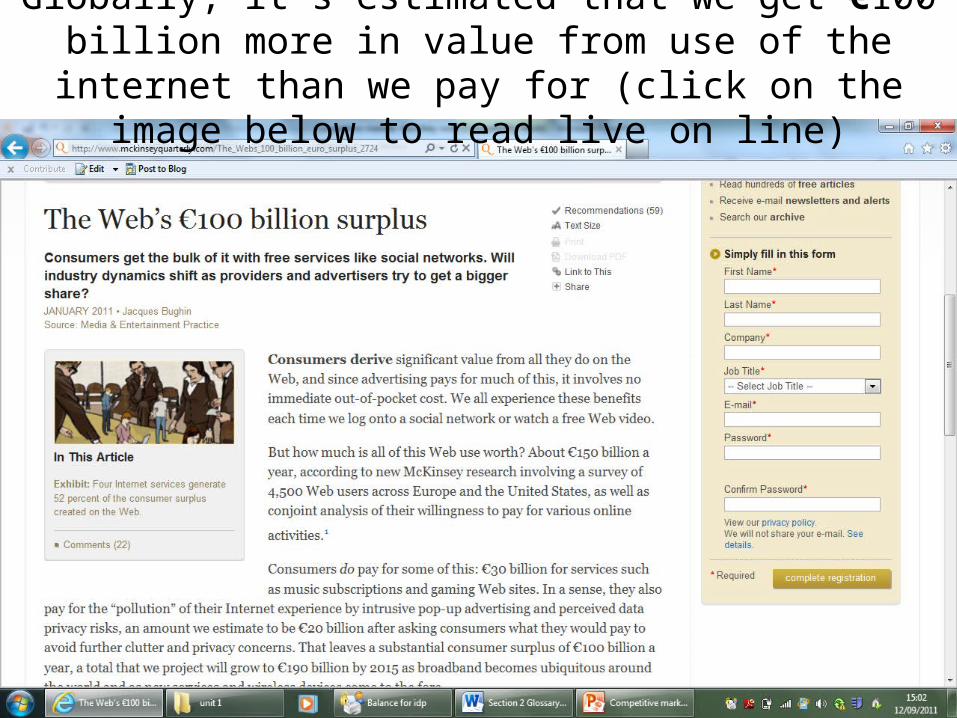
Globally, it’s estimated that we get €100 billion more in value from use of the internet than we pay for (click on the image
below to read live on line)
Definition of Consumer Surplus
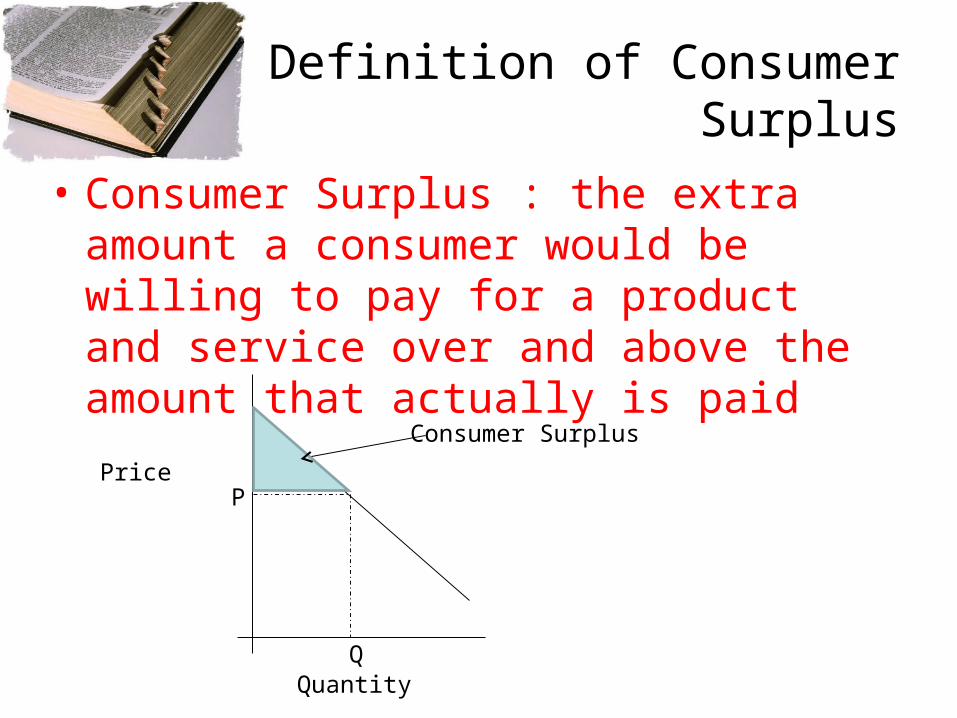
• Consumer Surplus : the extra amount a consumer would be willing to pay for a product and service over and above the amount that actually is paid
Consumer Surplus
Price
Quantity
P
Q
How have the following affected consumer surplus?
• The introduction of a congestion charge in London• The arrival of Amazon and others in to the market
for books• Price discrimination by low-cost airlines who
charge different prices depending upon how far in advance customers book
We’ll return to this concept later to see how consumer surplus is affected by market
developments
Calculating Total Revenue/Total Expenditure
• A demand curve is plotted against two axis– Price– Quantity
• By multiplying price per unit by the number of units sold, we can determine the total revenue earned by firms which is also the total expenditure by consumers, at a given price
• E.g. 200 units x £1.50 per unit = £300
Why is this important?
• We will discover in future lessons how different products/services have demand that is more or less sensitive to price changes
• Total revenue/expenditure can vary quite dramatically if demand and or prices fall
• There may be an increase in revenue even if prices are cut, or a decrease in revenue even if prices are increased

Other factors that influence demand
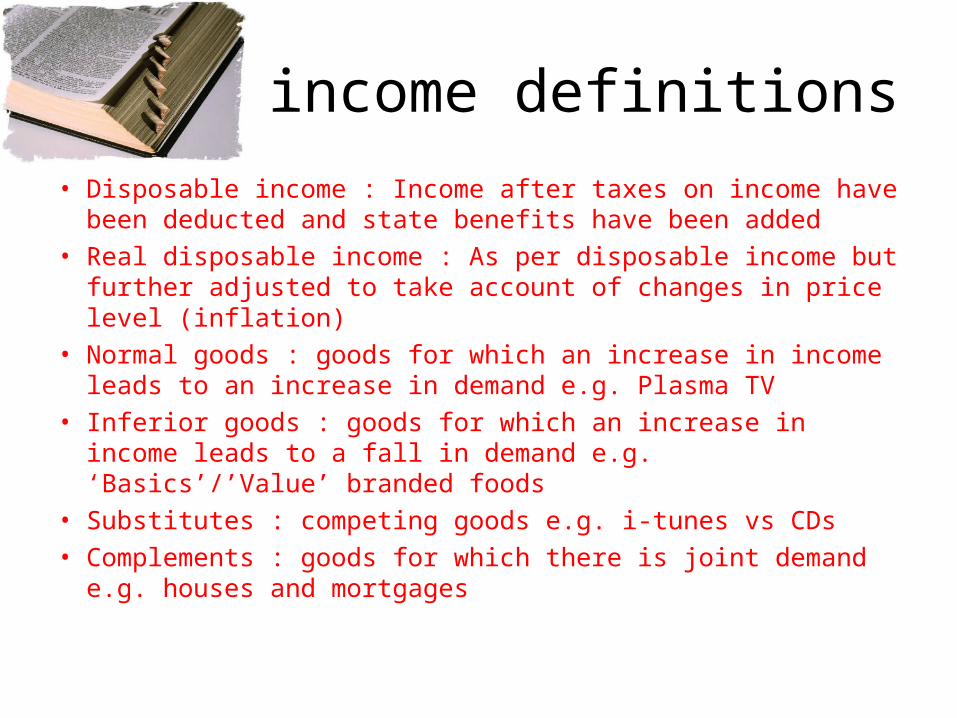
Key income definitions• Disposable income : Income after taxes on income have been
deducted and state benefits have been added• Real disposable income : As per disposable income but further
adjusted to take account of changes in price level (inflation)• Normal goods : goods for which an increase in income leads
to an increase in demand e.g. Plasma TV• Inferior goods : goods for which an increase in income leads
to a fall in demand e.g. ‘Basics’/’Value’ branded foods• Substitutes : competing goods e.g. i-tunes vs CDs• Complements : goods for which there is joint demand e.g.
houses and mortgages
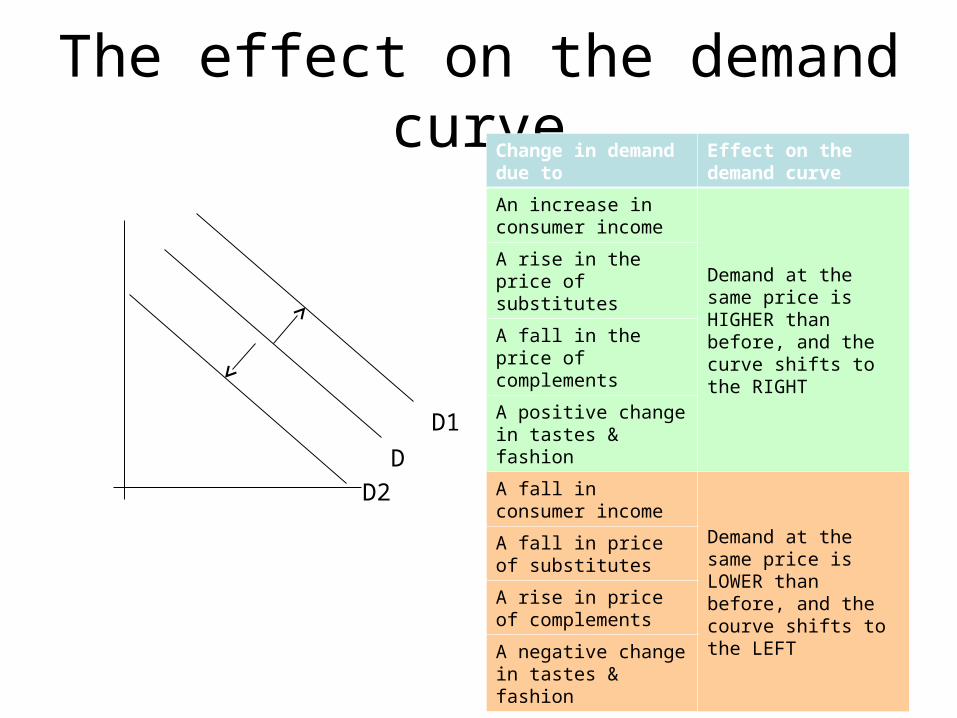
The effect on the demand curveChange in demand due to
Effect on the demand curve
An increase in consumer income
Demand at the same price is HIGHER than before, and the curve shifts to the RIGHT
A rise in the price of substitutes
A fall in the price of complements
A positive change in tastes & fashion
A fall in consumer income
Demand at the same price is LOWER than before, and the courve shifts to the LEFT
A fall in price of substitutes
A rise in price of complements
A negative change in tastes & fashion
DD1
D2
Real Life Examples
• What examples of these factors in action do you recall from the commodity presentations you did last term?

Talkabout
• I’d like a volunteer to talk about factors other than price that influence demand
• They have to talk for a minute and hopefully hit 6 key words
Lesson 3 objectives
• To be able to understand how a supply curve is drawn from a supply schedule
• To be able to explain what is meant by the producer surplus
• To be able to describe the main influences on supply levels other than price
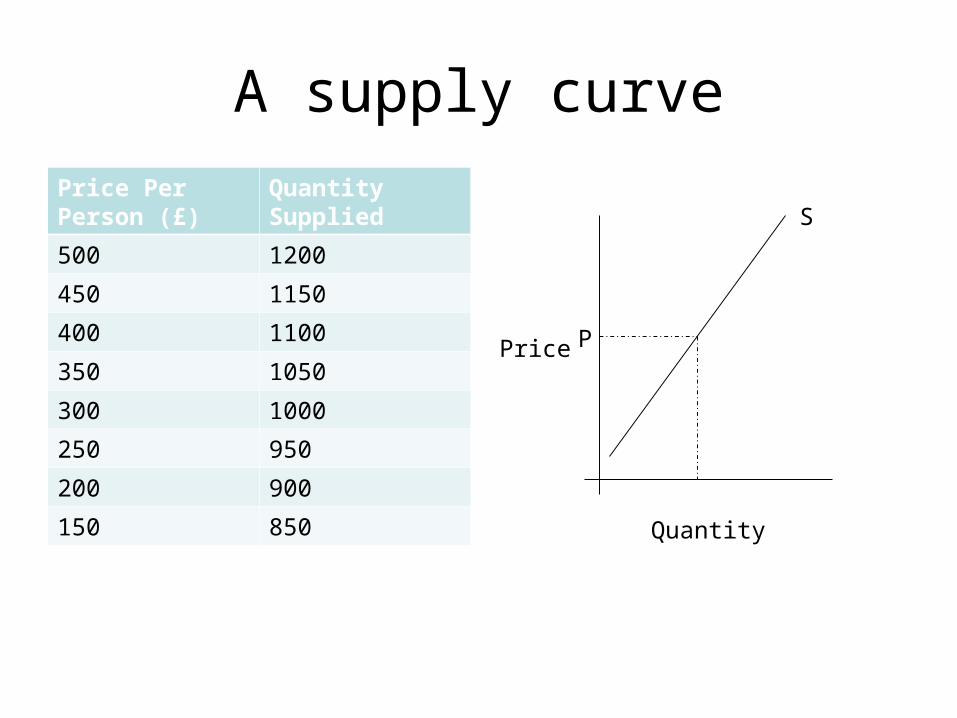
A supply curvePrice Per Person (£)
Quantity Supplied
500 1200
450 1150
400 1100
350 1050
300 1000
250 950
200 900
150 850
Price P
Quantity
S
Definition of supply curves/schedules
• Supply curve : this shows graphically the relationship between the quantity supplied and the price of a product
• Supply schedule : the data from which a supply curve is drawn
The Producer Surplus
Watch this video for an explanation of the producer surpluspajholden is a channel on YouTube worth looking at to support your studies (jodiecongirl is a better looking alternative!)
•Producer surplus : the difference between the price a producer is willing to accept and the actual price

What effects supply levels other than price?
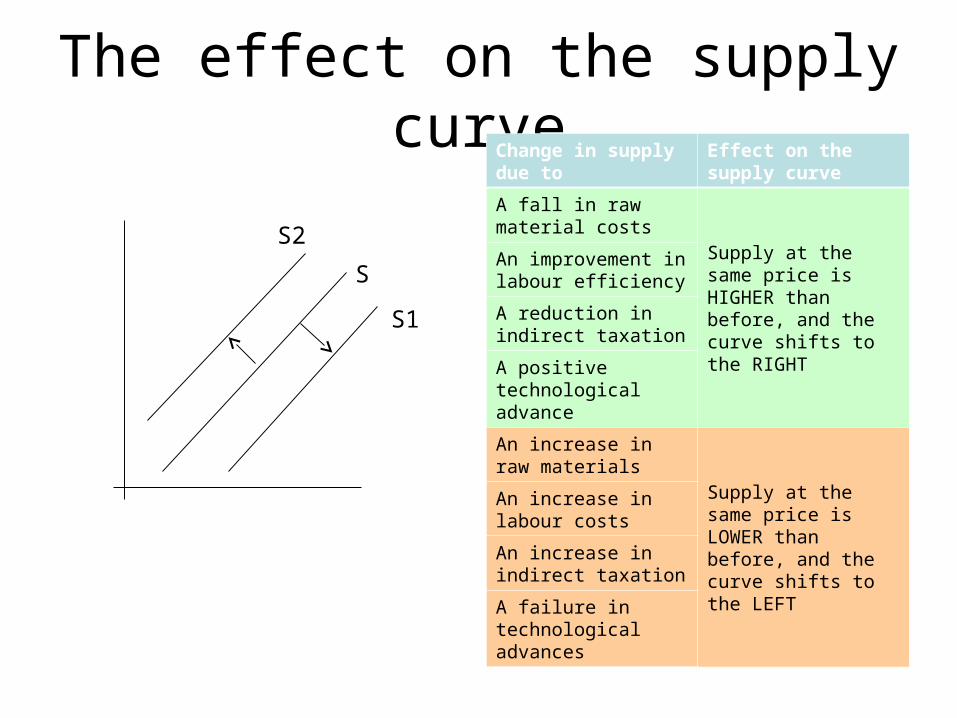
The effect on the supply curveChange in supply due to Effect on the supply
curve
A fall in raw material costs
Supply at the same price is HIGHER than before, and the curve shifts to the RIGHT
An improvement in labour efficiency
A reduction in indirect taxation
A positive technological advance
An increase in raw materials
Supply at the same price is LOWER than before, and the curve shifts to the LEFT
An increase in labour costs
An increase in indirect taxation
A failure in technological advances
S
S1
S2
Next week…
• Some practice paper questions to take stock• How demand & supply interact to create a
market equilibrium price
Lesson 4 Objectives• To understand how to draw supply and
demand charts that ‘commentate’ on changes in markets
• To do this by watching a segment of ‘Trading Places’ together and drawing supply and demand charts that describe what happened
• To be able to define and use the terms market equilibrium and market disequilibrium
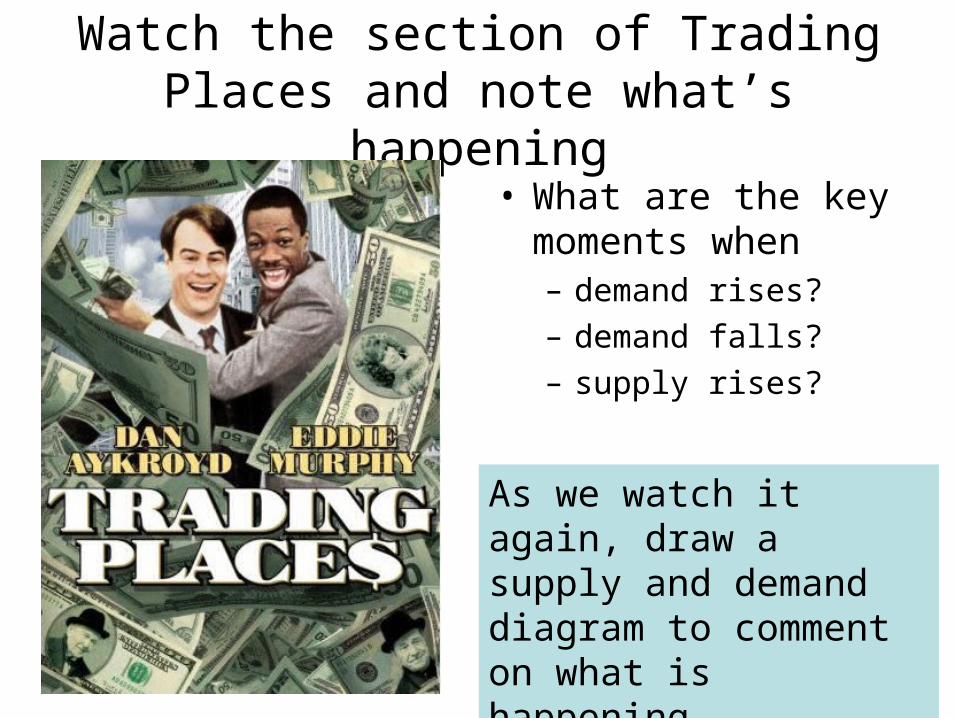
Watch the section of Trading Places and note what’s happening
• What are the key moments when– demand rises?– demand falls?– supply rises?
As we watch it again, draw a supply and demand diagram to comment on what is happening
‘Trading Places’ in Supply & Demand Graphs• The market opens, with price set at the
level previous close (market equilibrium)
• Duke & Duke start buying frozen OJ contracts and others follow suit believing the know something about the impending crop report (creating market disequilibrium)
• The real crop report is released and proves to be a good one with a healthy crop. Buyers realise there won’t be a shortage of OJ afterall and want to get rid of frozen OJ contracts rather than be left with them. They start selling, flooding the market and resulting in demand falling (new market disequilibrium)
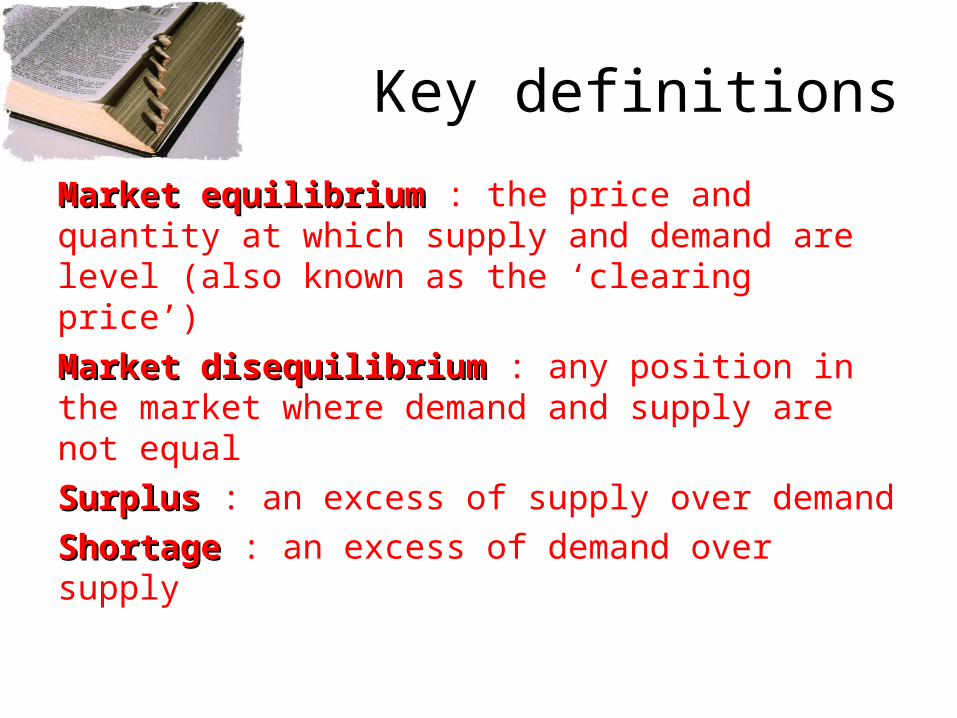
Key definitions
Market equilibrium Market equilibrium : the price and quantity at which supply and demand are level (also known as the ‘clearing price’)Market disequilibrium Market disequilibrium : any position in the market where demand and supply are not equalSurplus Surplus : an excess of supply over demandShortage Shortage : an excess of demand over supply

Homework• In October 2007, on the day of the World Cup Final, it was
reported that English rubgy fans were prepared to pay as much as £1000 for a ticket for the match. The actual price was £60. Use demand & supply concepts/diagrams to explain the situation
• By contrast, earlier in the year it was reported that local cricket fans in Barbados were being offered tickets to watch World Cup matches for as little as $10. The actual price was $80. Again, use supply & demand concepts and diagrams to explain the situation
• Due in on Friday Day5
Lesson Objectives
• To understand the term elasticity in an Economics context
• To consider how variables have relationships with each other
• To understand that some of these variables will react with each other in more dramatic or less dramatic ways

Match these in to pairs that may be responsive to each other
Eating hamburgers Getting a snog!
Money spent on a date
Time spent in the gym
The shape & tone of your body
Time spent at the driving range
Golf handicap
Working outdoors
Getting Skin CancerAmount of sleep
Level of productivity at work
Becoming obese
What Economic ‘relationships’ can you think of?

Key Definition
Elasticity : the extent to which buyers and sellers respond to a change in market conditions
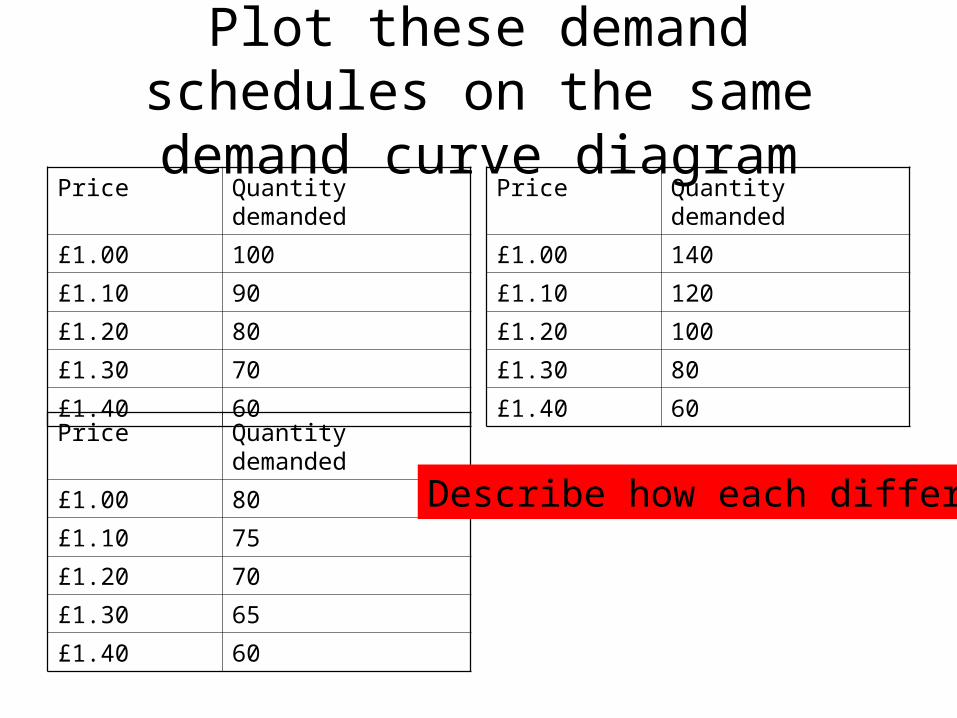
Plot these demand schedules on the same demand curve diagram
Price Quantity demanded
£1.00 100
£1.10 90
£1.20 80
£1.30 70
£1.40 60
Price Quantity demanded
£1.00 140
£1.10 120
£1.20 100
£1.30 80
£1.40 60
Price Quantity demanded
£1.00 80
£1.10 75
£1.20 70
£1.30 65
£1.40 60
Describe how each differs
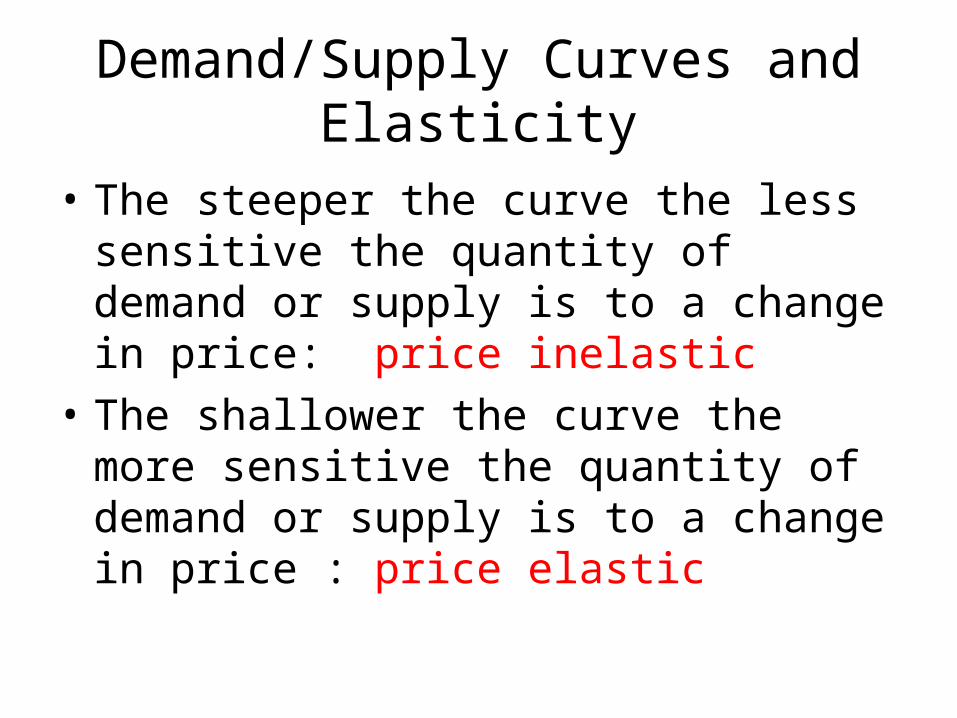
Demand/Supply Curves and Elasticity
• The steeper the curve the less sensitive the quantity of demand or supply is to a change in price: price inelastic
• The shallower the curve the more sensitive the quantity of demand or supply is to a change in price : price elastic
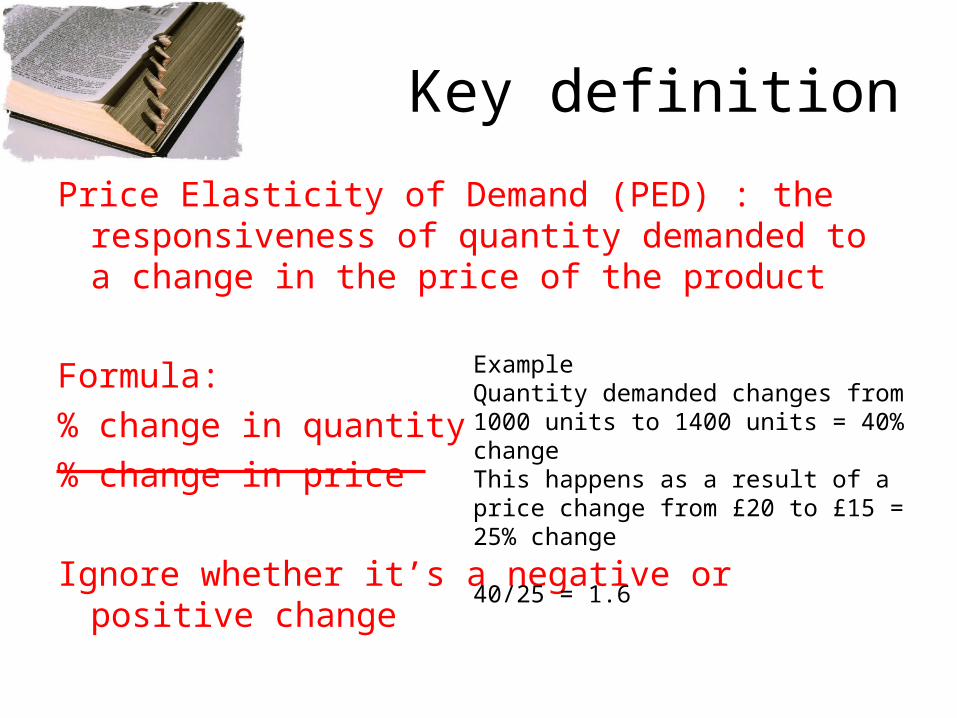
Key definition
Price Elasticity of Demand (PED) : the responsiveness of quantity demanded to a change in the price of the product
Formula:% change in quantity% change in price
Ignore whether it’s a negative or positive change
ExampleQuantity demanded changes from 1000 units to 1400 units = 40% changeThis happens as a result of a price change from £20 to £15 = 25% change
40/25 = 1.6

Elasticity =% change in Q% change in P
Remember!Remember!
You QUEUE before you PEE
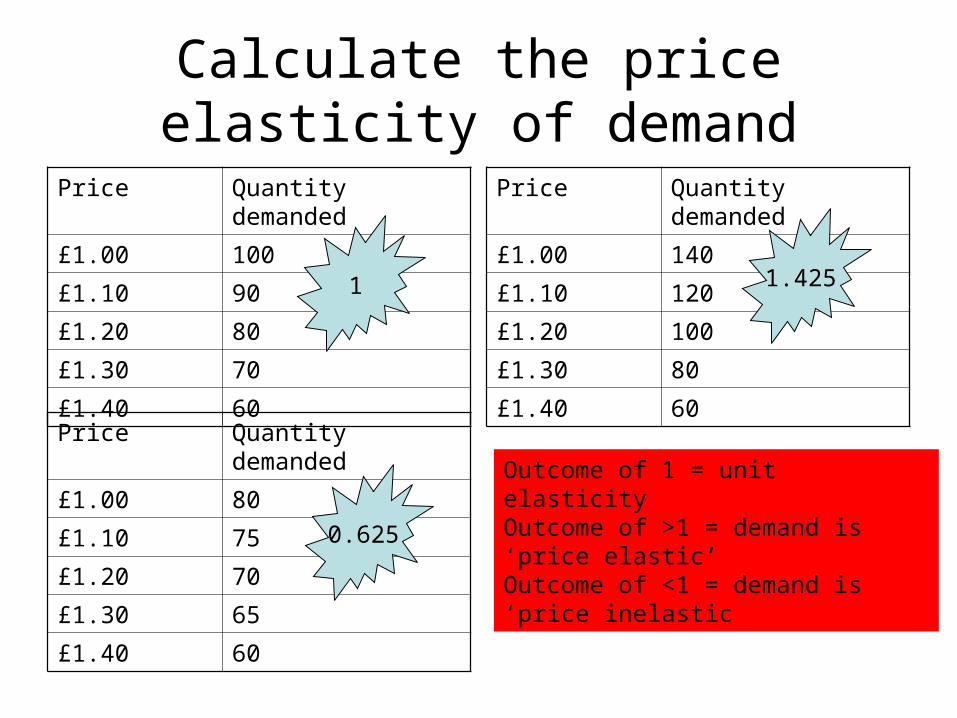
Calculate the price elasticity of demand
Price Quantity demanded
£1.00 100
£1.10 90
£1.20 80
£1.30 70
£1.40 60
Price Quantity demanded
£1.00 140
£1.10 120
£1.20 100
£1.30 80
£1.40 60
Price Quantity demanded
£1.00 80
£1.10 75
£1.20 70
£1.30 65
£1.40 60
Outcome of 1 = unit elasticityOutcome of >1 = demand is ‘price elastic’Outcome of <1 = demand is ‘price inelastic
1.4251
0.625
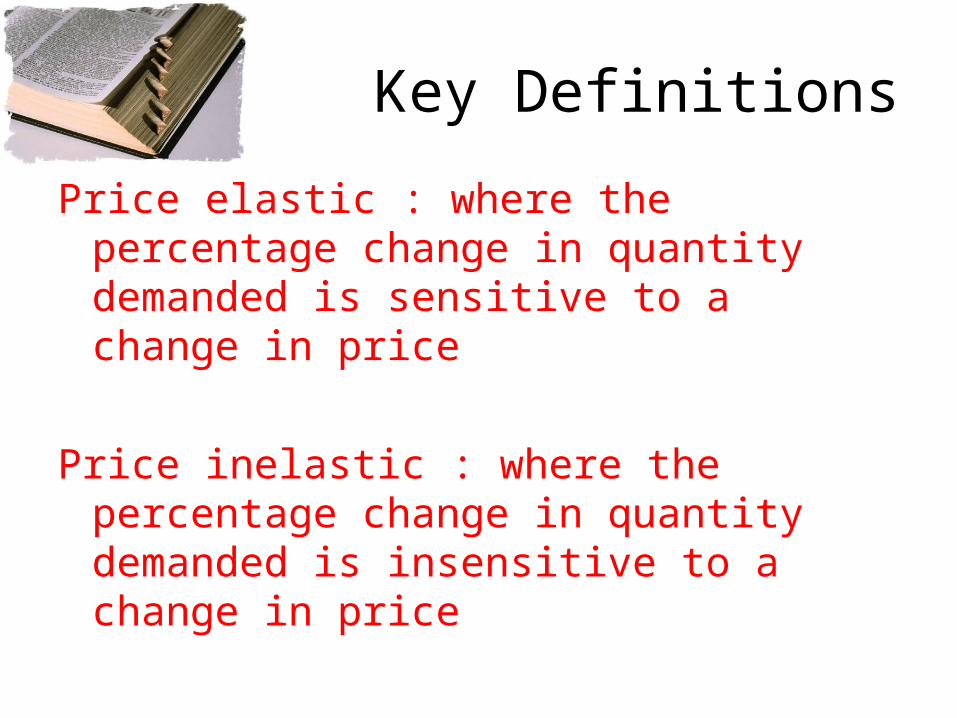
Key Definitions
Price elastic : where the percentage change in quantity demanded is sensitive to a change in price
Price inelastic : where the percentage change in quantity demanded is insensitive to a change in price

Why might quantity demanded be more price sensitive for some
products than others?
vs
vs
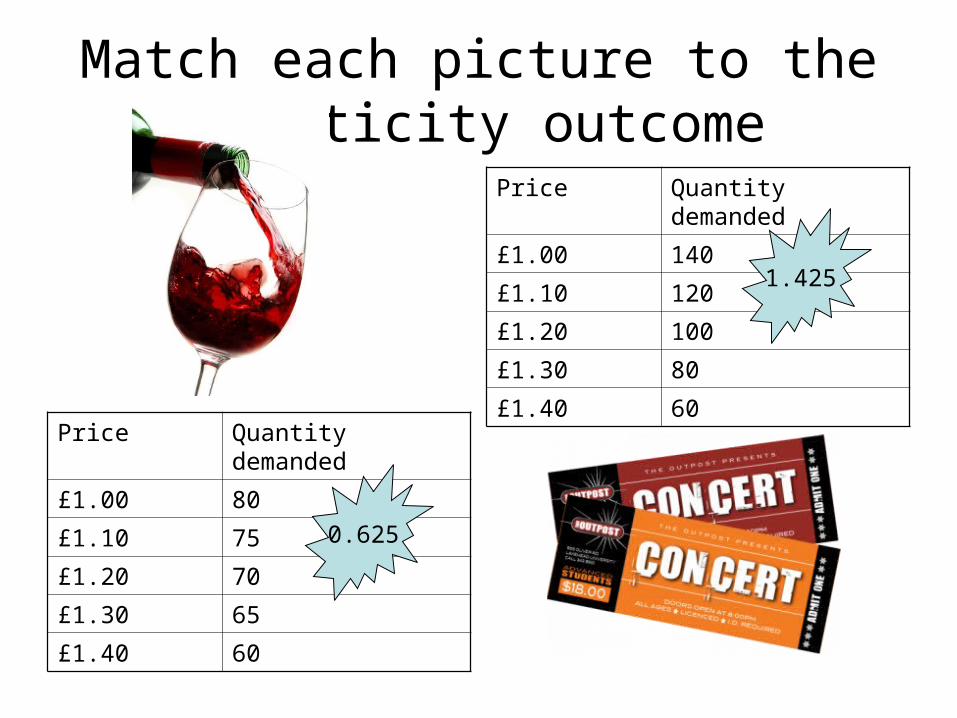
Match each picture to the elasticity outcome
Price Quantity demanded
£1.00 140
£1.10 120
£1.20 100
£1.30 80
£1.40 60
Price Quantity demanded
£1.00 80
£1.10 75
£1.20 70
£1.30 65
£1.40 60
1.425
0.625
Put the items in order, in terms of sensitivity of demand to a change in
price
Lesson Objectives
• To understand the term income elasticity of demand
• To be able to calculate income elasticity of demand
• To be able to describe the link between income elasticity and normal goods and inferior goods
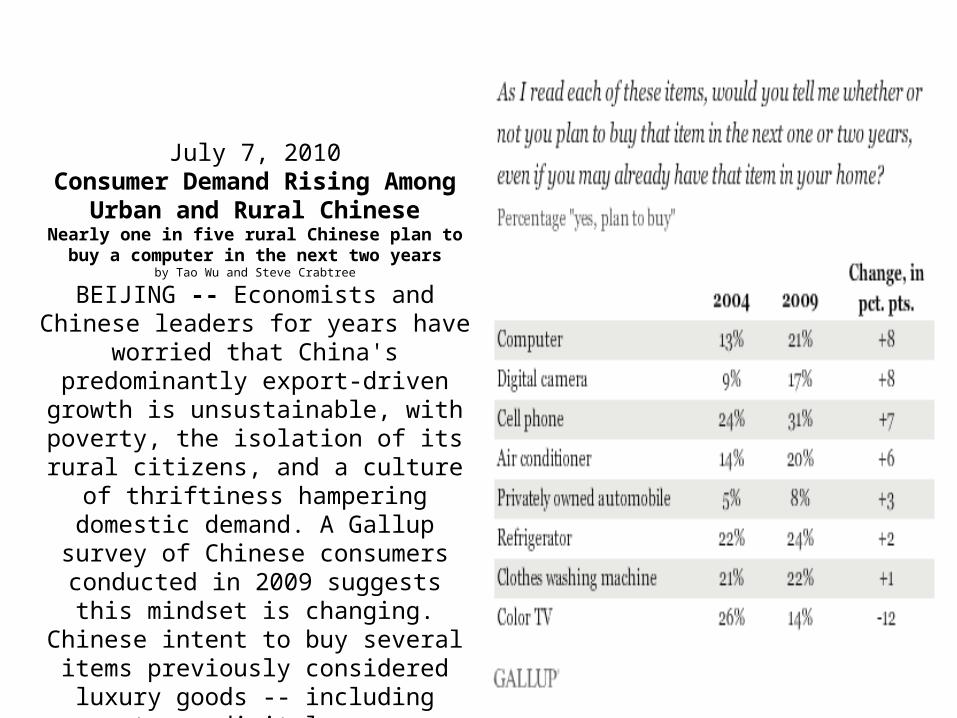
July 7, 2010Consumer Demand Rising Among Urban and
Rural ChineseNearly one in five rural Chinese plan to buy a computer in the
next two yearsby Tao Wu and Steve Crabtree
BEIJING -- Economists and Chinese leaders for years have worried that China's
predominantly export-driven growth is unsustainable, with poverty, the isolation of its rural citizens, and a culture of thriftiness
hampering domestic demand. A Gallup survey of Chinese consumers conducted in
2009 suggests this mindset is changing. Chinese intent to buy several items
previously considered luxury goods -- including computers, digital cameras, and cell phones -- has increased significantly
since 2004.
Key Definition
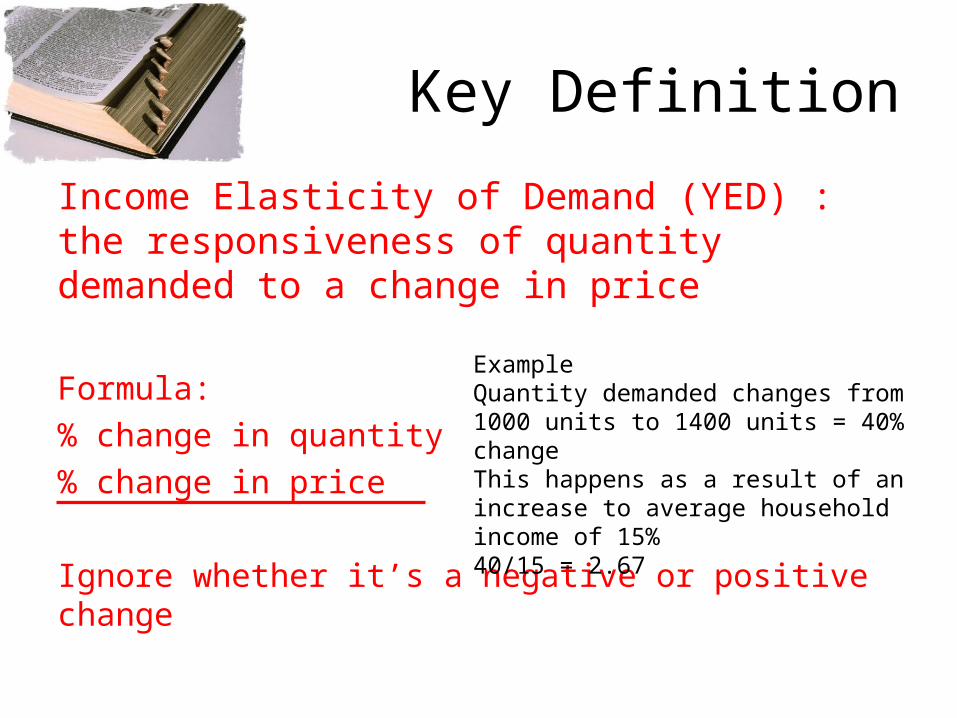
Income Elasticity of Demand (YED) : the responsiveness of quantity demanded to a change in price
Formula:% change in quantity% change in price
Ignore whether it’s a negative or positive change
ExampleQuantity demanded changes from 1000 units to 1400 units = 40% changeThis happens as a result of an increase to average household income of 15%40/15 = 2.67
Key definition
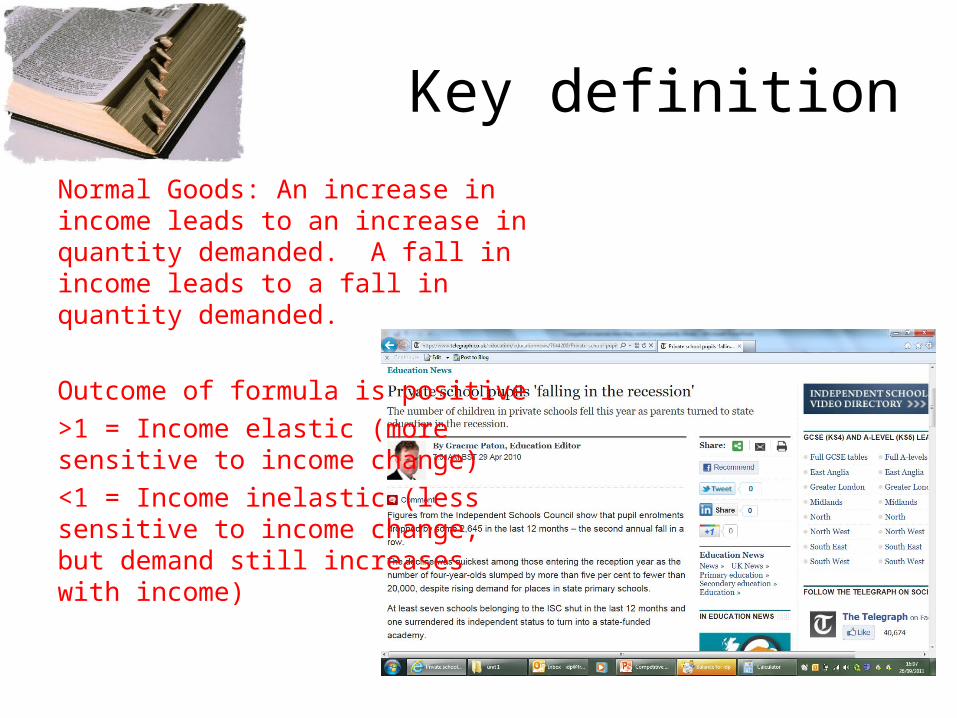
Normal Goods: An increase in income leads to an increase in quantity demanded. A fall in income leads to a fall in quantity demanded.
Outcome of formula is positive>1 = Income elastic (more sensitive to income change)<1 = Income inelastic (less sensitive to income change, but demand still increases with income)
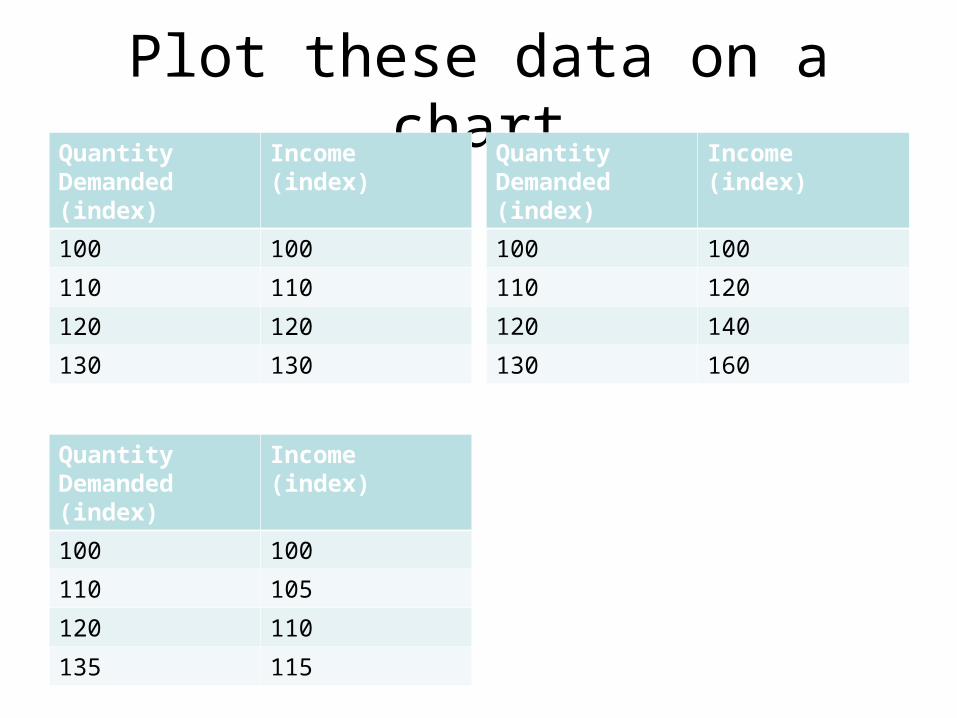
Plot these data on a chartQuantity Demanded (index)
Income (index)
100 100
110 110
120 120
130 130
Quantity Demanded (index)
Income (index)
100 100
110 120
120 140
130 160
Quantity Demanded (index)
Income (index)
100 100
110 105
120 110
135 115

Key Definition
Inferior goods : A fall in income leads to an increase in quantity demanded. An increase in income leads to a fall in quantity demanded.
Outcome of formula is negative
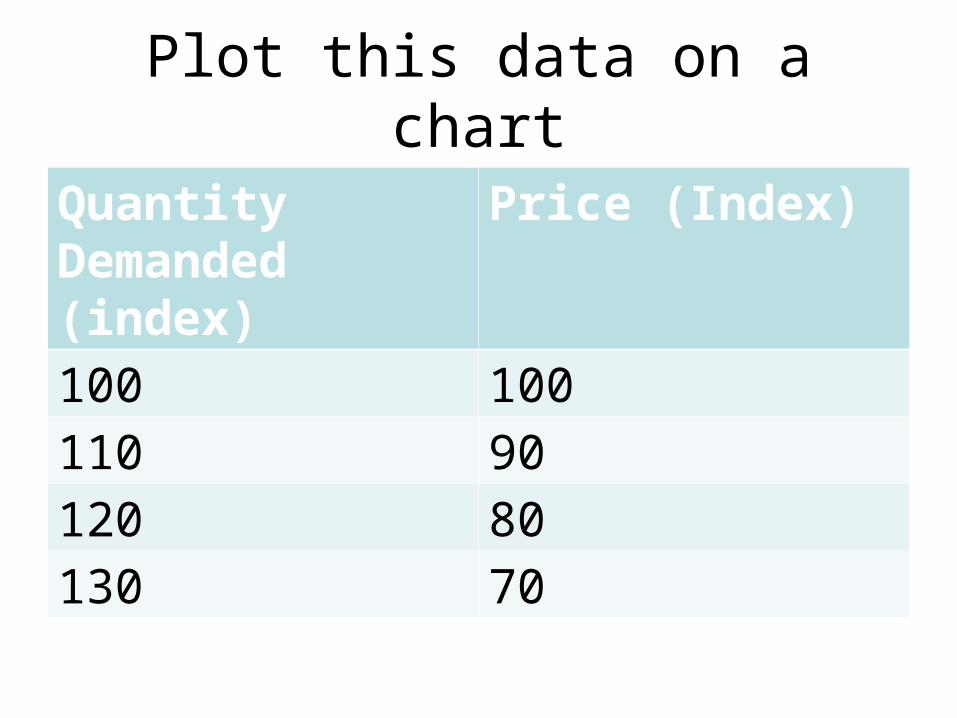
Plot this data on a chart
Quantity Demanded (index)
Price (Index)
100 100
110 90
120 80
130 70

Caution!
• YED is relative, depending upon current level of income
• One person’s normal good is another person’s inferior good
Lesson Objectives
• Be able to define the term Cross Elasticity of Demand (XED)
• Be able to explain and identify examples of substitute and complement goods
• Be able to interpret XED calculations to identify the nature and strength of relationship between two goods

Watch the video (we’ll replay it if necessary)
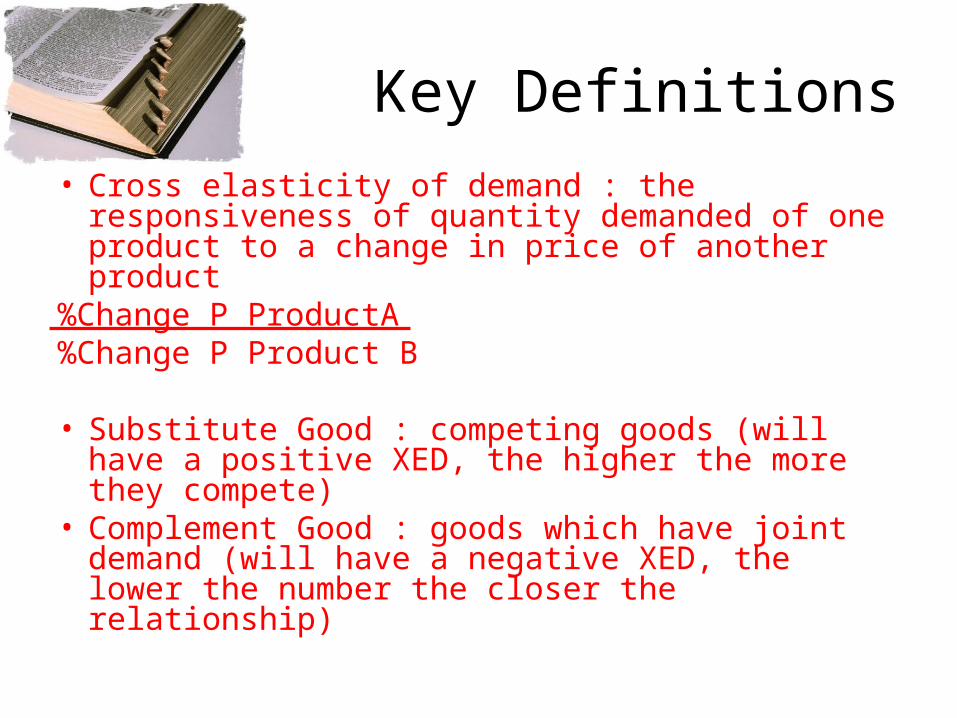
Key Definitions• Cross elasticity of demand : the responsiveness of
quantity demanded of one product to a change in price of another product
%Change P ProductA%Change P Product B
• Substitute Good : competing goods (will have a positive XED, the higher the more they compete)
• Complement Good : goods which have joint demand (will have a negative XED, the lower the number the closer the relationship)
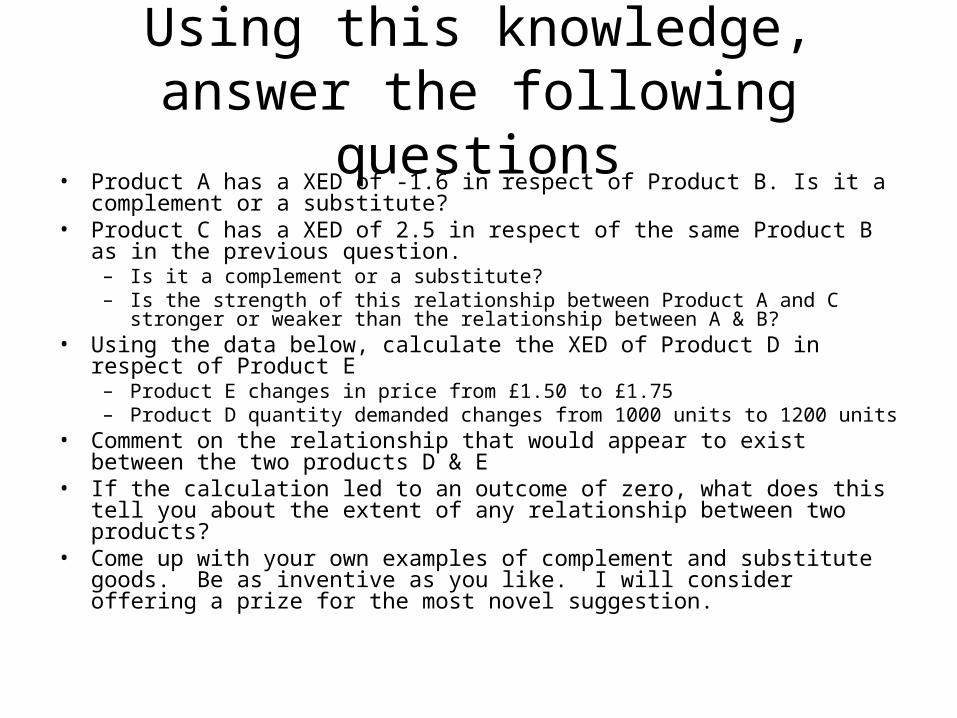
Using this knowledge, answer the following questions
• Product A has a XED of -1.6 in respect of Product B. Is it a complement or a substitute?
• Product C has a XED of 2.5 in respect of the same Product B as in the previous question.
– Is it a complement or a substitute?– Is the strength of this relationship between Product A and C stronger or weaker than the
relationship between A & B?• Using the data below, calculate the XED of Product D in respect of Product E
– Product E changes in price from £1.50 to £1.75– Product D quantity demanded changes from 1000 units to 1200 units
• Comment on the relationship that would appear to exist between the two products D & E
• If the calculation led to an outcome of zero, what does this tell you about the extent of any relationship between two products?
• Come up with your own examples of complement and substitute goods. Be as inventive as you like. I will consider offering a prize for the most novel suggestion.
The relevance of XED
• Especially important in competitive markets where there are many substitute goods
• Firms can both anticipate how their own prices cuts/rises might affect demand, & how competitors actions may impact upon them
• Not as obvious with complements, but a change in price may lead to a change in demand for a complement. Firms will need to be ready to meet new supply levels if possible
Lesson Objectives
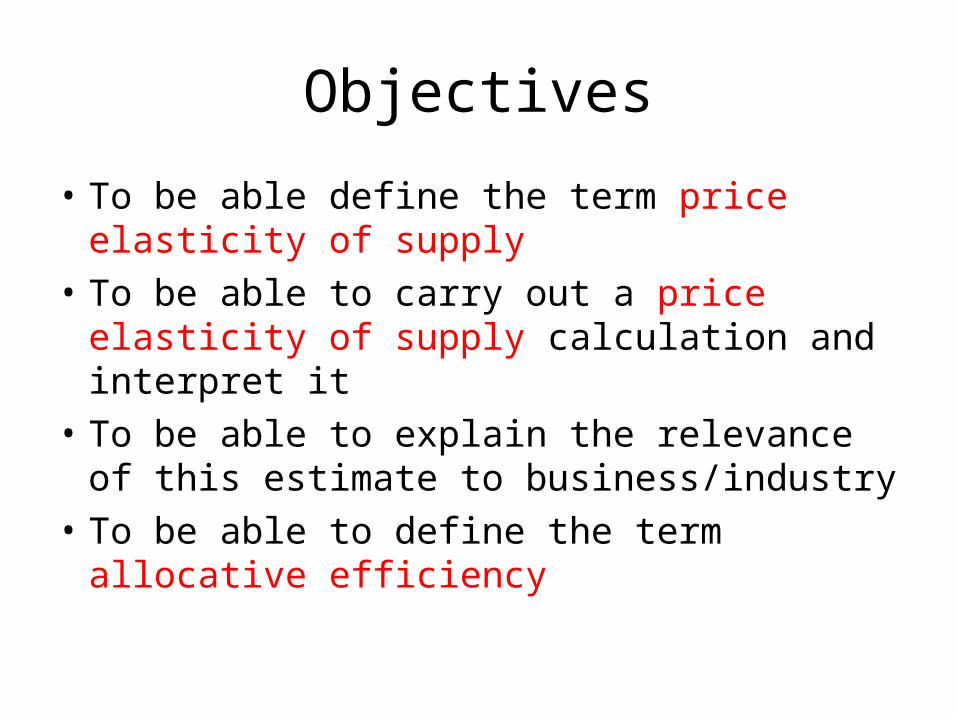
Objectives
• To be able define the term price elasticity of supply
• To be able to carry out a price elasticity of supply calculation and interpret it
• To be able to explain the relevance of this estimate to business/industry
• To be able to define the term allocative efficiency
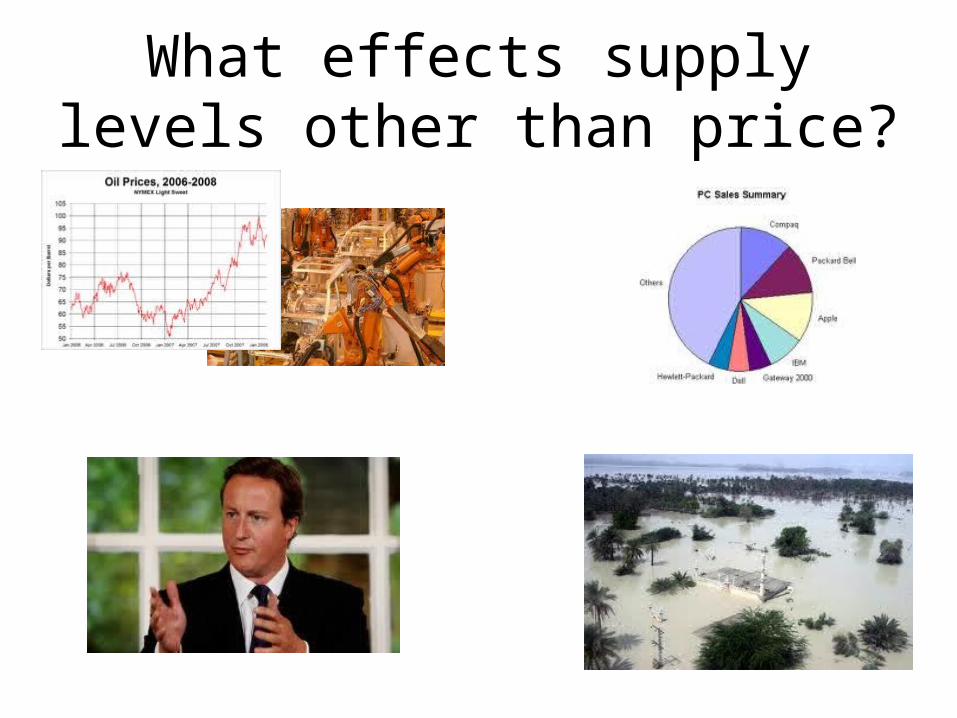
What effects supply levels other than price?
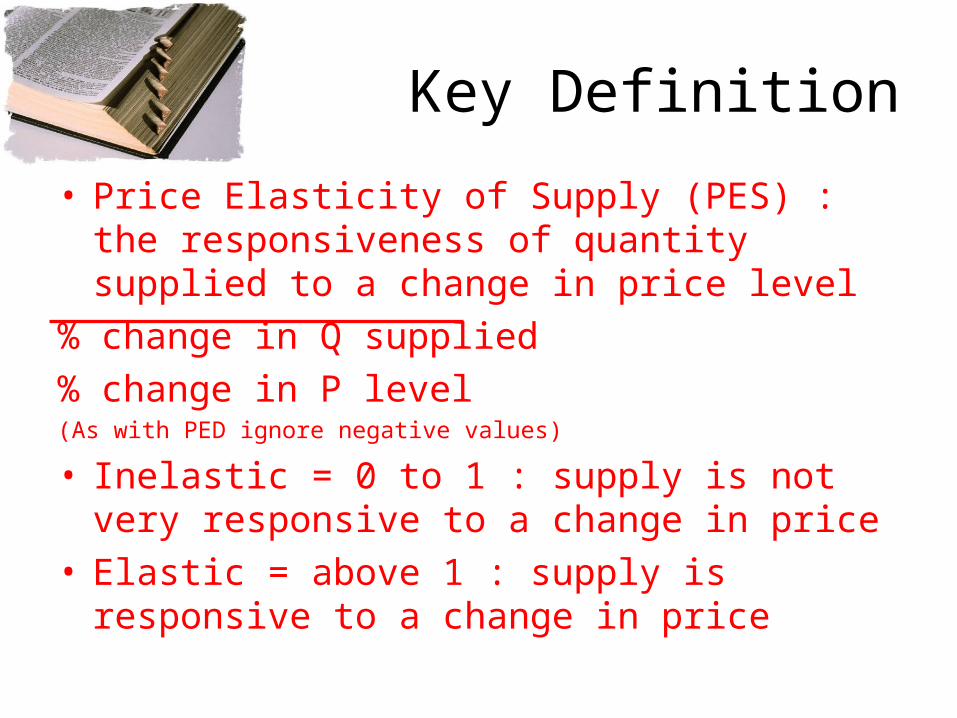
Key Definition
• Price Elasticity of Supply (PES) : the responsiveness of quantity supplied to a change in price level
% change in Q supplied% change in P level(As with PED ignore negative values)
• Inelastic = 0 to 1 : supply is not very responsive to a change in price
• Elastic = above 1 : supply is responsive to a change in price
How steep will the curves be?

Short term vs Long term
Service businesses like airlines need to sell seats in short term or they will make a loss. Over the medium/long term they can reduce capacity if necessary
Farmers cannot change their supply levels in short term as they are committed to certain types of crop
Influences on elasticity of demand
• Availability of stocks – can a firm add new supply to the market quickly?
• Availability of factors of production – does a firm have labour, land, capital available as required to increase supply? Can it easily decrease supply by reducing these inputs?
• Time period – what time period are we discussing?
Relevance
• PES always positive reflecting that as price increases supply will be more attractive to firms
• Reflects the availability of factors of production in short term and long term in order to respond to price changes with a change in supply levels
• Firms will try and make their supply as elastic as possible so they can react quickly. This means holding stock but this can be risky

Key Definition
Allocative Efficiency : where resources are used to produce goods and services that maximise consumer satisfaction