competitive positions of the republic of · pdf fileinnovation education ict 1 denmark 9,61...
TRANSCRIPT
COMPETITIVE POSITIONS OF
THE REPUBLIC OF BELARUS:
RATING APPROACH
Vladimir Novik
Mikhail Kovalev

Competitiveness
OECD: это показатель того, насколькоэффективно страна в условиях свободнойторговли и честных рыночных условийпроизводит товары и услуги, которые проходяттест международными рынками, и одновременноподдерживает и увеличивает реальные доходылюдей в долгосрочной перспективе.
World Economic Forum: the set of institutions,policies, and factors that determine the level ofproductivity of a country.
это способность страны добиваться устойчивогоразвития человеческого капитала
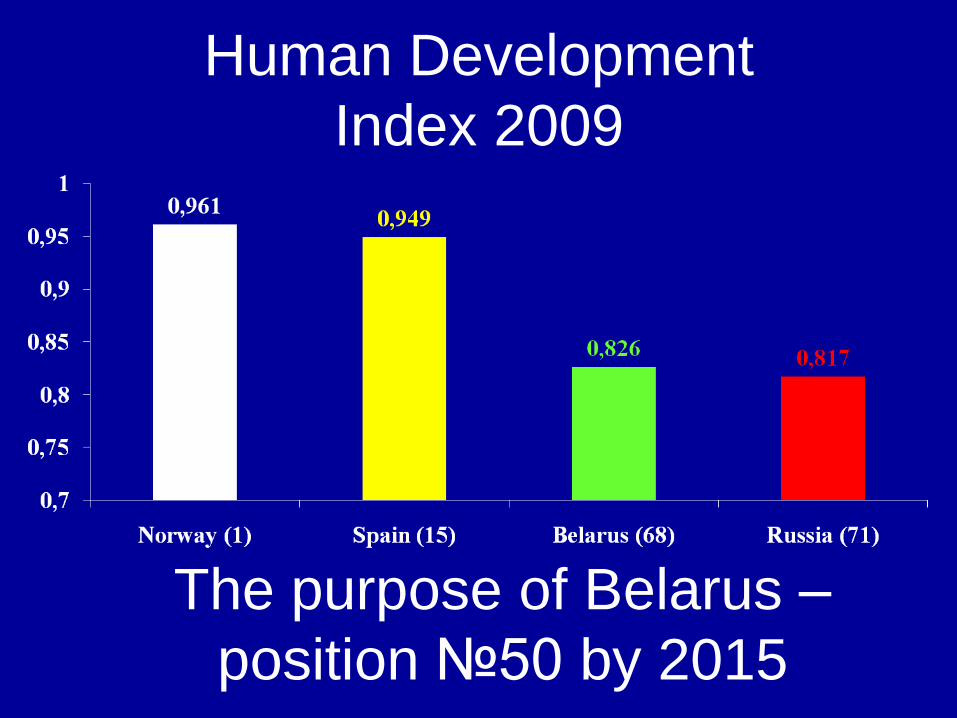
Human Development
Index 2009
The purpose of Belarus –
position №50 by 2015

Structure of Human
Development Index
Ran
k
Life
expectan
cy
Adult
literacy
Gross
enrolme
nt ratio
GDP per
capita
(PPP
US$)
15 Spain 80,7 97,9 96,5 31 560
68 Belarus69 99,7 90,4 10 841
72-73 99,7 95 26 000
71 Russia 66,2 99,5 81,9 14 690
2007
2015

Trend HDI

Growth of GDP in Belarus
IMF (2000-2014)
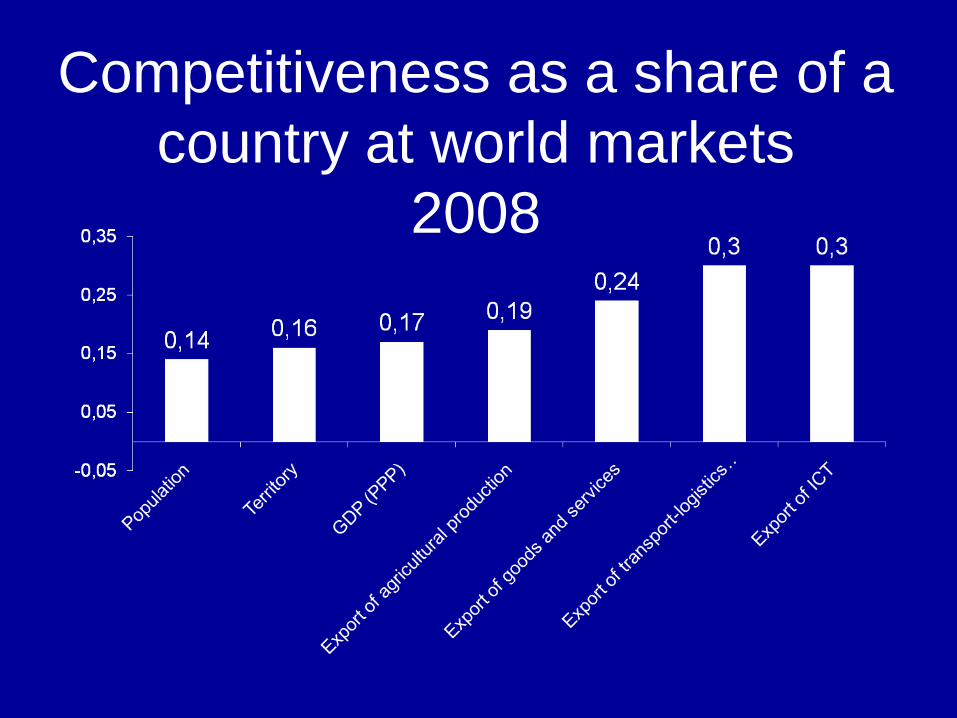
Competitiveness as a share of a
country at world markets
2008

Dynamics of
Postindustrialization
CountryGDP by sectors
Year Agriculture Industry Services
World1990 6 34 60
2007 3 28 69
Spain1990 5 35 60
2009 4 24 72
Russia1990 17 48 35
2009 10 32 58
Belarus1990 24 47 29
2009 9 42 49

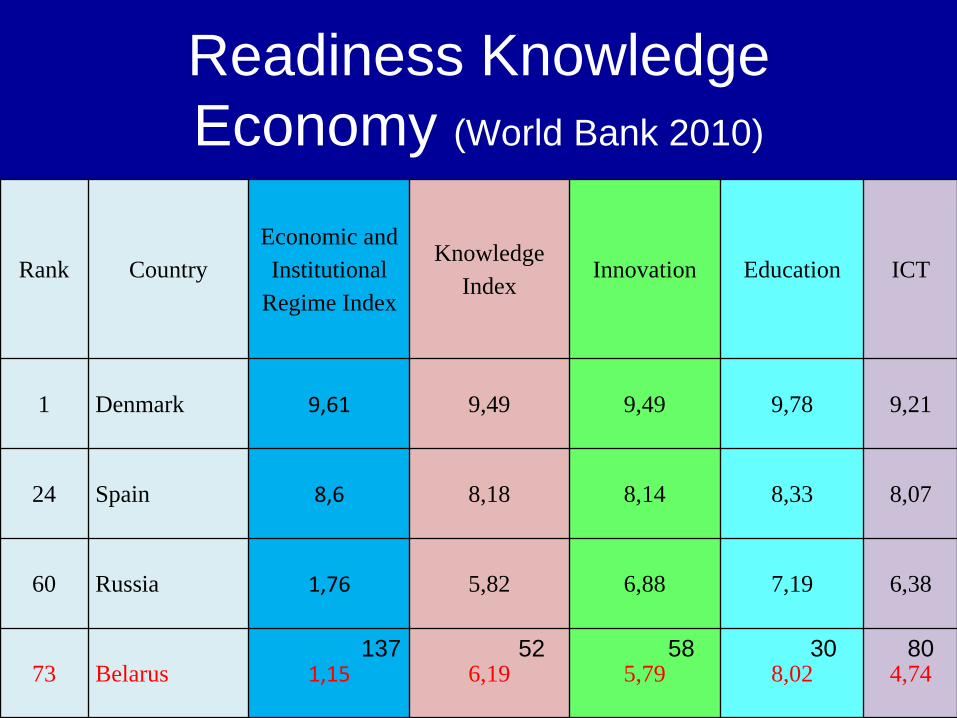
Rank Country
Economic and
Institutional
Regime Index
Knowledge
IndexInnovation Education ICT
1 Denmark 9,61 9,49 9,49 9,78 9,21
24 Spain 8,6 8,18 8,14 8,33 8,07
60 Russia 1,76 5,82 6,88 7,19 6,38
73 Belarus 1,15 6,19 5,79 8,02 4,7480305852137
Readiness Knowledge
Economy (World Bank 2010)
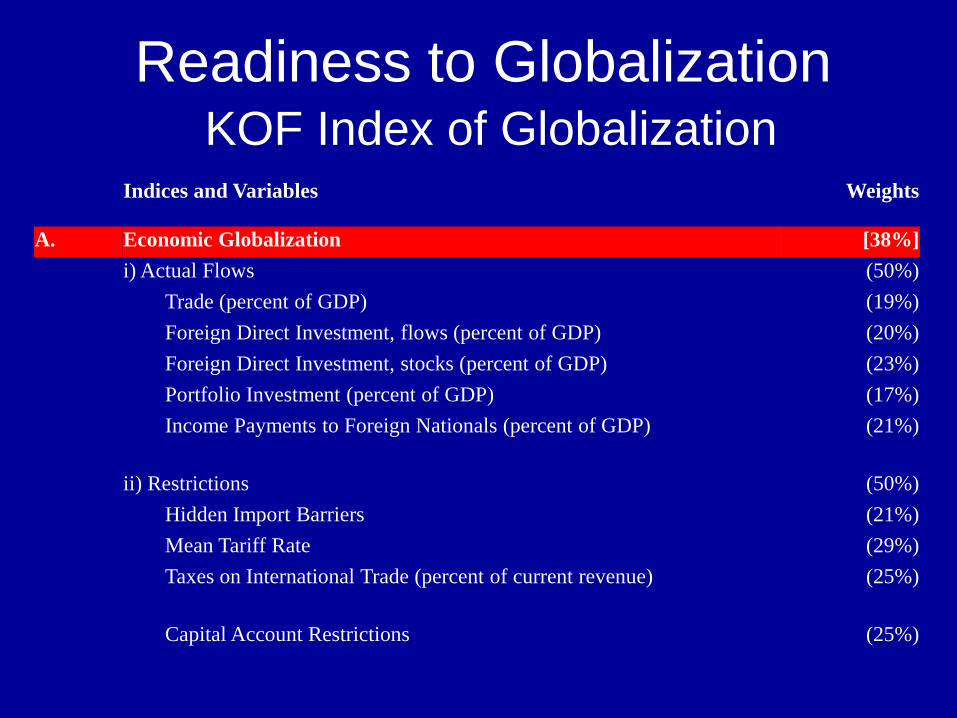
KOF Index of GlobalizationIndices and Variables Weights
A. Economic Globalization [38%]
i) Actual Flows (50%)
Trade (percent of GDP) (19%)
Foreign Direct Investment, flows (percent of GDP) (20%)
Foreign Direct Investment, stocks (percent of GDP) (23%)
Portfolio Investment (percent of GDP) (17%)
Income Payments to Foreign Nationals (percent of GDP) (21%)
ii) Restrictions (50%)
Hidden Import Barriers (21%)
Mean Tariff Rate (29%)
Taxes on International Trade (percent of current revenue) (25%)
Capital Account Restrictions (25%)
Readiness to Globalization

B. Social Globalization [39%]
i) Data on Personal Contact (34%)
Telephone Traffic (26%)
Transfers (percent of GDP) (3%)
International Tourism (26%)
Foreign Population (percent of total population) (20%)
International letters (per capita) (26%)
ii) Data on Information Flows (34%)
Internet Users (per 1000 people) (36%)
Television (per 1000 people) (36%)
Trade in Newspapers (percent of GDP) (28%)
iii) Data on Cultural Proximity (32%)
Number of McDonald's Restaurants (per capita) (37%)
Number of Ikea (per capita) (39%)
Trade in books (percent of GDP) (24%)
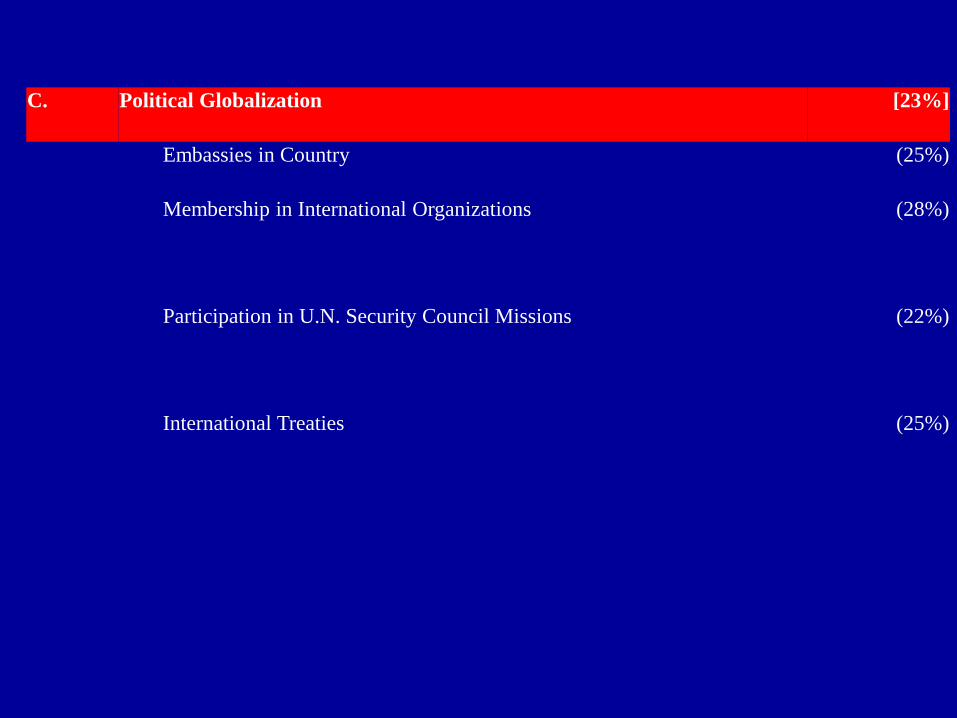
C. Political Globalization [23%]
Embassies in Country (25%)
Membership in International Organizations (28%)
Participation in U.N. Security Council Missions (22%)
International Treaties (25%)

KOF Index of
Globalization 2010
Rank Country
Globali
zation
Index
Economic
Globalization
Social
GlobalizationPolitical
Globalization
1 Belgium 92,95 1 Singapore
(97,48)
1 Switzerland
(94,94)
1 France
(98,44)
42 Russia 68,91 92 58,00 39 68,82 42 85,38
15 Spain 85.71 25 82.11 17 82.52 6 96.14
109 Belarus 51,88 117 46,24 62 61,55 149 45,03

Belarusian Economic Politics:
1. Export (goods & services)
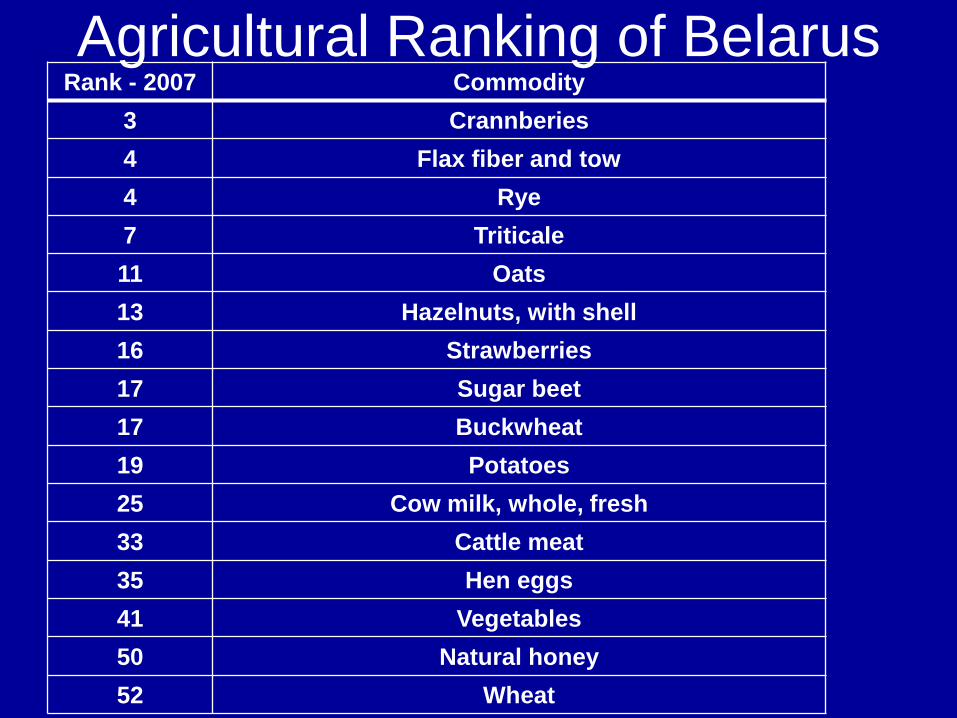
Agricultural Ranking of BelarusRank - 2007 Commodity
3 Crannberies
4 Flax fiber and tow
4 Rye
7 Triticale
11 Oats
13 Hazelnuts, with shell
16 Strawberries
17 Sugar beet
17 Buckwheat
19 Potatoes
25 Cow milk, whole, fresh
33 Cattle meat
35 Hen eggs
41 Vegetables
50 Natural honey
52 Wheat
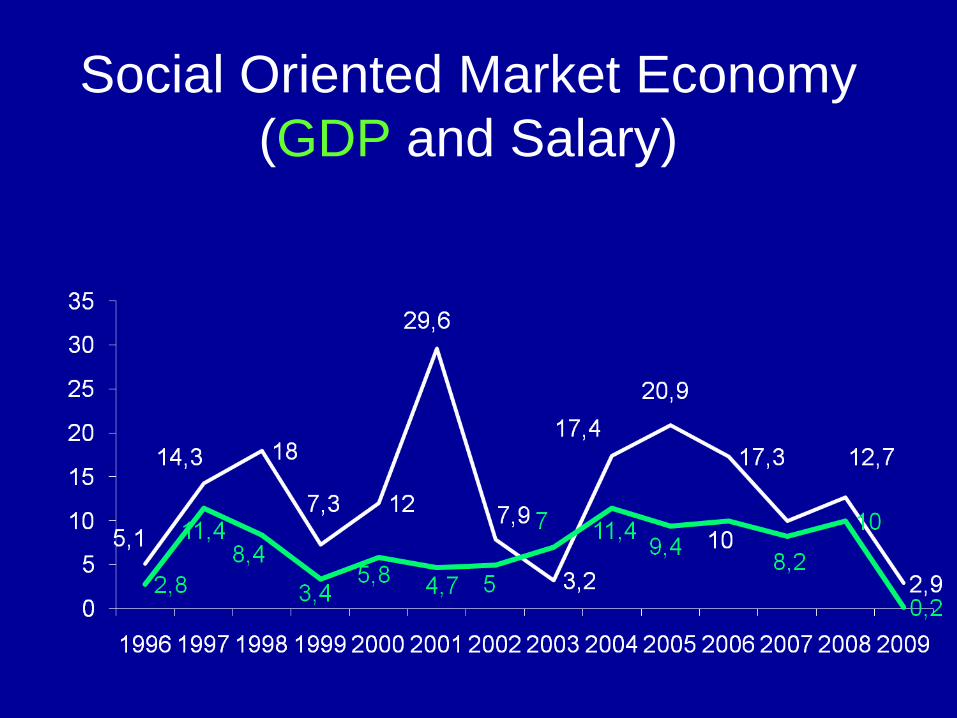
Social Oriented Market Economy
(GDP and Salary)

Policy of High Salary ($)
(GDP)
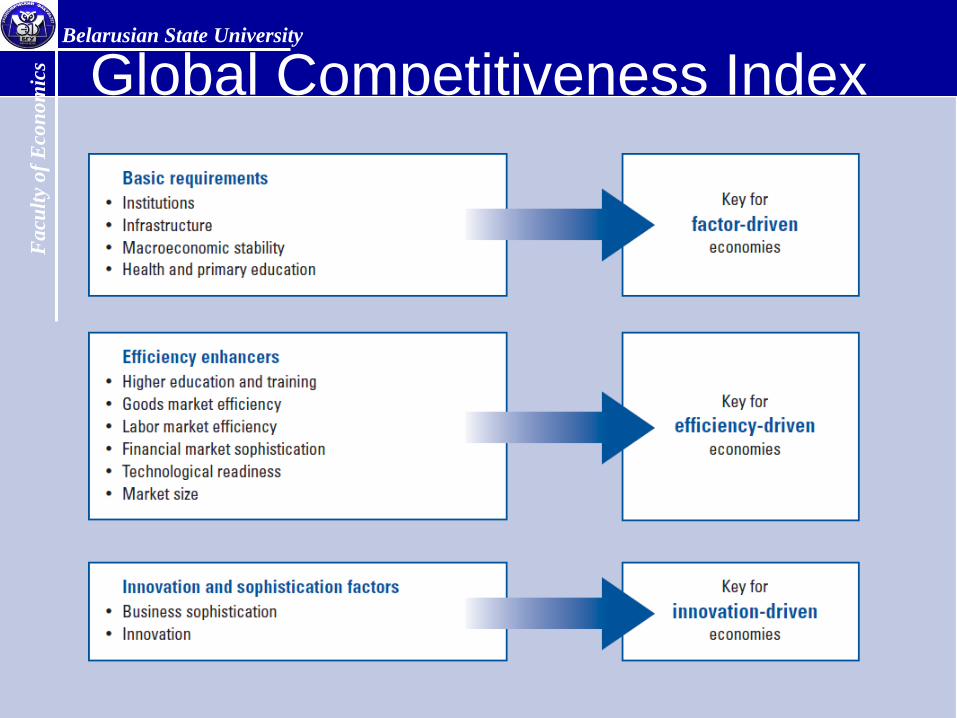
Global Competitiveness IndexBelarusian State University
Fa
cult
y o
f E
con
om
ics

Country Rank 2010E-readiness
2010 E-readiness 2008 Rank 2008 Changes
Republic of Korea 1 0,8785 0,8317 6 -5 ↓
United States 2 0,8510 0,8644 4 -2 ↓
Canada 3 0,8448 0,8172 7 -4 ↓
United Kingdom 4 0,8147 0,7872 10 -6 ↓
Netherlands 5 0,8097 0,8631 5 -
Norway 6 0,8020 0,8921 3 3 ↑
Denmark 7 0,7872 0,9134 2 5 ↑
Australia 8 0,7863 0,8108 8 -
Spain 9 0,7516 0,7228 20 -11 ↓
France 10 0,7510 0,8038 9 1 ↑
Belarus 64 0,4900 0,5213 56 8 ↑
E-government Index 2010
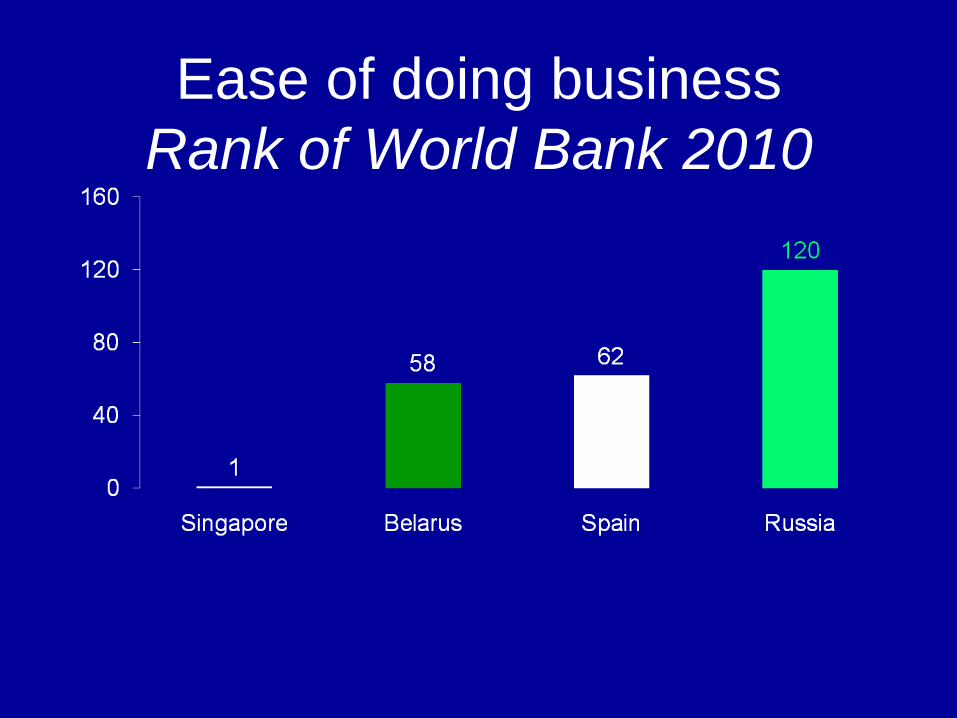
Ease of doing business
Rank of World Bank 2010
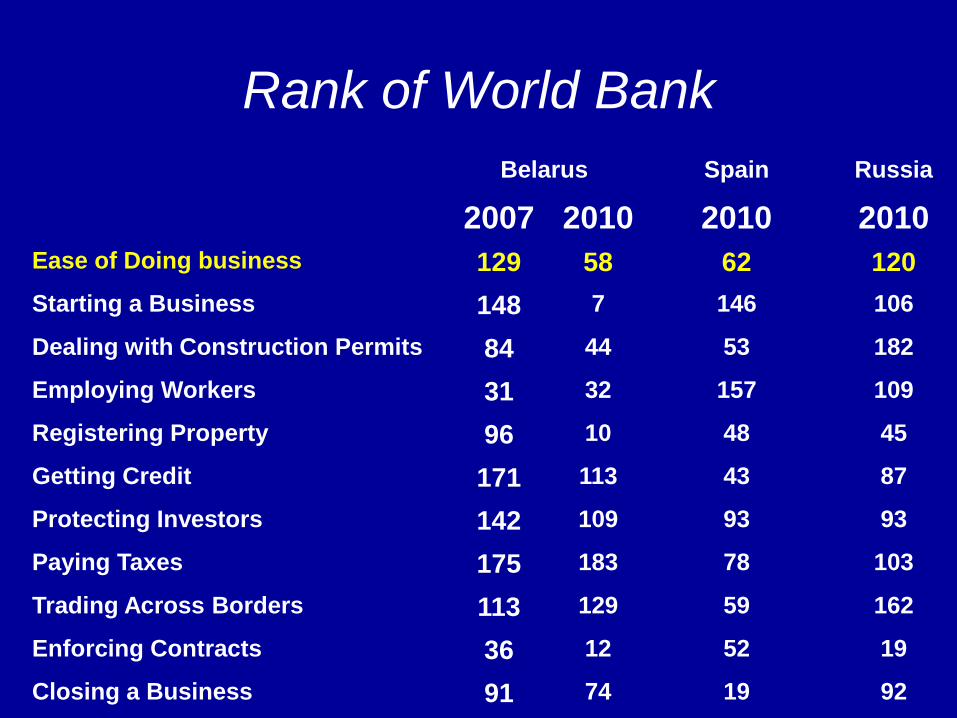
Rank of World Bank
Belarus Spain Russia
2007 2010 2010 2010
Ease of Doing business 129 58 62 120
Starting a Business 148 7 146 106
Dealing with Construction Permits 84 44 53 182
Employing Workers 31 32 157 109
Registering Property 96 10 48 45
Getting Credit 171 113 43 87
Protecting Investors 142 109 93 93
Paying Taxes 175 183 78 103
Trading Across Borders 113 129 59 162
Enforcing Contracts 36 12 52 19
Closing a Business 91 74 19 92

Thank you for your attention!