compiled by biswarup mohapatra, scientist-ccgwb.gov.in/district_profile/gujarat/jamnagar.pdf · the...
TRANSCRIPT

For Official Use
Technical Report Series
DISTRICT GROUNDWATER BROCHURE JAMNAGAR DISTRICT
GUJARAT
Compiled
By
Biswarup Mohapatra, Scientist-C
Government of India
Ministry of Water Resources
Central Ground Water Board West Central Region
Ahmedabad
November 2013

2
JAMNAGAR DISTRICT AT A GLANCE
SL No Items Statistics
1 General Information i) Geographical Area (Sq Km) 14125
ii) Administrative Divisions (As on 2011) Number of Taluka Number of towns Number of Villages
10 16 714
iii) Populations (As per 2011 census) Rural Urban
21,59,130 11,88,485 9,70,645
iv) Average Annual Rainfall (mm) 573
2. GEOMORPHOLOGY Major Physiographic Units Hilly,
Undulating, Coastal plains
Major Drainages Aji,Una, Vartu, Venu, Ghee, Rangmati, Khari.
3. LAND USE (Sq Km) as on 2006-07 (Source: Statistical Abstract of Gujarat 2011-12) a) Forest area
b) Uncultivable land area c) Cultivable land area d) Fallow land e) Net area sown f) Area sown more than once g) Total Cropped Area
454 2240 1086 221 6202 878 7080
4. MAJOR SOIL TYPES Medium black and shallow black soil.
5. AREA UNDER PRINCIPAL CROPS in Sq Km as on 2006-07 (Source: Statistical Abstract of Gujarat 2011-12) Total cereals: 630 (Jowar:30, Bajra:110, Wheat:460, Maize:30) Total Pulses: 230, Total food Grains: 860, Total Oil seeds:3810, Sugar Cane: 10, Cotton: 1620
6. IRRIGATION BY DIFFERENT SOURCES as on 2006-07 (Areas and numbers of structures) (Source: Statistical Abstract of Gujarat 2011-12)
No. Area (Sq Km)
Dug wells 83,079 1752
Tube wells 2743
Tanks/Ponds - 11
Canals - 142
Other Sources - 8
Net Irrigated area by Dug wells(Sq Km) 1643
Gross Irrigated area by Dug wells (Sq Km) 2308
Net Irrigated area by Tube wells (Sq Km) 109
Gross Irrigated by tube wells area (Sq Km) 119

3
7. NUMBERS OF GROUND WATER MONITORING WELLS OF
CGWB (As on 31-03-2013) No of Dug Wells No of Piezometers
53 46 07
8. PREDOMINANT GEOLOGICAL FORMATIONS Deccan traps comprising of basalts cover nearly 80%.
9. HYDROGEOLOGY
Major Water Bearing Formation: Weathered, jointed & Fractured Basalts (80% area), Tertiaries and Alluvium.
Depth to water Level during 2012-13
Period Phreatic Aquifer (DTW) Semi-confined Aquifer (PZ head)
Min Max Min Max
Pre Monsoon 1.74 (Salaya)
38.41 (Lalpur)
NA NA
Post Monsoon 2.05 (Amran)
56.25 (Lalpur)
NA NA
Long Term (10 Years) Water Level Trend (2003-2012)
Trend Pre-Monsoon Post- Monsoon
Rise (m/Yr) 0.0016 (Bed 1) to 1.4780 (Bhatia)
0.015 (Mota Kalawad) to 0.7335 (Modpar)
Fall (m/Yr) 0.0009 (Drafa) to 0.6244 (Moti matli)
0.0176 (Dwarka) to 1.4231 (Lalpur)
10. GROUND WATER EXPLORATION BY CGWB (As on 31 -03 -2013) No of wells drilled (EW, OW, Pz, SH, Total) EW: 58, OW: 08, Pz: 12, SH: 00, Total: 78 Depth Range(m) 33 - 500 Discharge (Litres per second) 3 to 30 Storativity (S)/ Specific yield (m3/day) 20 to 160 Transmissivity (m2/day) 0.6 to 923
11 GROUND WATER QUALITY(As per chem. Analysis of samples collected during May 2012 NHS monitoring) Presence of chemical constituents more than permissible limit EC > 3000µs/Cm F > 1.5 mg/l NO3 > 50mg/l
12 villages 06 villages 09 villages
Type of water Fresh and Saline 2. DYNAMIC GROUND WATER RESOURCES (As on 2011) in MCM
Annual Replenishable Ground Water Resources 900.14
Net Ground water Availability 855.13
Annual Ground water Draft 549.12
Projected Demand for Domestic and industrial Uses up to 2025
60.33
Stage of Ground Water Development (%) 64.21
13 AWARENESS AND TRAINING ACTIVITY Mass awareness Programme (MAP) 01 Water management training Programme (WMTP) 01

4
14 EFFORTS OF ARTIFICIAL RECHARGE & RAINWATER HARVESTING
Projects completed by CGWB (No & Amount spent) None Projects under technical guidance of CGWB (Numbers) None
15 GROUND WATER CONTROL AND REGULATION (2011) Number of OE Blocks Nil Number of Critical Blocks Nil Number of Semi Critical Blocks Nil Number of Safe Blocks 10 Number of Saline Blocks Nil No. Of Blocks Notified by CGWA Nil
16 MAJOR GROUND WATER PROBLEMS AND ISSUES
1. Salinity in ground water both inherent and coastal salinity. 2. Declining Ground water level. 3. High concentration of fluoride in ground water. 4. Ground water contamination due to improper/unscientific well construction. 5. Coastal salinity due to sea water ingress as a result of heavy pumping in coastal
areas. 6. Uniformity in pumping pattern is required. 7. People need to be aware of the aquifer system existing in the area. 8. Demand vis-a vis supply management. 9. Awareness among local people regarding water conservation measures
required.

5
DISTRICT GROUND WATER BROCHURE JAMNAGAR
1.0 Introduction
The district Jamnagar lies between 21°47’ and 22°57’ north latitudes and 68°57’
and 70°37’ east longitudes in the Saurashtra Peninsular region of Gujarat state. The district is bounded on the north by Gulf and Rann of Kuchchh, on the east by Rajkot district, on the south by Porbandar district and on west by Arabian Sea. The area of the district is 14125sq.km with ten talukas, having 714 villages. Total population of the district as per 2011 census is 21,59,130.
The district is devoid of any major perennial rivers, most of them being small and flow sluggishly through the low-lying lands. Principal Rivers are Aji, Una, Vartu, Venu, Ghee, Rangmati, Nagmati, Fulzar, Phuljar, Sasoi, Ruparel and Khari.
Central Ground Water Board has carried out number of studies in the district. The first systematic Hydrogeological investigation was carried out by K. K. Prasad during 1958-59 & 1959-60 (GSI). M.M. Oza, 1968-69 (GSI), continued systematic hydrogeological studies in the district.
Further systematic hydrogeological investigations were carried out by Sh. A.R.Pandey (1976-77), Sh.R.N.Meshram (1978-79), Sh. M.R.Kulkarni & Sh. A.Ahmed (1979-80), Sh. R.C.Jain (1984-85 & 1985-86), Dr. M.N. Khan (1985-86), Central Ground Water Board from time to time covering different talukas of the district. Dr. M.N. Khan (1985-86) and Sh. A. Kannan (2003-04) Central Ground Water Board have carried out Reappraisal survey in different talukas of the district. Sh.R.C.Jain (1988-89) carried out non-conventional survey in the Jamnagar district.
Sh. P. N. Phadtare (1981), CGWB, compiled “hydrogeology of Gujarat State” and discussed groundwater resource potential of the district based on earlier studies.
Groundwater exploration by test drilling in the district commenced in fifties and is continued till 2010-11. Apart from the exploratory wells Piezometer have also been constructed in the district. Representative dug wells and piezometers are monitored periodically for the ground water level and quality changes in the district and is continued till date.
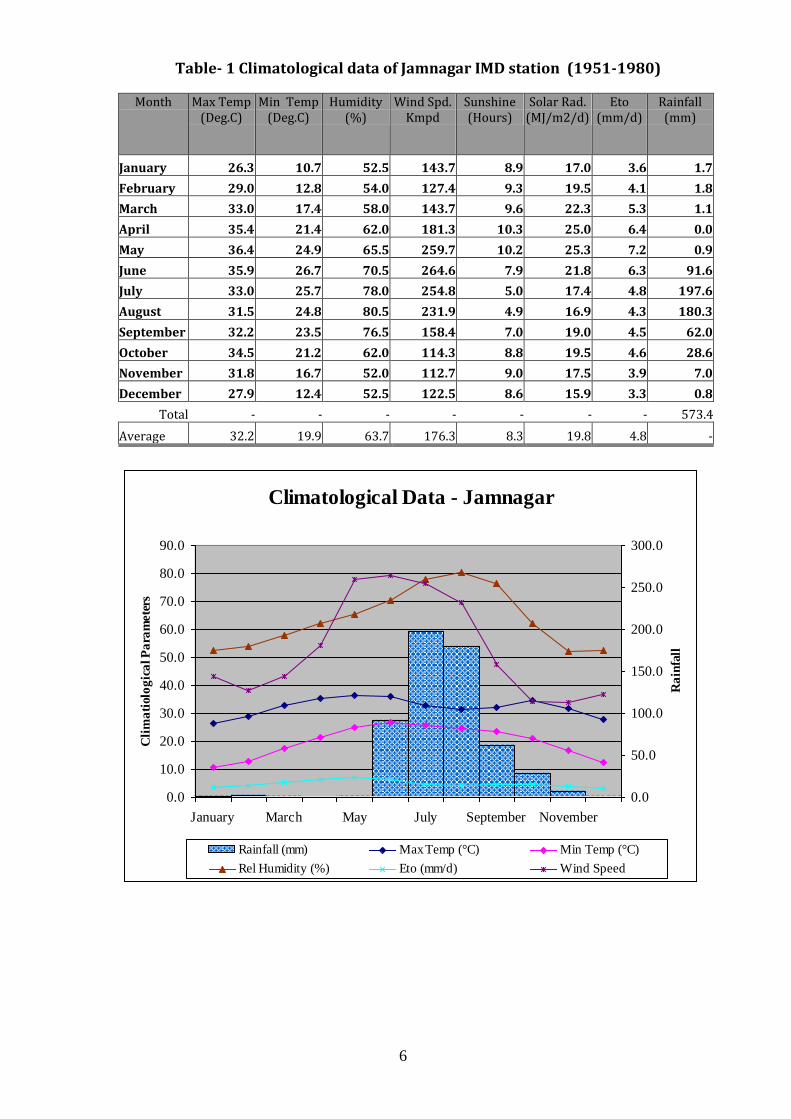
2.0 Rainfall and climate The district has semi arid climate. Extreme temperatures, erratic rainfall and high evaporation are the characteristic features of this type of climate. The average annual normal rainfall is 573.4 mm for 30 years. Climatological data of Jamnagar IMD station (1951-1980) is given in the table 1.
6
Table- 1 Climatological data of Jamnagar IMD station (1951-1980)
Month Max Temp (Deg.C)
Min Temp (Deg.C)
Humidity (%)
Wind Spd. Kmpd
Sunshine (Hours)
Solar Rad. (MJ/m2/d)
Eto (mm/d)
Rainfall (mm)
January 26.3 10.7 52.5 143.7 8.9 17.0 3.6 1.7
February 29.0 12.8 54.0 127.4 9.3 19.5 4.1 1.8
March 33.0 17.4 58.0 143.7 9.6 22.3 5.3 1.1
April 35.4 21.4 62.0 181.3 10.3 25.0 6.4 0.0
May 36.4 24.9 65.5 259.7 10.2 25.3 7.2 0.9
June 35.9 26.7 70.5 264.6 7.9 21.8 6.3 91.6
July 33.0 25.7 78.0 254.8 5.0 17.4 4.8 197.6
August 31.5 24.8 80.5 231.9 4.9 16.9 4.3 180.3
September 32.2 23.5 76.5 158.4 7.0 19.0 4.5 62.0
October 34.5 21.2 62.0 114.3 8.8 19.5 4.6 28.6
November 31.8 16.7 52.0 112.7 9.0 17.5 3.9 7.0
December 27.9 12.4 52.5 122.5 8.6 15.9 3.3 0.8
Total - - - - - - - 573.4
Average 32.2 19.9 63.7 176.3 8.3 19.8 4.8 -
Climatological Data - Jamnagar
0.0
10.0
20.0
30.0
40.0
50.0
60.0
70.0
80.0
90.0
January March May July September November
Cli
ma
tiolo
gic
al P
ara
mete
rs
0.0
50.0
100.0
150.0
200.0
250.0
300.0
Ra
infa
ll
Rainfall (mm) Max Temp (°C) Min Temp (°C)
Rel Humidity (%) Eto (mm/d) Wind Speed

7
3.0 Geomorphology and Soil Type
Physiographically the district can be divided into the following units: Hilly areas and Coastal & alluvial Plains
Jamnagar, Jodiya, Khambaliya and Kalyanpur talukas are characterised by plain topography, whereas Jam Jodphur, Lalpur and Bhanwad talukas are characterised by hilly terrains. Cliffs are found in the Dwarka taluka with height upto 30m. Barda, Alech, Gop etc are famous hill ranges in the district. Mount Venu is the highest summit of Barda hills that attains a height of 617.1 metres. Okha Rann is a low-lying marshy area. Low coastal dunes and sand banks run along the north and west coasts. Jamnagar, Jodiya and Kalyanpur are plain areas.
Soils of the district may be broadly classified as Coastal alluvial, medium black, shallow black and hilly. The medium black and shallow black soils are the main soil type of the district, while the coastal and hilly soils are the sub-soils. The black soil is rich in mineral and organic matter and is more fertile. The medium black soils are found in Dhrol, Jamnagar, Khambaliya, and kalyanpur talukas. These soils are generally 25 to 50 cm deep. Shallow black soils are found in Kalawad, Jam Jodhpur, Bhanwad, Okhamandal and Lalpur talukas. It is about 25cm deep. The coastal alluvial soils are found in Kalyanpur, Khambaliya, Jamnagar and Jodiya talukas. These soils are mostly saline and alkaline in nature. Hilly soils are found in southern parts of the district, particularly I Bhanwad, Lalpur, Jam Jodhpur and Kalawad talukas.
4.0 Ground Water Scenario
4.1 Hydrogeology
Hydrogeologically the district area can be broadly grouped under hard rocks comprising “Deccan traps” and soft rocks comprising “Tertiaries and Alluvium”. Nearly 80% of the area is underlain by Deccan Traps, 19% by the Teriaries and the rest by Alluvium. Hydrogeological conditions in various lithounits are described below:
a) Deccan Traps (Hard rock): These are essentially basaltic flows having general horizontal to near horizontal disposition over large area. The basaltic flows do not have any primary porosity in the lower massive portion, but the top vesicular portion has some porosity because of the vesicles formed due to escaping gases. Both massive and vesicular portions have no primary permeability, as the vesicules are seldom interconnected. The secondary porosity and permeability developed due to fracturing and jointing provides passage for infiltration, storage and movement of groundwater. The weathered zone extends to about 20m bgl in the surface flows. Weathered flow contacts extend to greater depths. The permeability of these zones are further intensified by fracturing and jointing. These interflow zones and fractured and jointed zones have given rise to stratified aquifer system, which is responsible for occurrence of water even at greater depths. Weathering of basalts, which extends down to 20m and the fractured basalts beneath the weathered mantle have given rise to water table aquifers down to 40 m bgl. The depth of water level in the area ranges from 3.30 m bgl to 25.40 bgl during the pre monsoon period while during the post monsoon the water level ranges from 0.06 to 17.50 m bgl. The yields of the wells tapping weathered basalts are in the range of 20-100m3/day. Those in which interflow zones have been tapped 100-400m3/day. The bore wells drilled in the district have yields ranging from 100 to 500m3/day.
8
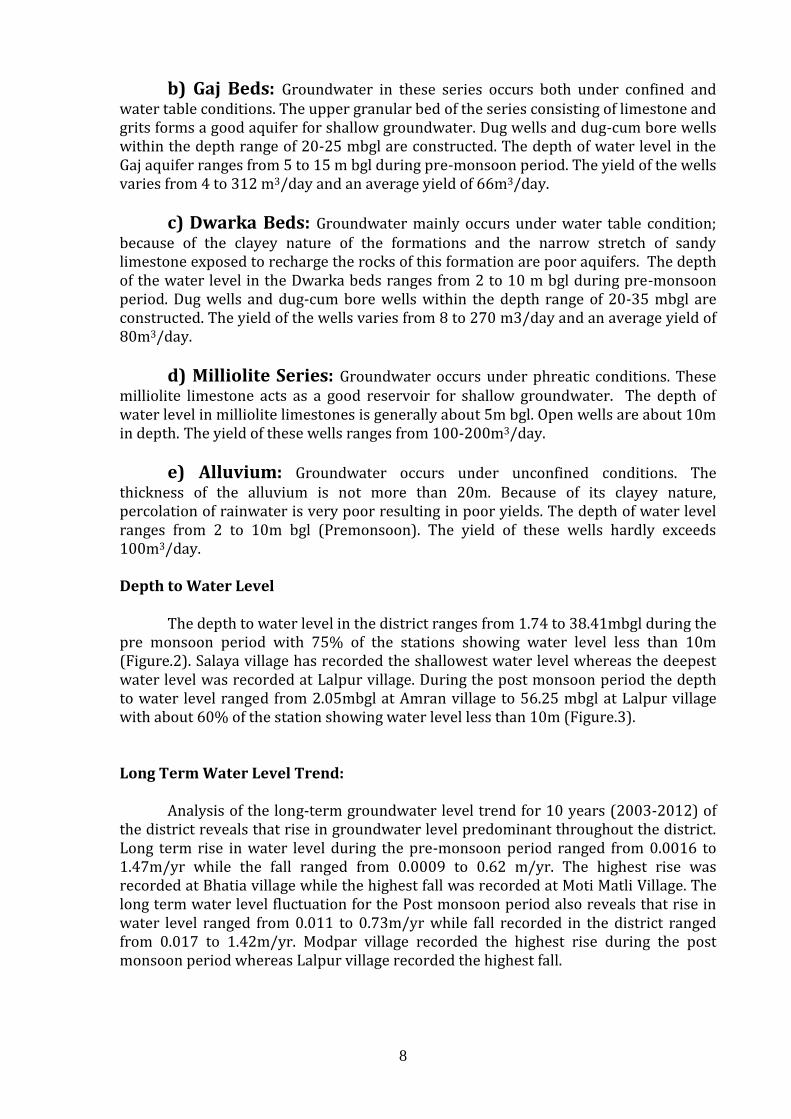
b) Gaj Beds: Groundwater in these series occurs both under confined and water table conditions. The upper granular bed of the series consisting of limestone and grits forms a good aquifer for shallow groundwater. Dug wells and dug-cum bore wells within the depth range of 20-25 mbgl are constructed. The depth of water level in the Gaj aquifer ranges from 5 to 15 m bgl during pre-monsoon period. The yield of the wells varies from 4 to 312 m3/day and an average yield of 66m3/day.
c) Dwarka Beds: Groundwater mainly occurs under water table condition; because of the clayey nature of the formations and the narrow stretch of sandy limestone exposed to recharge the rocks of this formation are poor aquifers. The depth of the water level in the Dwarka beds ranges from 2 to 10 m bgl during pre-monsoon period. Dug wells and dug-cum bore wells within the depth range of 20-35 mbgl are constructed. The yield of the wells varies from 8 to 270 m3/day and an average yield of 80m3/day.
d) Milliolite Series: Groundwater occurs under phreatic conditions. These milliolite limestone acts as a good reservoir for shallow groundwater. The depth of water level in milliolite limestones is generally about 5m bgl. Open wells are about 10m in depth. The yield of these wells ranges from 100-200m3/day.
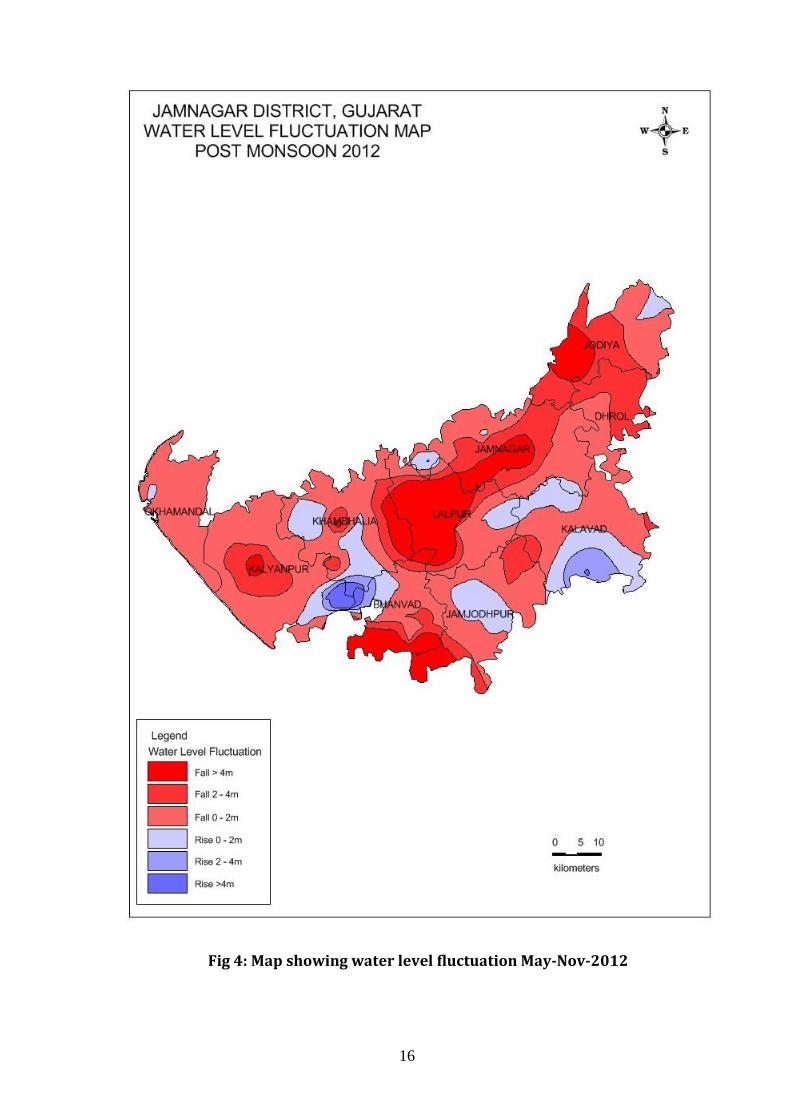
e) Alluvium: Groundwater occurs under unconfined conditions. The thickness of the alluvium is not more than 20m. Because of its clayey nature, percolation of rainwater is very poor resulting in poor yields. The depth of water level ranges from 2 to 10m bgl (Premonsoon). The yield of these wells hardly exceeds 100m3/day. Depth to Water Level The depth to water level in the district ranges from 1.74 to 38.41mbgl during the pre monsoon period with 75% of the stations showing water level less than 10m (Figure.2). Salaya village has recorded the shallowest water level whereas the deepest water level was recorded at Lalpur village. During the post monsoon period the depth to water level ranged from 2.05mbgl at Amran village to 56.25 mbgl at Lalpur village with about 60% of the station showing water level less than 10m (Figure.3). Long Term Water Level Trend: Analysis of the long-term groundwater level trend for 10 years (2003-2012) of the district reveals that rise in groundwater level predominant throughout the district. Long term rise in water level during the pre-monsoon period ranged from 0.0016 to 1.47m/yr while the fall ranged from 0.0009 to 0.62 m/yr. The highest rise was recorded at Bhatia village while the highest fall was recorded at Moti Matli Village. The long term water level fluctuation for the Post monsoon period also reveals that rise in water level ranged from 0.011 to 0.73m/yr while fall recorded in the district ranged from 0.017 to 1.42m/yr. Modpar village recorded the highest rise during the post monsoon period whereas Lalpur village recorded the highest fall.

9
4.2 Ground Water Resources The ground water resources potential as on March 2011 of Jamnagar district and stage of development are presented in table-2. It may be observed from the table that all the assessment units (Talukas) fall under safe category and the stage of ground water development of the district is 64.21%.
Table- 2 Ground Water Resources Potential
Sr. No.
Taluka
Net Annual Ground Water
Availability (Ham)
ANNUAL GROUND WATER DRAFT (Ham)
Projected Demand
for Domestic
and Industrial uses upto
2025 (Ham)
Ground Water
Availability for future irrigation
(Ham)
Stage of Ground Water
Development (%) Irrigation Domestic
And Industrial
uses
Total
1 2 9 10 11 12 13 14 15
1 Bhanvad 9198.72 4769.70 331.00 5100.70 444.00 3985.02
55.45
2 Dhrol 5871.12 3332.20 113.00 3445.20 152.00 2386.92
58.68
3 Jodiya 4435.87 2660.00 147.00 2807.00 198.00 1577.87
63.28
4 Jamnagar 11805.99 6473.40 1443.00 7916.40 1934.00 3398.59
67.05
5 Kalyanpur 7198.64 4176.30 486.00 4662.30 652.00 2370.34
64.77
6 Khambhalia 10046.96 6038.30 633.00 6671.30 847.00 3161.66
66.40
7 Kalavad 12610.65 8066.30 412.00 8478.30 552.00 3992.35
67.23
8 Jamjodhpur 12536.55 7730.70 355.00 8085.70 476.00 4329.85
64.50
9 Lalpur 9449.72 5891.90 307.00 6198.90 412.00 3145.82
65.60
10 Okhamandal 2359.02 1273.40 273.00 1546.40 366.00 719.62
65.55
District Total 85513.26 50412.20 4500.00 54912.20 6033.00 29068.06 64.21
10
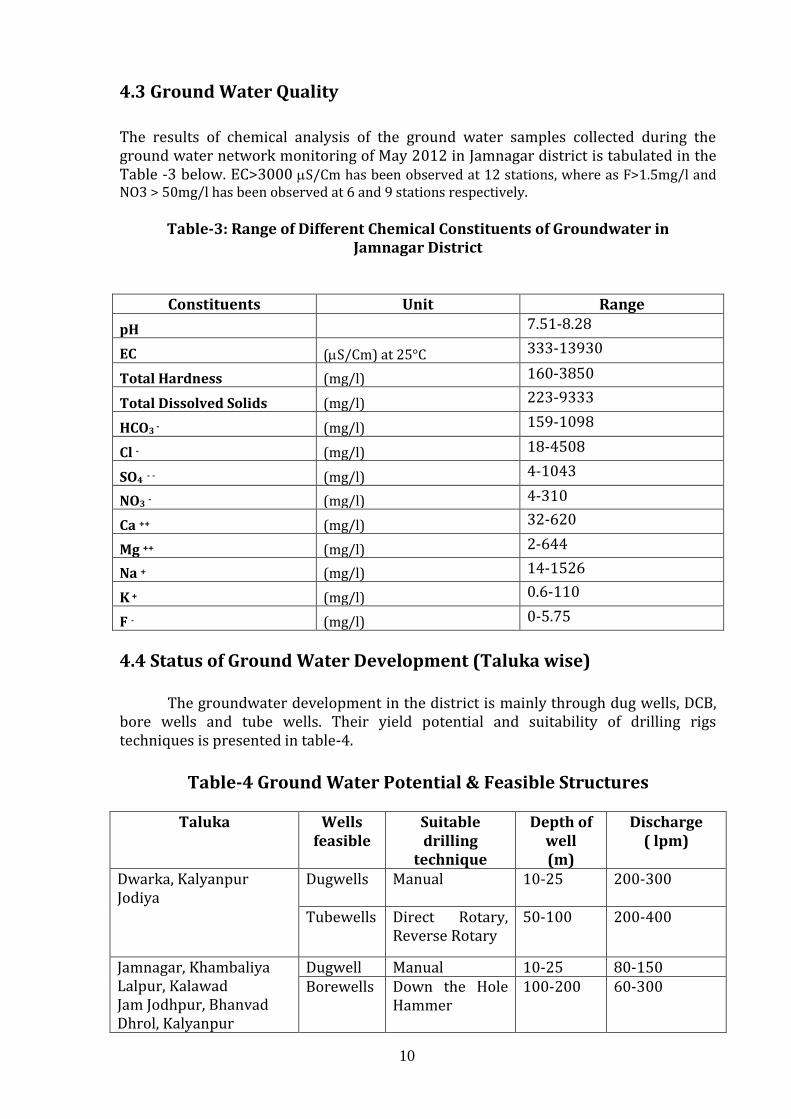
4.3 Ground Water Quality
The results of chemical analysis of the ground water samples collected during the ground water network monitoring of May 2012 in Jamnagar district is tabulated in the Table -3 below. EC>3000 S/Cm has been observed at 12 stations, where as F>1.5mg/l and NO3 > 50mg/l has been observed at 6 and 9 stations respectively.
Table-3: Range of Different Chemical Constituents of Groundwater in Jamnagar District
Constituents Unit Range
pH 7.51-8.28
EC (S/Cm) at 25°C 333-13930
Total Hardness (mg/l) 160-3850
Total Dissolved Solids (mg/l) 223-9333
HCO3 - (mg/l) 159-1098
Cl - (mg/l) 18-4508
SO4 - - (mg/l) 4-1043
NO3 - (mg/l) 4-310
Ca ++ (mg/l) 32-620
Mg ++ (mg/l) 2-644
Na + (mg/l) 14-1526
K + (mg/l) 0.6-110
F - (mg/l) 0-5.75
4.4 Status of Ground Water Development (Taluka wise)
The groundwater development in the district is mainly through dug wells, DCB, bore wells and tube wells. Their yield potential and suitability of drilling rigs techniques is presented in table-4.
Table-4 Ground Water Potential & Feasible Structures
Taluka Wells
feasible Suitable drilling
technique
Depth of well (m)
Discharge ( lpm)
Dwarka, Kalyanpur Jodiya
Dugwells
Manual 10-25 200-300
Tubewells Direct Rotary, Reverse Rotary
50-100 200-400
Jamnagar, Khambaliya Lalpur, Kalawad Jam Jodhpur, Bhanvad Dhrol, Kalyanpur
Dugwell Manual 10-25 80-150 Borewells Down the Hole
Hammer 100-200 60-300
11
5.0 GROUND WATER MANAGEMENT STRATEGY 5.1Ground Water Development The groundwater development in Jamnagar district is through dug well; dug cum bore well, bore well, hand pumps and tube wells etc. The district can be broadly divided into two units. The major area is covered by hard rock formation i.e. Deccan traps. Ground water development in this area is by dug well and bore wells. The yield ranges from 80-150lpm in dug wells and 60-300lpm in bore wells. The soft rock formation in the district has limited resources. The discharge in these formation ranges from 200-300lpm in dug well zone and 200-400lpm in tube well zones. Analysis of the hydrographs of the pre-post monsoon and annual and long-term trend reveals that the groundwater level reaches to the near surface after the monsoon. This pattern indicates that the decline in ground water level due to withdrawal of ground water during the lean period gets recharged substantially during subsequent rainfall. The Okhamandal taluka has salinity problem with depth. Only the shallow aquifer is portable. The stage of development in the district is 64.21% and all the talukas fall under safe category. 5.2 Water Conservation and Artificial Recharge
The suitable recharge structures feasible in the district are Percolation tanks/ponds; check dams, nalla bunds and gully plugs etc depending on the terrain conditions.
Deccan traps, the main aquifer of the district has low to moderate permeability.
The moderate permeability allows sufficient infiltration into the groundwater reservoir and at the same time allows retention of the water to be stored. Various rainwater harvesting schemes depending on the suitable hydrogeological conditions have been constructed in the district viz. Check dams, nalla plugs, deepening of the village ponds etc have shown good impact on the groundwater scenario.
6.0 Ground Water Related Issues and Problems
1. Salinity in ground water both inherent and coastal salinity. 2. Declining Ground water level. 3. High concentration of fluoride in ground water. 4. Ground water contamination due to improper/unscientific well construction. 5. Coastal salinity due to sea water ingress as a result of heavy pumping in coastal
areas. 6. Uniformity in pumping pattern is required. 7. People need to be aware of the aquifer system existing in the area. 8. Demand vis-a vis supply management.
Awareness among local people regarding water conservation measures required. 7.0 Awareness and Training Activity
One Water management-training programme and one Mass Awareness Programme have been organised in Jamnagar district by CGWB.

12
8.0 Areas Notified by CGWA/SGWA
NIL
9.0 Recommendations
o There is an urgent need for management of resources for sustainable development.
o Deeper aquifers should be protected and reserved for drinking water supply needs only.
o Creating awareness among the farmers regarding water conservation
through judicious use of water and adoption of efficient irrigation techniques like drip/sprinkler irrigation.
o The land holding of the group of farmers under public tube well irrigation
should be brought under the provision of the change in crops, irrigation practices and installation of drip/sprinkler irrigation technique.
o Planned pumping pattern can be deployed in hard rock regions so that
further discharge/withdrawal can be carried out during lean period this drawdown/withdrawal created will be recharged in the subsequent rainfall.
o Awareness of people on aquifer system existing in the area.
o Planned pumping pattern in coastal region. Deterioration of groundwater
quality due to seawater inundation/sea water ingress can be checked by construction of tidal regulators with gates.
o Resorting to artificial recharge practices by diverting surplus run-off
during monsoon into ponds, percolation tanks,. Spreading basins, abandoned dug wells etc.
o Taking up artificial recharge on large scale through appropriate
techniques on a regional scale with active community participation.

13
Fig1: Administrative Map of Jamnagar District

14
Fig 2: Map showing Depth to water level Pre-Monsoon-2012

15
Fig 3: Map showing Depth to water level Post-Monsoon-2012
16
Fig 4: Map showing water level fluctuation May-Nov-2012

17
Fig 5: Map showing Categorisation of Talukas as per GWRE 2011

18
Fig 6: Map showing Ground Water Potential and Artificial Recharge Prospects in
Jamnagar District