complementary crystallography and x-ray powder diffraction ... · complementary crystallography and...
TRANSCRIPT
Complementary Crystallography and X-ray Powder Diffraction Methods
Greg Stephenson Research AdvisorEli Lilly and CompanyPreformulations
This document was presented at PPXRD -Pharmaceutical Powder X-ray Diffraction Symposium
Sponsored by The International Centre for Diffraction Data
This presentation is provided by the International Centre for Diffraction Data in cooperation with the authors and presenters of the PPXRD symposia for the express purpose of educating the scientific community.
All copyrights for the presentation are retained by the original authors.
The ICDD has received permission from the authors to post this material on our website and make the material available for viewing. Usage is restricted for the purposes of education and scientific research.
ICDD Website - www.icdd.comPPXRD Website – www.icdd.com/ppxrd

Solid-State Pharmaceutics
Identify a phase that is suitable for a product
“Safe and Efficacious”
Bioavailable – sufficiently soluble to achieve efficacy
Physically and Chemically Stable no-phase transitions and less than 2% decomposition when stored for 2 years with 5 to 10 other excipients and exposed to 20-75%RH
Crystalline, Soluble, Non-solvated, filters well, non-hygroscopic, is flowable…..is that all?......um…with just 2g of
material in less than 30 days?
6/6/2011Stephenson, GA
Company ConfidentialCopyright © 2000 Eli Lilly and Company
2

6/6/2011Stephenson, GA
Company ConfidentialCopyright © 2000 Eli Lilly and Company
3
Non-discrete phases (continuous)
In that quest – we find many phases that are not discrete
Iso-structural Solvates: drug packs in the same arrangement in the crystal lattice with many different solvents
(or Iso-structural desolvates or “variable hydrates”)
Less commonly Iso-structural Salts
and Solid-Solutions
Also talk about:
Discuss a couple of Discrete Phases, one quite interesting
End with a Structure solution from Powder Diffraction
6/6/2011Stephenson, GA
Company ConfidentialCopyright © 2000 Eli Lilly and Company
4
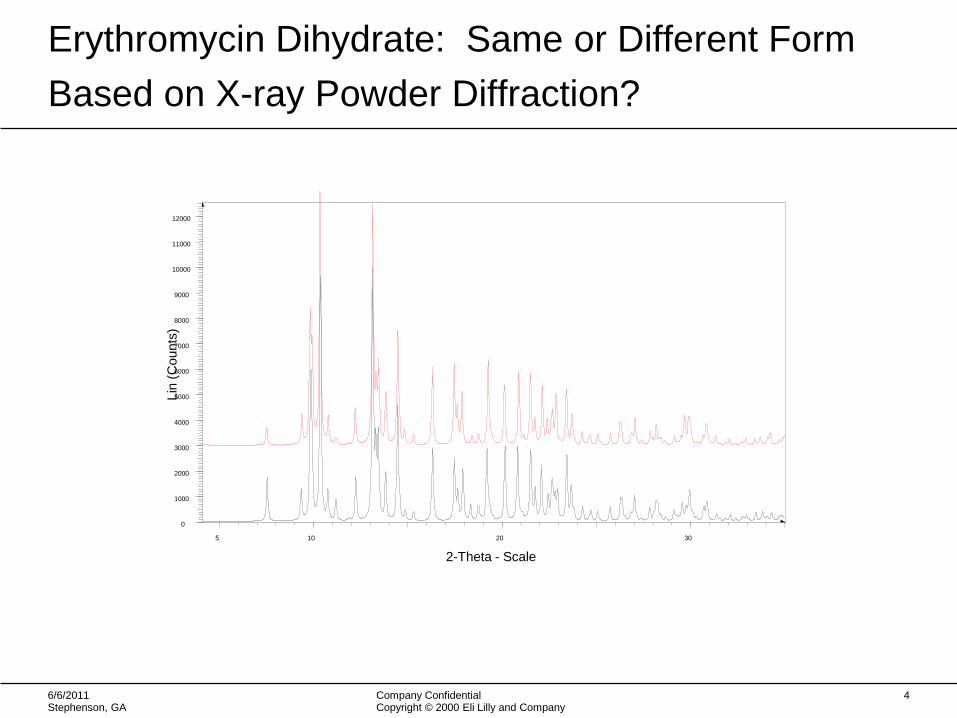
Erythromycin Dihydrate: Same or Different Form
Based on X-ray Powder Diffraction?
AAA
Lin
(C
ounts
)
0
1000
2000
3000
4000
5000
6000
7000
8000
9000
10000
11000
12000
2-Theta - Scale
5 10 20 30

6/6/2011Stephenson, GA
Company ConfidentialCopyright © 2000 Eli Lilly and Company
5
Molecular Structures of Erythromycin A and Erythromycin B
Erythromycin B lacks hydroxyl
group
6/6/2011Stephenson, GA
Company ConfidentialCopyright © 2000 Eli Lilly and Company
6
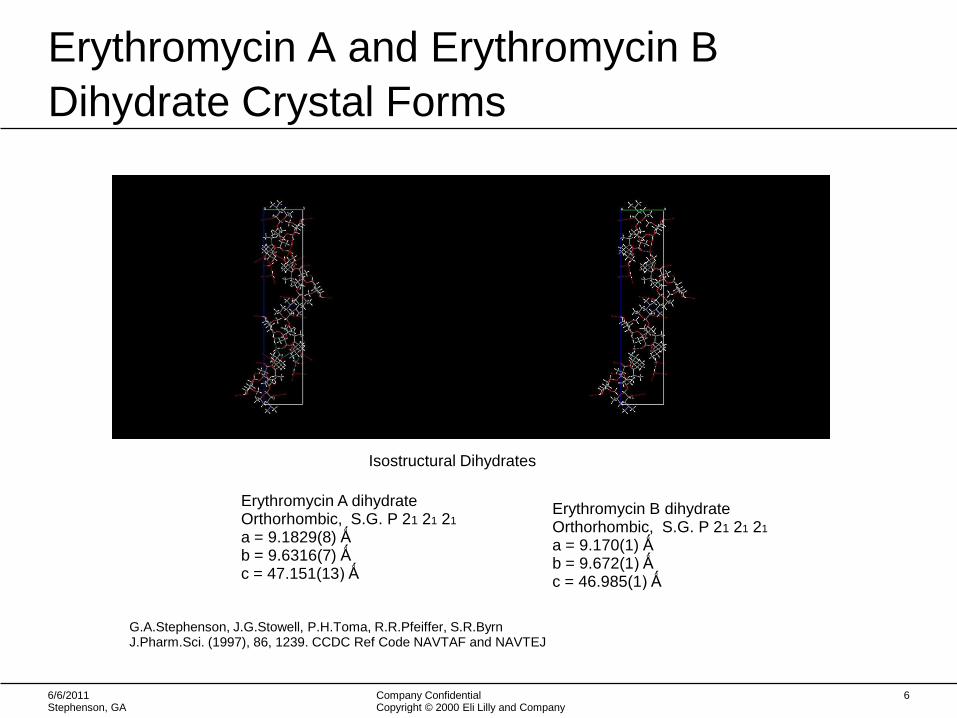
Erythromycin A and Erythromycin B
Dihydrate Crystal Forms
Erythromycin A dihydrateOrthorhombic, S.G. P 21 21 21
a = 9.1829(8) Ǻb = 9.6316(7) Ǻc = 47.151(13) Ǻ
Erythromycin B dihydrateOrthorhombic, S.G. P 21 21 21
a = 9.170(1) Ǻb = 9.672(1) Ǻ c = 46.985(1) Ǻ
G.A.Stephenson, J.G.Stowell, P.H.Toma, R.R.Pfeiffer, S.R.ByrnJ.Pharm.Sci. (1997), 86, 1239. CCDC Ref Code NAVTAF and NAVTEJ
Isostructural Dihydrates
6/6/2011Stephenson, GA
Company ConfidentialCopyright © 2000 Eli Lilly and Company
7
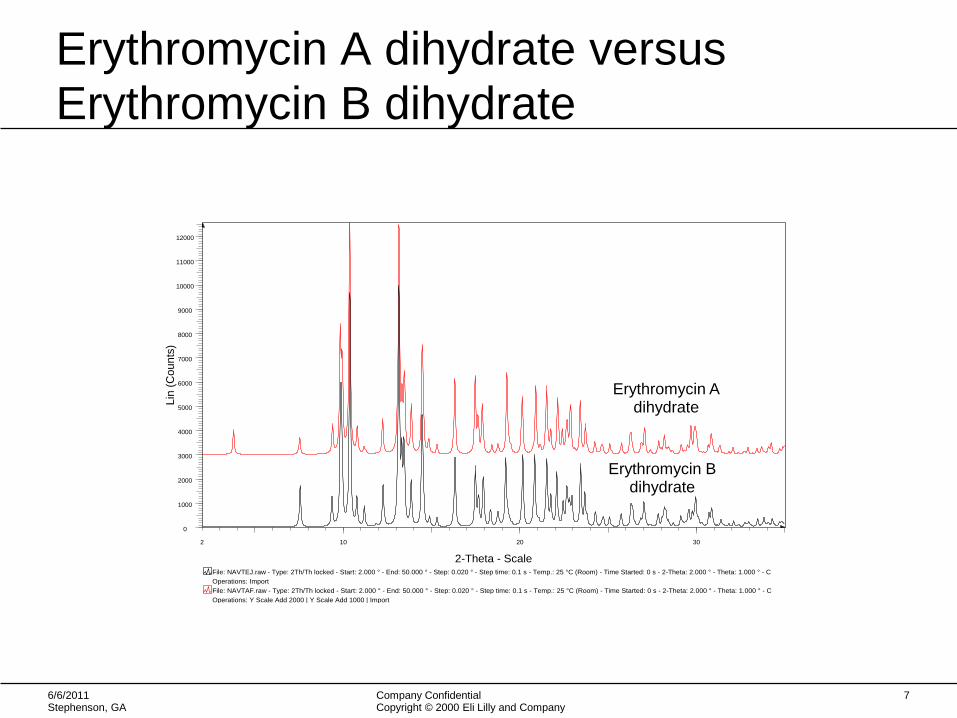
Erythromycin A dihydrate versus Erythromycin B dihydrate
Operations: Y Scale Add 2000 | Y Scale Add 1000 | Import
File: NAVTAF.raw - Type: 2Th/Th locked - Start: 2.000 ° - End: 50.000 ° - Step: 0.020 ° - Step time: 0.1 s - Temp.: 25 °C (Room) - Time Started: 0 s - 2-Theta: 2.000 ° - Theta: 1.000 ° - C
Operations: Import
File: NAVTEJ.raw - Type: 2Th/Th locked - Start: 2.000 ° - End: 50.000 ° - Step: 0.020 ° - Step time: 0.1 s - Temp.: 25 °C (Room) - Time Started: 0 s - 2-Theta: 2.000 ° - Theta: 1.000 ° - C
Lin
(C
ou
nts
)
0
1000
2000
3000
4000
5000
6000
7000
8000
9000
10000
11000
12000
2-Theta - Scale
2 10 20 30
Erythromycin Adihydrate
Erythromycin Bdihydrate

6/6/2011Stephenson, GA
Company ConfidentialCopyright © 2000 Eli Lilly and Company
8
Different
Unit cell metrics nearly identical
Unit cell contents nearly identical
Molecular Packing nearly identical

6/6/2011Stephenson, GA
Company ConfidentialCopyright © 2000 Eli Lilly and Company
9
Much information in a Thermal Ellipsoid diagram
Something Wrong with Hydroxyl group during
refinement

Refine Hydroxyl Group Site Occupancy
6/6/2011Stephenson, GA
Company ConfidentialCopyright © 2000 Eli Lilly and Company
10
38% Erythromycin A, 62% Erythromycin B Well Behaved Structure (Thermal ellipsoid plot)
All atoms have similar thermal parameters other than where expected
This is actually a solid solution formed upon crystallization of the two molecule’s

6/6/2011Stephenson, GA
Company ConfidentialCopyright © 2000 Eli Lilly and Company
11
Solid-Solution Formation, Reasonably Common
with Related Substances or Natural Products
Solid-Solutions are reasonably common, however are often overlooked
Commonly found in crystallization processes• That related substance that you just can’t seem to reject
Need to find conditions that result in phase separation • Screen for a solvent that results in different crystal forms for the two
different substances, those conditions should afford separation

Coefficient of Isomorphism1
Kitaigorodskii defines a coefficient of isosterism -compares molecular volumes common to two molecules that are arranged in such a fashion as to maximize the superposition of constituent groups
Є = 1- (Vno-overlap/Voverlap )
No Solid solution is likely to form when < 0.8, but is likely when > 0.92
Hence larger molecules and related substances1.Jacques, Collet , Wilen in Enantiomers, Racemates, and Resolutions, Kreigers Publishing, 1991, p128
2. A.I. Kitaigorodskii, Organic Chemical Crystallography, Consultants Bureau, New York, 1968, p 453.
6/6/2011Stephenson, GA
Company ConfidentialCopyright © 2000 Eli Lilly and Company
12

6/6/2011Stephenson, GA
Company ConfidentialCopyright © 2000 Eli Lilly and Company
13
Crystallization of Racemic Compounds
Racemic Crystals
Mixture of Chiral Crystals of Opposite “Handedness”
Conglomerate Mixture
~10% of the Time~90% of the time
Solution of Two EnantiomersWallach’s Rule1
states that racemic crystals tend to be denser than their chiralcounterparts
Wallach, O. Liebigs Ann. Chem. 1895, 286, 90-143.
R
S
R
S
R
SR
SS
RR
R
R
R
R
R
R
R
S
RS
SS
S
S
S
6/6/2011Stephenson, GA
Company ConfidentialCopyright © 2000 Eli Lilly and Company
14
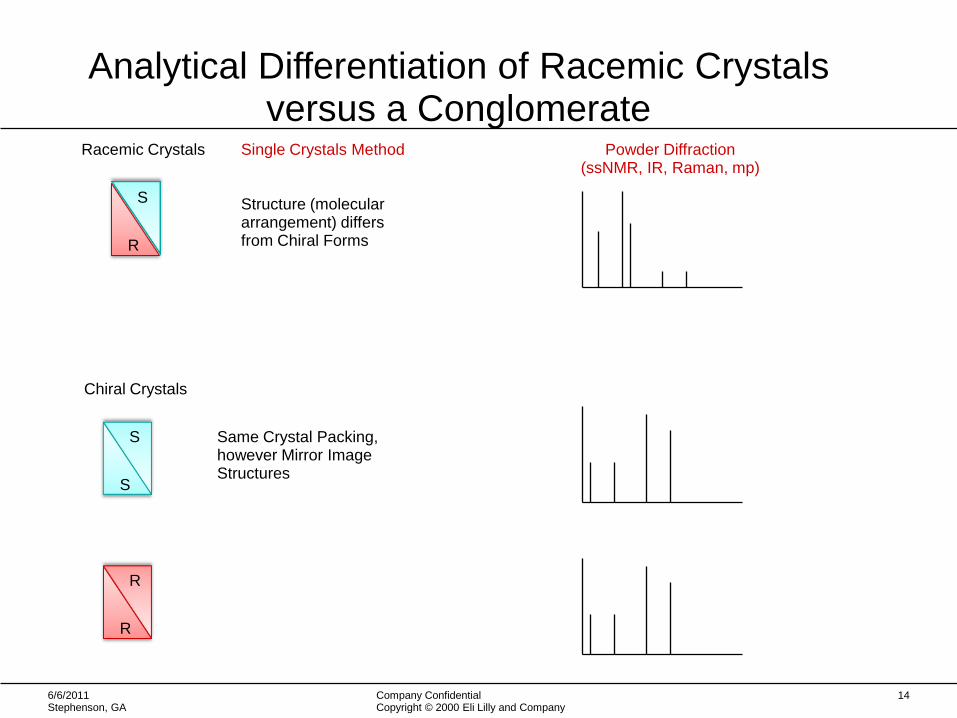
Analytical Differentiation of Racemic Crystals versus a Conglomerate
Racemic Crystals
Chiral Crystals
Single Crystals Method
Structure (molecular arrangement) differs from Chiral Forms
Same Crystal Packing,however Mirror ImageStructures
Powder Diffraction (ssNMR, IR, Raman, mp)
S
S
R
S
R
R

Racemic Ibuprofen and its S Enantiomer
6/6/2011Stephenson, GA
Company ConfidentialCopyright © 2000 Eli Lilly and Company
15
CCDC Structure JEKNOC10 A.A.Freer, J.M.Bunyan, N.Shankland, D.B.Sheen Acta Crystallogr.,Sect.C:Cryst.Struct.Commun. (1993), 49, 1378
CCDC Structure COTYOA01K.H.Stone, S.Lapidus, P.W.StephensJ.Appl.Crystallogr. (2009), 42, 385
Monoclinic Space Group P21/ca = 14.67 Ǻ b = 7.89 Ǻ c = 10.73 Ǻ
Beta = 99.43°
Monoclinic Space Group P21
a = 12.46 Ǻ b = 8.08 Ǻ c = 13.54 ǺBeta = 112.89°
R
R
S
S
S
S
S
S

Racemic Crystal Versus Enantiomer
6/6/2011Stephenson, GA
Company ConfidentialCopyright © 2000 Eli Lilly and Company
16
Lin
(C
ou
nts
)
0
1000
2000
3000
4000
5000
6000
7000
8000
9000
10000
11000
12000
13000
2-Theta - Scale
4 10 20 30 40
Racemic Ibuprofen
S-Ibuprofen

Phase Diagram of Solid Solution
6/6/2011Stephenson, GA
Company ConfidentialCopyright © 2000 Eli Lilly and Company
17
2. Jacques, Collet , Wilen in Enantiomers, Racemates, and Resolutions, Kreigers Publishing, 1991
6/6/2011Stephenson, GA
Company ConfidentialCopyright © 2000 Eli Lilly and Company
18
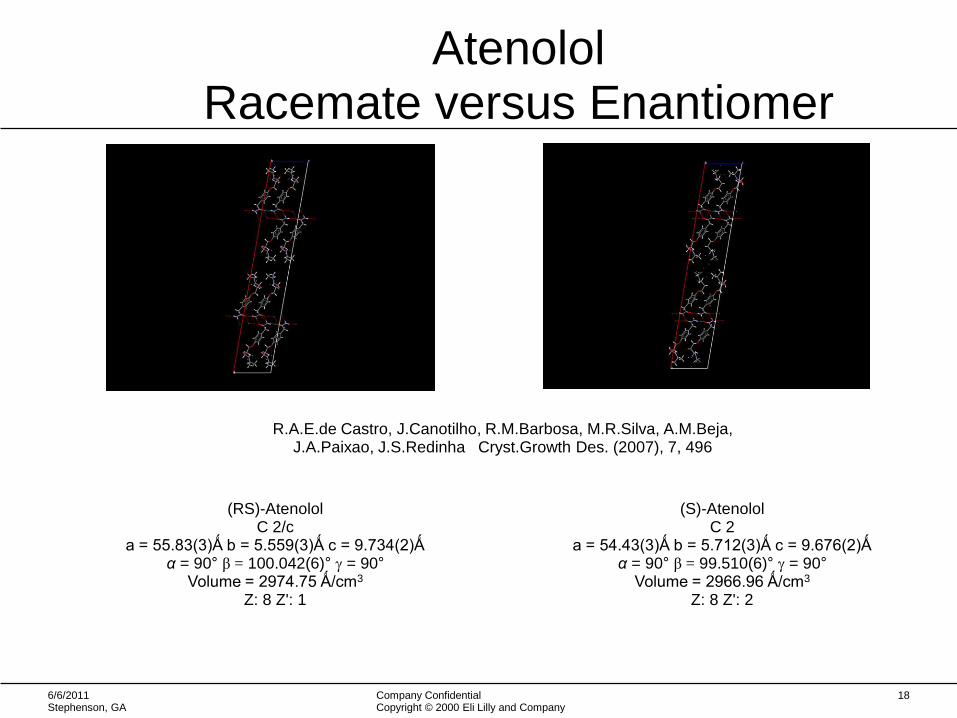
AtenololRacemate versus Enantiomer
R.A.E.de Castro, J.Canotilho, R.M.Barbosa, M.R.Silva, A.M.Beja, J.A.Paixao, J.S.Redinha Cryst.Growth Des. (2007), 7, 496
(RS)-AtenololC 2/c
a = 55.83(3)Ǻ b = 5.559(3)Ǻ c = 9.734(2)Ǻα = 90° β = 100.042(6)° = 90°
Volume = 2974.75 Ǻ/cm3
Z: 8 Z': 1
(S)-AtenololC 2
a = 54.43(3)Ǻ b = 5.712(3)Ǻ c = 9.676(2)Ǻα = 90° β = 99.510(6)° = 90°
Volume = 2966.96 Ǻ/cm3
Z: 8 Z': 2

6/6/2011Stephenson, GA
Company ConfidentialCopyright © 2000 Eli Lilly and Company
19
(RS)-AtenololC 2/c
a = 55.83(3)Ǻ b = 5.559(3)Ǻ c = 9.734(2)Ǻα = 90° β = 100.042(6)° = 90°
Volume = 2974.75 Ǻ/cm3
Z: 8 Z': 1
(S)-AtenololC 2
a = 54.43(3)Ǻ b = 5.712(3)Ǻ c = 9.676(2)Ǻα = 90° β = 99.510(6)° = 90°
Volume = 2966.96 Ǻ/cm3
Z: 8 Z': 2
Chiral Structure Disordered “Pseudo-Symmetry”

Phase Diagram of Solid Solution
6/6/2011Stephenson, GA
Company ConfidentialCopyright © 2000 Eli Lilly and Company
20
Atenolol Solid-Solution
2.Jacques, Collet , Wilen in Enantiomers, Racemates, and Resolutions, Kreigers Publishing, 1991, p128

6/6/2011Stephenson, GA
Company ConfidentialCopyright © 2000 Eli Lilly and Company
21
Racemic or Conglomerate?
2-Theta - Scale
5 10 20
Form II (126.7 conv to Form III)
Racemic Material (Chiral LC 50%R/50%S)
ChiralPurity > 98%

6/6/2011Stephenson, GA
Company ConfidentialCopyright © 2000 Eli Lilly and Company
22
Chiral vs Racemic Crystals: Unit Cells
Racemate: Monoclinic P21/c a = 4.94 Ǻ, b = 18.14 Ǻ, c = 15.61 Ǻ
β = 92.951°Volume = 1395.90 Ǻ 3, Z = 4, Z’= 1, density = 1.336 g/cc
Enthalpy of Fusion 102.19 J/g, Tm 136.09°C
Enantiomer: Orthorhombic P212121
a = 4.97 Ǻ, b = 15.50 Ǻ, c = 17.96 Ǻ
Volume = 1383.64 Ǻ 3, Z=4, Z’ =1, density = 1.348 g/ccEnthalpy of Fusion 99.43 J/g, Tm 127.16°C
S
S
S
S
S
S
R
R
6/6/2011Stephenson, GA
Company ConfidentialCopyright © 2000 Eli Lilly and Company
23
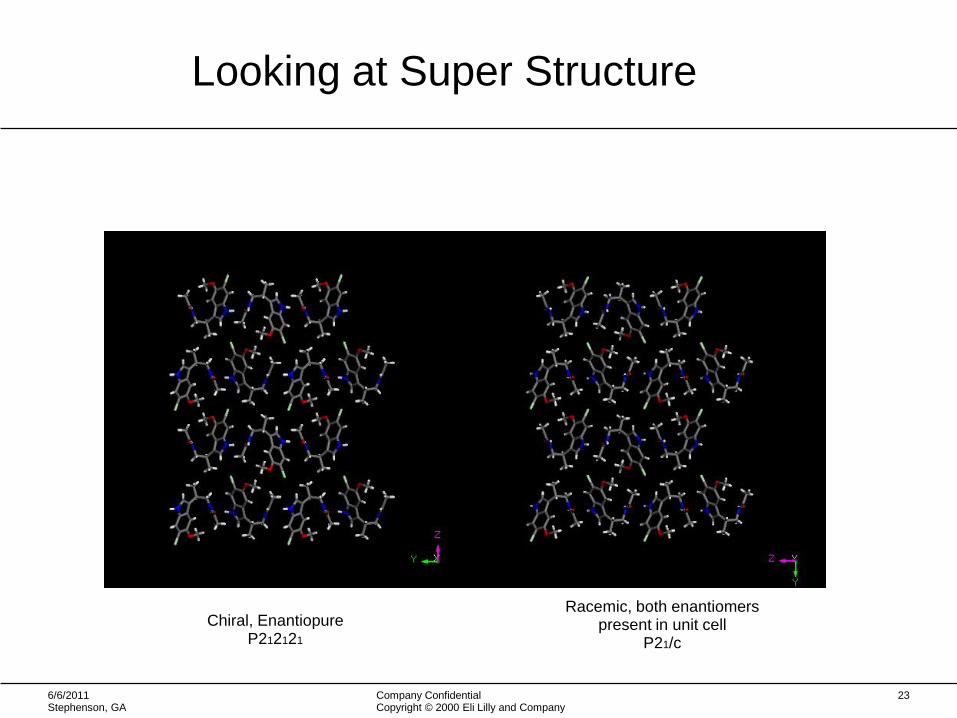
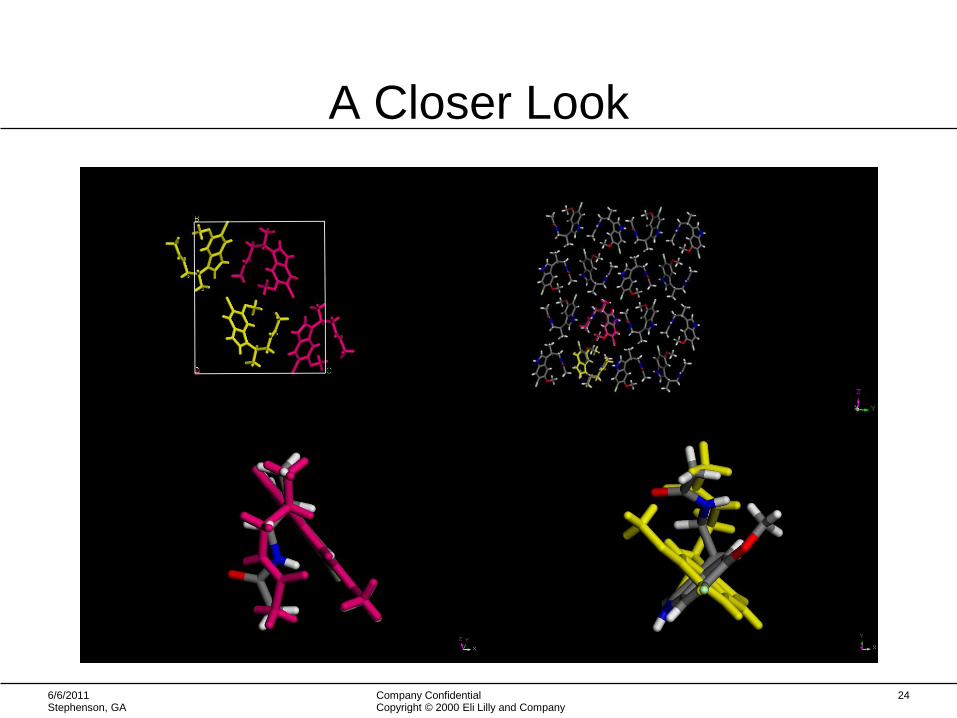
Looking at Super Structure
Chiral, EnantiopureP212121
Racemic, both enantiomers present in unit cell
P21/c
6/6/2011Stephenson, GA
Company ConfidentialCopyright © 2000 Eli Lilly and Company
24
A Closer Look

Phase Diagram for LY356735 and LY356736
Mole Fraction (LY356735/CPD356736)
0.0 0.1 0.2 0.3 0.4 0.5 0.6 0.7 0.8 0.9 1.0
Mel
ting T
emper
ature
(K
)
390
395
400
405
410
415
420
425
Calculated
ExperimentalCPD356736 Form IIliquidus curve
LY356735/CPD356736racemic liquidus curve
LY356735 Form Iliquidus curve
6/6/2011Stephenson, GA
Company ConfidentialCopyright © 2000 Eli Lilly and Company
25
Truly Racemic Crystal Not a Solid Solution Confirmed by Thermal Analysis

6/6/2011Stephenson, GA
Company ConfidentialCopyright © 2000 Eli Lilly and Company
26
Phase Diagram of EnantiomericMixtures
The phase diagram for a mixture of two enantiomers can be calculated using the Schroder Van-Laar equation to determine the liquidus curve for the
portion of the phase diagram which is at the extremes of chiral purity as expressed below:
Equation. 1 ln x = HfA / R (1/Tf
A-1/Tf)
where R = 1.9869 cal mol-1 K-1, where x is the mole fraction of the more abundant enantiomer (0.5<=x<=1) of a mixture whose melting terminates at
Tf (degrees K). HfA, and Tf
A .are the enthalpy of fusion and the melting point of the pure enantiomer. Usually these curves are symmetrical at the two
extremes. In the case of LY356735 versus LY356736, the enantiomerically pure regions are not the same, since the stable form of LY356736 is the
more stable crystalline form, whereas the form used for LY356735 is the metastable polymorphic form. The two polymorphs have different melting
points and enthalpies of fusion, hence the curves are not symmetrical.
The Prigogine and Defay equation can be used for calculating the liquidus curve for the racemic portion of the curve (from x=0.5 to where the mole
fraction defines the two eutectic points) as define below:
Eqn. 2 ln 4x (1-x) = 2 HfR / R (1/Tf
R-1/Tf)
The same variables are used, however the enthalpy of fusion, HfR, of the racemate and the temperature of melting of the racemic crystal, Tf
R, is used
throughout this region of the phase diagram.
Experimental data was collected at 10 percent intervals and was used to validate the calculations.