complements and meat demand in the u.s. - agecon...
TRANSCRIPT

Complements and Meat Demand in the U.S. Christopher Davis1, Stela Stefanova2, William Hahn3, and Steven Yen4
1Economist with the Markets and Trade Economics Division, Economic Research Service, U.S. Department of Agriculture. 1800 M Street, NW, Washington D.C. 20036. Phone:
(202) 694-5167. Email Address: [email protected] 2Graduate Assistant in the Department of Economics,
the University of Delaware, Newark, Delaware. Phone: (302) 831-6424. Email address: [email protected]
3Senior Economist with the Markets and Trade Economics Division, Economic Research Service, U.S. Department of Agriculture. 1800 M Street, NW, Washington D.C. 20036. Phone:
(202) 694-5175. Email Address: [email protected] 4Associate Professor in the Department of Agricultural Economics,
the University of Tennessee, Knoxville, Tennessee. Phone: (865) 974-7474. Email address: [email protected]
Selected Paper prepared for presentation at the American Agricultural Economics Association Annual Meeting, Orlando, Florida, July 27- 29, 2008.
1
Abstract
In this study we estimated the price elasticities among meats, vegetables, grains, and potatoes and the impact that different levels of income have on the demand for these commodities. The 2005 Nielsen retail home scan data were used to construct a censored demand system of 14 equations. Results revealed that the uncompensated cross-price elasticities for both low and high-incomes suggest both substitution and complement relationships, while the compensated price elasticities are dominated primarily by substitution relationships. Our findings also revealed that expenditure elasticities among both low and high-income households differ for most commodities1.
Key Words: censored dependent variables, meats, poultry, fish, vegetables, sample selection
model, two-step estimation.
JEL Classifications: C25, D12, Q11
1 Disclaimer: The opinions and analysis presented represent the authors’ idea and do not necessarily reflect Economic Research Service or the U.S. Department of Agriculture position.
Copyright 2008 by Christopher Davis, Stela Stefanova, William Hahn, and Steven Yen. All rights reserved. Readers may make verbatim copies of this document for non-commercial purposes by any means, provided that this copyright notice appears on all such copies.

2
2
Complements and Meat Demand in the U.S.
Introduction
For decades consumer food demand studies have provided insightful information on who eats
what, where, and how much (Yen, Lin and Davis, 2008; Davis and Lin, 2005a, 2005b; Lin et al.,
2003). Many studies have addressed the substitutability of meats like beef, pork, poultry, and
fish by types, by parts and/or cuts, as well as assessed complementary relationships among them
(Thompson, 2004; Kinnucan et al., 1997; Eales and Unnevehr, 1993; Capps and Lambregts,
1991; Moschini and Meilke, 1989; Cheng and Capps, 1988; Purcell and Raunikar, 1971).
Likewise, there have been several studies conducted that analyze fruit, vegetable, and grain
demands in the United States through the estimation of price elasticities and income or
expenditure elasticity (Just and Weninger, 1997). Separately these analyses have helped food
companies improve their supply-chain management and enhanced distributors’ marketing
strategies to increase the flow of goods.
Several recent studies have emphasized the substitution and complementarity relationships
between meats and other dishes (Thompson, 2004; Kinnucan et al., 1997; Park et al., 1996). For
most non-vegetarian households, the demands for vegetables, grains, and potatoes are contingent
upon the demands for beef, pork, poultry, or fish. Theoretically, complementary relationships
between meats, vegetables, grains, and potatoes are essential components that help identify a
consumer’s food consumption basket.

3
3
Park et al. (1996) examined 12 food commodity groups (food away from home, beef, pork,
chicken, fish, cheese, milk, fruits, vegetables, breakfast cereals, bread, and fats and oils) to
determine whether commodity demand projections are based on individual income strata rather
than on average estimates of price and income elasticities. Results from a 1987-88 Nationwide
Food Consumption Survey reveal that own-price elasticities are similar between income groups
for most commodities and income elasticities are consistently higher for the lower-income group.
Like Park et al. (1996), we analyzed the impact that different levels of income have on
commodity demand, but also estimated the price elasticities among meats, vegetables, grains,
and potatoes using the 2005 Nielsen retail home scan data. For this study special attention is
given to cross-price relationship, particularly complementarities among the commodity groups.
A censored demand system of 14 equations is employed to determine the price and
income/expenditure relationships that exist among a selected group of commodities.
Methodology We estimated a large censored demand system using a multivariate sample selection model
developed by Yen and Lin (2006), which was estimated with a two step procedure proposed by
Shonkwiler and Yen (1999). This approach accommodates zero purchases and simplifies the
computational burden, while still producing consistent estimates. We followed closely the
specification of Yen, Lin and Davis (2008).
We assumed that meat products and hypothesized complementary products are separable from
all other goods. In the first step of the procedure, censoring of each commodity is governed by
the following stochastic sample selection process.
4
4
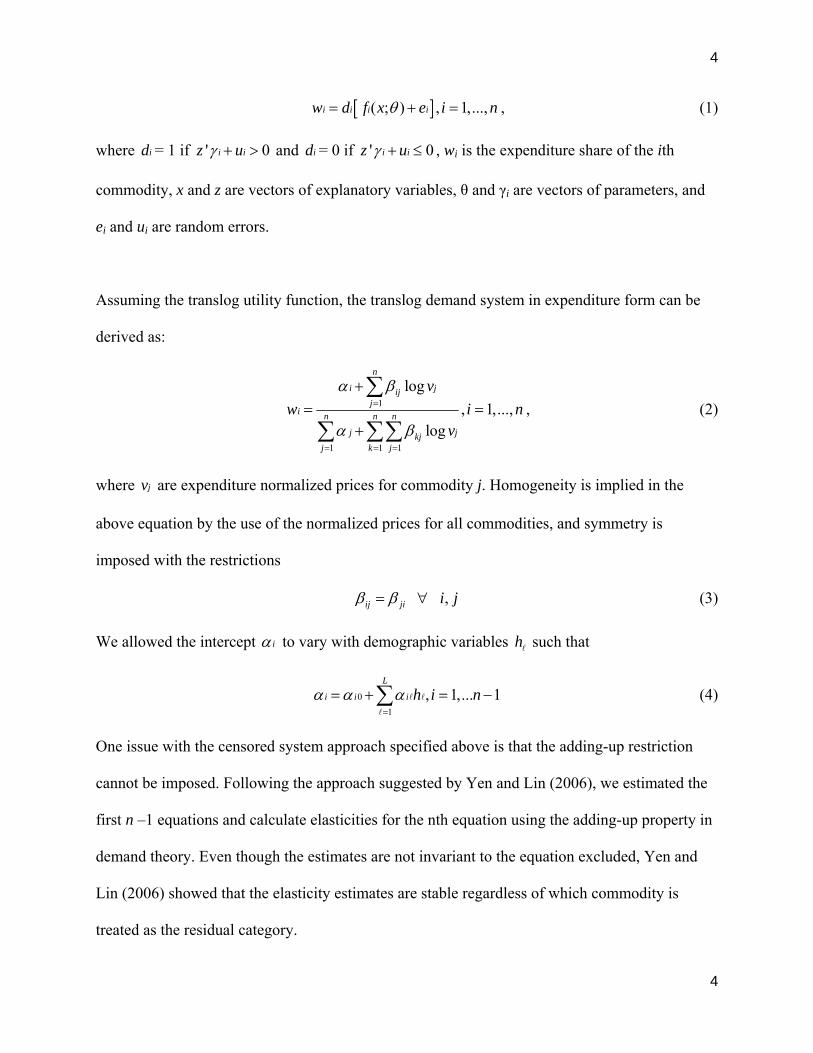
[ ]( ; ) , 1,...,i i i iw d f x e i nθ= + = , (1)
where id = 1 if ' 0i iz uγ + > and id = 0 if ' 0i iz uγ + ≤ , wi is the expenditure share of the ith
commodity, x and z are vectors of explanatory variables, θ and γi are vectors of parameters, and
ei and ui are random errors.
Assuming the translog utility function, the translog demand system in expenditure form can be
derived as:
1
1 1 1
log, 1,...,
log
n
i jijj
i n n n
j jkjj k j
vw i n
v
α β
α β
=
= = =
+= =
+
∑
∑ ∑∑, (2)
where jv are expenditure normalized prices for commodity j. Homogeneity is implied in the
above equation by the use of the normalized prices for all commodities, and symmetry is
imposed with the restrictions
,ij ji i jβ β= ∀ (3)
We allowed the intercept iα to vary with demographic variables hl such that
01
, 1,... 1L
i i i h i nα α α=
= + = −∑ l l
l
(4)
One issue with the censored system approach specified above is that the adding-up restriction
cannot be imposed. Following the approach suggested by Yen and Lin (2006), we estimated the
first n –1 equations and calculate elasticities for the nth equation using the adding-up property in
demand theory. Even though the estimates are not invariant to the equation excluded, Yen and
Lin (2006) showed that the elasticity estimates are stable regardless of which commodity is
treated as the residual category.

5
5
The system of demand equations in share form can be written as:
( ) ( ) ( ; ) ( )i i i i i i i i i iw E w z f x zξ γ θ δ φ γ ξ′ ′= + = Φ + + , (5)
where iδ is the covariance between the error terms ei and ui, ( )i iz γ′Φ and ( )i iz γ′Φ are the normal
cumulative distribution and probability density functions respectively, and ( )i ii w E wξ = − is a
heteroskedastic error term, with ( ) 0iE ξ = (Shonkwiler and Yen, 1999). The system can be
estimated using the two step procedure. First, we obtained maximum-likelihood (ML) estimates
for iγ based on binary probit for iw = 0 and iw > 0. Second, assuming that the disturbances
( ie , iu ) are distributed bivariate normal with cov( ie , iu ) = iδ , we estimated the demand
parameters θ and covariances iδ in the system
ˆ ˆ( ) ( ; ) ( )i ii i i i i iw z f x zγ θ δ φ γ ξ′ ′= Φ + + (6)
using iterated seemingly unrelated regressions. Demand elasticities for the n–1 goods can be
derived by differentiating Equation (6). Elasticities for the residual good are calculated using the
adding up restriction. To derive compensated demand elasticites, we used Slutsky’s equation.
Data
The ACNielsen 2005 Homescan data contain demographic and food purchases information for a
nationwide panel of representative households. Each household in the panel is given a hand-held
scanning device to scan at home all food items purchased at any retail outlet. Some households
record only UPC coded foods while others scan both UPC coded as well as random weight
items. In this study we used the smaller subset of 8,216 households that recorded both UPC-
coded and random weight products. These households reported 7,597,426 purchases in 2005:

6
6
4,001,639 dry grocery products; 1,379,832 random weight items; 900,100 dairy products and
1,315,855 produce, meat and frozen food. Each purchase record contains data on product
characteristics, quantity purchased, price paid with and without promotions, date of purchase,
store and brand information and is matched to a household record. Information on size and
composition of household, income, origin, age, race, gender, education and occupation of
household members, as well as market location data is available for each household. Projection
factors (sample weights) are provided by ACNielsen to be used at the household level to provide
representative estimates for the U.S. population.
It is not feasible to simultaneously account for the joint consumption of all possible types of
food, so we further limited the dataset to only foods that people are more likely to consume
together with meat or fish. Using What We Eat in America (WWEIA)-NHANES data for years
1999-2000, 2001-2002, and 2003-2004, we compared the probabilities of consuming different
types of food conditional on consuming different types of meat and fish with the marginal
probabilities of consuming every food category. For our analysis, we aggregated these food
categories by the first two digits of the NHANES food codes. Table 1 provides the first two
digits of the food codes and the conditional and unconditional probabilities calculated from
2003-2004 data. The results are very similar for the other periods. We identified 9 food
categories - cheese, bread, rice, pasta products, tomato products, orange vegetables, potatoes,
salad and hamburger vegetables, and all other vegetables, that we expected to be complementary
to meat and fish.

7
7
The final dataset used in this study is compiled from ACNielsen Homescan data and includes all
purchase records of beef, pork, poultry, fish, cheese, bread, rice, pasta products, tomato products,
and vegetables made by consumers reporting random weight items. Prices are measured for all
products in dollars per pound after any coupons or promotion information is taken into account.
Meat products, mostly fresh meats, which could not be readily identified as specific meat types,
are assigned into groups using the descriptions of the UPC and designated codes for the random
weight items. Meat is categorized into five groups: beef, pork, poultry, fish, and processed meats.
The Processed meats include sausages, corn dogs, hotdogs, salami, mixed meats, lunch meats,
bratwursts, refrigerated bacon, sandwich steak, canned meat and deviled ham. Beef, pork,
poultry, and fish are broad categories including products in all forms -- fresh, canned and frozen
-- that could be identified in the respective categories.
Similar to Yen, Lin, and Davis (2008), we split the sample in low and high income groups using
a cutoff of 350% poverty income ratio (PIR). The PIR is calculated by dividing the mid-point of
the range of self reported income to the Federal poverty thresholds, i.e. it expresses income as a
percent of the Federal poverty thresholds for households of different size. The 350% cutoff is
used to generate similar number of observations in the two groups. The sample sizes of the low
income and the high income groups are 4,129 and 4,087 respectively.
We focused on 14 types of food products. To organize the food categories, we first identified the
product modules that fall within each category. We converted the quantities purchased to pounds
and prices to dollars. Purchased quantities and expenditures on each product category are
aggregated to the annual level for each household. The price for each product category is
8
8
calculated by dividing the expenditures by the purchase quantity, thereby representing unit
values. Missing prices for non-consuming households are assigned mean unit values calculated
by region.
Descriptive statistics for the 14 chosen food categories are provided in Table 2 and Table 3.
Almost all of the sample households consume some type of bread. Cheese, processed meats and
vegetables are the next most popular food categories with over 95% of the households
consuming. This is followed by the potato category, which is consumed by 93% of the
households. Beef, fish, poultry, noodles and orange vegetables are consumed by about 90% of
the households. About 87% purchase pork and some type of a tomato product. Rice is purchased
by the least number of households – about 75%. The consumption patterns are not dramatically
different between the low and the high income households. However, quantities consumed are
somewhat different between the two income samples. Notable differences are that the high
income households consuming more fish, orange and salad vegetables and less beef, pork,
processed meats, bread and potatoes when compared to the low income households.
The prices paid by the high income households are higher than those paid by the low income
households for all product categories. Among the 14 food products, fish and cheese are the most
expensive and tomato products the least expensive per pound. Poultry meat is the least expensive
meat product.
Table 4 presents descriptive statistics for certain demographic variables. Following Yen, Lin, and
Davis (2008), household size, dummy variables for age groups, race and regional dummies,

9
9
presence of children, and dummy variables for marital status correspond to a set of explanatory
variables used in the second stage regressions. All these demographic variables plus female head
of household employment, male head of household employment, dummy variables for levels of
education, and the poverty income ratio are included in the first step probit regressions. The
average household size for the low income sample is 2.50 and is 2.22 for the high income
sample. More than 50% of the households in both income categories are headed by individuals
between 40 and 60 years of age. Geographic characteristics of the respondents are represented by
regional variables. The low and high income distributions are similar with slightly more low
income households located in the central and south regions of the U.S. The racial and ethnic
characteristics are also similar across income groups with 77% White, 14% Black, 2% Asian, 9%
Hispanic, and 7% other race for the low income sample. The low income sample includes higher
percent ages of male and female head of household employed – 60% and 56% respectively,
compared to the high income group - 40% and 38%. Individuals in the high income group are
more educated with 55% of the sample having college education and above, compared with only
27% of the low income sample in the same category.
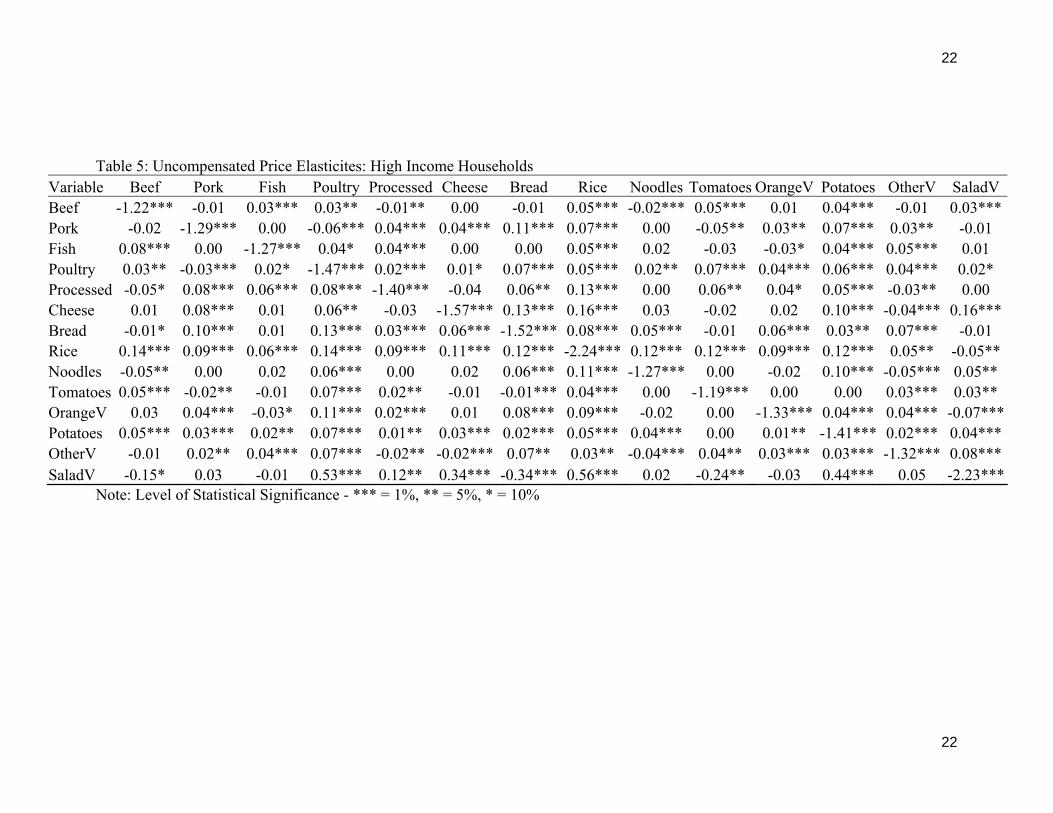
Demand Elasticities High-Income Households
Results of the uncompensated price and expenditure elasticities for high-income households are
found in table 5. All uncompensated own-price elasticities are negative and statistically
significant at the 1 percent level. Own-price elasticities for meat products ranged from –1.22 for
beef to –1.47 for poultry, while own-price elasticities for side dishes ranged from –1.19 for
tomatoes to –2.23 for salad vegetables.

10
10
Seventy-three percent (133 out of 182) of the uncompensated cross-price elasticities are
significant at the 10 percent level or lower, which suggest a mixture of gross complements and
substitutes among the meat product categories. With an exception of processed meats and beef,
and poultry and pork relationships, all other meats (including poultry and fish) combinations are
gross substitutes for each other. In identifying meat products that serve as complements to side
dishes, our results reveal that beef & noodles are negatively related, which means a 1 percent
increase in the price of beef will result in a .05 percent decrease in the demand for noodles. Other
complementary relations include pork & tomatoes, pork & salads, fish & orange vegetables, and
processed meat & other vegetables.
The expenditure elasticities vary slightly, ranging from 0.92 for cheese, to 1.03 for pork, rice,
and potatoes (table 6). Expenditure elasticities for meats, particularly beef, pork, and poultry are
above unity, which are similar to the aggregate meat expenditure elaticities derived by Kesavan
et al. (1993). For side dishes such as rice, potatoes, and other vegetables, expenditure elasticities
also exceeded one which differs from Parks et al. (1996) findings for aggregated vegetables for
poverty and non-poverty status households. All expenditure elasticities are estimated with
relatively high precision (with small standard errors), relative to the cross-price elasticities.
Table 7 presents the compensated price elasticities for high-income households. Similar to their
Marshallian counterparts, all of the compensated own-price elasticities are significant, with the
appropriate signs put forward by economic theory. All compensated own-price elasticities are
greater than unity, ranging from –1.16 for beef to –1.37 for poultry, and from –1.13 for tomatoes

11
11
to –2.17 for rice. The own-price elasticity of pork (–1.20), beef (–1.16), fish (–1.23), and poultry
(–1.37) are all elastic and more price responsive than the Park et al. (1996) own-price elasticity
estimates for the same commodities for non-poverty status households. Contrary to
uncompensated elasticities, which suggest gross substitutes and complements among meat
products and side dishes, the compensated elaticities suggest predominantly gross substitutes,
minus a couple exceptions. A strong substitution relationship between beef and potatoes, pork
and rice, poultry and orange vegetables, and fish and salad vegetables indicates that vegetarian
diets can be easily exchanged for diets that include meat for some high-income households.
Low-Income Households
The uncompensated price and total expenditure elasticities for low-income households are
presented in table 8. All uncompensated own-price elasticities are significant at the 1 percent
level with negative signs similar to elasticities for the high-income households. Of the 14
commodities analyzed, all are greater than unity, ranging from –1.32 for fish to –1.74 for
processed meat, to –2.43 for rice. Unlike Park et al. (1996), our own-price elasticities for beef,
pork, fish, vegetables, and bread are elastic for low-income households or poverty households
but more responsive to changes in price.
Of the 184 possible cross-price elasticities, 121 (60%) are positive and statistically significant.
This is similar to Nayga and Caps’ (1994) study in which a majority of the cross-price
elasiticities had positive signs implying a substitution relationship. The total expenditure
elasticities for the 14 commodities are precisely estimated as in the low-income sample (table 9).
All expenditure elasticities are statistically significant at the 1 percent level with positive signs

12
12
implying a direct relationship between commodity consumption and increases in expenditures.
Commodities such as beef, pork, fish, poultry, rice, tomatoes orange vegetables, and potatoes are
all above unity, which differs from Park et al. (1996), indicating a greater level of sensitivity to
changes in consumers’ expenditures. In contrast, the expenditure elasticity for bread is
considerably less than unity and is similar to what Park et al. (1996) found for poverty
households. Along with bread, there are other commodities (processed meats, cheese, noodles,
other vegetables and salad vegetables) with expenditure elasticities less than unity.
Table 10 presents the compensated price elasticities for low-income households. All
compensated own-price elaticities are significant, negative and greater than unity, ranging from
–1.28 for fish to –1.70 for processed meat, to –2.40 for rice. The large own-price elasticity for
rice implies that it is highly sensitive to changes in price. Like results from the high-income
household sample, the low-income household sample cross-price elasticities suggest s net
substitution relationships in most cases, 174 of which are significant and positive. The one
significant complementary relationship is among fish and salad vegetables, where a 1 percent
increase in the price of fish will only reduce the demand for salad vegetable marginally (.04
percent).
Conclusion and Recommendations
In this study we analyzed at-home consumption of different types for meat products and side
dishes such as rice, vegetables, bread, and cheese by estimating a 14 equation demand system
using a multivariate sample selection model. Nielsen household Homescan data highlighted zero
purchases of many commodities due to some disaggregate commodities and commodities that

13
13
were not purchased during specific time periods. We estimated this large censored demand
system using the Heckman two-step procedure. The two-step procedure produces statistically
consistent estimates although it is less efficient than the ML alternative of Yen and Lin (2006).
This study presented information on the demand for beef, pork, fish, poultry, vegetables, cheese,
bread, and rice separately for low-income and high-income households. Findings indicated
notable differences in the elasticity estimates between the two groups of households, particularly
with compensated and uncompensated price elasticities. Our chief objective for this study was
based on a perceived logic guiding consumers’ purchase behaviors. That logic is that non-
vegetarians seek to purchase a desired meat (beef, pork, fish, or poultry) first and then choose a
side dish to accompany their choice of meat or vice versa. Results revealed that the
uncompensated cross-price elasticities for both low and high incomes suggest both substitution
and complement relationships, while the compensated price elasticities are dominated primarily
by substitution relationships. These findings are surprising and unexpected given hypothesized
logic consumers often use when planning meals or shopping for food for family members. This
perceived logic is rejected by the results found for compensated price elasticities, but not rejected
based on the results rendered from the uncompensated price elasticities.
Elasticities derived from a massive database like the Nielsen retail homescan data can prove to
be quite useful. Agricultural industries or food retailers may use information from studies such
as this to boost sales through advertisement of specific food combinations, especially among
frozen meals. Elasticities from this study can be used to determine the impact increased demand
for corn and soybeans used in other agricultural production will have on consumer demand for

14
14
specific meats primarily pork, poultry, and fish. We anticipate that as input or feed prices rise in
response to increasing demand for corn and/or soybeans for other agricultural production,
demand elasticities derived from this study for meats can serve as a useful tool in addressing
changes in consumer demand for food commodities and making policy recommendations.
15
15
References
Capps, O. Jr. and J.A. Lambregts. “Assessing Effects of Prices and Advertising on Purchases of Finfish and Shellfish in a Local Market in Texas.” Southern Journal of Agricultural Economics. 23(1) (July 1991): 181-194.
Cheng, H. and O. Capps, Jr. “Demand Analysis of Fresh and Frozen Finfish and Shellfish
in the United States.” American Journal of Agricultural Economics. 70(3) (August 1988): 533-542.
Davis, C.G., Lin, B., 2005a. Factors affecting U.S. beef consumption. Washington DC: US
Department of Agriculture, Economic Research Service, Electronic Outlook Report from the Economic Research Service, LDP-M-135-02, October.
Davis, C.G., Lin, B., 2005b. Factors affecting U.S. pork consumption. Washington DC: US
Department of Agriculture, Economic Research Service, Electronic Outlook Report from the Economic Research Service, LDP-M-130-01, May.
Eales, J.S. and L.J. Unnevehr. “Simultaneity and Structural Change in U.S. Meat
Demand.” American Journal of Agricultural Economics. 75(2) (May 1993): 259 -268.
Just, R.E, and W. Weninger. “Economic evaluation of the farmers' market nutrition
program.” American Journal of Agricultural Economics. 79, no. 3 (Aug 1997): p. 902-917.
Kesavan, T., Z. A. Hassan, H. H. Jensen, and S.R. Johnson. 1993. “Dynamics and Long-run Structure in U.S. Meat Demand.” Canadian Journal of Agricultural Economics 41(2): 139–153.
Kinnucan, H.W., H. Xiao, C. Hsia, and J.D. Jackson. “Effects of Health Information and
Generic Advertising on U.S. Meat Demand.” American Journal of Agricultural Economics. 79(1) (February 1997): 13-23.
Lin B.H., Variyam, J., Allshouse, J., Cromartie, J., 2003. Food and Agricultural Commodity Consumption in the United States: Looking ahead to 2020. Washington DC: US Department of Agriculture, Agricultural Economic Report No. 820, February. Available at: http://www.ers.usda.gov/publications/aer820/ aer820.pdf. Accessed 21 October 2005.
Moschini, G. and K. D. Meilke. “Modeling the Pattern of Structural Change in U.S. Meat
Demand.” American Journal of Agricultural Economics. 71(2) (May 1989): 253-261. Nayga, R.M, and O. Capps, Jr. 1994. “Tests of Weak Separability in Disaggregated Meat
Products.” American Journal of Agricultural Economics 76(4):800–08.

16
16
Park, J.L., R.B. Holcomb, K.C. Raper, and O.Capps, Jr. 1996. “A Demand Systems Analysis of
Food Commodities by U.S. Households Segmented by Income.” American Journal of Agricultural Economics 78(2): 290–300.
Purcell, C.P. and R. Raunikar. “Price Elasticities from Panel Data: Meat, Poultry, and
Fish.” American Journal of Agricultural Economics. 53(2) (May 1971): 216- 221.
Shonkwiler , J.S. and S. T. Yen. 1999. “Two-Step Estimation of a Censored System of
Equations.” American Journal of Agricultural Economics 81(4): 972-982. Thompson, W. 2004. “Using Elasticities From An Almost Ideal Demand System? Watch Out
For Group Expenditure.” American Journal of Agricultural Economics 86(4): 1108–1116.
Yen, S.T., B. Lin, and C. Davis. “Consumer Knowledge and Meat Consumption at Home and Away From Home.” Food Policy. In press 2008.
Yen, S.T., and B. Lin. 2006. “A Sample Selection Approach to Censored Demand Systems.” American Journal of Agricultural Economics 88(3): 742-749.

17
17
Table1: Conditional vs. Unconditional Probabilities of Consumption Unconditional
Probability Conditional probability
Food Type 2-digit code P(Type)
P(Type/ Fish)
P(Type/ Beef)
P(Type/ Poultry)
P(Type/ Pork)
Cheese 14 3.19 10.74 39.91 11.70 15.22 Breads 51 5.86 24.91 52.89 23.71 35.08 Biscuits 52 1.80 10.17 20.98 14.50 14.77 Pasta products and rice 56 1.35 15.09 7.15 10.32 10.27 Potatoes 71 3.65 27.89 35.86 32.90 21.96 Raw green vegetables 72 0.59 12.00 4.99 7.73 6.00 Orange vegetables 73 0.70 7.89 6.94 8.47 5.47 Tomato products 74 4.13 49.83 66.93 37.61 28.34 Hamburger vegetables 75 6.38 75.66 95.27 58.49 51.87

18
18
Table2: Average Annual Household Purchases: Prices, Expenditures and Quantity by Income Low Income High Income Variable Mean Std.Dev. Mean Std.Dev.Prices Beef 3.06 1.09 3.69 1.47Pork 3.40 2.55 3.88 2.89Fish 3.81 1.95 4.74 2.33Poultry 2.05 0.93 2.32 1.06Processed Meat 3.57 1.35 4.27 1.64Cheese 3.92 1.18 4.56 1.50Bread 1.54 0.76 1.83 0.99Rice 1.92 0.95 2.12 1.07Noodles 1.23 0.80 1.43 0.83Tomato Products 0.79 0.32 0.88 0.61Orange 1.02 0.39 1.13 0.49Potatoes 1.06 0.71 1.20 0.78Other Vegetables 1.89 1.90 2.36 1.98Salad Vegetables 1.28 0.51 1.48 0.60Expenditures Beef 119.79 133.40 134.67 156.52Pork 68.74 76.53 70.56 77.67Fish 48.96 70.22 68.30 101.47Poultry 66.03 72.89 71.15 77.29Processed Meat 103.36 101.71 105.46 109.06Cheese 88.62 80.86 105.21 96.74Bread 90.79 70.37 94.34 75.31Rice 8.05 12.62 8.21 11.39Noodles 15.00 18.96 15.77 20.10Tomato Products 11.63 14.50 11.12 13.02Orange 13.85 17.02 16.69 22.46Potatoes 27.72 27.84 25.08 26.30Other Vegetables 59.79 52.79 73.71 67.05Salad Vegetables 50.64 53.50 63.26 65.35Quantities Beef 44.32 48.63 40.40 44.94Pork 30.56 38.40 27.29 33.82Fish 13.78 18.22 15.48 21.05Poultry 45.26 51.98 42.42 49.37Processed Meat 35.03 33.63 29.69 29.12Cheese 25.59 23.51 26.81 24.21Bread 83.20 92.47 74.99 76.18Rice 8.03 19.69 6.93 14.94Noodles 15.26 20.07 13.60 21.05Tomato Products 17.08 22.23 15.01 18.59

19
19
Orange 15.94 19.83 17.49 26.23Potatoes 49.91 51.89 37.83 40.51Other Vegetables 55.03 49.36 54.61 47.74Salad Vegetables 49.86 52.97 53.67 53.86

20
20
Table 3: Consuming Households
Food Type
Number Households Consuming
Total %
consuming Low Income % consuming
High Income %
Consuming Beef 7450 90.68 90.87 90.48 Pork 7164 87.2 87.82 86.44 Fish 7451 90.69 90.82 90.36 Poultry 7420 90.31 90.14 90.41 Processed Meat 7947 96.73 97.00 96.43 Cheese 8048 97.96 97.80 98.12 Bread 8145 99.14 99.25 99.00 Rice 6198 75.44 75.15 75.43 Noodles 7344 89.39 89.25 89.33 Tomato Products 7178 87.37 88.21 86.35 Orange Vegetables 7383 89.86 89.42 90.26 Potatoes 7679 93.46 94.14 92.76 Other Vegetables 8061 98.11 98.06 98.14 Salad Vegetables 7950 96.76 96.83 96.70

21
21
Table 4: Sample Statistics for Demographic Variables Variable Low High incomeHousehold Size 2.50 (1.50)* 2.22 (1.11)*Presence of children 0.29 0.18Age of household head < 40 0.15 0.15Age of household head 40-60 0.57 0.70Age of household head > 60 0.28 0.14Married 0.53 0.61Widowed 0.13 0.06Divorced 0.18 0.13Single 0.17 0.20East 0.22 0.23Central 0.18 0.15South 0.40 0.37West 0.20 0.25Education < high school 0.05 0.01High School 0.31 0.15Some College 0.36 0.29College and above 0.27 0.55White 0.77 0.76Black 0.14 0.13Asian 0.02 0.05Hispanic 0.09 0.07Other race 0.07 0.06Male head employed 0.60 0.40Female head employed 0.56 0.38Poverty income ratio 212 (81)* 623 (266)*Sample size 4129 4087* Standard errors in parentheses
22
22
Table 5: Uncompensated Price Elasticites: High Income Households Variable Beef Pork Fish Poultry Processed Cheese Bread Rice Noodles Tomatoes OrangeV Potatoes OtherV SaladV Beef -1.22*** -0.01 0.03*** 0.03** -0.01** 0.00 -0.01 0.05*** -0.02*** 0.05*** 0.01 0.04*** -0.01 0.03*** Pork -0.02 -1.29*** 0.00 -0.06*** 0.04*** 0.04*** 0.11*** 0.07*** 0.00 -0.05** 0.03** 0.07*** 0.03** -0.01 Fish 0.08*** 0.00 -1.27*** 0.04* 0.04*** 0.00 0.00 0.05*** 0.02 -0.03 -0.03* 0.04*** 0.05*** 0.01 Poultry 0.03** -0.03*** 0.02* -1.47*** 0.02*** 0.01* 0.07*** 0.05*** 0.02** 0.07*** 0.04*** 0.06*** 0.04*** 0.02* Processed -0.05* 0.08*** 0.06*** 0.08*** -1.40*** -0.04 0.06** 0.13*** 0.00 0.06** 0.04* 0.05*** -0.03** 0.00 Cheese 0.01 0.08*** 0.01 0.06** -0.03 -1.57*** 0.13*** 0.16*** 0.03 -0.02 0.02 0.10*** -0.04*** 0.16*** Bread -0.01* 0.10*** 0.01 0.13*** 0.03*** 0.06*** -1.52*** 0.08*** 0.05*** -0.01 0.06*** 0.03** 0.07*** -0.01 Rice 0.14*** 0.09*** 0.06*** 0.14*** 0.09*** 0.11*** 0.12*** -2.24*** 0.12*** 0.12*** 0.09*** 0.12*** 0.05** -0.05** Noodles -0.05** 0.00 0.02 0.06*** 0.00 0.02 0.06*** 0.11*** -1.27*** 0.00 -0.02 0.10*** -0.05*** 0.05** Tomatoes 0.05*** -0.02** -0.01 0.07*** 0.02** -0.01 -0.01*** 0.04*** 0.00 -1.19*** 0.00 0.00 0.03*** 0.03** OrangeV 0.03 0.04*** -0.03* 0.11*** 0.02*** 0.01 0.08*** 0.09*** -0.02 0.00 -1.33*** 0.04*** 0.04*** -0.07*** Potatoes 0.05*** 0.03*** 0.02** 0.07*** 0.01** 0.03*** 0.02*** 0.05*** 0.04*** 0.00 0.01** -1.41*** 0.02*** 0.04*** OtherV -0.01 0.02** 0.04*** 0.07*** -0.02** -0.02*** 0.07** 0.03** -0.04*** 0.04** 0.03*** 0.03*** -1.32*** 0.08*** SaladV -0.15* 0.03 -0.01 0.53*** 0.12** 0.34*** -0.34*** 0.56*** 0.02 -0.24** -0.03 0.44*** 0.05 -2.23***
Note: Level of Statistical Significance - *** = 1%, ** = 5%, * = 10%

23
23
Table 6: Total Meat Expenditure Elasticities: High Income Households
Variable Total
Expenditure Beef 1.02*** Pork 1.03*** Fish 0.98*** Poultry 1.02*** Processed 0.97*** Cheese 0.92*** Bread 0.93*** Rice 1.03*** Noodles 0.99*** Tomatoes 0.99*** OrangeV 0.99*** Potatoes 1.03*** OtherV 1.01*** SaladV 0.92*** Note: Level of Statistical Significance - *** = 1%, ** = 5%, * = 10%

24
24
Table 7: Compensated Price Elasticities: High Income Households Variable Beef Pork Fish Poultry Processed Cheese Bread Rice Noodles Tomatoes OrangeV Potatoes OtherV SaladV Beef -1.16*** 0.07*** 0.08*** 0.14*** 0.03*** 0.04*** 0.04*** 0.11*** 0.02*** 0.11*** 0.08*** 0.15*** 0.03*** 0.26*** Pork 0.04** -1.20*** 0.04*** 0.05** 0.09*** 0.08*** 0.16*** 0.13*** 0.05*** 0.01 0.10*** 0.18*** 0.07*** 0.21*** Fish 0.13*** 0.08*** -1.23*** 0.14*** 0.08*** 0.04*** 0.05** 0.11*** 0.07*** 0.02 0.04** 0.15*** 0.09*** 0.23*** Poultry 0.09*** 0.06*** 0.06*** -1.37*** 0.07*** 0.05*** 0.12*** 0.11*** 0.07*** 0.13*** 0.11*** 0.17*** 0.09*** 0.25*** Processed 0.01 0.16*** 0.10*** 0.18*** -1.35*** 0.00 0.10*** 0.18*** 0.04** 0.11*** 0.10*** 0.15*** 0.01 0.22*** Cheese 0.06** 0.16*** 0.05** 0.15*** 0.01* -1.54*** 0.17*** 0.21*** 0.08*** 0.02 0.08*** 0.20*** -0.01* 0.37*** Bread 0.04* 0.18*** 0.05*** 0.23*** 0.07*** 0.09*** -1.47*** 0.13*** 0.09*** 0.04 0.12*** 0.13*** 0.11*** 0.19*** Rice 0.20*** 0.17*** 0.11*** 0.24*** 0.14*** 0.15*** 0.17*** -2.17*** 0.17*** 0.17*** 0.16*** 0.23*** 0.09*** 0.18*** Noodles 0.00 0.08*** 0.06*** 0.15*** 0.04*** 0.05*** 0.11*** 0.16*** -1.22*** 0.05* 0.05*** 0.20*** -0.01 0.27*** Tomatoes 0.11*** 0.06*** 0.03*** 0.17*** 0.06*** 0.03*** 0.04*** 0.10*** 0.05*** -1.13*** 0.06*** 0.10*** 0.07*** 0.25*** OrangeV 0.09*** 0.12*** 0.01** 0.21*** 0.07*** 0.05*** 0.13*** 0.15*** 0.03 0.05** -1.26*** 0.14*** 0.08*** 0.15*** Potatoes 0.10*** 0.12*** 0.06*** 0.17*** 0.06*** 0.06*** 0.07*** 0.11*** 0.09*** 0.05*** 0.08*** -1.30*** 0.06*** 0.27*** OtherV 0.04*** 0.10*** 0.08*** 0.17*** 0.03*** 0.02** 0.12*** 0.09*** 0.01 0.09*** 0.09*** 0.14*** -1.27*** 0.30*** SaladV -0.10 0.11* 0.03 0.62*** 0.16*** 0.37*** -0.30*** 0.61*** 0.06 -0.19* 0.03 0.54*** 0.08 -2.03***
Note: Level of Statistical Significance - *** = 1%, ** = 5%, * = 10%

25
25
Table 8: Uncompensated Price Elasticites: Low Income Households
Variable Beef Pork Fish Poultry Processed Cheese Bread Rice Noodles Tomatoes OrangeV Potatoes OtherV SaladV Beef -1.56*** 0.04*** 0.06*** 0.10*** 0.00 0.02** 0.07*** 0.09*** 0.02* 0.03 0.03* 0.07*** -0.01 -0.01 Pork 0.04*** -1.53*** 0.00 0.01 0.04*** 0.01 0.02 0.08*** 0.02* -0.01 0.05*** 0.12*** 0.04*** 0.04*** Fish 0.11*** 0.01 -1.32*** 0.02 0.09*** 0.00 0.07*** 0.04** -0.01 0.00 -0.03* 0.07*** 0.05*** -0.10*** Poultry 0.06*** 0.01 0.00 -1.61*** 0.05*** 0.02*** 0.05*** 0.09*** 0.02** 0.06*** 0.04*** 0.07*** 0.03*** 0.05*** Processed 0.00 0.09*** 0.10*** 0.15*** -1.74*** -0.04* 0.04** 0.08*** 0.00 0.07*** 0.08*** 0.13*** 0.05*** 0.03 Cheese 0.08*** 0.05*** 0.02 0.11*** -0.04 -1.53*** -0.02 0.08*** 0.03 0.12*** 0.07*** 0.09*** 0.02 0.11*** Bread 0.11*** 0.05*** 0.06*** 0.14*** 0.04*** -0.01 -1.48*** 0.05*** 0.02 0.11*** 0.11*** 0.07*** 0.05*** -0.02 Rice 0.10*** 0.08*** 0.01 0.15*** 0.04*** 0.03*** 0.03 -2.43*** 0.06*** 0.12*** 0.02 0.17*** 0.02 0.28*** Noodles 0.05** 0.05** -0.01 0.07*** 0.00 0.02 0.02 0.09*** -1.40*** 0.01 0.06*** 0.10*** 0.01 0.04** Tomatoes 0.03 -0.01 0.00 0.09*** 0.04** 0.05*** 0.08*** 0.11*** 0.00 -1.58*** 0.02 0.10*** 0.00 0.02 OrangeV 0.04** 0.06*** -0.03** 0.08*** 0.05*** 0.03** 0.09*** 0.03** 0.04** 0.03 -1.58*** 0.08*** 0.03** 0.01 Potatoes 0.04*** 0.08*** 0.02*** 0.07*** 0.04*** 0.02*** 0.01 0.10*** 0.03*** 0.06*** 0.04*** -1.56*** 0.02*** -0.01 OtherV -0.01 0.06*** 0.04*** 0.08*** 0.04*** 0.01 0.04** 0.04*** 0.00 0.01 0.04*** 0.07*** -1.39*** 0.01 SaladV 0.02 0.05*** -0.09*** 0.13*** 0.07*** 0.10*** 0.00 0.07*** 0.04*** 0.03 0.01 0.10*** 0.05*** -1.47***
Note: Level of Statistical Significance - *** = 1%, ** = 5%, * = 10%

26
26
Table 9: Total Meat Expenditure Elasticities: Low Income Households
Variable Total
Expenditure Beef 1.04*** Pork 1.06*** Fish 1.00*** Poultry 1.07*** Processed 0.96*** Cheese 0.81*** Bread 0.69*** Rice 1.32*** Noodles 0.90*** Tomatoes 1.07*** OrangeV 1.03*** Potatoes 1.05*** OtherV 0.96*** SaladV 0.88*** Note: Level of Statistical Significance - *** = 1%, ** = 5%, * = 10%

27
27
Table 10: Compensated Price Elasticities: Low Income Households
Variable Beef Pork Fish Poultry Processed Cheese Bread Rice Noodles Tomatoes OrangeV Potatoes OtherV SaladV Beef -1.47*** 0.12*** 0.11*** 0.23*** 0.04*** 0.07*** 0.14*** 0.12*** 0.07*** 0.10*** 0.10*** 0.21*** 0.05*** 0.11*** Pork 0.13*** -1.45*** 0.05*** 0.14*** 0.09*** 0.06*** 0.10*** 0.10*** 0.07*** 0.06*** 0.12*** 0.27*** 0.10*** 0.15*** Fish 0.20*** 0.09*** -1.28*** 0.14*** 0.14*** 0.04*** 0.14*** 0.06*** 0.03* 0.07*** 0.03 0.21*** 0.11*** 0.01 Poultry 0.16*** 0.09*** 0.05*** -1.48*** 0.10*** 0.06*** 0.13*** 0.11*** 0.07*** 0.13*** 0.11*** 0.22*** 0.10*** 0.16*** Processed 0.08*** 0.16*** 0.15*** 0.26*** -1.70*** 0.00 0.11*** 0.10*** 0.04** 0.14*** 0.14*** 0.26*** 0.11*** 0.14*** Cheese 0.15*** 0.11*** 0.05*** 0.21 0.00 -1.50*** 0.04 0.10*** 0.07*** 0.18*** 0.12*** 0.21*** 0.07*** 0.20*** Bread 0.17*** 0.11*** 0.10*** 0.22*** 0.07*** 0.02 -1.43*** 0.07*** 0.05*** 0.16*** 0.15*** 0.17*** 0.09*** 0.06*** Rice 0.21*** 0.18*** 0.07*** 0.31*** 0.11*** 0.09*** 0.12*** -2.40*** 0.12*** 0.21*** 0.10*** 0.35*** 0.10*** 0.43*** Noodles 0.13*** 0.12*** 0.04** 0.18*** 0.04*** 0.06*** 0.08*** 0.11*** -1.36*** 0.07*** 0.11*** 0.22*** 0.06*** 0.14*** Tomatoes 0.12*** 0.07*** 0.05*** 0.22*** 0.09*** 0.09*** 0.15*** 0.13*** 0.05*** -1.51*** 0.09*** 0.25*** 0.06*** 0.14*** OrangeV 0.13*** 0.14*** 0.02 0.20*** 0.10*** 0.07*** 0.17*** 0.06*** 0.08*** 0.10*** -1.51*** 0.23*** 0.09*** 0.12*** Potatoes 0.13*** 0.16*** 0.07*** 0.20*** 0.09*** 0.06*** 0.09*** 0.12*** 0.08*** 0.13*** 0.11*** -1.42*** 0.09*** 0.11*** OtherV 0.07*** 0.14*** 0.09*** 0.20*** 0.08*** 0.05*** 0.11*** 0.06*** 0.04*** 0.07*** 0.10*** 0.20*** -1.33*** 0.12*** SaladV 0.10*** 0.12*** -0.04*** 0.24*** 0.11*** 0.13*** 0.07*** 0.09*** 0.08*** 0.09*** 0.06*** 0.22*** 0.10*** -1.37***
Note: Level of Statistical Significance - *** = 1%, ** = 5%, * = 10%