complete aircraft flight instruments amp avionics
DESCRIPTION
Avionics InstrumentsTRANSCRIPT

Volume 3FLIGHT INSTRUMENTS AND AVIONICS
Cockpit Inspection
Table of ContentsContents
PART
SECT
CHAP
TITLE
1 AIR DATA INSTRUMENTS1 Height
1 Introduction to BarometricHeight Measurement
2 Altimeters2 Speed
1 Vertical Speed Indicators2 Air Speed Indicators3 Machmeters4 Combined Speed Indicators
3 Air Data Systems1 Air Data Computer
2 HEADING, ATTITUDEAND ALIGNMENT
1 Heading
DO NOT DISTRIBUTE AP 3456
Page 1 : Wed Jan 02 02:28:26 2002 Volume 3 3- 0- 0- 0

1 Direct Indicating Compassesand Direction Indicators
2 Gyro-magnetic Compasses3 Horizontal Situation Indicators
2 Alignment1 Datum Compasses2 Magnetic, Compass Deviations3 Compass Swinging Procedures4 The Analysis of the Compass
Swing3 Manoeuvre
1 Turn and Slip Indicators2 Attitude Indicators3 Accelerometers4 Stall Warning and Angle of
Attack Indication3 NAVIGATION SYSTEMS
1 Control Systems1 Remote Indication and Control2 Servomechanisms
2 DR Position Computing1 Ground Position Indicator
(GPI) Mk 4A2 The Tactical Air Navigation
System (TANS)3 Inertial Navigation
Principles1 Principles of Inertial
Navigation2 Alignment3 INS Errors and Mixed Systems
4 COMPUTING ANDDISPLAY
1 Central Computing1 Airborne Computers2 Real Time Programs
2 Displays1 CRT Displays2 Flat Displays3 Projected and Electronically
Displayed Maps4 Head-up and Helmet Mounted
Displays3 Autopilot and Flight
Director Systems1 Autopilot and Flight Director
Systems4 Engine and Miscellaneous
DO NOT DISTRIBUTE AP 3456
Page 2 : Wed Jan 02 02:28:26 2002 Volume 3 3- 0- 0- 0

Instruments1 Engine Instruments2 Miscellaneous Instruments
AIR DATA INSTRUMENTS
HeightChapter 1 - Introduction to Barometric Height Measurement
Introduction1. Pressure altimeters are instruments which indicate aircraft height above a selected pressure datum. They operate on theprinciple that air pressure decreases with height, and they are in fact aneroid barometers graduated to indicate height rather thanpressure. In order to be calibrated, certain assumptions must be made concerning the manner in which air pressure decreaseswith height and this has given rise to a number of model atmospheres.
2. Air Pressure Units. The pressure unit which has been used in the field of aviation for many years is the millibar except forsome countries, notably the USA, which have used 'inches of mercury'. However, the current SI derived unit is the hectopascaland this should be used rather than the millibar. Nevertheless the hectopascal has not yet entered the vocabulary of most aircrewand in deference to common usage the millibar will be used in this volume. The hectopascal and the millibar are identical for allpractical purposes.
The Atmosphere3. The atmosphere is described in detail in Vol 1, Part 1, Sect 1, Chap 1. It is a relatively thin layer of gases surrounding theEarth, becoming more diffuse with increasing height. Water vapour is present in variable amounts, particularly near the surface.
4. The atmosphere can be divided into a number of layers each with a tendency to a particular temperature distribution. Thenames, heights and characteristics of these layers may vary according to which standard atmosphere is being defined. However,in all cases the lower layer, the troposphere, extends to a layer known as the tropopause. The significant characteristic of thetroposphere is the fairly regular decrease of temperature with height. The tropopause tends to become lower towards the Earth'spoles (around 25,000 ft) and higher towards the equator (up to 54,000 ft). The region above the tropopause is known as thestratosphere, extending up to the stratopause. The height of the stratopause varies depending on which definition is beingemployed, but can be taken to be about 30 miles (166,000 ft).
5. Pressure Lapse Rate. As height increases, pressure decreases, but this decrease is not proportional to the increase in heightbecause the density of air varies with height, as does the value of g, although to a lesser extent. It is possible to deduce anexpression for the pressure lapse rate at a constant temperature and thus establish a relationship between pressure and height. Apractical approximation for the lower levels of the atmosphere is that a decrease in pressure of one millibar equates to anincrease in height of 30 feet.
6. Temperature Lapse Rate. Temperature does not remain constant but varies with height in a complex manner. Thetemperature lapse rate depends on the humidity of the air, and is itself a function of height. This variation greatly affects therelationship between pressure and height. To calibrate an altimeter to indicate barometric height it is necessary to make someassumptions as to the temperature structure of the atmosphere. The relationship can be expressed in mathematical form for eachof the various layers of the atmosphere and the instrument can then be calibrated accordingly.
7. Height Assumptions. Because of the temporal and spatial variations in the real atmosphere, and the differences between theconditions on any occasion and the assumptions used in altimeter calibration, there is no real correlation between indicatedaltitude and actual altitude. A barometrically derived height must therefore be used with extreme caution as a basis for terrainclearance. However, provided that all aircraft use the same datum and the same assumptions in the calibration of theiraltimeters, safe vertical separation between aircraft can be achieved.
Standard Atmospheres8. A standard atmosphere is an arbitrary statement of conditions which is accepted as a basis for comparisons of aircraft
DO NOT DISTRIBUTE AP 3456
Page 3 : Wed Jan 02 02:28:26 2002 Height 3- 1- 1- 1

performance and calibration of aircraft flight instruments. Because of the extreme variability of conditions in the atmosphere,the standard can only represent the average conditions over a limited area of the globe. Most standards so far adopted are relatedprimarily to the mean atmospheric conditions in temperate latitudes of the northern hemisphere.
9. The first widely accepted standard was proposed by the International Commission on Air Navigation (ICAN) in 1924 andbetween 1950 and 1952 the International Civil Aviation Organization (ICAO) proposed and adopted another standard whichvaried only slightly from the ICAN model. Equations were formulated for determining height from barometric pressure whichwere valid up to 65,617 ft. The ICAO standard atmosphere is taken as the International Standard Atmosphere (ISA) and theassumed characteristics are:
a. The air is dry and its chemical composition is the same at all altitudes.
b. The value of g is constant at 980.665 cm/sec2.
c. The temperature and pressure at mean sea-level are 15°C and 1013.25 millibars.
d. The temperature lapse rate is 1.98°C per 1000 ft up to a height of 36,090ft above which the temperature is assumed toremain constant at – 56.5°C.
10. A number of other standard atmospheres have been formulated mainly in response to the need to extend the height limit ofthe model beyond 65,617 ft to accommodate the requirements of missiles and certain high performance aircraft. Theassumptions of these models are very similar to the ICAO standard and the differences in the relation of height to pressure areminimal in the lower altitudes. However in the stratosphere and beyond, heights, lapse rates and layer names differ markedly. Acomparison of Fig 1, which depicts the Wright Air Development Centre (WADC) Standard Atmosphere with Fig 1 in Vol 1, Pt1, Sect 1, Chap 1 will reveal some of the differences.
3-1-1-1 Fig 1 WADC Standard Atmosphere
DO NOT DISTRIBUTE AP 3456
Page 4 : Wed Jan 02 02:28:32 2002 Height 3- 1- 1- 1

HeightChapter 2 - Altimeters
Principle of Operation of a Simple Altimeter1. Fig 1 is a schematic diagram of a simple altimeter. The instrument consists of a thin corrugated metal capsule which ispartially evacuated, sealed, and prevented from collapsing completely by means of a leaf spring, or in some cases by its ownrigidity. The capsule is mounted inside a case which is fed with static pressure from the aircraft's static tube or vent. As theaircraft climbs the static pressure in the case decreases allowing the spring to pull the capsule faces apart. Conversely a decreasein height compresses the capsule faces. This linear movement of the capsule face is magnified and transmitted via a system ofgears and linkages to a pointer moving over a scale graduated in feet according to one of the standard atmospheres.
3-1-1-2 Fig 1 Simple Altimeter - Schematic
DO NOT DISTRIBUTE AP 3456
Page 5 : Wed Jan 02 02:28:32 2002 Height 3- 1- 1- 2
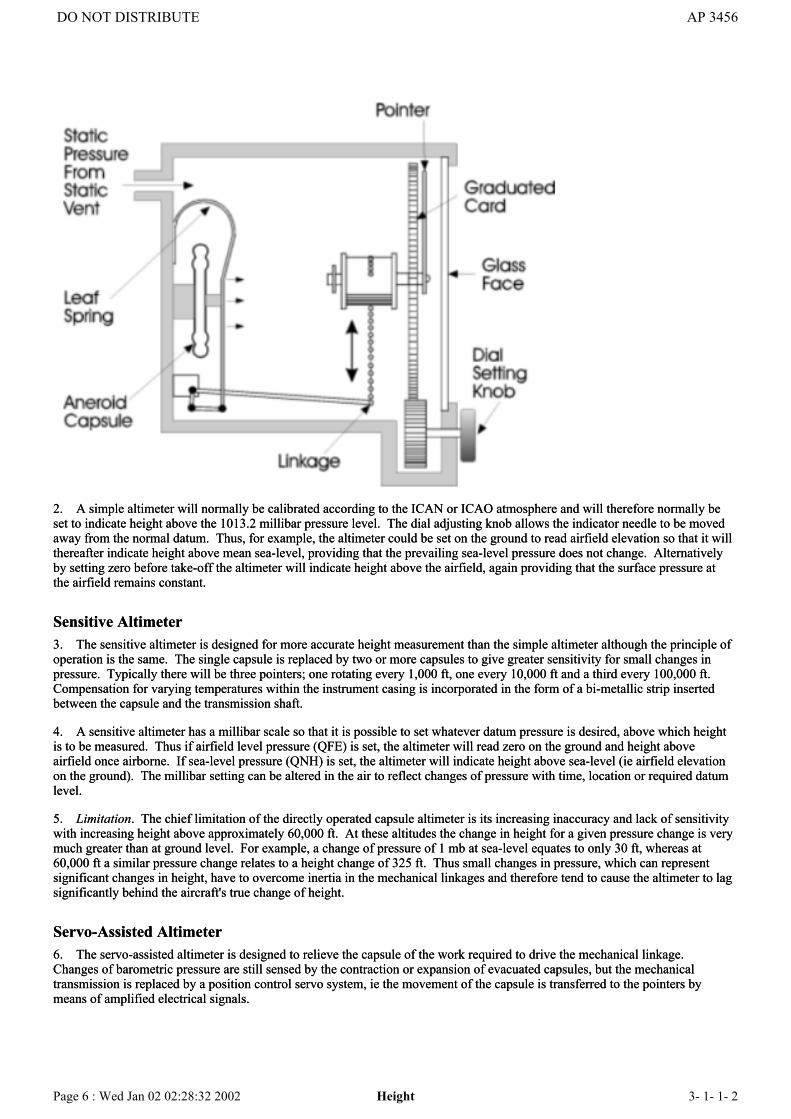
2. A simple altimeter will normally be calibrated according to the ICAN or ICAO atmosphere and will therefore normally beset to indicate height above the 1013.2 millibar pressure level. The dial adjusting knob allows the indicator needle to be movedaway from the normal datum. Thus, for example, the altimeter could be set on the ground to read airfield elevation so that it willthereafter indicate height above mean sea-level, providing that the prevailing sea-level pressure does not change. Alternativelyby setting zero before take-off the altimeter will indicate height above the airfield, again providing that the surface pressure atthe airfield remains constant.
Sensitive Altimeter3. The sensitive altimeter is designed for more accurate height measurement than the simple altimeter although the principle ofoperation is the same. The single capsule is replaced by two or more capsules to give greater sensitivity for small changes inpressure. Typically there will be three pointers; one rotating every 1,000 ft, one every 10,000 ft and a third every 100,000 ft.Compensation for varying temperatures within the instrument casing is incorporated in the form of a bi-metallic strip insertedbetween the capsule and the transmission shaft.
4. A sensitive altimeter has a millibar scale so that it is possible to set whatever datum pressure is desired, above which heightis to be measured. Thus if airfield level pressure (QFE) is set, the altimeter will read zero on the ground and height aboveairfield once airborne. If sea-level pressure (QNH) is set, the altimeter will indicate height above sea-level (ie airfield elevationon the ground). The millibar setting can be altered in the air to reflect changes of pressure with time, location or required datumlevel.
5. Limitation. The chief limitation of the directly operated capsule altimeter is its increasing inaccuracy and lack of sensitivitywith increasing height above approximately 60,000 ft. At these altitudes the change in height for a given pressure change is verymuch greater than at ground level. For example, a change of pressure of 1 mb at sea-level equates to only 30 ft, whereas at60,000 ft a similar pressure change relates to a height change of 325 ft. Thus small changes in pressure, which can representsignificant changes in height, have to overcome inertia in the mechanical linkages and therefore tend to cause the altimeter to lagsignificantly behind the aircraft's true change of height.
Servo-Assisted Altimeter6. The servo-assisted altimeter is designed to relieve the capsule of the work required to drive the mechanical linkage.Changes of barometric pressure are still sensed by the contraction or expansion of evacuated capsules, but the mechanicaltransmission is replaced by a position control servo system, ie the movement of the capsule is transferred to the pointers bymeans of amplified electrical signals.
DO NOT DISTRIBUTE AP 3456
Page 6 : Wed Jan 02 02:28:32 2002 Height 3- 1- 1- 2

7. In addition to increased accuracy and sensitivity, the arrangement has the advantage that the altitude information can beeasily transmitted to other systems, eg IFF/SSR. In current altimeters the three needle display is replaced by a digital display,and an auxiliary pointer moving over a scale graduated in 50 ft increments from 0 - 1,000 ft (Fig 2).
3-1-1-2 Fig 2 Servo-Assisted Altimeter - Digital Display
Cabin Altimeters8. Cabin altimeters indicate cabin pressure in terms of altitude and are normally of the simple type, having one pointer movingover a scale graduated in tens of thousands of feet. The static pressure is of course cabin pressure and a change in this causes thecapsules to expand or contract in the normal way. They do not usually have error compensating devices although they may becompensated to allow for fluctuations in cabin temperature. Cabin altimeters suffer from the errors outlined below and at cabinaltitudes below 30,000 ft the instrument should be accurate to better than ± 500 ft.
Pressure Altimeter Errors9. Pressure altimeter errors may be considered under two categories; instrument or installation errors, and errors caused bynon-standard atmospheric conditions.
10. The errors inherent in the instrument and installation are:a. Instrument error. Instrument error is caused by manufacturing tolerances. It is usually insignificant but if necessary acorrection card can be provided.
b. Pressure error. Pressure error occurs when the true external static pressure is not accurately transmitted to theinstrument. A false static pressure can be created by the effect of the air flow passing over the static vent. Although theerror is generally negligible at low speeds and altitudes, it can become significant at high speeds, or when services such asflaps, airbrakes, or gear are operated. Avoidance or reduction of the effect is accomplished by careful probe or vent designand location. Residual error is calibrated for each aircraft type and detailed in the Aircrew Manual or ODM, orautomatically in an air data computer or pressure error corrector unit (PECU). Large transient errors can be caused by shockwaves passing over the vent during accelerations or decelerations.
DO NOT DISTRIBUTE AP 3456
Page 7 : Wed Jan 02 02:28:33 2002 Height 3- 1- 1- 2

c. Lag Error. Since the response of the capsule and linkage is not instantaneous, the altimeter needle lags whenever heightis changed rapidly causing an under-read on climbs and an over-read on descents. Clearly the latter situation could bedangerous and should be allowed for in rapid descents. The amount of lag varies with the rate of change of height. Timelag is virtually eliminated in servo-assisted altimeters and may be reduced in others by the fitting of a vibrationmechanism.
d. Hysteresis Loss. A capsule under stress has imperfect elastic properties and will settle to give a different reading afterlevelling from a climb compared to that obtained after levelling from a descent.
e. Transonic Jump. If a shockwave passes over that static source, a rapid change in static pressure will occur. This givesan error in the altimeter indication for the duration of the disturbance.
f. Blockages and Leaks. Blockages and leaks are unusual occurrences. Blockages may occur if water in the pipeworkfreezes, or there are obstructions such as insects. The effect is to increase altimeter lag or, with complete blockage, to makethe instrument stick at the reading when the blockage occurred. The effect of leaks varies with the size and location of theleak; leaks in pressurized compartments cause under-reading, while leaks in unpressurized compartments usually produceover-reading.
11. Variations from International Standard Atmosphere (ISA) conditions may be brought about by the development of weathersystems, and local geographic effects. The resulting errors in ISA-calibrated altimeters are:
a. Barometric error. Barometric error occurs when the actual datum pressure differs from that to which the altimeter hasbeen set and can be overcome simply by the correct setting of the millibar scale. The effect of the error on an altimeterwhich is not reset when flying from an area of high pressure to one of low pressure at a constant indicated height isillustrated in Fig 3. In this case the aircraft flies from an area where the MSL pressure is 1030 mb to one where the MSLpressure is 1010 mb, but the 1030 mb setting is retained on the altimeter. In effect the datum is lowered during the flight sothat the altimeter reads high. Conversely if the flight was from an area of low pressure to one of high pressure the altimeterwould read low if not corrected. In summary, from HIGH to LOW the altimeter reads HIGH, and from LOW to HIGH thealtimeter reads LOW.
3-1-1-2 Fig 3 Effect of Barometric Error
b. Temperature Error. Temperature error arises when the atmospheric conditions differ from those assumed by thestandard atmosphere used to calibrate the altimeter. The ICAO standard atmosphere assumes a temperature lapse rate of1.98°C per 1,000 ft up to 36,090 ft, with a constant temperature of −56.5°C above that. If the actual temperatures differfrom the assumed ones, as they very often do, then the indicated height will be incorrect. In a cold air mass the density isgreater than in a warm air mass, the pressure levels are more closely spaced and the altimeter will over-read (Fig 4) - theerror being zero at sea-level and increasing with altitude. The error is not easy to compensate for, since in order to do so itwould be necessary to have a knowledge of the temperature structure from the surface to the aircraft. The magnitude of the
DO NOT DISTRIBUTE AP 3456
Page 8 : Wed Jan 02 02:28:33 2002 Height 3- 1- 1- 2

error is approximately 4ft/1,000ft for every 1°C that the air generally differs from ISA. Corrections can be made for lowaltitudes by use of the table in the Flight Information Handbook and this may be necessary, for example, when calculatingdecision heights in arctic conditions. The table is reproduced in Fig 5 to give an indication of the magnitude of the error.
c. Orographic Error. When a current of air meets a barrier of hills or mountains there is a tendency, often marked, formuch of the air to sweep round the ends of the barrier, so avoiding the ascent. This gives rise to areas of low pressure to thelee of the barrier. The altimeter readings may therefore be affected due to barometric error as described in sub-para a.Additionally, if standing waves are present above the barrier, the rising or descending air in the wave will changetemperature at very nearly the normal adiabatic lapse rate. The temperature profile in the affected area may then besignificantly different from the unaffected airmass thereby inducing temperature error effects as described in sub-para b, onaltimeter readings.
3-1-1-2 Fig 4 Effect of Temperature Error
3-1-1-2 Fig 5 Temperature Error Correction
DO NOT DISTRIBUTE AP 3456
Page 9 : Wed Jan 02 02:28:33 2002 Height 3- 1- 1- 2

SpeedChapter 1 - Vertical Speed Indicators
Introduction1. A vertical speed indicator (VSI), also known as a rate of climb and descent indicator (RCDI), is a sensitive differentialpressure gauge, which displays a rate of change of atmospheric pressure in terms of a rate of climb or descent.
Principle2. The principle employed is that of measuring the difference of pressure between two chambers, one within the other. Staticatmospheric pressure is fed directly to the inner chamber, or capsule, and through a metering unit to the outer chamber, which ineffect forms the instrument case. The metering unit restricts the flow of air into and out of the case, whereas the flow to theinside of the capsule is unrestricted. Therefore, if the static pressure varies due to changing altitude, the pressure change in thecase lags behind that in the capsule. The resultant differential pressure distorts the capsule and this movement is transmitted tothe pointer by means of a mechanical linkage. A bleed valve is fitted in many VSIs to prevent damage and to improve the
DO NOT DISTRIBUTE AP 3456
Page 10 : Wed Jan 02 02:28:33 2002 Speed 3- 1- 2- 1

instrument's reaction time (by reducing lag) when levelling off from a high speed descent. The construction of a VSI is shownschematically in Fig 1 and a typical display is illustrated in Fig 2.
3. It is important that any given pressure difference between the inside and outside of the capsule should represent the samerate of climb or descent, regardless of the ambient atmospheric pressure and temperature variations with altitude. The functionof the metering unit, in the manner in which it restricts the flow into the case, is to compensate for these changes in ambientconditions.
3-1-2-1 Fig 1 VSI - Schematic Construction
3-1-2-1 Fig 2 VSI - Typical Display
DO NOT DISTRIBUTE AP 3456
Page 11 : Wed Jan 02 02:28:34 2002 Speed 3- 1- 2- 1

4. In level flight the pressure inside the capsule and the case are the same, and the pointer remains at the horizontal, zero,position. When the aircraft climbs, the static pressure decreases and the capsule collapses slightly, causing the pointer toindicate a rate of climb. The fall in pressure in the case lags behind that in the capsule until level flight is resumed and thepressures equalize. In a descent, the increase in pressure in the case lags behind the increase in static pressure in the capsule, andthe capsule is expanded.
Errors5. The VSI can suffer from the following errors:
a. Pressure Error. If the static head or vent is subject to a changing pressure error, the VSI may briefly indicate a wrongrate of climb or descent.
b. Instrument Error. Instrument error is the result of manufacturing tolerances and is usually insignificant.
c. Transonic Jump. Movement of a shock-wave over the static vents results in a rapid change in static pressure whichbriefly produces a false reading on the VSI.
d. Lag. Because of the time required for the pressure difference to develop, when an aircraft is rapidly manoeuvred into asteady climb or descent there is a few seconds delay before the pointer settles at the appropriate rate of climb or descent. Asimilar delay in the pointer indicating zero occurs when the aircraft is levelled.
e. Static Line Blockage. If the static line or vent becomes blocked by ice or any other obstruction the VSI will be renderedunserviceable and the pointer will remain at zero regardless of the vertical speed.
SpeedChapter 2 - Air Speed Indicators
DO NOT DISTRIBUTE AP 3456
Page 12 : Wed Jan 02 02:28:34 2002 Speed 3- 1- 2- 2

Introduction1. A knowledge of the speed at which an aircraft is travelling through the air, ie the air speed, is essential both to the pilot forthe safe and efficient handling of the aircraft and to the navigator as a basic input to the navigation calculations. The instrumentwhich displays this information is the air speed indicator (ASI).
Principle2. An aircraft, stationary on the ground, is subject to normal atmospheric or static pressure which acts equally on all parts ofthe aircraft structure. In flight the aircraft experiences an additional pressure on its leading surfaces due to a build up of the airthrough which the aircraft is travelling. This additional pressure due to the aircraft's forward motion is known as dynamicpressure and is dependent upon the forward speed of the aircraft and the density of the air according to the following formula:
pt=1
2½V2 + p
where pt = the pitot pressure, (also known as total head pressure or stagnation pressure)
p = the static pressure
½ = the air density
V = the velocity of the aircraft.
Rearranging the formula, the difference between the pitot and the static pressures is equal to 12½V2 (the dynamic pressure). The
air speed indicator measures this pressure difference and provides a display indication graduated in units of speed.
3. Fig 1 illustrates the principle, in its most simple form, on which all air speed indicators function. The ASI is a sensitivedifferential pressure gauge operated by pressures picked up by a pressure head, which is mounted in a suitable position on theairframe. The simplest pressure head consists of an open ended tube, the pitot tube, aligned with the direction of flight, and asecond tube, the static tube, which is closed and streamlined at the forward end but which has a series of small holes drilledradially along its length.
3-1-2-2 Fig 1 Principle of Air Speed Indicator
4. When moved through the air, the pitot tube will pick up pitot pressure made up of static pressure and dynamic pressure. Thepitot pressure is led through a pipe-line to one side of a sealed chamber, divided by a thin flexible diaphragm. The static tube isunaffected by dynamic pressure as its end is closed, however, the small holes will pick up local static pressure. The staticpressure is led through a second pipe-line to the other side of the diaphragm.
5. The diaphragm is subjected to the two opposing pressures. However, the static pressure component of the pitot pressure is
DO NOT DISTRIBUTE AP 3456
Page 13 : Wed Jan 02 02:28:34 2002 Speed 3- 1- 2- 2

balanced by the static pressure on the other side of the diaphragm so that any diaphragm movement is determined solely by thedynamic, or pitot excess, pressure. Movement of the diaphragm is transmitted through a mechanical linkage to a pointer on theface of the ASI where the pitot excess pressure (pt – p) is indicated in terms of speed.
6. In some installations the pitot tube and the static tube are combined into a single pressure head with the pitot tube builtinside the static tube. A heater is placed between the pitot and static tubes to prevent ice forming and causing a blockage. Drainholes in the head allow moisture to escape and various traps may be used to prevent dirt and water from affecting the instrument.A combined pressure head is shown in Fig 2.
3-1-2-2 Fig 2 A Combined Pressure Head
Construction7. Most air speed indicators in current use have a capsule instead of a diaphragm, however, the principle of operation is exactlythe same. The capsule, acting as the pressure sensitive element is mounted in an airtight case. Pitot pressure is fed into thecapsule and static pressure is fed to the interior of the case, which thus contains the lower pressure. A pressure difference willcause the capsule to open out, the movement being proportional to pressure. A link, quadrant and pinion can be used to transferthis movement to a pointer and dial calibrated in knots.
8. As stated in para 2, the pitot excess pressure varies with the square of the speed and a linear pressure/deflectioncharacteristic in the capsule produces an uneven speed/deflection characteristic of the pointer mechanism, giving unequal pointermovements for equal speed changes. To produce a linear scale between the capsule and pointer it is necessary to control thecharacteristics of the capsule and/or the mechanism. Control of the capsule is difficult due, among other reasons, to themagnification factor of the mechanism. It is more usual to control the mechanism to produce a linear scale shape by changingthe lever length as the pointer advances. Depending on the manufacturer of the ASI, detailed points of construction will vary,however, the basic principle holds good for all. A typical simple ASI is shown in Fig 3.
3-1-2-2 Fig 3 A Typical Simple ASI
DO NOT DISTRIBUTE AP 3456
Page 14 : Wed Jan 02 02:28:34 2002 Speed 3- 1- 2- 2

9. Sensitive and Servo Air Speed Indicators. Sensitive and servo ASIs are identical in principle to the simple ASI and operatefrom the normal pitot/static system. Extra sensitivity is achieved by an increase in the gear train from the capsule, so that twopointers may be moved over an evenly calibrated dial. Because of this increase in the gear train, more power is required tooperate the gears and this is provided by a stack of capsules. This capsule assembly has a linear pressure/deflectioncharacteristic which is more closely controlled than the single capsule used in the simple ASI. In a servo ASI the mechanicallinkage is replaced by an electrical linkage utilizing error actuation and power amplification. A typical sensitive ASI display isshown in Fig 4.
3-1-2-2 Fig 4 A Two Pointer Sensitive ASI
DO NOT DISTRIBUTE AP 3456
Page 15 : Wed Jan 02 02:28:35 2002 Speed 3- 1- 2- 2

Calibration10. Since dynamic pressure varies with air speed and air density, and since air density varies with temperature and pressure,standard datum values have to be used in the calibration of air speed indicators. The values used are the sea level values of thestandard ICAO atmosphere. The formula given in para 2 is only an approximation and one of two formulae is used forcalibration of a particular ASI depending on the speed range of the instrument.
ASI Errors11. The ASI pointer registers the amount of capsule movement due to dynamic pressure. However, the dial is calibratedaccording to the formulae mentioned above which assume constant air density (standard sea level density) and no instrumentdefects. Any departure from these conditions or disturbance in the pitot or static pressures being applied to the instrument willresult in a difference between the indicated and the true air speed and thus an error in the display. There are four sources oferror:
a. Instrument error.
b. Pressure error.
c. Compressibility error.
d. Density error.
12. Instrument Error. Instrument error is caused by manufacturing tolerances in the construction of the instrument. The error isdetermined during calibration and any necessary correction is combined with that for pressure error (see para 13).
13. Pressure Error. Pressure error results from disturbances in the static pressure around the aircraft due to movement throughthe air. Depending upon aircraft type, the error may be influenced by:
a. The position of the pressure head, pitot head or static vent.
b. The angle of attack of the aircraft.
c. The speed of the aircraft.
d. The configuration of the aircraft (ie ‘clean’/ flaps/gear/airbrakes/etc).
DO NOT DISTRIBUTE AP 3456
Page 16 : Wed Jan 02 02:28:35 2002 Speed 3- 1- 2- 2
e. The presence of sideslip.
Most of the error results from variations in the local static pressure caused by the airflow over the pressure head. In lower speedaircraft the static head is often divorced from the pitot tube and positioned where the truest indication of static pressure isobtained eg on the fuselage midway between nose and tail. In such a case the static pipeline terminates at a hole in a flat brassplate known as the static vent. It it usual to have two static vents, one either side of the aircraft to balance out the effects ofsideslip which produces an increase of pressure on one side of the aircraft and a corresponding decrease in pressure on the otherside. The use of static vents eliminates almost all the error caused by the pressure head. Any remaining error is determined byflight trials. Unfortunately the use of a static vent becomes less acceptable for high performance aircraft since at Mach numbersexceeding 0.8, the flow of air around the static vent may be unpredictable. In such cases a high speed pitot-static head is usedand, as before, pressure error is determined by flight trials. The pressure error correction (PEC) is tabulated in the AircrewManual for the aircraft type and is also combined with that for instrument error correction (IEC) and recorded on a correctioncard mounted adjacent to each ASI. The card correction (IEC + PEC) should be applied to the indicated air speed (IAS) toobtain calibrated air speed (CAS).
14. Compressibility Error. The calibration formulae contain a factor which is a function of the compressibility of the air. Athigher speeds this factor becomes significant. However the calibration formulae use standard mean sea level values and an erroris introduced at any altitude where the actual values differ from those used in calibration. At altitude, the less dense air is moreeasily compressed than the denser air at sea level, resulting in a greater dynamic pressure which causes the ASI to over-read. Inaddition compressibility increases with increase of speed, therefore compressibility error varies both with speed and altitude.Compressibility error and its correction can be calculated by using the circular slide rule of the DR Computer Mk4A or 5A.Application of the compressibility error correction (CEC) to CAS produces equivalent air speed (EAS).
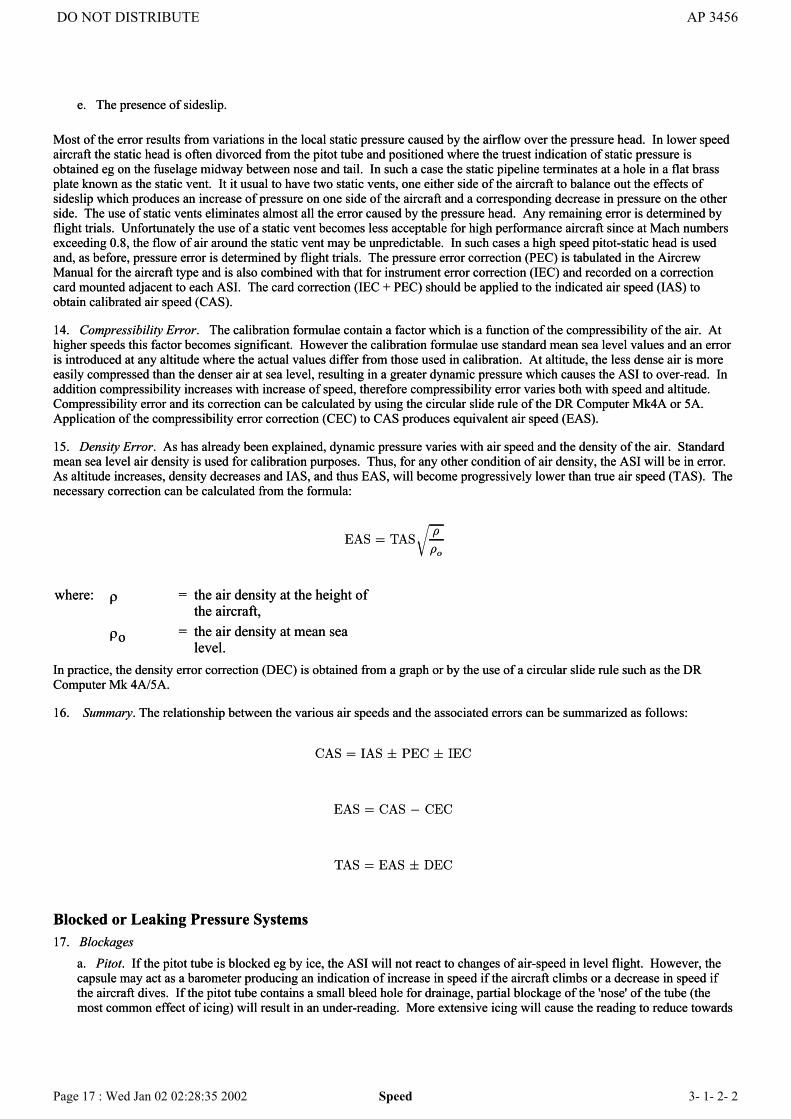
15. Density Error. As has already been explained, dynamic pressure varies with air speed and the density of the air. Standardmean sea level air density is used for calibration purposes. Thus, for any other condition of air density, the ASI will be in error.As altitude increases, density decreases and IAS, and thus EAS, will become progressively lower than true air speed (TAS). Thenecessary correction can be calculated from the formula:
EAS = TAS
r½
½o
where: ρ = the air density at the height ofthe aircraft,
ρo = the air density at mean sealevel.
In practice, the density error correction (DEC) is obtained from a graph or by the use of a circular slide rule such as the DRComputer Mk 4A/5A.
16. Summary. The relationship between the various air speeds and the associated errors can be summarized as follows:
CAS = IAS § PEC § IEC
EAS = CAS ¡ CEC
TAS = EAS § DEC
Blocked or Leaking Pressure Systems17. Blockages
a. Pitot. If the pitot tube is blocked eg by ice, the ASI will not react to changes of air-speed in level flight. However, thecapsule may act as a barometer producing an indication of increase in speed if the aircraft climbs or a decrease in speed ifthe aircraft dives. If the pitot tube contains a small bleed hole for drainage, partial blockage of the 'nose' of the tube (themost common effect of icing) will result in an under-reading. More extensive icing will cause the reading to reduce towards
e. The presence of sideslip.
Most of the error results from variations in the local static pressure caused by the airflow over the pressure head. In lower speedaircraft the static head is often divorced from the pitot tube and positioned where the truest indication of static pressure isobtained eg on the fuselage midway between nose and tail. In such a case the static pipeline terminates at a hole in a flat brassplate known as the static vent. It it usual to have two static vents, one either side of the aircraft to balance out the effects ofsideslip which produces an increase of pressure on one side of the aircraft and a corresponding decrease in pressure on the otherside. The use of static vents eliminates almost all the error caused by the pressure head. Any remaining error is determined byflight trials. Unfortunately the use of a static vent becomes less acceptable for high performance aircraft since at Mach numbersexceeding 0.8, the flow of air around the static vent may be unpredictable. In such cases a high speed pitot-static head is usedand, as before, pressure error is determined by flight trials. The pressure error correction (PEC) is tabulated in the AircrewManual for the aircraft type and is also combined with that for instrument error correction (IEC) and recorded on a correctioncard mounted adjacent to each ASI. The card correction (IEC + PEC) should be applied to the indicated air speed (IAS) toobtain calibrated air speed (CAS).
14. Compressibility Error. The calibration formulae contain a factor which is a function of the compressibility of the air. Athigher speeds this factor becomes significant. However the calibration formulae use standard mean sea level values and an erroris introduced at any altitude where the actual values differ from those used in calibration. At altitude, the less dense air is moreeasily compressed than the denser air at sea level, resulting in a greater dynamic pressure which causes the ASI to over-read. Inaddition compressibility increases with increase of speed, therefore compressibility error varies both with speed and altitude.Compressibility error and its correction can be calculated by using the circular slide rule of the DR Computer Mk4A or 5A.Application of the compressibility error correction (CEC) to CAS produces equivalent air speed (EAS).
15. Density Error. As has already been explained, dynamic pressure varies with air speed and the density of the air. Standardmean sea level air density is used for calibration purposes. Thus, for any other condition of air density, the ASI will be in error.As altitude increases, density decreases and IAS, and thus EAS, will become progressively lower than true air speed (TAS). Thenecessary correction can be calculated from the formula:
EAS = TAS
r½
½o
where: ρ = the air density at the height ofthe aircraft,
ρo = the air density at mean sealevel.
In practice, the density error correction (DEC) is obtained from a graph or by the use of a circular slide rule such as the DRComputer Mk 4A/5A.
16. Summary. The relationship between the various air speeds and the associated errors can be summarized as follows:
CAS = IAS § PEC § IEC
EAS = CAS ¡ CEC
TAS = EAS § DEC
Blocked or Leaking Pressure Systems17. Blockages
a. Pitot. If the pitot tube is blocked eg by ice, the ASI will not react to changes of air-speed in level flight. However, thecapsule may act as a barometer producing an indication of increase in speed if the aircraft climbs or a decrease in speed ifthe aircraft dives. If the pitot tube contains a small bleed hole for drainage, partial blockage of the 'nose' of the tube (themost common effect of icing) will result in an under-reading. More extensive icing will cause the reading to reduce towards
DO NOT DISTRIBUTE AP 3456
Page 17 : Wed Jan 02 02:28:35 2002 Speed 3- 1- 2- 2

zero as the dynamic pressure leaks away through the bleed hole
b. Static. If the static tube is blocked, the ASI will over-read at lower altitudes and under-read at higher altitudes than thatat which the blockage occurred.
18. Leaksa. Pitot. A leak in the pitot tube causes the ASI to under-read.
b. Static. A leak in the static tube, where the pressure outside the pipe is lower than static (ie most unpressurized aircraft),will cause the ASI to over-read. Where the outside air is higher than static (ie in a pressurized cabin) the ASI willunder-read.
19. Effects. The under- or over-reading of an ASI is potentially dangerous. The former may cause problems in adverse landingconditions (eg in a strong cross-wind), and the latter condition may result in an aircraft stall at a higher indicated airspeed thanthat specified for the aircraft.
SpeedChapter 3 - Machmeters
Introduction1. Mach Number. As an aircraft's speed approaches the speed of sound, the airflow around the aerofoils exhibits a markedchange, characterized by the occurrence of shock waves. These will occur locally, depending on the aircraft design, at somespeed below the speed of sound and will increase in effect and extent as the speed is further increased. They can cause loss ofaerodynamic lift, changes in aerodynamic stability, erratic control loads, loss of control effectiveness and buffeting. The onsetof these shock waves and their subsequent effects occur, for a given aircraft type, when the true air speed is a certain proportionof the local speed of sound. For convenience, the ratio of true air speed to the local speed of sound is considered as a singleentity. It is called Mach number and is usually expressed thus:
Mach number (M) = V/awhere: V = True air speed
a = Local speed of sound2. Machmeter. Because of the effect of the shock waves on stability and control of the aircraft, it is important that the pilotknows his speed in terms of Mach number. This is achieved by an instrument called a Machmeter which gives a direct displayof Mach number and may have an adjustable index which is usually set to the Limiting Indicated Mach Number of the aircraft inwhich it is installed.
Basic Principle3. As explained in para 1, the local Mach number varies with the true air speed and the local speed of sound. True air speed isa function of pitot excess pressure ie the difference between pitot and static pressure, and density. The local speed of sound is afunction of static pressure and density. As the density factor is common to both functions, Mach number can be expressed as:
M =V
a/
·pt ¡ p
p
¸
where: V = True air speeda = Local speed of soundpt = Pitot pressure
p = Static pressureThe machmeter uses an air speed capsule to measure pt – p an altitude capsule to measure p, and is calibrated to show thequotient as the corresponding Mach number.
DO NOT DISTRIBUTE AP 3456
Page 18 : Wed Jan 02 02:28:35 2002 Speed 3- 1- 2- 3

4. The actual calibration of the instrument is more complex than the basic principle suggests, since the behaviour of airchanges as speed is increased, especially once shockwaves form. As Mach number increases therefore, the actual formula usedto derive an indicated Mach reading requires and receives considerable modification.
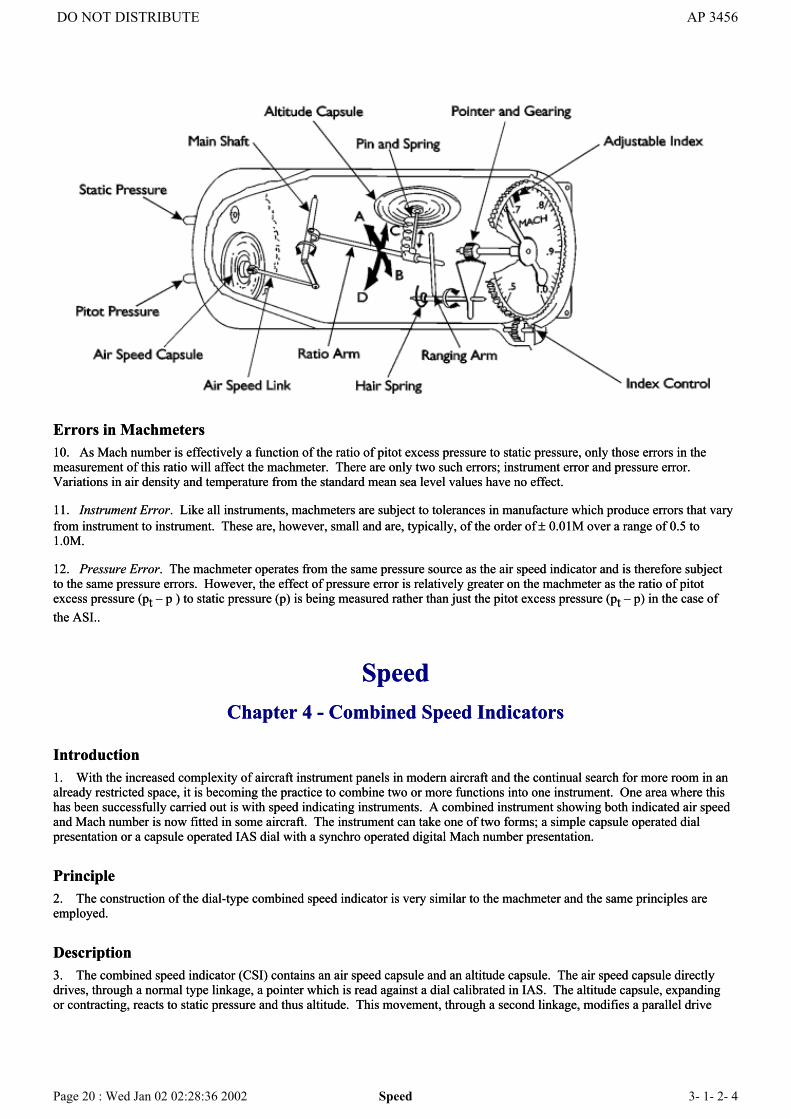
Construction5. A typical machmeter is shown in Fig 1. It consists essentially of a sealed case containing two capsule assemblies and thenecessary mechanical linkages. The interior of the case is connected to the static pressure pipeline. The interior of one capsuleunit, the air speed capsule, is connected to the pitot pressure pipeline. The second capsule unit, the altitude capsule, is sealed andevacuated to respond to static pressure changes.
3-1-2-3 Fig 1 A Typical Machmeter
6. The air speed capsule measures the pressure difference between pitot and static pressure and therefore expands or contractsas air speed increases or decreases. The movement of the capsule is transferred by the air speed link to the main shaft, causing itto rotate and move a pivoted arm (the ratio arm) in the direction A-B (see Fig 2).
7. The altitude capsule responds to changes of static pressure, expanding or contracting with variation of altitude. Themovement of the capsule is transferred to the ratio arm, via a spring and pin, causing it to move in the direction C-D. The pin ispointed at both ends and rests in cups on the altitude capsule and ratio arm; the spring providing the tension necessary to retainthe pin in position.
8. The position of the ratio arm depends, therefore, upon both pitot excess and static pressures. Movement of the ratio armcontrols the ranging arm which, through linkage and gearing, turns the pointer thus displaying the corresponding Mach number.An increase of altitude and/or air speed results in a display of higher Mach number.
9. Critical or Limiting Mach Number is indicated by a specially shaped lubber mark located over the dial of the machmeter. Itis adjustable so that the relevant Mach number for the particular type of aircraft in which the machmeter is installed may bepreset. Presetting can be carried out by an adjusting screw on the front of the instrument.
3-1-2-3 Fig 2 Principle of Operation of a Machmeter
4. The actual calibration of the instrument is more complex than the basic principle suggests, since the behaviour of airchanges as speed is increased, especially once shockwaves form. As Mach number increases therefore, the actual formula usedto derive an indicated Mach reading requires and receives considerable modification.
Construction5. A typical machmeter is shown in Fig 1. It consists essentially of a sealed case containing two capsule assemblies and thenecessary mechanical linkages. The interior of the case is connected to the static pressure pipeline. The interior of one capsuleunit, the air speed capsule, is connected to the pitot pressure pipeline. The second capsule unit, the altitude capsule, is sealed andevacuated to respond to static pressure changes.
3-1-2-3 Fig 1 A Typical Machmeter
6. The air speed capsule measures the pressure difference between pitot and static pressure and therefore expands or contractsas air speed increases or decreases. The movement of the capsule is transferred by the air speed link to the main shaft, causing itto rotate and move a pivoted arm (the ratio arm) in the direction A-B (see Fig 2).
7. The altitude capsule responds to changes of static pressure, expanding or contracting with variation of altitude. Themovement of the capsule is transferred to the ratio arm, via a spring and pin, causing it to move in the direction C-D. The pin ispointed at both ends and rests in cups on the altitude capsule and ratio arm; the spring providing the tension necessary to retainthe pin in position.
8. The position of the ratio arm depends, therefore, upon both pitot excess and static pressures. Movement of the ratio armcontrols the ranging arm which, through linkage and gearing, turns the pointer thus displaying the corresponding Mach number.An increase of altitude and/or air speed results in a display of higher Mach number.
9. Critical or Limiting Mach Number is indicated by a specially shaped lubber mark located over the dial of the machmeter. Itis adjustable so that the relevant Mach number for the particular type of aircraft in which the machmeter is installed may bepreset. Presetting can be carried out by an adjusting screw on the front of the instrument.
3-1-2-3 Fig 2 Principle of Operation of a Machmeter
DO NOT DISTRIBUTE AP 3456
Page 19 : Wed Jan 02 02:28:35 2002 Speed 3- 1- 2- 3
Errors in Machmeters10. As Mach number is effectively a function of the ratio of pitot excess pressure to static pressure, only those errors in themeasurement of this ratio will affect the machmeter. There are only two such errors; instrument error and pressure error.Variations in air density and temperature from the standard mean sea level values have no effect.
11. Instrument Error. Like all instruments, machmeters are subject to tolerances in manufacture which produce errors that varyfrom instrument to instrument. These are, however, small and are, typically, of the order of ± 0.01M over a range of 0.5 to1.0M.
12. Pressure Error. The machmeter operates from the same pressure source as the air speed indicator and is therefore subjectto the same pressure errors. However, the effect of pressure error is relatively greater on the machmeter as the ratio of pitotexcess pressure (pt – p ) to static pressure (p) is being measured rather than just the pitot excess pressure (pt – p) in the case ofthe ASI..
SpeedChapter 4 - Combined Speed Indicators
Introduction1. With the increased complexity of aircraft instrument panels in modern aircraft and the continual search for more room in analready restricted space, it is becoming the practice to combine two or more functions into one instrument. One area where thishas been successfully carried out is with speed indicating instruments. A combined instrument showing both indicated air speedand Mach number is now fitted in some aircraft. The instrument can take one of two forms; a simple capsule operated dialpresentation or a capsule operated IAS dial with a synchro operated digital Mach number presentation.
Principle2. The construction of the dial-type combined speed indicator is very similar to the machmeter and the same principles areemployed.
Description3. The combined speed indicator (CSI) contains an air speed capsule and an altitude capsule. The air speed capsule directlydrives, through a normal type linkage, a pointer which is read against a dial calibrated in IAS. The altitude capsule, expandingor contracting, reacts to static pressure and thus altitude. This movement, through a second linkage, modifies a parallel drive
DO NOT DISTRIBUTE AP 3456
Page 20 : Wed Jan 02 02:28:36 2002 Speed 3- 1- 2- 4
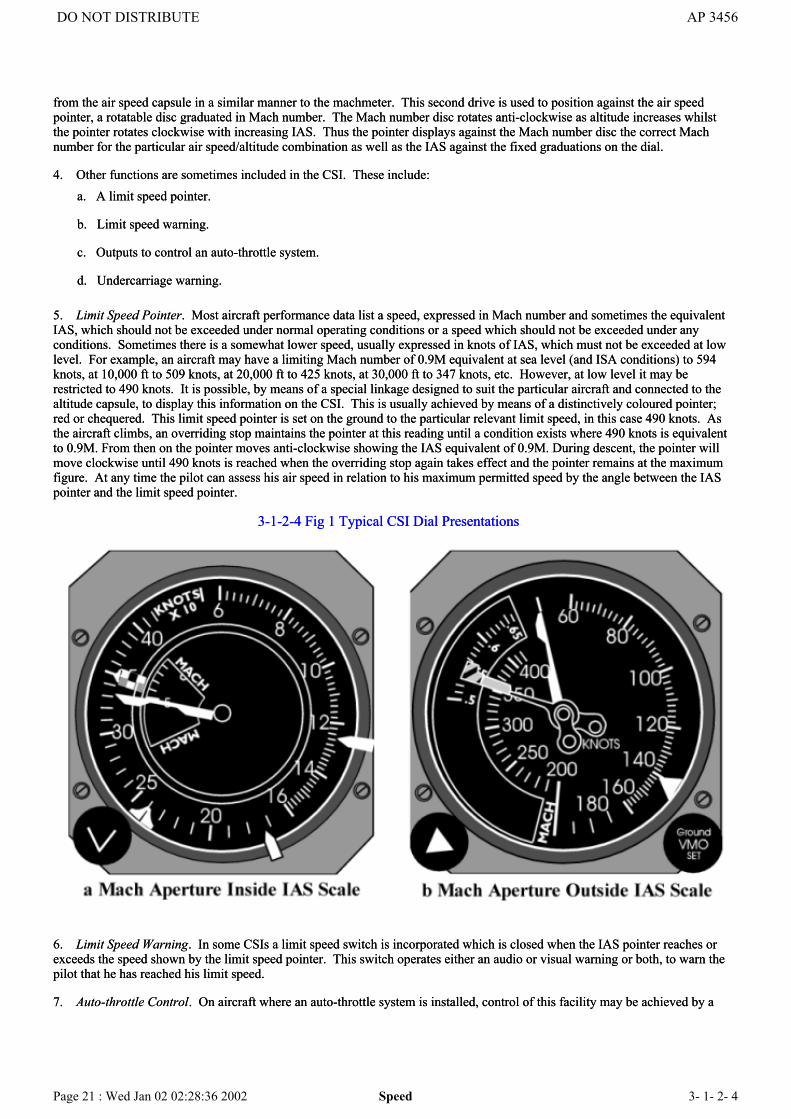
from the air speed capsule in a similar manner to the machmeter. This second drive is used to position against the air speedpointer, a rotatable disc graduated in Mach number. The Mach number disc rotates anti-clockwise as altitude increases whilstthe pointer rotates clockwise with increasing IAS. Thus the pointer displays against the Mach number disc the correct Machnumber for the particular air speed/altitude combination as well as the IAS against the fixed graduations on the dial.
4. Other functions are sometimes included in the CSI. These include:a. A limit speed pointer.
b. Limit speed warning.
c. Outputs to control an auto-throttle system.
d. Undercarriage warning.
5. Limit Speed Pointer. Most aircraft performance data list a speed, expressed in Mach number and sometimes the equivalentIAS, which should not be exceeded under normal operating conditions or a speed which should not be exceeded under anyconditions. Sometimes there is a somewhat lower speed, usually expressed in knots of IAS, which must not be exceeded at lowlevel. For example, an aircraft may have a limiting Mach number of 0.9M equivalent at sea level (and ISA conditions) to 594knots, at 10,000 ft to 509 knots, at 20,000 ft to 425 knots, at 30,000 ft to 347 knots, etc. However, at low level it may berestricted to 490 knots. It is possible, by means of a special linkage designed to suit the particular aircraft and connected to thealtitude capsule, to display this information on the CSI. This is usually achieved by means of a distinctively coloured pointer;red or chequered. This limit speed pointer is set on the ground to the particular relevant limit speed, in this case 490 knots. Asthe aircraft climbs, an overriding stop maintains the pointer at this reading until a condition exists where 490 knots is equivalentto 0.9M. From then on the pointer moves anti-clockwise showing the IAS equivalent of 0.9M. During descent, the pointer willmove clockwise until 490 knots is reached when the overriding stop again takes effect and the pointer remains at the maximumfigure. At any time the pilot can assess his air speed in relation to his maximum permitted speed by the angle between the IASpointer and the limit speed pointer.
3-1-2-4 Fig 1 Typical CSI Dial Presentations
6. Limit Speed Warning. In some CSIs a limit speed switch is incorporated which is closed when the IAS pointer reaches orexceeds the speed shown by the limit speed pointer. This switch operates either an audio or visual warning or both, to warn thepilot that he has reached his limit speed.
7. Auto-throttle Control. On aircraft where an auto-throttle system is installed, control of this facility may be achieved by a
DO NOT DISTRIBUTE AP 3456
Page 21 : Wed Jan 02 02:28:36 2002 Speed 3- 1- 2- 4

synchro system installed in the CSI. A moveable command pointer, manually set by a knob on the front of the instrument,positions the rotor of a synchro. The rotor of a second synchro is positioned by a low friction drive from the IAS pointer. Whenthe IAS pointer reads the same as the command pointer, there is zero output from the pair of synchros. Any difference betweenthe two pointers produces an error signal which is fed to the auto-throttle system adjusting the throttles so that the aircraft returnsto the original selected speed.
8. Undercarriage Warning. An internal switch is fitted in some CSIs which will close at a pre-set figure in the aircraftapproach speed range to provide a signal for a visual or audio warning if the undercarriage is not selected down.
Presentation9. A single pointer is read against a fixed IAS dial calibrated in knots and a rotatable disc (the Mach disc) calibrated in Machnumber. The Mach disc is set behind and viewed through an aperture positioned either inside or outside the air speed scale. Asecond pointer, distinctively painted with diagonal lines or chequers may be incorporated to show the limit speed at all altitudes.On some models, two manually positioned bezel mounted lubber marks are available to indicate any desired air speed forreference purposes. A single command lubber positioned manually by a knob on the front of the instrument, allowing theauto-throttle reference speed to be set, may also be incorporated. Typical presentations are shown in Fig 1a and b.
Digital Mach/Air Speed Indicators10. A variation of the CSI is a model which shows IAS by a pointer indication and Mach number by a digital display. In thiscase the instrument contains two capsules (air speed and altitude) as explained above but these are used only to drive the airspeed pointer and a limit speed pointer, if fitted. A synchro drive proportional to Mach number is received from the aircraft's airdata computer and a servo loop drives a three counter digital display. Limit speed warning and auto-throttle control can beincorporated as described in paras 6 and 7.
11. Presentation. An air speed pointer is read against a fixed scale and a second pointer, distinctively marked, may beincorporated to show limit speed at all altitudes. A servo driven three drum counter provides a digital read out of Mach numberto two or three places of decimals. A failure flag covers the counters in the event of power failure or loss of the Mach numbersynchro signal from the air data computer. Moveable index lubber marks may be incorporated in the same manner as for the dialpresentation CSI and control of an auto-throttle reference lubber mark by a knob on the front of the instrument may also beincluded. A typical digital Mach/air speed indicator is shown in Fig 2.
Range and Accuracy12. The operating range of the CSI varies with the particular model but, typically, air speeds up to 800 knots and Mach numberup to 2.5 can be covered. Typical instrument accuracies are ± 3 knots and ± 0.010M.
3-1-2-4 Fig 2 Typical Digital Mach/Air Speed Indicator
DO NOT DISTRIBUTE AP 3456
Page 22 : Wed Jan 02 02:28:36 2002 Speed 3- 1- 2- 4

3-1-2-4 Fig 1a Mach Aperture Inside IAS Scale
3-1-2-4 Fig 1b Mach Aperture Outside IAS Scale
3-1-2-4 Fig 1a Mach Aperture Inside IAS Scale
3-1-2-4 Fig 1b Mach Aperture Outside IAS Scale
DO NOT DISTRIBUTE AP 3456
Page 23 : Wed Jan 02 02:28:37 2002 Speed 3- 1- 2- 4

Air Data SystemsChapter 1 - Air Data Computer
Introduction1. Although conventional pressure instruments can provide satisfactory information for the crew, they have a number oflimitations, especially in the context of modern aircraft systems. In particular, the information that an instrument measures canonly be presented in one form and cannot easily be transmitted for use by other equipment, or to other crew positions, resultingin a need to duplicate the instrument. An Air Data System (ADS) overcomes these limitations.
2. An ADS can take a number of forms which will vary between aircraft types, however all systems are similar in principle andthis chapter will describe a typical, rather than any specific, system.
3. The core of an ADS is an Air Data Computer (ADC) which forms an essential part of a modern flight/navigation/weaponaiming system. The ADS measures the basic air inputs of pitot pressure, static pressure, air temperature, angle of attack (αangle), side slip (β angle), and outputs flight parameters for the various systems and displays. A comprehensive ADS thusconsists of:
a. Pitot, static and temperature probes to measure the basic air data.
b. Local incidence vanes for α angle and β angle computation.
c. Transducers to convert the basic air data into electrical or electro-mechanical signals.
d. Air Data Computer to process the data and provide the required outputs to the aircraft systems and displays.
e. Power supplies to provide specific stabilized power for the ADS units.
Probes4. Pitot/Static. Pitot and static pressures are taken from the aircraft's pressure head or the pitot head and static vents.
DO NOT DISTRIBUTE AP 3456
Page 24 : Wed Jan 02 02:28:37 2002 Air Data Systems 3- 1- 3- 1

5. Temperature. Temperature is determined from outside air temperature probes.
6. Angle of Attack (α Angle). Angle of attack is the angle, in the vertical plane of symmetry of the aircraft, at which the freestream airflow meets an arbitrary longitudinal datum line on the aircraft. It is generally measured by a small pivoted vane whoseaxis of rotation is nominally horizontal and athwartships. The vane is usually mounted on the side of the fuselage near the noseor on a probe forward of the wing or nose.
7. Angle of Side Slip (β Angle). The β angle is the angle in the horizontal plane at which the free stream airflow meets anarbitrary longitudinal datum line on the aircraft. The β sensor is normally identical to the α sensor and mounted on theunderside of the airframe along the aircraft centre line. In simpler ADS the β sensor is often omitted.
Transducers8. Transducers, which convert pressures, temperatures and angles to voltages or digital pulses, are the most vital elements ofthe air data systems, and are the limiting factors in the system accuracy. Transducers vary in type depending on the parameterwhich is to be measured, ie pressure transducers, temperature transducers and angular transducers. Various techniques areemployed to convert the measured data into usable, repeatable and accurate signals which can be transmitted to the ADC, egusing the expansion of a diaphragm or capsule to actuate an electrical pick-off, or to vary the electrical resistance of a wire bychanging the wire's tension.
Air Data Computers9. The air data computer processes the data input from the sensors, applies any necessary corrections, and supplies output datain the form required by other equipment, either directly or via a central computer. Particularly in older systems, where there is nocentral computer, the same output parameter may be in several forms, eg pressure altitude may be processed as a voltage, asynchro output, and a digital code. Fig 1 shows a typical ADS arrangement.
10. Compared with conventional pressure instruments the ADS has the following advantages:
a. The bulk and complexity of pipe work is avoided.
b. Duplication of units is avoided.
c. Errors can be automatically corrected before display.
d. There are accuracy and sensitivity gains.
e. There is a reduced time lag.
f. There is the potential for flexibility in presentation.
The disadvantage of the ADS is that it needs power to work whereas conventional pressure instruments do not. It is thereforeusually necessary to provide back-up systems, either in the form of alternative power supplies or with simple pressureinstruments.
3-1-3-1 Fig 1 Air Data System
DO NOT DISTRIBUTE AP 3456
Page 25 : Wed Jan 02 02:28:37 2002 Air Data Systems 3- 1- 3- 1
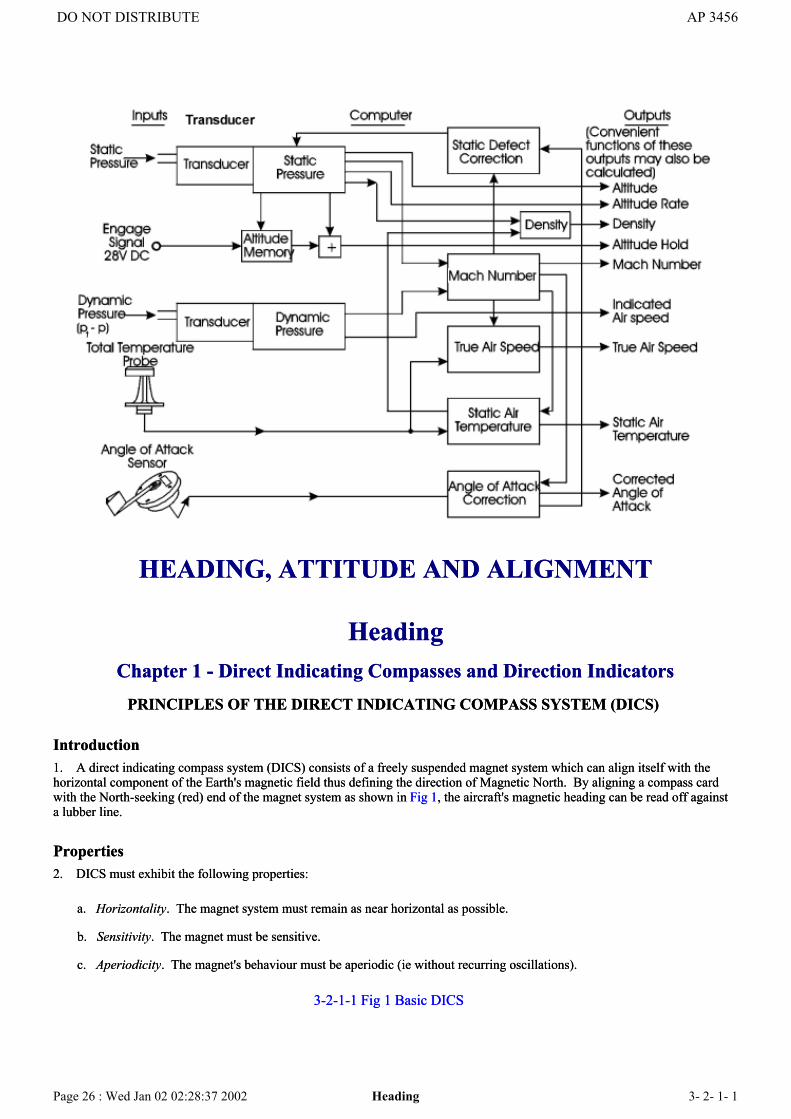
HEADING, ATTITUDE AND ALIGNMENT
HeadingChapter 1 - Direct Indicating Compasses and Direction Indicators
PRINCIPLES OF THE DIRECT INDICATING COMPASS SYSTEM (DICS)
Introduction1. A direct indicating compass system (DICS) consists of a freely suspended magnet system which can align itself with thehorizontal component of the Earth's magnetic field thus defining the direction of Magnetic North. By aligning a compass cardwith the North-seeking (red) end of the magnet system as shown in Fig 1, the aircraft's magnetic heading can be read off againsta lubber line.
Properties2. DICS must exhibit the following properties:
a. Horizontality. The magnet system must remain as near horizontal as possible.
b. Sensitivity. The magnet must be sensitive.
c. Aperiodicity. The magnet's behaviour must be aperiodic (ie without recurring oscillations).
3-2-1-1 Fig 1 Basic DICS
DO NOT DISTRIBUTE AP 3456
Page 26 : Wed Jan 02 02:28:37 2002 Heading 3- 2- 1- 1

Horizontally3. Freely suspended in the Earth's magnetic field, a magnet system will align itself with the direction of that field. At themagnetic equator the field direction is parallel to the Earth's surface; at all other places the magnet system is tilted in thedirection of the total field (T), where T is the resultant of the horizontal and vertical fields.
4. If the magnet system were allowed to align itself with the T field it would be difficult to align the compass card accurately;moreover, the tendency to tilt would reduce the magnetic moment in the horizontal plane in which direction is measured. Apendulous suspension system is therefore used to overcome the magnet system's tendency to tilt. When the pendulouslysuspended magnet system tilts to align with T, the magnet system's centre of gravity is displaced from the vertical through thepivot (Fig 2). The magnet system's weight forms the couple Wd, which acts to restore the magnet system to the horizontal. InUK latitudes the residual tilt in a well designed compass is approximately 2°.
Sensitivity5. DICS must be sensitive and able to indicate the local magnetic meridian quickly and accurately.
3-2-1-1 Fig 2 Pendulous Suspension
Sensitivity may be increased by the following methods:
DO NOT DISTRIBUTE AP 3456
Page 27 : Wed Jan 02 02:28:37 2002 Heading 3- 2- 1- 1

a. Increasing the magnetic moment of the magnet system.
b. Reducing the moment of inertia of the magnet system.
c. Reducing the friction at the suspension point.
6. A compromise is reached between the magnetic moment and the moment of inertia requirements by using a number ofsmall, light, powerful magnets as the magnetic sensing element of the compass. Friction at the pivot is reduced by usingjewelled bearings and also by suspending the magnet system in a fluid which reduces the weight acting on the pivot andlubricates the bearing.
Aperiodicity7. The vibrations and oscillations experienced in flight by a suspended magnet system tend to cause undesirable periodicoscillations. Aperiodicity is achieved using a magnet system with a low moment of inertia and high magnetic moment, the samecompromise applied for sensitivity. Damping filaments, which create drag forces and reduce the magnet system's tendency tooscillate, are also used.
DICS - ERRORS AND LIMITATIONS
General8. In addition to the errors caused by external magnetic fields, DICS are subject to the errors and limitations covered in thefollowing paragraphs.
Turning and Acceleration Errors - Cause9. If an aircraft fitted with a DICS is subjected to horizontal accelerations, the accelerating forces may cause errors in theindicated heading. The accelerations may be the result of speed changes or from the central acceleration experienced in a turn;both have similar effects on the compass system, the resultant errors being greatest when the accelerating force acts at rightangles to the magnetic meridian with which the compass is aligned, ie when the aircraft changes speed on easterly or westerlyheadings, or turns through North or South. The errors are caused by the displacement of the magnet system's centre of gravityfrom the line through the pivot. This displacement results in the formation of couples which rotate the magnet system andproduce heading errors.
Turning and Acceleration Errors - Effect10. Consider an aircraft in the Northern Hemisphere increasing speed whilst heading West, or turning from North or South onto West. In both cases the accelerating force acts through the pivot which is the magnet system's point of attachment to theaircraft. The reaction force acts, not through the pivot, but through the magnet system's centre of gravity.
11. Looking down on the magnet system in Fig 3 it can be seen that a couple is produced which turns the magnet systemanti-clockwise. Considering the effect of these forces in the vertical plane together with the magnetic forces acting on themagnet, it can be seen from Fig 4 that the accelerating force and its reaction create a couple which tilts the magnet system out ofthe vertical. The vertical component of the Earth's magnetic field no longer acts through the pivot, but can be resolved into twoorthogonal components. One component (Z cos θ) acts through the pivot, and the other (Z sin θ) at 90° to the pivot. θ is theangle of tilt. In Fig 4 it is shown that the component Z sin θ tends to pull the blue end of the magnet to the right. An equal butopposite effect is created at the red end, and a magnetic couple is created which turns the magnet system anti-clockwise (Fig 5).
3-2-1-1 Fig 3 Accelerating Force Producing Couple
DO NOT DISTRIBUTE AP 3456
Page 28 : Wed Jan 02 02:28:38 2002 Heading 3- 2- 1- 1

3-2-1-1 Fig 4 Acceleration Causing Tilt
3-2-1-1 Fig 5 Couple Causing Turn
12. Two couples, one mechanical and one magnetic, turn the magnet system anti-clockwise. If the error is caused by anincrease in speed, the effect is an apparent turn to North, ie the compass over-reads. If the error is caused by turning, the effectdepends on the direction and rate of turn. In turns through North, the magnet system turns in the direction of turn and in all butthe most violent manoeuvres, the indicated turn is slower than the actual turn, ie the compass under reads the turn indicating aturn of perhaps 20° for an actual turn through 45°. In turns through South, however, the magnet system turns in the oppositedirection to the turn and the indicated turn is greater than the actual turn, ie the compass indicates a turn of perhaps 40° for anactual turn of 20°.
DO NOT DISTRIBUTE AP 3456
Page 29 : Wed Jan 02 02:28:38 2002 Heading 3- 2- 1- 1

Summary13. The effects of turning and acceleration errors are summarized below:
a. Northern Hemisphere.(1) Acceleration on westerly headings and turns to the West cause the magnet system to rotate anti-clockwise.
(2) Acceleration on easterly headings and turns to the East cause the magnet system to rotate clockwise.
(3) Acceleration causes an apparent turn to the North.
(4) Turns through North cause the compass to under-indicate the turn.
(5) Turns through South cause the compass to over-indicate the turn.
b. Southern Hemisphere. The effects are reversed in the Southern Hemisphere.
Minor Errors14. The following minor errors also occur:
a. Scale Error. Scale error is caused by errors in the calibration of the compass card.
b. Alignment Error. Alignment error is caused by the incorrect mounting of the compass in the aircraft, or by a displacedlubber-line. The error is corrected by the compass swing.
c. Centring Error. Centring error occurs when the compass card is not centred on the magnet system pivot.
d. Parallax Error. When reading DICS care must be taken to ensure that the eye is centred on the face of the compass. Ifthe line of sight is offset parallax errors occur.
Operational Limitations15. A DICS has the following limitations which make it unsuitable for use as the primary heading system of a modern aircraft:
a. It depends upon the size of the horizontal component of the Earth's magnetic field for its drive and thus it becomesinsensitive and unreliable at high magnetic latitudes.
b. It must be installed in the aircraft cockpit, which is normally an area of high magnetic deviation.
c. It can only provide magnetic heading, whereas true or grid heading may be required on occasions.
d. Turning and acceleration errors make it only suitable for use in straight, unaccelerated flight.
e. There is insufficient torque to enable it to drive transmission systems to feed other aircraft equipment.
Advantages16. Despite the limitations of a DICS it is likely to be fitted to most aircraft for the foreseeable future as a standby compass. Inthis application it has the advantages of being cheap to purchase and install, small and light, simple and easy to maintain andoperate, and requiring no power, except for lighting.
A PRACTICAL DICS
The E2 Series17. The principles of the DICS are exemplified in the E2 series of standby compasses which are widely used (Fig 6). Thedifferences between the E2A, E2B and E2C are minor and mostly concern the lighting arrangements. The compasses have avertical card fastened to the magnet system, graduated every 10 degrees, with figures every 30 degrees. The cardinal points are
DO NOT DISTRIBUTE AP 3456
Page 30 : Wed Jan 02 02:28:38 2002 Heading 3- 2- 1- 1
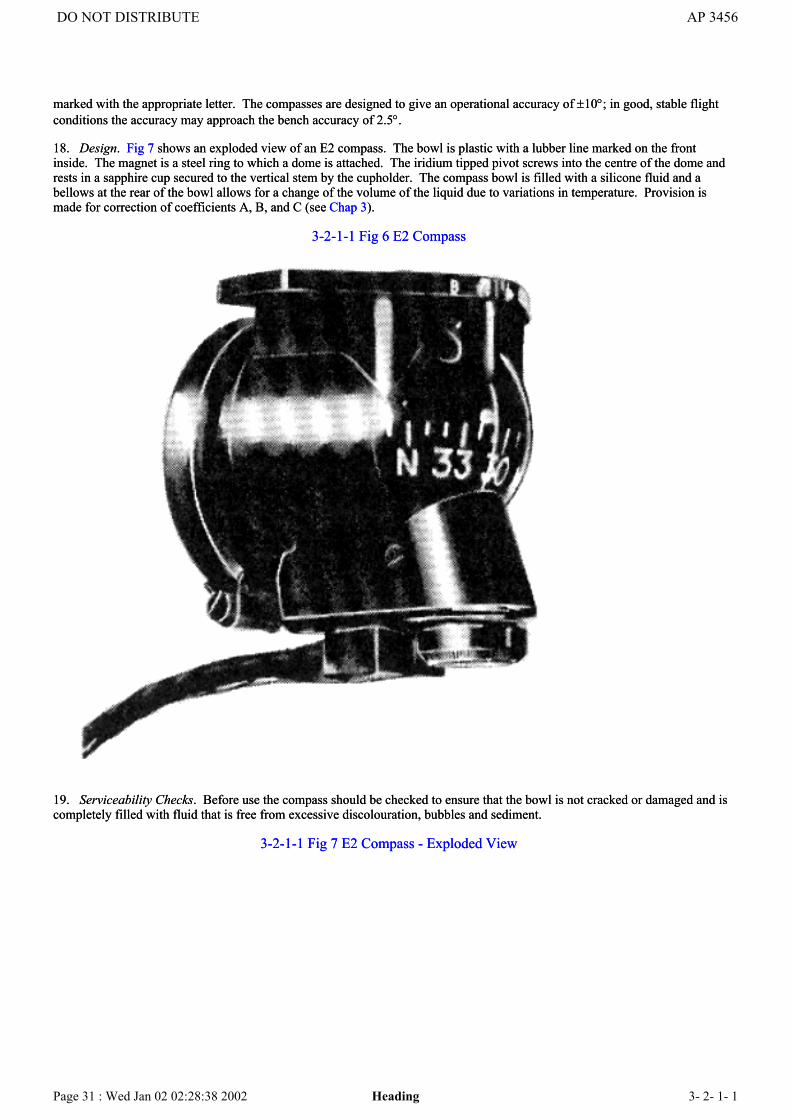
marked with the appropriate letter. The compasses are designed to give an operational accuracy of ±10°; in good, stable flightconditions the accuracy may approach the bench accuracy of 2.5°.
18. Design. Fig 7 shows an exploded view of an E2 compass. The bowl is plastic with a lubber line marked on the frontinside. The magnet is a steel ring to which a dome is attached. The iridium tipped pivot screws into the centre of the dome andrests in a sapphire cup secured to the vertical stem by the cupholder. The compass bowl is filled with a silicone fluid and abellows at the rear of the bowl allows for a change of the volume of the liquid due to variations in temperature. Provision ismade for correction of coefficients A, B, and C (see Chap 3).
3-2-1-1 Fig 6 E2 Compass
19. Serviceability Checks. Before use the compass should be checked to ensure that the bowl is not cracked or damaged and iscompletely filled with fluid that is free from excessive discolouration, bubbles and sediment.
3-2-1-1 Fig 7 E2 Compass - Exploded View
DO NOT DISTRIBUTE AP 3456
Page 31 : Wed Jan 02 02:28:38 2002 Heading 3- 2- 1- 1

DIRECTION INDICATORS
Operation20. The direction indicator (DI) is used, mostly in light aircraft, as a simple heading reference. It consists of an air orelectrically driven, two degree of freedom, displacement gyro with its spin axis mounted horizontally (Refer to Vol 8, Pt 2, Sect4, Chap 5). The DI must initially be set to a known heading such as that obtained from a direct indicating compass. Thereafter itmay be used as a heading reference during level flight provided that it is checked and reset if necessary to the correct headingperiodically. The display is usually in the form of a conventional plan form compass rose and the only controls provided are toreset the indicated heading, and to position a moveable heading index (see Fig 8).
21. The spin axis is maintained in the horizontal plane either by the action of a gravity actuated torque motor or by air jetsinitiated by a liquid level switch.
Errors22. The direction indicator is subject to the normal wander errors associated with gyros. Topple is controlled within acceptablelimits by the action of the levelling system.
23. The combination of real and apparent drift could make the total error rate accrued by a direction indicator to be in the orderof 10 - 20°/hr, hence the need to reset the instrument at regular intervals. Resetting should be done in straight, unacceleratedflight. Clearly the direction indicator cannot be relied upon as a primary heading reference.
3-2-1-1 Fig 8 Direction Indicator Display
DO NOT DISTRIBUTE AP 3456
Page 32 : Wed Jan 02 02:28:38 2002 Heading 3- 2- 1- 1
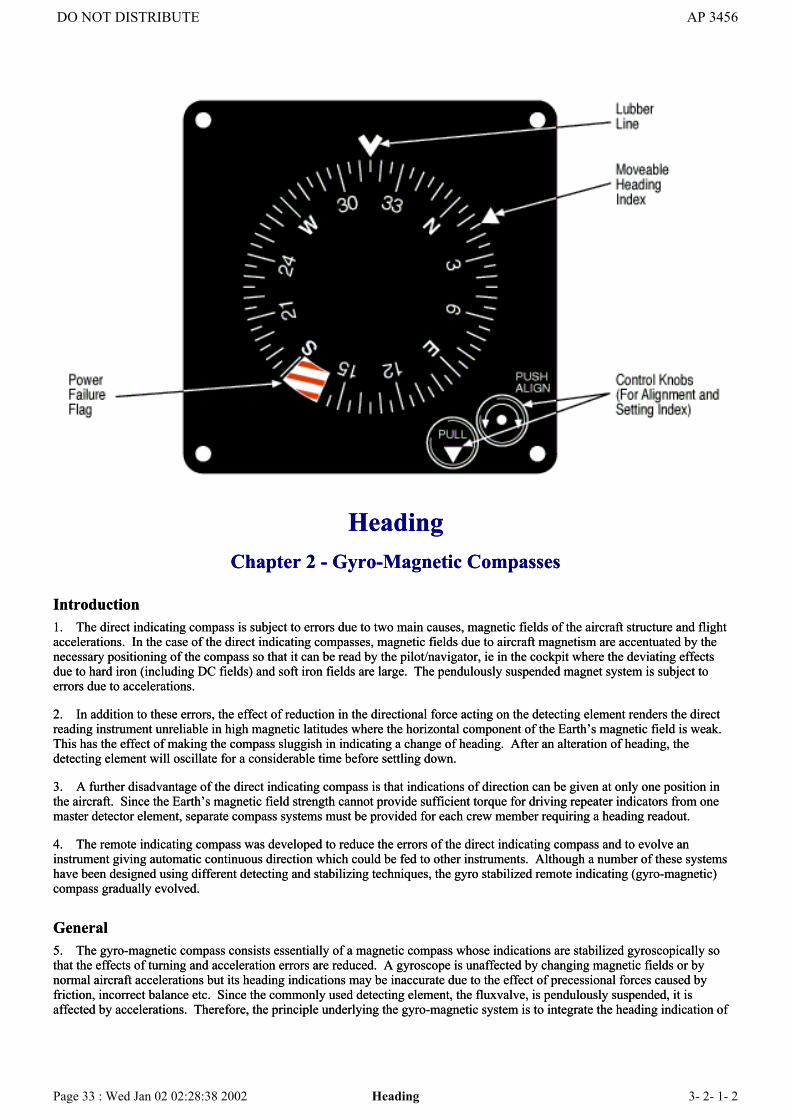
HeadingChapter 2 - Gyro-Magnetic Compasses
Introduction1. The direct indicating compass is subject to errors due to two main causes, magnetic fields of the aircraft structure and flightaccelerations. In the case of the direct indicating compasses, magnetic fields due to aircraft magnetism are accentuated by thenecessary positioning of the compass so that it can be read by the pilot/navigator, ie in the cockpit where the deviating effectsdue to hard iron (including DC fields) and soft iron fields are large. The pendulously suspended magnet system is subject toerrors due to accelerations.
2. In addition to these errors, the effect of reduction in the directional force acting on the detecting element renders the directreading instrument unreliable in high magnetic latitudes where the horizontal component of the Earth’s magnetic field is weak.This has the effect of making the compass sluggish in indicating a change of heading. After an alteration of heading, thedetecting element will oscillate for a considerable time before settling down.
3. A further disadvantage of the direct indicating compass is that indications of direction can be given at only one position inthe aircraft. Since the Earth’s magnetic field strength cannot provide sufficient torque for driving repeater indicators from onemaster detector element, separate compass systems must be provided for each crew member requiring a heading readout.
4. The remote indicating compass was developed to reduce the errors of the direct indicating compass and to evolve aninstrument giving automatic continuous direction which could be fed to other instruments. Although a number of these systemshave been designed using different detecting and stabilizing techniques, the gyro stabilized remote indicating (gyro-magnetic)compass gradually evolved.
General5. The gyro-magnetic compass consists essentially of a magnetic compass whose indications are stabilized gyroscopically sothat the effects of turning and acceleration errors are reduced. A gyroscope is unaffected by changing magnetic fields or bynormal aircraft accelerations but its heading indications may be inaccurate due to the effect of precessional forces caused byfriction, incorrect balance etc. Since the commonly used detecting element, the fluxvalve, is pendulously suspended, it isaffected by accelerations. Therefore, the principle underlying the gyro-magnetic system is to integrate the heading indication of
DO NOT DISTRIBUTE AP 3456
Page 33 : Wed Jan 02 02:28:38 2002 Heading 3- 2- 1- 2
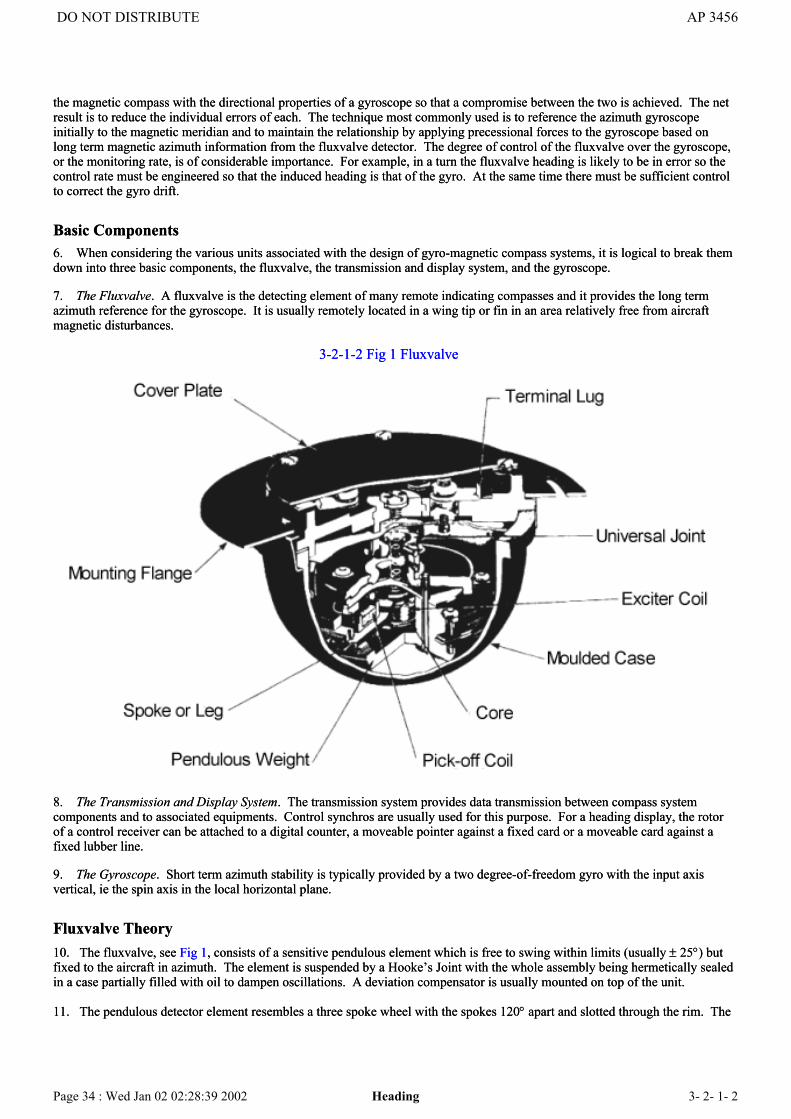
the magnetic compass with the directional properties of a gyroscope so that a compromise between the two is achieved. The netresult is to reduce the individual errors of each. The technique most commonly used is to reference the azimuth gyroscopeinitially to the magnetic meridian and to maintain the relationship by applying precessional forces to the gyroscope based onlong term magnetic azimuth information from the fluxvalve detector. The degree of control of the fluxvalve over the gyroscope,or the monitoring rate, is of considerable importance. For example, in a turn the fluxvalve heading is likely to be in error so thecontrol rate must be engineered so that the induced heading is that of the gyro. At the same time there must be sufficient controlto correct the gyro drift.
Basic Components6. When considering the various units associated with the design of gyro-magnetic compass systems, it is logical to break themdown into three basic components, the fluxvalve, the transmission and display system, and the gyroscope.
7. The Fluxvalve. A fluxvalve is the detecting element of many remote indicating compasses and it provides the long termazimuth reference for the gyroscope. It is usually remotely located in a wing tip or fin in an area relatively free from aircraftmagnetic disturbances.
3-2-1-2 Fig 1 Fluxvalve
8. The Transmission and Display System. The transmission system provides data transmission between compass systemcomponents and to associated equipments. Control synchros are usually used for this purpose. For a heading display, the rotorof a control receiver can be attached to a digital counter, a moveable pointer against a fixed card or a moveable card against afixed lubber line.
9. The Gyroscope. Short term azimuth stability is typically provided by a two degree-of-freedom gyro with the input axisvertical, ie the spin axis in the local horizontal plane.
Fluxvalve Theory10. The fluxvalve, see Fig 1, consists of a sensitive pendulous element which is free to swing within limits (usually ± 25°) butfixed to the aircraft in azimuth. The element is suspended by a Hooke’s Joint with the whole assembly being hermetically sealedin a case partially filled with oil to dampen oscillations. A deviation compensator is usually mounted on top of the unit.
11. The pendulous detector element resembles a three spoke wheel with the spokes 120° apart and slotted through the rim. The
DO NOT DISTRIBUTE AP 3456
Page 34 : Wed Jan 02 02:28:39 2002 Heading 3- 2- 1- 2

rim forms a collector horn for each spoke. The horns and spokes are made up of a series of metal laminations having a highmagnetic permeability. Each spoke has a vertical cross-section similar to that shown in Fig 2. The spoke consists of twosuperimposed legs which are separated by plastic material and opened out to enclose the central hub cone.
3-2-1-2 Fig 2 Vertical Cross-section of Spoke
This cone has an exciter coil wound round it on a vertical axis, and each spoke has a pick-off coil wound round both legs on ahorizontal axis. The exciter coil is fed with 400 Hz single phase AC. The output of the secondary or pick-off coil is an 800 Hzsingle phase AC current, the amplitude and phase representing the relationship of magnetic North to the aircraft longitudinal axis(magnetic heading).
12. In order to appreciate the operation of the fluxvalve it is necessary to consider an individual spoke. The function of a spokewill be developed in a series of diagrams (Figs 3 to 10).
13. If a single coil is placed in a magnetic field, the magnetic flux passing through the coil is maximum when the axis of thecoil is in line with the direction of the field, zero when the coil lies at right angles to the field, and maximum but of oppositesense relative to the coil when turned 180° from its original position. For a coil placed at an angle θ to a field of strength H (seeFig 3) the field can be resolved into two components, one along the coil equal to H cos θ and the other at right angles to the coilequal to H sin θ. The H cos θ component is parallel to the coil and is the effective flux producing element. Therefore, the totalflux passing through the coil is proportional to the cosine of the angle between the direction of the coil axis and the direction ofthe field. The coil output curve is shown at Fig 4. If the coil is in the horizontal plane with its axis parallel with the aircraftlongitudinal axis, its output is affected by the horizontal component of the Earth’s magnetic field and the flux passing throughthe coil is proportional to the magnetic heading of the aircraft.
3-2-1-2 Fig 3 Magnetic Flux Components
DO NOT DISTRIBUTE AP 3456
Page 35 : Wed Jan 02 02:28:39 2002 Heading 3- 2- 1- 2
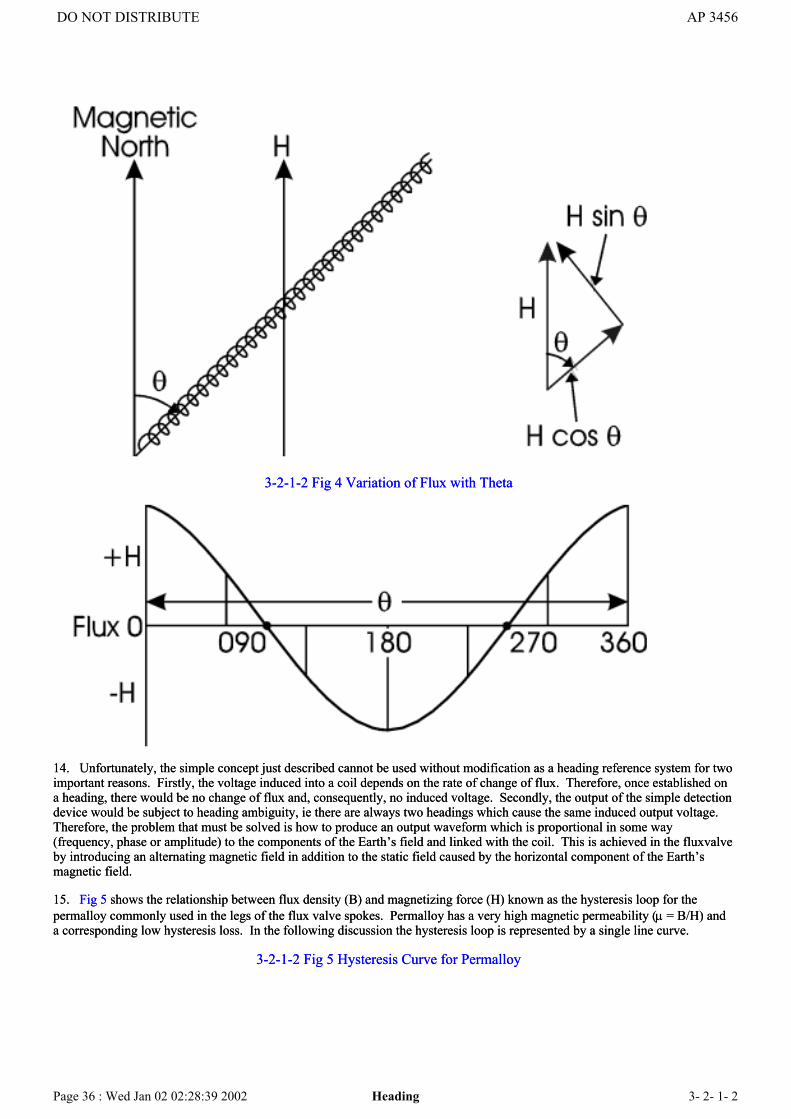
3-2-1-2 Fig 4 Variation of Flux with Theta
14. Unfortunately, the simple concept just described cannot be used without modification as a heading reference system for twoimportant reasons. Firstly, the voltage induced into a coil depends on the rate of change of flux. Therefore, once established ona heading, there would be no change of flux and, consequently, no induced voltage. Secondly, the output of the simple detectiondevice would be subject to heading ambiguity, ie there are always two headings which cause the same induced output voltage.Therefore, the problem that must be solved is how to produce an output waveform which is proportional in some way(frequency, phase or amplitude) to the components of the Earth’s field and linked with the coil. This is achieved in the fluxvalveby introducing an alternating magnetic field in addition to the static field caused by the horizontal component of the Earth’smagnetic field.
15. Fig 5 shows the relationship between flux density (B) and magnetizing force (H) known as the hysteresis loop for thepermalloy commonly used in the legs of the flux valve spokes. Permalloy has a very high magnetic permeability (µ = B/H) anda corresponding low hysteresis loss. In the following discussion the hysteresis loop is represented by a single line curve.
3-2-1-2 Fig 5 Hysteresis Curve for Permalloy
DO NOT DISTRIBUTE AP 3456
Page 36 : Wed Jan 02 02:28:39 2002 Heading 3- 2- 1- 2

16. One spoke of the three-spoke fluxvalve is shown diagrammatically in Fig 6. It consists of a pair of soft iron (usuallypermalloy) cones each wound with a primary coil. The winding on one core is the reverse of that on the other. The AC supplyis just sufficient, at peak power, to saturate magnetically each of the parallel soft iron cores. A secondary coil, wound round thetwo primaries, is linked with the circuit, and any change of flux through it induces a voltage and current flows.
3-2-1-2 Fig 6 Simple Fluxvalve
17. Fig 7 shows the 400 Hz alternating flux induced in the top leg by the excitation current considering only the top leg of thespoke and the effect of the excitation.
3-2-1-2 Fig 7 The Effect of Excitation Current in the Top Leg Only
DO NOT DISTRIBUTE AP 3456
Page 37 : Wed Jan 02 02:28:39 2002 Heading 3- 2- 1- 2

18. Now considering the bottom leg only; the flux induced in this leg by the excitation current will at any instant be in theopposite direction to that induced in the top leg, ie the flux in the bottom leg is 180° out of phase with the flux in the top leg asshown in Fig 8.
3-2-1-2 Fig 8 The Effect of the Excitation Current in the Bottom Leg Only
19. Since the top and bottom legs are identical, the amplitudes of the flux of the two legs are equal but 180° out of phase witheach other relative to the pick-off coil, which is wound round both legs. Therefore, the resultant flux cutting the pick-off coil,which is the algebraic sum of the flux in the top and bottom legs is zero as shown in Fig 9.
3-2-1-2 Fig 9 The Effect of the Excitation Current in Both Legs
DO NOT DISTRIBUTE AP 3456
Page 38 : Wed Jan 02 02:28:40 2002 Heading 3- 2- 1- 2

20. If the horizontal component of the Earth’s magnetic field (H) is now added in line with the spoke, it will induce a steadyflux in both legs of the spoke which will be added to the flux due to the excitation current. The effect, as shown in Fig 10, willbe to bias the datum for the magnetizing force, due to the excitation current, on the B-H curve by an amount equal to H. Thestrength of the excitation current is so arranged that the effect of the introduction of the Earth’s magnetic field component is tobring the flux density curves in Fig 10 onto the saturation part of the hysteresis curve. The resultant flux cutting the pick-offcoil, which is the algebraic sum of the fluxes in the top and bottom legs, will no longer be zero but will have a resultantproportional in amplitude to heading. The emf induced in the pick-off coil is proportional to the rate of change of flux cuttingthe coil and therefore will have a waveform approximating to a sine wave at 800 Hz, ie twice the frequency of the excitationcurrent as shown in Fig 10. It has been found by experiment that the amplitude of the emf is proportional to H. Therefore, theemf in the pick-off coil is a measure of H, ie the horizontal component of the Earth’s magnetic field in line with the spoke. Thisshould be apparent from Fig 10 in that, if a greater H is detected, the excitation current is biased further from the mid-point ofthe hysteresis curve, and the imbalance between the upper and lower leg fluxes will increase. Therefore, a greater resultant fluxexists which will induce an emf of greater amplitude in the pick-off coil. A plot of the amplitude of the pick-off coil outputvoltage would show that it varies as the cosine of the magnetic heading.
3-2-1-2 Fig 10 The Combine Effects of the Excitation Current and the Component of the Earth's Field
DO NOT DISTRIBUTE AP 3456
Page 39 : Wed Jan 02 02:28:40 2002 Heading 3- 2- 1- 2

21. Limitations of the Simple Single Spoke Detector. It should be apparent that there are two magnetic headings correspondingto zero flux (90° and 270°) and two headings corresponding to a maximum flux. The two maximum values give the samereading on an AC voltmeter since the instrument cannot take into account the direction of the voltage. For any other value offlux (other than zero), there will be four headings corresponding to a single voltmeter reading. This ambiguity is overcome byusing a fluxvalve having three spokes (each spoke similar to the single spoked device previously discussed) with 120° separationas shown in Fig 11. Regardless of the heading, at least two of the spokes will have a voltage induced and their vector sum pointsto magnetic North (see Fig 12). The simple one-spoke detector suffers from another limitation in that the value of H changeswith magnetic latitude. This produces a change in the static flux linking the spoke, even though the heading may remainunchanged. This limitation is overcome in the three-spoke fluxvalve because the flux associated with each spoke will change inproportion to the change in H. The resultant field across the receiver stator is still aligned with H (see Fig 13).
3-2-1-2 Fig 11 Detector Unit and Transmission System - schematic
DO NOT DISTRIBUTE AP 3456
Page 40 : Wed Jan 02 02:28:40 2002 Heading 3- 2- 1- 2

3-2-1-2 Fig 12 Operation of the Three-spoke Fluxvalve
3-2-1-2 Fig 13 Eliminating Latitude Ambiguity
3-2-1-2 Fig 12 Operation of the Three-spoke Fluxvalve
3-2-1-2 Fig 13 Eliminating Latitude Ambiguity
DO NOT DISTRIBUTE AP 3456
Page 41 : Wed Jan 02 02:28:40 2002 Heading 3- 2- 1- 2
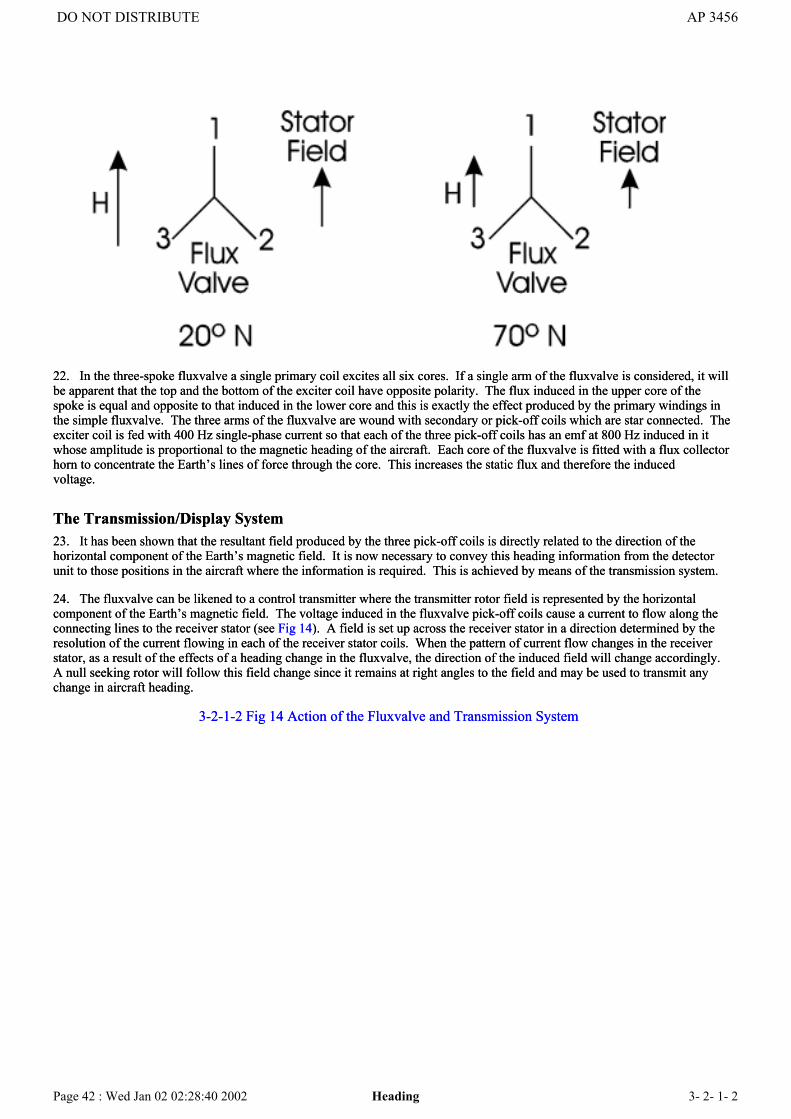
22. In the three-spoke fluxvalve a single primary coil excites all six cores. If a single arm of the fluxvalve is considered, it willbe apparent that the top and the bottom of the exciter coil have opposite polarity. The flux induced in the upper core of thespoke is equal and opposite to that induced in the lower core and this is exactly the effect produced by the primary windings inthe simple fluxvalve. The three arms of the fluxvalve are wound with secondary or pick-off coils which are star connected. Theexciter coil is fed with 400 Hz single-phase current so that each of the three pick-off coils has an emf at 800 Hz induced in itwhose amplitude is proportional to the magnetic heading of the aircraft. Each core of the fluxvalve is fitted with a flux collectorhorn to concentrate the Earth’s lines of force through the core. This increases the static flux and therefore the inducedvoltage.
The Transmission/Display System23. It has been shown that the resultant field produced by the three pick-off coils is directly related to the direction of thehorizontal component of the Earth’s magnetic field. It is now necessary to convey this heading information from the detectorunit to those positions in the aircraft where the information is required. This is achieved by means of the transmission system.
24. The fluxvalve can be likened to a control transmitter where the transmitter rotor field is represented by the horizontalcomponent of the Earth’s magnetic field. The voltage induced in the fluxvalve pick-off coils cause a current to flow along theconnecting lines to the receiver stator (see Fig 14). A field is set up across the receiver stator in a direction determined by theresolution of the current flowing in each of the receiver stator coils. When the pattern of current flow changes in the receiverstator, as a result of the effects of a heading change in the fluxvalve, the direction of the induced field will change accordingly.A null seeking rotor will follow this field change since it remains at right angles to the field and may be used to transmit anychange in aircraft heading.
3-2-1-2 Fig 14 Action of the Fluxvalve and Transmission System
DO NOT DISTRIBUTE AP 3456
Page 42 : Wed Jan 02 02:28:40 2002 Heading 3- 2- 1- 2
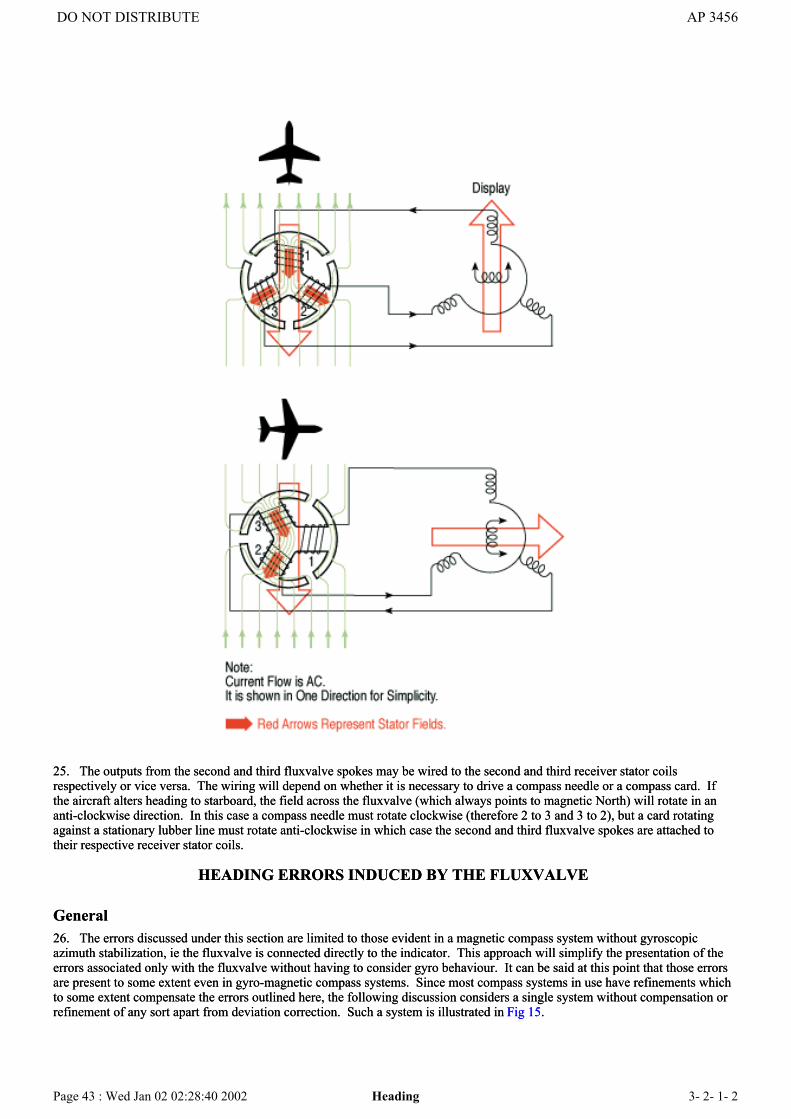
25. The outputs from the second and third fluxvalve spokes may be wired to the second and third receiver stator coilsrespectively or vice versa. The wiring will depend on whether it is necessary to drive a compass needle or a compass card. Ifthe aircraft alters heading to starboard, the field across the fluxvalve (which always points to magnetic North) will rotate in ananti-clockwise direction. In this case a compass needle must rotate clockwise (therefore 2 to 3 and 3 to 2), but a card rotatingagainst a stationary lubber line must rotate anti-clockwise in which case the second and third fluxvalve spokes are attached totheir respective receiver stator coils.
HEADING ERRORS INDUCED BY THE FLUXVALVE
General26. The errors discussed under this section are limited to those evident in a magnetic compass system without gyroscopicazimuth stabilization, ie the fluxvalve is connected directly to the indicator. This approach will simplify the presentation of theerrors associated only with the fluxvalve without having to consider gyro behaviour. It can be said at this point that those errorsare present to some extent even in gyro-magnetic compass systems. Since most compass systems in use have refinements whichto some extent compensate the errors outlined here, the following discussion considers a single system without compensation orrefinement of any sort apart from deviation correction. Such a system is illustrated in Fig 15.
DO NOT DISTRIBUTE AP 3456
Page 43 : Wed Jan 02 02:28:40 2002 Heading 3- 2- 1- 2

3-2-1-2 Fig 15 Simple Remote Indicating Compass
Detector Tilt Error27. The fluxvalve will provide a correct output of magnetic heading only if the detecting element is maintained in the localhorizontal plane, ie only detecting the horizontal component of the Earth’s magnetic field (H). Any vertical component of theEarth’s field (Z) linked through the fluxvalve coils will cause an error in the output heading. At this stage it is sufficient to notethat even small tilts can cause significant errors in heading. In ostensibly straight and level flight, accelerations act upon thefluxvalve which tilt it slightly and small errors result. During manoeuvres the accelerations, and hence the tilts and errors, canbe quite large.
28. Fig 16 illustrates a fluxvalve fitted in an aircraft on a heading of magnetic North. The currents induced in spokes 1, 2 and 3are such that they produce component magnetic fields in the error detector which compound to produce a resultant magneticfield in a direction indicating magnetic North. Only the horizontal component (H) threads the fluxvalve spokes to produce thisresult.
3-2-1-2 Fig 16 Indication of Magnetic North
3-2-1-2 Fig 17 Effect of a Gross Tilt to Port
DO NOT DISTRIBUTE AP 3456
Page 44 : Wed Jan 02 02:28:41 2002 Heading 3- 2- 1- 2
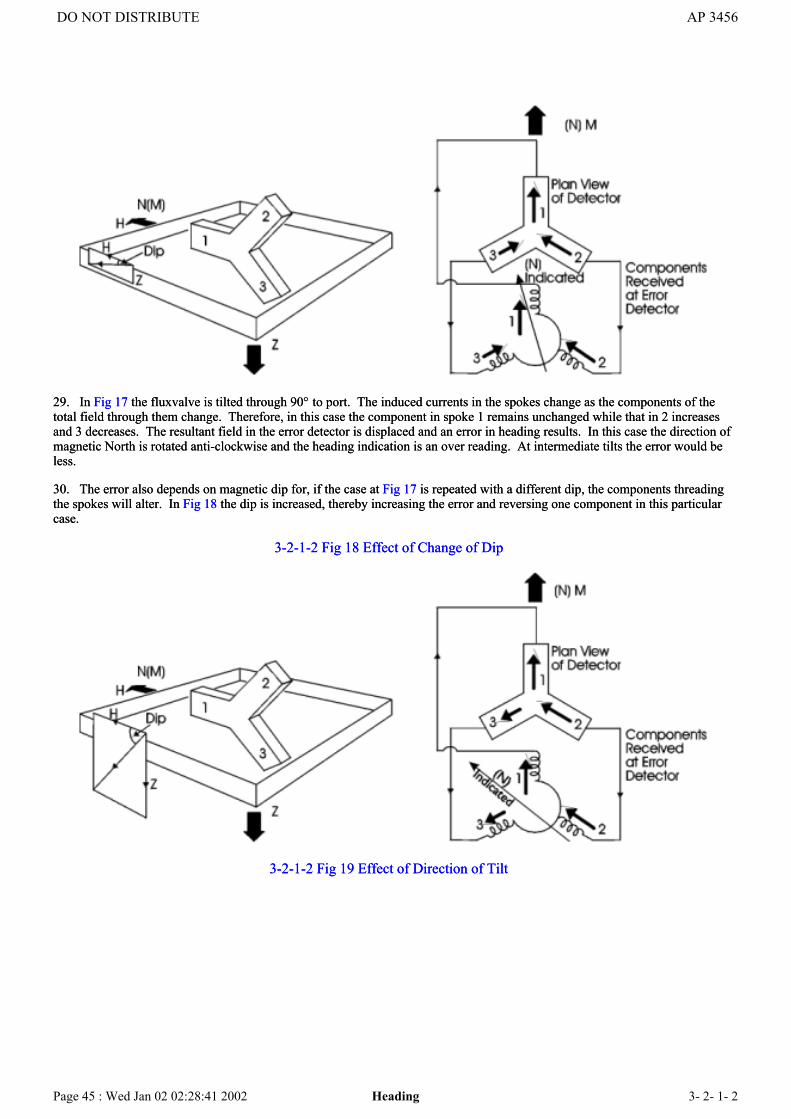
29. In Fig 17 the fluxvalve is tilted through 90° to port. The induced currents in the spokes change as the components of thetotal field through them change. Therefore, in this case the component in spoke 1 remains unchanged while that in 2 increasesand 3 decreases. The resultant field in the error detector is displaced and an error in heading results. In this case the direction ofmagnetic North is rotated anti-clockwise and the heading indication is an over reading. At intermediate tilts the error would beless.
30. The error also depends on magnetic dip for, if the case at Fig 17 is repeated with a different dip, the components threadingthe spokes will alter. In Fig 18 the dip is increased, thereby increasing the error and reversing one component in this particularcase.
3-2-1-2 Fig 18 Effect of Change of Dip
3-2-1-2 Fig 19 Effect of Direction of Tilt
DO NOT DISTRIBUTE AP 3456
Page 45 : Wed Jan 02 02:28:41 2002 Heading 3- 2- 1- 2

31. The direction of tilt relative to the total field is also important. Fig 19 shows how a tilt in the direction of the total field mayproduce no error. In this case the flux flow through each spoke changes but the proportion of one to the other remainsunchanged. The intensity of the resultant field increases but the direction remains the same. A second case exists in which thetilt is in the opposite sense as in Fig 20. Here, if the tilt exceeds 90° − dip, the flux flow in each spoke is reversed and the erroris 180°.
32. Therefore, the error produced by tilting depends on the following factors:
a. Angle of tilt
b. Direction of tilt.
c. Magnetic dip (δ)
3-2-1-2 Fig 20 Tilt Exceeds 90 deg minus Dip
3-2-1-2 Fig 21 Typical Errors in Magnetic Heading Due to Tilt
DO NOT DISTRIBUTE AP 3456
Page 46 : Wed Jan 02 02:28:41 2002 Heading 3- 2- 1- 2

Typical values of the error in the fluxvalve output are shown against the direction θ of the axis of tilt for various values of tilt inFig 21. In general, the bigger the tilt and the dip, the larger the error. Gross errors occur when tilt is greater than 90 − δ due tofield reversal (see para 31).
33. A number of factors exist during flight which can cause fluxvalve tilts; these include:
a. Central acceleration caused by aircraft turns.
b. Coriolis accelerations.
c. Vehicle movement (rhumb line) acceleration.
d. Fluxvalve vibration.
e. Aircraft linear acceleration.
These are discussed in paras 44-49.
THEORY OF THE GYRO-MAGNETIC COMPASS
General34. To overcome the inaccuracies in magnetic heading obtained from a tilted fluxvalve, a gyro must be added to the system.The incorporation of a gyro introduces a number of new errors in the heading output of the system, but these errors are morethan offset by the improvement in accuracy which results from having an accurate mechanical datum about which any change ofheading may be measured. Any tendency for the gyro to drift away from its alignment datum may be checked by slaving it tothe fluxvalve when the aircraft is straight and level.
Mechanization35. The simple schematic at Fig 22 shows a basic, uncorrected and uncompensated gyro-magnetic compass system. Thefluxvalve magnetic heading is compared with gyro heading at an error detection device. If the two headings are not equal, anerror signal is developed, amplified and used to precess the gyro. This precession continues until the two headings are equal andthe correct heading is displayed. An important principle is illustrated here. Since gyro heading is displayed, if an error exists ingyro heading, the displayed heading must also be in error.
DO NOT DISTRIBUTE AP 3456
Page 47 : Wed Jan 02 02:28:41 2002 Heading 3- 2- 1- 2

36. The method of mechanizing the gyro precession loop is of extreme importance. Three methods of accomplishing the taskare as follows:
a. Step function (bang-bang) correction.
b. Linear function correction
3-2-1-2 Fig 22 Basic Gyro-magnetic Compass
c. Limited linear function correction.
37. The step function correction technique requires the gyro-fluxvalve error signal (ε) to be removed at a fixed rate (Wc)whenever it is generated (see Fig 23a). Not only is such a system difficult to engineer, but gyro behaviour suffers severely fromnodding or nutation and secondary precession.
38. The linear correction technique (Fig 23b) appears to be ideal since the correction rate (Wc) is proportional to the errorsignal (ε), ie for small errors, small torques are applied and vice versa. A problem exists when very large errors occur. Forexample, modern gyro magnetic compasses commonly use the random gyro azimuth technique in which the gyro spin axis canpoint in any direction relative to magnetic North or aircraft heading. When the system is initially switched on, 180° can existbetween gyro and magnetic heading. If the system were mechanized to provide an adequate rate of precession for small errors,180° would demand an excessive precession rate. Therefore, the purely linear system also has its limitations.
39. The common solution to the precession mechanization problem is a compromise between the step function and the linearfunction techniques - namely the method shown in Fig 23c, the limited linear technique. In a gyro-magnetic compass system inwhich the gyro is controlled by the limited linear concept, gyro precession rates are proportional to the error signal for smalldiscrepancies. For example, in Fig 23c, the gyro precession rate (Wc) is proportional to ε, where ε is ≤ 2°, however Wc cannotexceed 2° per min regardless of the size of ε
3-2-1-2 Fig 23 Gyro Correction Techniques
DO NOT DISTRIBUTE AP 3456
Page 48 : Wed Jan 02 02:28:42 2002 Heading 3- 2- 1- 2
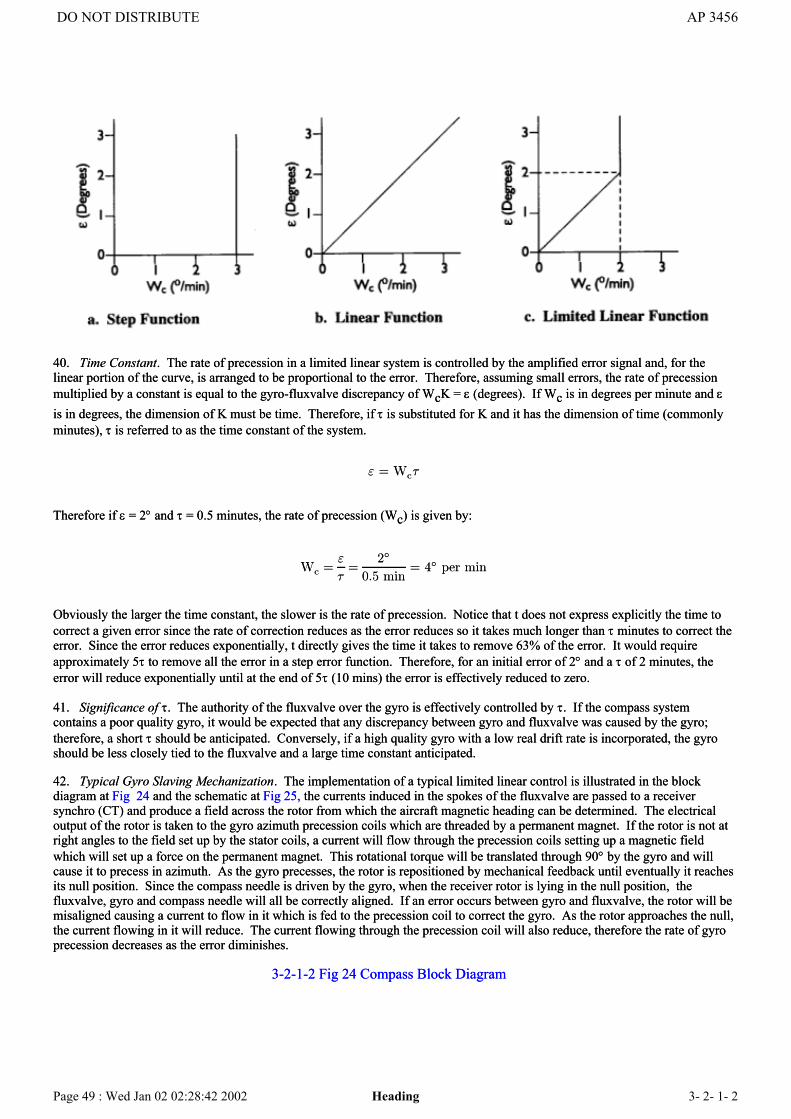
40. Time Constant. The rate of precession in a limited linear system is controlled by the amplified error signal and, for thelinear portion of the curve, is arranged to be proportional to the error. Therefore, assuming small errors, the rate of precessionmultiplied by a constant is equal to the gyro-fluxvalve discrepancy of WcK = ε (degrees). If Wc is in degrees per minute and εis in degrees, the dimension of K must be time. Therefore, if τ is substituted for K and it has the dimension of time (commonlyminutes), τ is referred to as the time constant of the system.
" = Wc¿
Therefore if ε = 2° and τ = 0.5 minutes, the rate of precession (Wc) is given by:
Wc ="
¿=
2±
0.5 min= 4± per min
Obviously the larger the time constant, the slower is the rate of precession. Notice that t does not express explicitly the time tocorrect a given error since the rate of correction reduces as the error reduces so it takes much longer than τ minutes to correct theerror. Since the error reduces exponentially, t directly gives the time it takes to remove 63% of the error. It would requireapproximately 5τ to remove all the error in a step error function. Therefore, for an initial error of 2° and a τ of 2 minutes, theerror will reduce exponentially until at the end of 5τ (10 mins) the error is effectively reduced to zero.
41. Significance of τ. The authority of the fluxvalve over the gyro is effectively controlled by τ. If the compass systemcontains a poor quality gyro, it would be expected that any discrepancy between gyro and fluxvalve was caused by the gyro;therefore, a short τ should be anticipated. Conversely, if a high quality gyro with a low real drift rate is incorporated, the gyroshould be less closely tied to the fluxvalve and a large time constant anticipated.
42. Typical Gyro Slaving Mechanization. The implementation of a typical limited linear control is illustrated in the blockdiagram at Fig 24 and the schematic at Fig 25, the currents induced in the spokes of the fluxvalve are passed to a receiversynchro (CT) and produce a field across the rotor from which the aircraft magnetic heading can be determined. The electricaloutput of the rotor is taken to the gyro azimuth precession coils which are threaded by a permanent magnet. If the rotor is not atright angles to the field set up by the stator coils, a current will flow through the precession coils setting up a magnetic fieldwhich will set up a force on the permanent magnet. This rotational torque will be translated through 90° by the gyro and willcause it to precess in azimuth. As the gyro precesses, the rotor is repositioned by mechanical feedback until eventually it reachesits null position. Since the compass needle is driven by the gyro, when the receiver rotor is lying in the null position, thefluxvalve, gyro and compass needle will all be correctly aligned. If an error occurs between gyro and fluxvalve, the rotor will bemisaligned causing a current to flow in it which is fed to the precession coil to correct the gyro. As the rotor approaches the null,the current flowing in it will reduce. The current flowing through the precession coil will also reduce, therefore the rate of gyroprecession decreases as the error diminishes.
3-2-1-2 Fig 24 Compass Block Diagram
DO NOT DISTRIBUTE AP 3456
Page 49 : Wed Jan 02 02:28:42 2002 Heading 3- 2- 1- 2

3-2-1-2 Fig 25 Typical Gyro Slaving Mechanization (Simplified Schematic)
43. The Change in τ with H. Fig 26 illustrates the relationship between H field strength and gyro precession rate in a typicalcompass system. As the H field strength decreases due to northward movement, the amplitudes of the voltages induced in thefluxvalve spokes are reduced proportionally. Although the direction of the resolved voltages remains the same, the size of thecurrents transmitted to the receiver synchro are smaller. Therefore, the field strength across the receiver stator will be reducedand the rotor current flow for any given misalignment will decrease. Since the amount of torque applied to the gyro azimuthprecession device depends on rotor current, the precession will also decrease. The reduction in gyro correction rate with adecrease of H field strength (or an increase in magnetic latitude) results in effectively the same phenomenon as would beachieved by increasing τ. An increase in τ will make the system sluggish and will also tend to magnify any hang-off errorpresent (see para 50). However, if the aircraft is operating at high latitudes, the fluxvalve is less reliable due to the reduction ofH field strength and an automatic increase of τ is acceptable. Since τ changes with H field strength, the H field strength must bequoted with τ to make τ meaningful. The H field strength at Greenwich is the common datum quoted by British gyro-magneticcompass system manufacturers.
DO NOT DISTRIBUTE AP 3456
Page 50 : Wed Jan 02 02:28:42 2002 Heading 3- 2- 1- 2
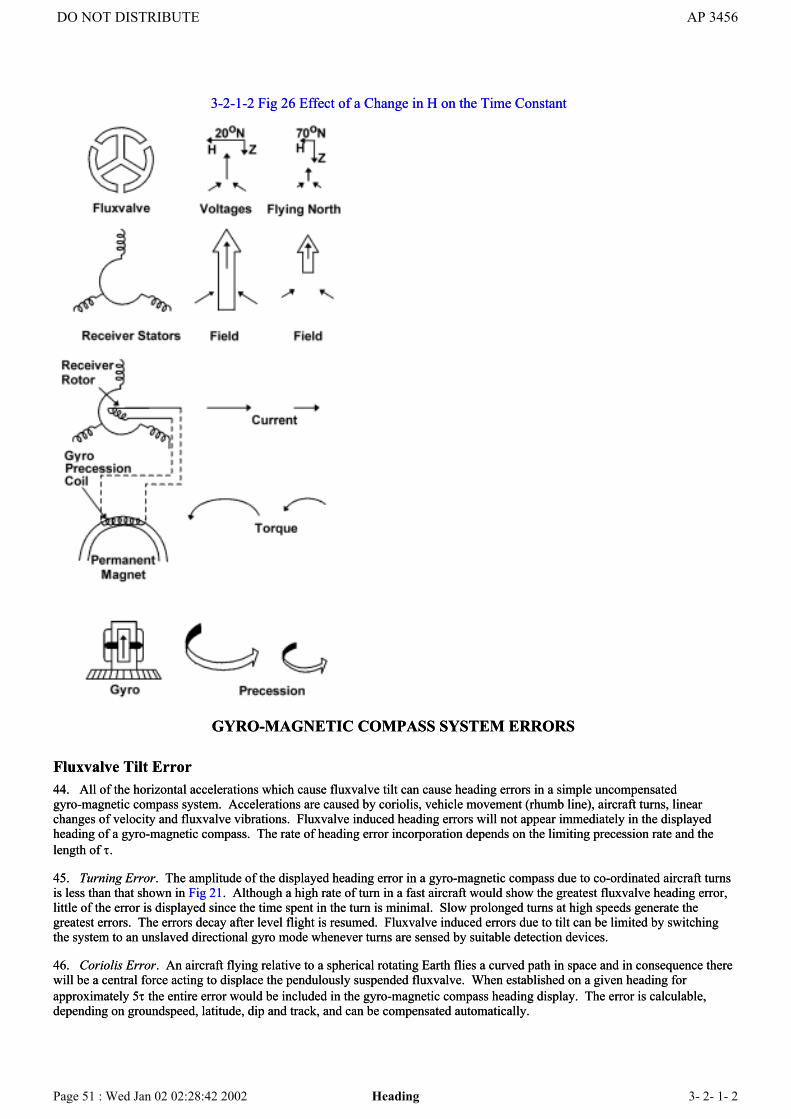
3-2-1-2 Fig 26 Effect of a Change in H on the Time Constant
GYRO-MAGNETIC COMPASS SYSTEM ERRORS
Fluxvalve Tilt Error44. All of the horizontal accelerations which cause fluxvalve tilt can cause heading errors in a simple uncompensatedgyro-magnetic compass system. Accelerations are caused by coriolis, vehicle movement (rhumb line), aircraft turns, linearchanges of velocity and fluxvalve vibrations. Fluxvalve induced heading errors will not appear immediately in the displayedheading of a gyro-magnetic compass. The rate of heading error incorporation depends on the limiting precession rate and thelength of τ.
45. Turning Error. The amplitude of the displayed heading error in a gyro-magnetic compass due to co-ordinated aircraft turnsis less than that shown in Fig 21. Although a high rate of turn in a fast aircraft would show the greatest fluxvalve heading error,little of the error is displayed since the time spent in the turn is minimal. Slow prolonged turns at high speeds generate thegreatest errors. The errors decay after level flight is resumed. Fluxvalve induced errors due to tilt can be limited by switchingthe system to an unslaved directional gyro mode whenever turns are sensed by suitable detection devices.
46. Coriolis Error. An aircraft flying relative to a spherical rotating Earth flies a curved path in space and in consequence therewill be a central force acting to displace the pendulously suspended fluxvalve. When established on a given heading forapproximately 5τ the entire error would be included in the gyro-magnetic compass heading display. The error is calculable,depending on groundspeed, latitude, dip and track, and can be compensated automatically.
DO NOT DISTRIBUTE AP 3456
Page 51 : Wed Jan 02 02:28:42 2002 Heading 3- 2- 1- 2

47. Vehicle Movement Error. Whenever flying a true or magnetic rhumb line the aircraft must turn to maintain a constant trackwith reference to converging meridians. As with coriolis error, the acceleration displaces the detector from the local horizontalplane and the entire resultant heading error would appear in the displayed heading after about 5τ. A correction can be applied ina similar manner to the coriolis error.
48. Fluxvalve Vibration. Fluxvalve vibration results in a heading oscillation, the mean of which is not the actual mean heading.Since the gyro slaving loop tends to average fluxvalve headings over a period of time, the gyro would eventually be precessed tothe erroneous fluxvalve mean heading. The effect can be limited to small values by careful design of the pendulous detectordamping mechanism and through consideration of the location of the detector in the aircraft.
Northerly Instability49. Northerly instability or weaving is a heading oscillation experienced in high speed aircraft attempting to fly straight andlevel at or near a heading of magnetic North. Starboard bank of the aircraft induces starboard tilt, and this causes an underreading of the heading. Another way of looking at this is to imagine that the magnetic meridian rotates clockwise. Thus, if anaircraft on North banks to starboard to correct a small error, the magnetic meridian rotates in the same direction. The aircraftcontinues to turn and eventually reaches the false meridian. On levelling out, the fluxvalve senses the true meridian and starts toprecess the gyro towards it. The indicated heading changes and the aircraft is banked to port to regain a northerly indicatedheading. This tilts the fluxvalve which rotates the meridian to port. The new false meridian is chased until, upon resuming levelflight, the sensor detects the true meridian again and precesses the gyro to starboard. The cyclic pattern is repeated and theamplitude can be as great as 6°. The amplitude of the weave tends to increase with an increase in dip and aircraft velocity, anddecreases with an increase in τ. Weaving can thus be reduced to a certain extent by increasing the time constant of the compasssystem. However this leads to a sluggish response and a large hang-off error (para 50).
Hang-off Error50. Gyroscopic drift is a constant source of error signal in a gyro-magnetic compass system, and although it will becompensated for by the precession loop at a rate dependent on τ, at any given time there must be an increment of error present.This is known variously as hang-off error, stand-off error, or simply as velocity lag. Gyro drift may be due to:
a. Real Drift. Real drift can only be reduced by the incorporation of a high quality azimuth gyro having a low real driftrate.
b. Earth Rate. Apparent azimuth gyro drift due to Earth rotation can be countered by correcting the gyro at a rate of 15 sinlat° /hr. The correction can be supplied through a manually set latitude correction mechanism, automatically from acomputer using GPI latitude, or through a constantly biased gyro. The latter technique employs a mass imbalance in thegyro which constantly precesses the gyro at a predetermined rate, usually to compensate for an appropriate latitude for theaircraft's area of operation, say 51° N.
c. Transport Wander. To compensate for transport wander due to the convergence of geographic meridians the gyro mustbe corrected at a rate equal to:
U
60tan lat±/hr where U = East-West groundspeed
The correction can be applied manually or through a computer using inputs of groundspeed, heading and latitude. Howeveralthough the gyro can be compensated in this way for the apparent change in the direction of geographic North, the output fromthe fluxvalve is in terms of magnetic North. Therefore as the aircraft moves over the Earth there will be a difference betweenfluxvalve and gyro since the variation is changing (unless the aircraft is flying along an isogonal). To remove this error variationmust be applied to the output of the detector unit before the gyro error loop so that both the gyro and fluxvalve give directionalinformation relative to true North. The value of variation can be inserted manually or by means of an automatic variation settingcontrol unit. Failure to update the variation value will result in small hang-off errors.
Gimbal Error51. When a 2 degree of freedom gyroscope with a horizontal spin axis is both banked and rolled, the outer gimbal must rotateto maintain orientation of the rotor axis, thereby inducing a heading error at the outer gimbal pick-off. The incidence of thiserror depends upon the angle of bank and the angular difference between the spin axis and the longitudinal axis and as in mostsystems the spin axis direction is arbitrary relative to North the error is not easily predicted. Although the error disappears when
DO NOT DISTRIBUTE AP 3456
Page 52 : Wed Jan 02 02:28:42 2002 Heading 3- 2- 1- 2

the aircraft is levelled, it will have accumulated in any GPI equipment, producing a small error in computed position.
Transmission Errors52. Overall system accuracy is lowered by the errors in the synchro systems. Typically each synchro might be expected to ahave an error in the order of 0.1° with an overall system error of perhaps 0.5°. This shows in a compass swing as a D or E error.
Compass Swinging Errors53. It is not possible to obtain absolute accuracy in compass swinging, and even refined methods are considered to be onlyaccurate to 0.2°.
Variation and Deviation Errors54. There are no reliable statistical data on the errors in charted values of variation, but they might be considered to varybetween 0.1° and 2°. Over the UK the uncertainty at height is considered to be within 1° but the value varies both with heightand locality. Setting of variation and deviation is likely to be accurate to 0.25°
A Refined Compass System55. Fig 27 depicts some of the methods of error reduction. Different methods of correction are possible for some of the errorsdepending on the whims of the individual manufacturer and the users considerations of experience and accuracy. Note thatcorrections may be made “up” or “down” stream of the gyro or a combination of both; there are disadvantages to all approaches.
56. The following description applies to Fig 27:
a. Hang-off. The computer supplies the quantities for Earth rate and meridian convergence to the error detector.Therefore, the rate of gyro drift sensed is reduced considerably and hang-off results from only random drift.
3-2-1-2 Fig 27 Ideal Gyro-magnetic Compass
b. Coriolis and Vehicle Movement Accelerations. The corrections for coriolis and vehicle movement are applied at thefluxvalve by reducing or increasing the output from the athwartships spokes.
DO NOT DISTRIBUTE AP 3456
Page 53 : Wed Jan 02 02:28:43 2002 Heading 3- 2- 1- 2

c. Gimbal Error. Gimbal error is eliminated by the use of a vertical gyro coupled with four gimbal suspension to keep theazimuth gyro and the azimuth pick-off synchro horizontal.
d. Operation on DG. The fluxvalve monitor and the computer rate of change variation are cut out when on DG. Theaccuracy of the heading then depends on random drift error, the error in the gyro correction terms and the statistical error ietransmission error.
e. Northerly Instability. Variable gain in the precession amplifier maintains the value of τ constant, for variable H, thusreducing weaving.
f. Coefficient D and E. A compensation is applied to counter coefficients D and E.
3-2-1-2 Fig 23a Step Function
3-2-1-2 Fig 23b Linear Function
DO NOT DISTRIBUTE AP 3456
Page 54 : Wed Jan 02 02:28:43 2002 Heading 3- 2- 1- 2

3-2-1-2 Fig 23c Limited Linear Function
Heading
3-2-1-2 Fig 23c Limited Linear Function
Heading
DO NOT DISTRIBUTE AP 3456
Page 55 : Wed Jan 02 02:28:43 2002 Heading 3- 2- 1- 3
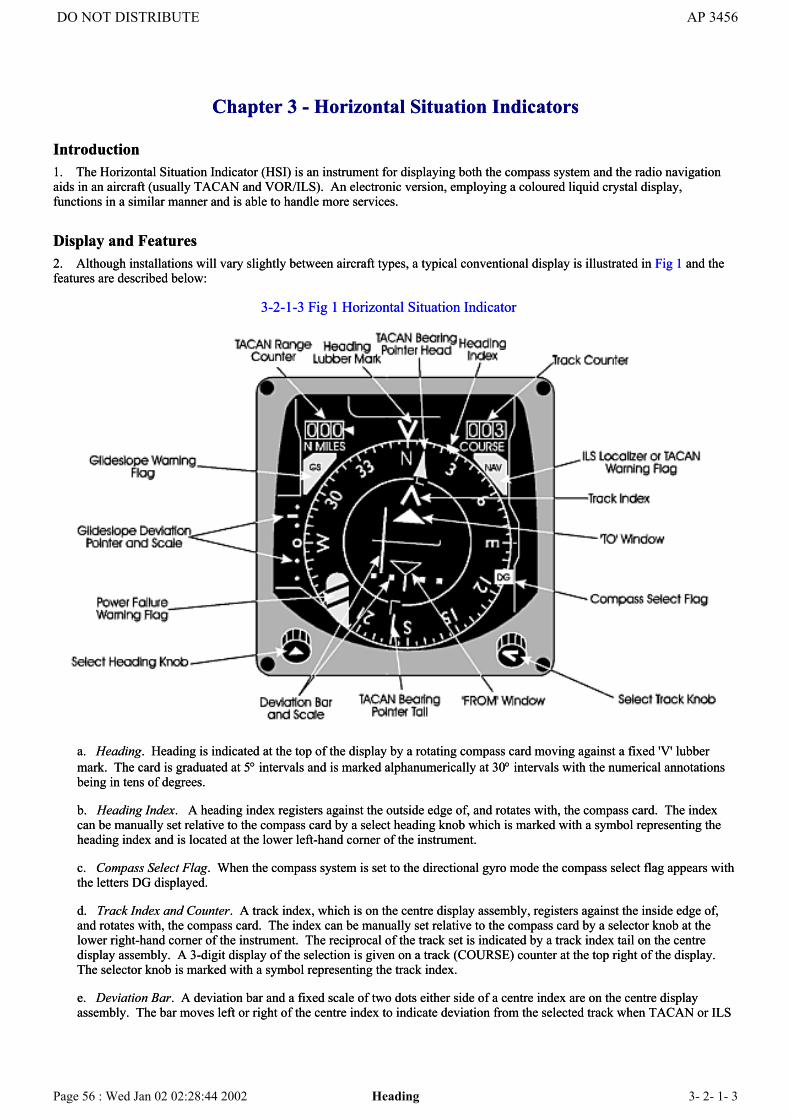
Chapter 3 - Horizontal Situation Indicators
Introduction1. The Horizontal Situation Indicator (HSI) is an instrument for displaying both the compass system and the radio navigationaids in an aircraft (usually TACAN and VOR/ILS). An electronic version, employing a coloured liquid crystal display,functions in a similar manner and is able to handle more services.
Display and Features2. Although installations will vary slightly between aircraft types, a typical conventional display is illustrated in Fig 1 and thefeatures are described below:
3-2-1-3 Fig 1 Horizontal Situation Indicator
a. Heading. Heading is indicated at the top of the display by a rotating compass card moving against a fixed 'V' lubbermark. The card is graduated at 5° intervals and is marked alphanumerically at 30° intervals with the numerical annotationsbeing in tens of degrees.
b. Heading Index. A heading index registers against the outside edge of, and rotates with, the compass card. The indexcan be manually set relative to the compass card by a select heading knob which is marked with a symbol representing theheading index and is located at the lower left-hand corner of the instrument.
c. Compass Select Flag. When the compass system is set to the directional gyro mode the compass select flag appears withthe letters DG displayed.
d. Track Index and Counter. A track index, which is on the centre display assembly, registers against the inside edge of,and rotates with, the compass card. The index can be manually set relative to the compass card by a selector knob at thelower right-hand corner of the instrument. The reciprocal of the track set is indicated by a track index tail on the centredisplay assembly. A 3-digit display of the selection is given on a track (COURSE) counter at the top right of the display.The selector knob is marked with a symbol representing the track index.
e. Deviation Bar. A deviation bar and a fixed scale of two dots either side of a centre index are on the centre displayassembly. The bar moves left or right of the centre index to indicate deviation from the selected track when TACAN or ILS
DO NOT DISTRIBUTE AP 3456
Page 56 : Wed Jan 02 02:28:44 2002 Heading 3- 2- 1- 3

information is selected. The bar indicates the relative position of the chosen track as selected by the track index.
f. TACAN Bearing. The magnetic bearing to a TACAN ground beacon is indicated by a green pointer head when readagainst the compass card. The tail of the pointer indicates the TACAN radial. The TACAN bearing and radial are alsodisplayed when ILS is selected.
g. To/From Indication. Two triangular indicator windows, 'to' and 'from' are on the centre display assembly. The 'to'window is adjacent to the track index and the 'from' window is adjacent to the tail of the track index. With TACANselected, a TACAN radial set on the track index and the bearing pointer locked on to a TACAN beacon, a white flag isdisplayed in the 'to' or 'from' window. The 'to' flag is displayed whenever the bearing from the TACAN is less than 90°from the selected TACAN radial. Conversely the 'from' flag shows white whenever the bearing from the TACAN beacon is90° or more from the selected TACAN radial.
h. TACAN Range. Range to a TACAN or DME beacon in nautical miles is shown on a 3-digit counter at the upper leftcorner of the instrument. A yellow bar obscures the counter when range information is invalid.
i. Glidepath Deviation Pointer. A pointer to the left of the compass card moves over a fixed vertical scale consisting oftwo dots above and two dots below a circle (representing the aircraft). The pointer is driven by the ILS equipment andindicates the vertical position of the ILS glidepath relative to the aircraft, eg if the pointer is above the circle the aircraft isbelow the glidepath.
j. Glidepath Warning. A red flag appears above the glidepath deviation scale when the glidepath information is invalid.
k. ILS Localizer or TACAN Bearing Warning. A red flag appears below the COURSE counter when the ILS localizer orthe TACAN bearing information is invalid.
l. Power Failure Warning. An orange flag with black diagonal stripes appears when the power to the HSI has failed orwhen an invalid signal is transmitted from the compass system.
ELECTRONIC HSI (EHSI)
Description3. The EHSI can be configured to provides more information than the HSI and employs a colour active matrix liquid crystaldisplay. It receives inputs from the aircraft compass, TACAN, VOR/ILS and, depending on aircraft fit, UHF and VHF homersand specialist navigational aids. In helicopters, the EHSI is also linked to the hovermeter.
Mode Select Panel4. A mode select panel will be available to each pilot position with buttons for selection of each available feature. A TransferMode (TM) switch enables the course selector display of one instrument to be transferred to the other. Therefore, for example,the TACAN radial can be set on one instrument and the ILS QDM on the other. Pushing the TM switch associated with theinstrument configured for ILS will transfer the ILS information to the other instrument.
Displays5. In different installations, display colours may vary depending upon which mode is selected. Fig 2 shows a typicalinstrument in VOR mode. When first switched on or after a power break the EHSI will have no mode indicated in the bottomright hand corner. In most cases, the numbered items described in the key are displayed only when the appropriate inputs arevalid.
6. Displays and Controls. Operation of the controls annotated on Fig 2 may depend upon the mode selected. A briefdescription of each is given below. The relevant Aircrew Manual will set out the precise operation of the system.
a. Heading Select Knob. When enabled by the Heading Select Pushbutton, rotating the Heading Select Knob sets theheading bug. There is a slight ratchet effect to give positive feel. The knob is normally disabled 5 sec after its lastrotation.
b. Heading Select Pushbutton. A positive press of the Heading Select Pushbutton of at least 0.1 sec is required to enablethe Heading Select Knob.
c. Track Select Knob. When enabled by the Track Select Pushbutton, rotation of the Track Select Knob allows the track
DO NOT DISTRIBUTE AP 3456
Page 57 : Wed Jan 02 02:28:44 2002 Heading 3- 2- 1- 3

pointer to be set to the required track. Positive feel is given by a slight ratchet effect, one click of the ratchet equating to 1degree change in selected track. The associated track digital readout (10) follows the pointer setting. The knob isautomatically disabled 5 sec after its last rotation.
d. Track Select Pushbutton. A positive press of the Track Select Pushbutton of at least 0.1 sec is required to enable theHeading Select Knob.
e. Aircraft Symbol. The aircraft symbol is always aligned pointing towards the heading lubber line at the top of theinstrument. When a navigation mode is active, the symbol represents aircraft orientation against the steering pointer ordeviation bar.
f. Integrated Light Sensor. The sensor automatically adjusts the display brightness in daylight. A separate manuallyoperated dimmer sets the brightness for night operations.
g. Mode Displays. The key to Fig 2 describes the numbered indicators shown on the diagram for VOR/ILS mode. In othermodes the names, functions and colours of the displayed features may change from those depicted.
h. Functionality. Most coloured symbols are cleared when the service is not activated or the compass input fails. Theappropriate Aircrew Manual should be consulted for precise details.
3-2-1-3 Fig 2 EHSI - VOR Mode Selected
1.Compass Card. The compass card indicates gyro-compass heading in conjunction with the lubber line (2). The card rotates clockwise as the aircraft turns left. If the compass fails, the card freezes and a red HDG FAIL caption is superimposed.2.Lubber Line. The lubber line is the index against which heading is shown on the compass card.3.Heading Bug. The heading bug is set by the Heading Select Knob to indicate the required heading. The bug clears if the compass input fails.4.Single Bar Pointer (TACAN Bearing). The arrowhead on the single bar pointer indicates the bearing of the TACAN station locked on. The pointer clears if a TACAN station is not locked on or if the compass input fails.5.Double Bar Pointer (VOR Bearing). The arrowhead on the double bar pointer indicates the bearing of the VOR station locked on. The pointer clears if the VOR receiver is not locked to a station or if the compass input fails.6.TACAN/DME Range Readout. The TACAN/DME readout is a digital display which shows the slant range to a locked on TACAN or DME station. When not locked on, the display shows 4 dashes.7.Wind Direction Indicator. The direction from which the wind is blowing is shown by a yellow diamond. The diamond clears when there is no source data or if the compass input fails.8.Wind Speed Readout. Wind speed to the nearest knot is shown by a yellow digital display. The display clears when there is no source data or if the compass input fails.9.Track (Course) Pointer. The cross end of the Track Pointer indicates th
DO NOT DISTRIBUTE AP 3456
Page 58 : Wed Jan 02 02:28:44 2002 Heading 3- 2- 1- 3

e track selected.10.Selected Track (Course) Readout. The readout shows the track selected on the Track Pointer (9).11.Track (Course) Deviation Bar. The deviation bar shows track deviation left or right of that selected on the Track Pointer (9). To return to track, the aircraft should be turned towards the bar until the bar centralizes and then on to a new heading to keep the bar in the centre.12.Track (Course) Deviation Scale. The scale comprises two white dots to the left and right of the centre of the heading pointer (9) creating a scale over which the Track Deviation Bar (11) moves. The outside dots represent full scale deflection (±10°), the intermediate dots indication ±5°.13.‘To’ Flag. The ‘To’ Flag is a white arrowhead which is displayed until the aircraft passes over or abeam the locked station, after which it is replaced by the ‘From’ Flag.14.‘From’ Flag. The ‘From’ Flag is a white dotted arrowhead which is displayed once the aircraft has passed over or abeam the locked station.15.Mode Annunciator. The selected mode (VOR in the example) is displayed provided the service is on and functioning.
AlignmentChapter 1 - Datum Compasses
Introduction1. In order to calibrate an aircraft compass system it is necessary to have an accurate heading datum. A Prismatic or LandingCompass may be used for this purpose. However, where the aircraft compass heading is used as an input to a navigation systemthis datum is provided by a more accurate Watts Datum Compass. This may be either a Mk1 or Mk1A version. A Mk2 versionwas produced which improved upon the Mk1 by being partially waterproofed and provided with luminescent ‘Betalights’ fornight operation. However, following the decision to delete the ‘Betalights’ a revised version, the Mk1A, with improvedwaterproofing and no artificial lighting was developed and this is in general use within the RAF today. A further version, theMk 3, denotes the model produced for use in industry. All Marks are similar in operation. In order to overcome the accuracylimitations of the aircraft compass display, which is normally only graduated at 1° intervals, the aircraft compass heading is readwith the aid of a Precise Heading Test Set (PHTS) which permits the aircraft heading to be recorded to an accuracy of 0.05°.This Chapter will describe only the Watts Datum Compass Mk1A and the PHTS.
WATTS DATUM COMPASS MK1A
Principle2. The instrument consists essentially of a compass system, a bearing plate, and a sighting telescope. The compass systemaccurately defines the magnetic meridian and the bearing plate is then aligned with, and locked to, this meridian. The sightingtelescope is sighted along the datum line and the bearing of the line of sight is read off from the bearing plate through amicroscope.
3-2-2-1 Fig 1 Mk1A Instrument, Objective-End View Showing Tripod Mounting
3-2-2-1 Fig 2 Mk1A Instrument, Showing Bowden Cable Release
DO NOT DISTRIBUTE AP 3456
Page 59 : Wed Jan 02 02:28:44 2002 Alignment 3- 2- 2- 1
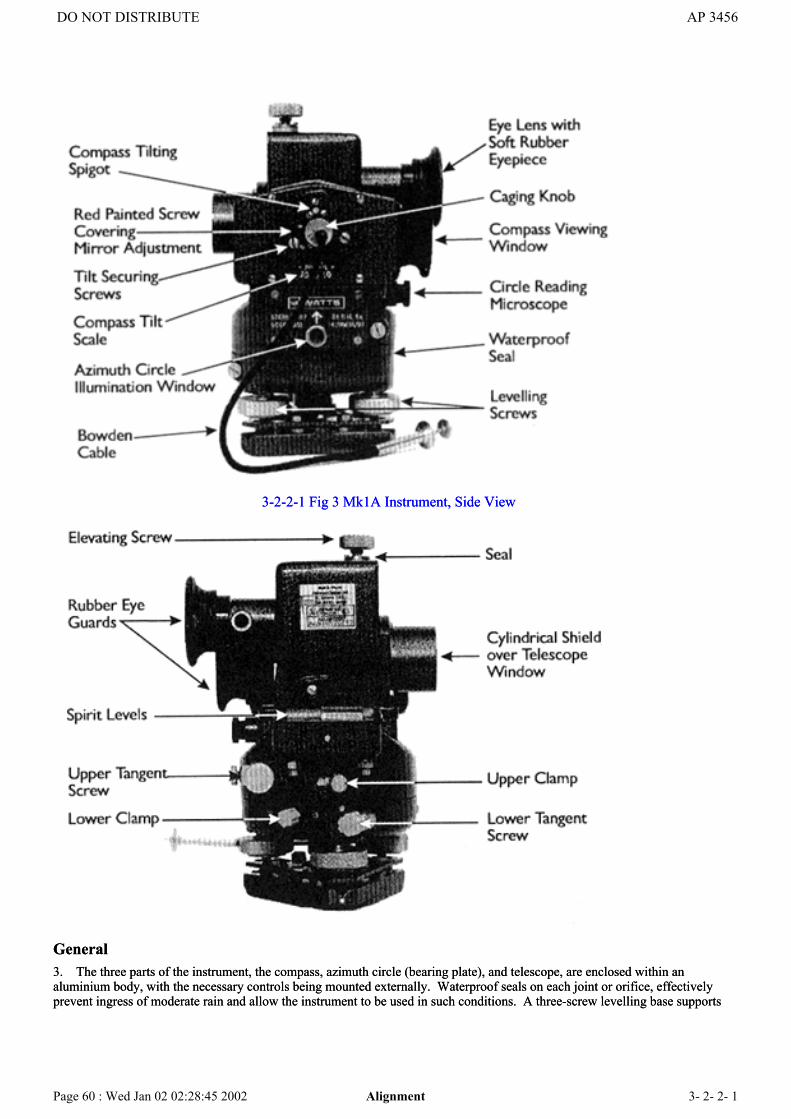
3-2-2-1 Fig 3 Mk1A Instrument, Side View
General3. The three parts of the instrument, the compass, azimuth circle (bearing plate), and telescope, are enclosed within analuminium body, with the necessary controls being mounted externally. Waterproof seals on each joint or orifice, effectivelyprevent ingress of moderate rain and allow the instrument to be used in such conditions. A three-screw levelling base supports
DO NOT DISTRIBUTE AP 3456
Page 60 : Wed Jan 02 02:28:45 2002 Alignment 3- 2- 2- 1
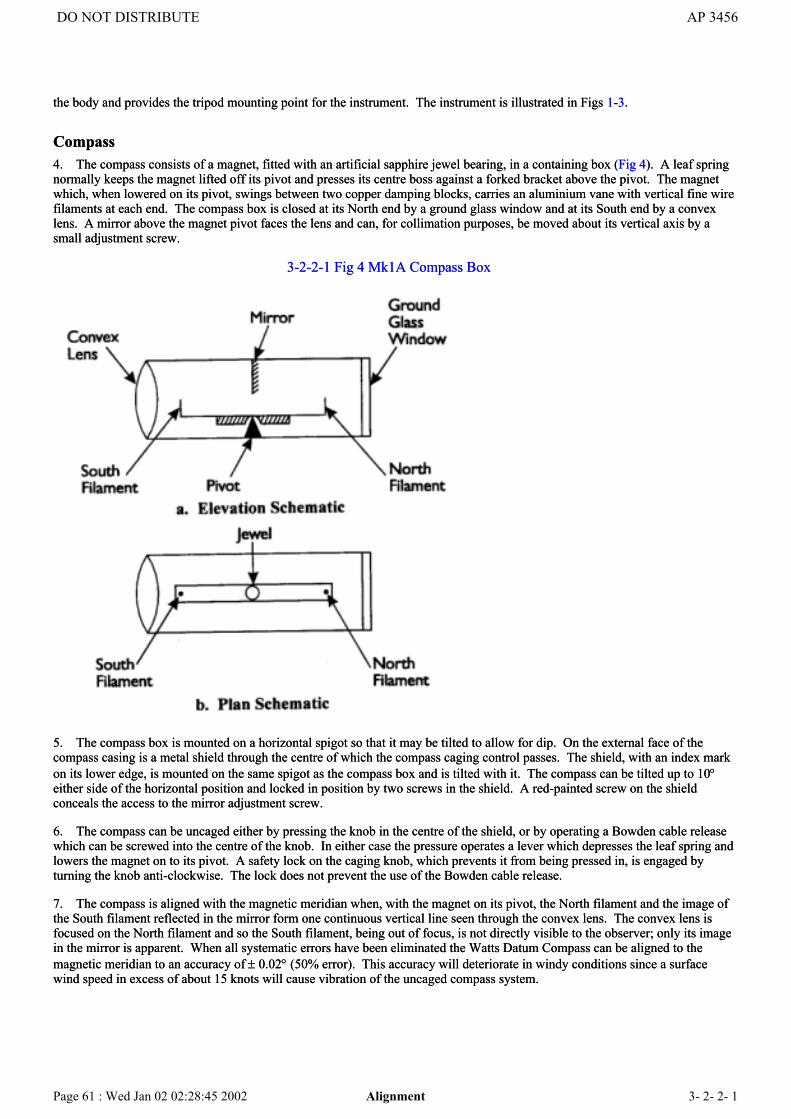
the body and provides the tripod mounting point for the instrument. The instrument is illustrated in Figs 1-3.
Compass4. The compass consists of a magnet, fitted with an artificial sapphire jewel bearing, in a containing box (Fig 4). A leaf springnormally keeps the magnet lifted off its pivot and presses its centre boss against a forked bracket above the pivot. The magnetwhich, when lowered on its pivot, swings between two copper damping blocks, carries an aluminium vane with vertical fine wirefilaments at each end. The compass box is closed at its North end by a ground glass window and at its South end by a convexlens. A mirror above the magnet pivot faces the lens and can, for collimation purposes, be moved about its vertical axis by asmall adjustment screw.
3-2-2-1 Fig 4 Mk1A Compass Box
5. The compass box is mounted on a horizontal spigot so that it may be tilted to allow for dip. On the external face of thecompass casing is a metal shield through the centre of which the compass caging control passes. The shield, with an index markon its lower edge, is mounted on the same spigot as the compass box and is tilted with it. The compass can be tilted up to 10°either side of the horizontal position and locked in position by two screws in the shield. A red-painted screw on the shieldconceals the access to the mirror adjustment screw.
6. The compass can be uncaged either by pressing the knob in the centre of the shield, or by operating a Bowden cable releasewhich can be screwed into the centre of the knob. In either case the pressure operates a lever which depresses the leaf spring andlowers the magnet on to its pivot. A safety lock on the caging knob, which prevents it from being pressed in, is engaged byturning the knob anti-clockwise. The lock does not prevent the use of the Bowden cable release.
7. The compass is aligned with the magnetic meridian when, with the magnet on its pivot, the North filament and the image ofthe South filament reflected in the mirror form one continuous vertical line seen through the convex lens. The convex lens isfocused on the North filament and so the South filament, being out of focus, is not directly visible to the observer; only its imagein the mirror is apparent. When all systematic errors have been eliminated the Watts Datum Compass can be aligned to themagnetic meridian to an accuracy of ± 0.02° (50% error). This accuracy will deteriorate in windy conditions since a surfacewind speed in excess of about 15 knots will cause vibration of the uncaged compass system.
DO NOT DISTRIBUTE AP 3456
Page 61 : Wed Jan 02 02:28:45 2002 Alignment 3- 2- 2- 1

Sighting Telescope8. A fixed focus prismatic telescope enclosed in the main portion of the upper casing is used to define the line of sight. Thetelescope optical system (Fig 5) consists of an objective lens looking vertically downwards, two prisms, and an eye-piece.Beneath the objective lens is an oblique mirror which deflects upwards the light entering the telescope window. The mirror canbe tilted by the elevating screw on top of the casing and will allow the line of sight to be varied by 25° in a vertical plane, from5° depression to 20° elevation.
3-2-2-1 Fig 5 Telescope Optical System
9. A sighting graticule, consisting of a vertical line with a short crossline in the centre, is provided for accurate alignment. Agreen clear glass anti-glare filter may be swung across the eye lens when required. The telescope gives an erect image with x 6magnification and a field of view of 8°. A soft rubber eyepiece is provided for comfort.
10. The accuracy of compass deviation measurements using the Watts Datum Compass depends not only on the accuracy of thedatum instrument, but also upon the precision of the instrument alignment with the aircraft’s datum points, and the accuracy withwhich the aircraft compass can be read. This last factor is independent of the datum equipment and is likely to cause the largesterror.
11. Although the Watts Datum Compass can be used in moderate rain, it is likely that the operator’s performance will bedegraded in such conditions, and thus they should be avoided whenever possible. Wind speed in excess of about 15 knots isliable to cause the aircraft to rock and it is inadvisable to attempt an accurate swing under such conditions.
Azimuth Circle12. The azimuth circle is made of glass and is graduated at intervals of 0.1° with every degree mark numbered. Ambientillumination is provided by a ground glass window situated below the compass system. The instrument can be used if sufficientartificial lighting is available (eg flood lighting) but this is not recommended. The azimuth circle is read against a fixed indexline through a variable focus microscope.
13. The azimuth circle and the upper casing (which covers the compass box, telescope, and reading microscope with its index)are mounted independently on the vertical axis of the instrument and each is provided with a clamp and a tangent screw. With
DO NOT DISTRIBUTE AP 3456
Page 62 : Wed Jan 02 02:28:45 2002 Alignment 3- 2- 2- 1

the upper clamp loose and the lower clamp tightened, the azimuth circle is fixed to the base of the instrument and the uppercasing can be rotated relative to the base of the instrument. The tangent screws enable fine adjustments to be made to the lockedpositions after their respective clamps have been tightened. In order to differentiate between the two sets of clamps and tangentscrews, the lower set has fluted screw-heads coloured yellow, while the upper set has milled screw-heads coloured silver.
14. The levelling of the instrument is indicated by two tubular spirit levels mounted on the upper casing to the right of thesighting telescope. Graduations on the levels are provided at intervals corresponding to 2 minutes of arc. The levels, oneparallel to the line of sight and the other at right angles to it, can be adjusted by means of lock-nut screws under the levelhousing. The spirit levels are sealed against rain.
Base15. The lower casing of the instrument is supported by three levelling screws, the ball end of each resting in a correspondinggroove in the triangular base plate. A triangular spring plate retains the base plate to the instrument. The under surface of thebase plate has a machined flat and groove to register with, and slide along, the rods of the tripod head. A hole in the centre ofthe base plate is threaded to accept the tripod head bolt.
Instrument Case16. The dustproof instrument case consists of a green fibreglass box and lockable lid. The instrument and accessories rest inmoulded compartments within the base and lid. Abbreviated instructions for the use of the instrument are engraved on a plateinside the lid of the instrument case. The case houses the following accessories (Fig 6):
a. 2 Bowden release cables.
b. Plumb line.
c. 3 spanners.
d. 1 screwdriver.
Tripod17. The tripod head provides the platform upon which the instrument is mounted. It is a cast aluminium plate fitted with acircular spirit level for initial setting-up and has two machined rods to register with the base plate. A longitudinal slot throughthe head carries the captive attachment bolt for the instrument and permits nine inches of lateral adjustment. A hook issuspended in the hollow handle of the bolt for the attachment of the plumb line. When the tripod is not in use, a metal protectivecap for the head is secured by the bolt and handles are provided for carrying in the closed position.
THE PRECISE HEADING TEST SET
Introduction18. In carrying out a compass swing, in addition to the actual magnetic heading of the aircraft, which is determined using theWatts Datum Compass, it is necessary to know the magnetic heading indicated by the aircraft compass to a high degree ofaccuracy. It is also essential that the compass system is synchronized before any readings are recorded.
19. Most compass displays are only graduated at 1° intervals and this is unsatisfactory for compass calibration purposes, wherea precision of ± 0.1° is needed. In addition, most compasses are synchronized by reference to a ·•/+ annunciator or to arudimentary centre-reading voltmeter, neither of which is sufficiently accurate.
3-2-2-1 Fig 6 Instrument Case and Accessories
DO NOT DISTRIBUTE AP 3456
Page 63 : Wed Jan 02 02:28:45 2002 Alignment 3- 2- 2- 1

20. The Precise Heading Test Set (PHTS) is designed to overcome these shortcomings by providing a display of compassheading by means of veeder counters which can be read to 0.05°, and an accurate centre-reading voltmeter. The PHTS is in theform of a hinged rectangular box which opens to reveal the controls and indicators (Fig 7).
Controls and Indicators21. Heading Counters. The left half of the PHTS has two windows displaying a veeder counter indication of compass heading.The right-hand window indicates tenths of a degree and can be read to an accuracy of at least 0.05°. The left-hand windowindicates whole degrees of compass heading from 000° to 359°, there is also a calibration certificate and a calibration graphwhich allows corrections for instrument error to be made to the heading counter readings.
22. Centre-reading Voltmeter. The right-hand half of the PHTS contains a centre-reading voltmeter whose scale is graduated3-0-3. The voltmeter is used to read the voltages present at the slaving amplifier annunciator output (ie the state ofsynchronization) and, on some compass systems, the voltages present at the adjustable potentiometers in the remote correctionunit (ie the deviation correction voltages for coefficients B and C being fed to the flux valve detector coils). The voltmeter canbe centred by turning a zero-adjuster screw.
23. Function Switch. A five position function selector switch is mounted above the voltmeter. The positions are markedSYNC, B-X3-C and B-X1-C; the facilities provided by these positions are:
a. SYNC. When SYNC is selected, the voltmeter shows the DC voltage output from the slaving amplifier, ie when theneedle is central, the compass is synchronized.
b. B-X3-C. There are two switch positions against the B-X3-C marking and the use of this switch depends on the type ofcompass being calibrated. On some compass systems, the two positions, B and C, allow the display of the respective DCvoltage corrections to the flux valve detector coils set in at the B and C potentiometers of the remote corrector unit. Onother compass systems, only the left-hand, B position is used and selection between B and C voltage displays is made byinserting the red and white probes, which are part of the test harness, into the sockets adjacent to the B and C potentiometercorrection dials as appropriate. In either case the voltage indicated is one third of the actual voltage (as implied by the X3marking), thus, for example, an indication of 2 volts represents an actual measurement of 6 volts.
c. B-X1-C. These two switch positions operate in the same manner as the B-X3-C function except that the displayedvoltage equates to the actual correction voltage set in at the potentiometers rather than one third of the value.
24. Change-Over Switch. On some compass systems, because of the design of the test socket the heading readouts on thePHTS would be 180° removed from the actual heading. The two-position change over switch permits this anomaly to be
DO NOT DISTRIBUTE AP 3456
Page 64 : Wed Jan 02 02:28:45 2002 Alignment 3- 2- 2- 1

corrected if necessary.
25. Test Cable Harness. Two sockets, one on each half of the PHTS, are provided to allow connection of the set to thecompass system by means of a cable harness. Because of the variation in the position and type of test sockets on the variouscompass systems, a different cable harness is required for each type of compass. Reference should be made to the precedures forthe particular aircraft/compass system to ensure that the correct cable harness is used.
Calibration26. Like all items of test equipment, the PHTS must be calibrated at regular intervals. Results of the calibration are recorded inthe form of a graph on the front of the left-hand half of the set. Corrections to be applied to the PHTS heading counter readingsshould be extracted from this graph and applied to each reading.
3-2-2-1 Fig 7 Precise Heading Test Set
AlignmentChapter 2 - Magnetic Compass Deviations
Introduction1. A magnetic sensor influenced only by the Earth's magnetic field will detect the direction of that field at its position. Ifinstalled in an aircraft, the sensor will also be influenced by the numerous magnetic fields associated with the aircraft. It will asa result indicate the direction of the resultant of the Earth's magnetic field and the magnetic field produced by the aircraft andexperienced at the sensor position. The difference between the direction of the horizontal component of the Earth's field, and thedirection of the horizontal component of the resultant field, is known as deviation. It is annotated 'East (positive)' or 'West(negative)', depending on whether the resultant field direction is to the East or West of the Earth's field. Deviation can vary withthe position of the sensor in the aircraft, with aircraft heading, with change of geographical position of the aircraft, and with thepassage of time. This chapter will review the causes of deviation; Chapters 3 and 4 will outline the method used to determinethe magnitude of, and reduce, these errors, ie compass swinging.
The Earth's Magnetic Field2. Except at the magnetic equator the Earth's magnetic field is inclined to the Earth's surface, the angle of inclination beingknown as dip. The total field (T) can be resolved into two components, a horizontal component (H) and a vertical component(Z) as shown in Fig 1. Fluxvalve units use only the H component to sense the direction of the local magnetic meridian, and Hcan therefore be considered to be the directive force acting upon the sensor. Other horizontal magnetic fields will increase,decrease, or act to deviate this directive force. The Z component is significant only in that it contributes to the magnetisminduced in the magnetic material of the aircraft.
3-2-2-2 Fig 1 The Earth's Magnetic Field Resolved
DO NOT DISTRIBUTE AP 3456
Page 65 : Wed Jan 02 02:28:46 2002 Alignment 3- 2- 2- 2

3. The H component can itself be resolved into two components relative to the aircraft axes; an X component along thefore-and-aft axis and a Y component acting athwartships. It is usual and satisfactory to consider only the situation of the aircraftin a level attitude in which case the three components, X,Y, and Z, correspond to the three major aircraft axes. By conventionthe X,Y and Z components are considered positive when acting forward, starboard and downward respectively.
4. The values of H and Z vary with magnetic latitude, and for any given geographical location the X and Y components varywith aircraft heading (eg the whole of the H component will equate to a positive or negative X component when the aircraft isaligned with the magnetic meridian, or to a positive or negative Y component when the aircraft is at 90° to the meridian - see Fig2).
3-2-2-2 Fig 2 Change in the Magnitude of the X and Y Components with Change of Heading
DO NOT DISTRIBUTE AP 3456
Page 66 : Wed Jan 02 02:28:46 2002 Alignment 3- 2- 2- 2

The Aircraft's Magnetic Field5. An aircraft's magnetic field is derived from innumerable pieces of magnetic material, each of which will have a differentintensity of magnetization and a different capacity to retain magnetism. However, in order to make a reasonable analysis of theeffect of aircraft magnetism on the Earth's field, it is convenient to make a somewhat arbitrary division of the magnetism intotwo constituents, a permanent field and a temporary field, due to what is known as hard iron and soft iron respectively.
6. Hard Iron. Magnetic material of the aircraft structure which has acquired permanent magnetism is described as hard iron.This magnetism may have been acquired during manufacture, or during the flying, servicing, or structural testing of the aircraft.Magnetic components of instruments permanently installed in the aircraft are included in the general designation hard iron.Although permanent magnetism can change slowly with time, and rather more rapidly as the result of a lightning strike, thesechanges are ignored in the general consideration of compass deviation.
7. Soft Iron. Magnetic material in which temporary magnetism is induced while in the presence of external fields is describedas soft iron. The temporary magnetism may be induced by the Earth's field, the hard iron, electrical currents, and weapons orcargo. The effects of electrical currents and payload is reduced to negligible proportions by the careful selection of the sensorposition.
The Effect of the Hard Iron Field8. The many elements of hard iron together form a permanent magnetic field of irregular shape, but with an orientation relativeto the aircraft axes that does not change with heading; the effect is as if a permanent magnet were fixed to the aircraft. The hardiron field at the sensor position is therefore constant in strength and direction relative to the aircraft axes. This field can beresolved into three component vectors, P, Q and R, aligned with the aircraft axes as shown in Fig 3, analogous to the X, Y and Zcomponents of the Earth's field.
3-2-2-2 Fig 3 Resolution to the Hard Iron Field
DO NOT DISTRIBUTE AP 3456
Page 67 : Wed Jan 02 02:28:46 2002 Alignment 3- 2- 2- 2

3-2-2-2 Fig 4 Deviating Effect of +P
3-2-2-2 Fig 5 Graphs of Deviation due to P
3-2-2-2 Fig 4 Deviating Effect of +P
3-2-2-2 Fig 5 Graphs of Deviation due to P
DO NOT DISTRIBUTE AP 3456
Page 68 : Wed Jan 02 02:28:46 2002 Alignment 3- 2- 2- 2
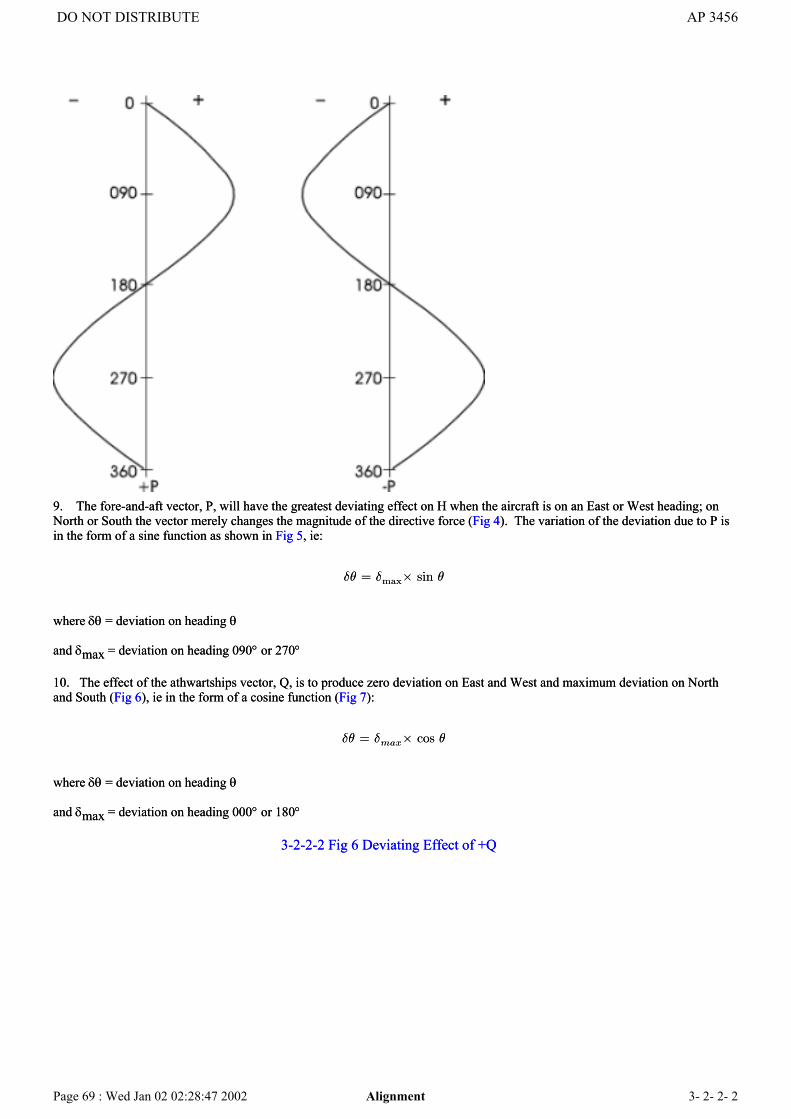
9. The fore-and-aft vector, P, will have the greatest deviating effect on H when the aircraft is on an East or West heading; onNorth or South the vector merely changes the magnitude of the directive force (Fig 4). The variation of the deviation due to P isin the form of a sine function as shown in Fig 5, ie:
±µ = ±max£ sin µ
where δθ = deviation on heading θ
and δmax = deviation on heading 090° or 270°
10. The effect of the athwartships vector, Q, is to produce zero deviation on East and West and maximum deviation on Northand South (Fig 6), ie in the form of a cosine function (Fig 7):
±µ = ±max£ cos µ
where δθ = deviation on heading θ
and δmax = deviation on heading 000° or 180°
3-2-2-2 Fig 6 Deviating Effect of +Q
DO NOT DISTRIBUTE AP 3456
Page 69 : Wed Jan 02 02:28:47 2002 Alignment 3- 2- 2- 2

3-2-2-2 Fig 7 Graphs of Deviation due to Q
11. The vertical component, R, exercises no deviating effect when the aircraft is in a level attitude.
3-2-2-2 Fig 7 Graphs of Deviation due to Q
11. The vertical component, R, exercises no deviating effect when the aircraft is in a level attitude.
DO NOT DISTRIBUTE AP 3456
Page 70 : Wed Jan 02 02:28:47 2002 Alignment 3- 2- 2- 2

The Soft Iron Field12. Magnetism will be induced in the aircraft's soft iron both by the Earth's field, which is the dominant effect, and by the hardiron field. As the hard iron field is constant relative to the airframe, and the soft iron can be considered as a single fixed block,the field induced by the hard iron in the soft iron is constant. However the soft iron field will distort the hard iron field, ie thetwo sources of deviation are in reality inseparable. The hard iron thus has an element of magnetism induced into it by the softiron.
13. Soft iron magnetism will be induced by all three components, X, Y and Z, of the Earth's total field. Each component willinduce a three-dimensional field in the soft iron, and the horizontal components of these fields will act as deviating forces at thesensor. The amount of deviation depends upon:
a. The amount, permeability and location in relation to the sensor, of the soft iron. These are constant for any givenaircraft.
b. The geographical location. As the inclination and total Earth field strength (T) vary with position, the components X, Y,and Z will vary.
c. The heading of the aircraft, for components X and Y
Table 1 Soft Iron ComponentsInducing
FieldSoft Iron Field Components
Fore-and-aft
Athwartships Vertical
X aX dX gXY bY eY hYZ cZ fZ kZ
14. As each of the three components, X, Y and Z, of the Earth's field is considered to induce a soft iron field, and as as thevector representing each of these fields can be resolved into three component vectors coincident with the aircraft axes, there area total of nine soft iron components. Each is given a two letter designator as shown in Table 1. The direction in which the softiron deviating field acts determines the sign convention of the components; the component is annotated positive if it acts forwardor starboard on aircraft headings in the North-West quadrant.
Coefficients15. As the magnetic sensor only detects the horizontal components, the vertical hard iron component (R), and the vertical softiron components (gX, hY, and kZ) need no further consideration. The two hard iron horizontal components (P and Q), togetherwith the six soft iron horizontal components (aX, bY, cZ, dX, eY, and fZ), can be grouped into four pairs, the members of eachgroup producing deviations which vary as a sine or cosine function of heading. The size of the deviation for any particular pairof components is a maximum on the headings for which the appropriate trigonometrical function is a maximum. The product ofthis maximum deviation in degrees and the appropriate trigonometrical function of heading will give the deviation produced bythat pair on that heading. The maximum deviation is termed a coefficient and is assigned an identifying letter to indicate the pairof components to which it refers.
16. Coefficient B. Coefficient B is due to components P and cZ, each of which exhibit a sinusoidal variation with heading. Thetotal deviation due to P and cZ is the algebraic sum of the deviation due to P and cZ separately. Thus the total deviation willdepend on the magnitude and sign of the constituents; this is illustrated in Fig 8. If the deviations δE and δW due to P and cZare measured on East and West, the value of coefficient can be determined from:
Coe±cient B =±E ¡ ±W
2
The deviations must be given their correct signs. Once coefficient B has been determined, the deviation due to P and cZ on anycompass heading can be obtained from the equation
DO NOT DISTRIBUTE AP 3456
Page 71 : Wed Jan 02 02:28:47 2002 Alignment 3- 2- 2- 2

±µ = B sin µ
3-2-2-2 Fig 8 Combined Graphs of Deviation due to P and cZ
17. Coefficient C. Coefficient C is the resultant of components Q and fZ, the variation of each with heading being a cosinefunction. In a similar manner to coefficient B, it can be shown that:
Coe±cient C =±N ¡ ±S
2
and that the deviation due to Q and fZ on a heading θ is given by:
±µ = C cos µ
Graphs showing the variation of total deviation due to positive and negative values of Q and fZ are shown in Fig 9.
18. Coefficient D. Coefficient D is due to components aX and eY. Each component varies as a function of the sine of twice thecompass heading as illustrated in Fig 10; the maximum deviations occur on the intercardinal headings. If the deviations δNE,δSE, δSW, δNW due to aX and eY on the intercardinal headings are measured then the value of coefficient D can be foundfrom:
3-2-2-2 Fig 9 Combined Graphs of Deviation due to Q and fZ
DO NOT DISTRIBUTE AP 3456
Page 72 : Wed Jan 02 02:28:47 2002 Alignment 3- 2- 2- 2
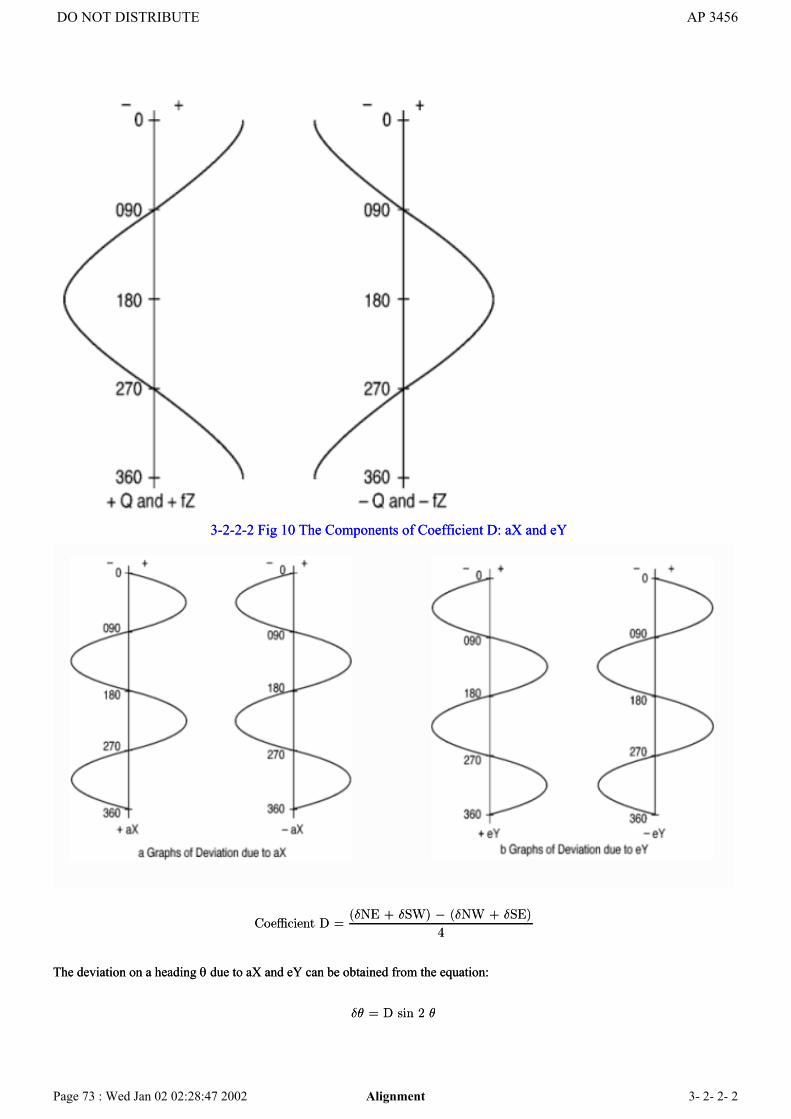
3-2-2-2 Fig 10 The Components of Coefficient D: aX and eY
Coe±cient D =(±NE + ±SW) ¡ (±NW + ±SE)
4
The deviation on a heading θ due to aX and eY can be obtained from the equation:
±µ = D sin 2 µ
3-2-2-2 Fig 10 The Components of Coefficient D: aX and eY
Coe±cient D =(±NE + ±SW) ¡ (±NW + ±SE)
4
The deviation on a heading θ due to aX and eY can be obtained from the equation:
±µ = D sin 2 µ
DO NOT DISTRIBUTE AP 3456
Page 73 : Wed Jan 02 02:28:47 2002 Alignment 3- 2- 2- 2

19. Coefficients E and A. Coefficients E and A are due to components bY and dX. Each component produces a deviationwhich varies with heading in the form shown in Fig 11; this function is the cosine of twice the heading, displaced to one side orthe other of the zero axis. The result of adding the two components depends on their equality or otherwise as follows:
3-2-2-2 Fig 11 The Components of Coefficients E and A: bY and dX
a. If equal, the deviation is constant, or varies as the cosine of twice the heading (Figs 12 and 13).
3-2-2-2 Fig 12 Combination of Deviation due to Equal Components of +bY and -dX
DO NOT DISTRIBUTE AP 3456
Page 74 : Wed Jan 02 02:28:48 2002 Alignment 3- 2- 2- 2
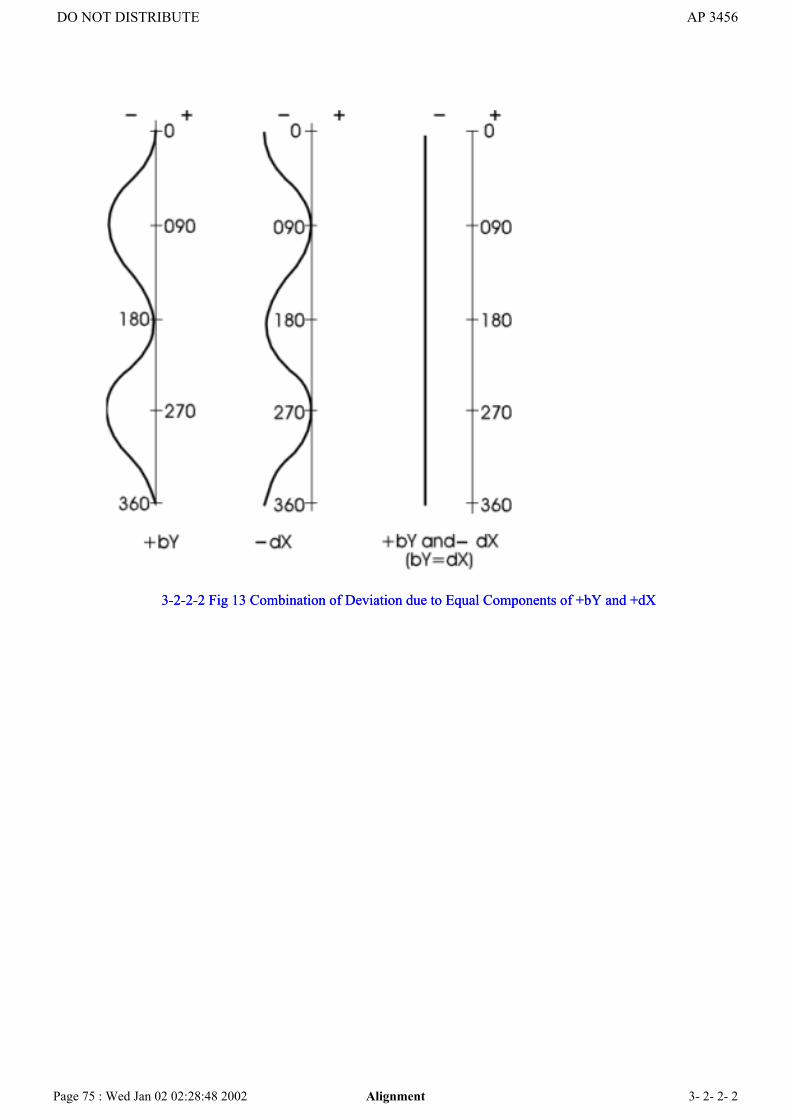
3-2-2-2 Fig 13 Combination of Deviation due to Equal Components of +bY and +dX3-2-2-2 Fig 13 Combination of Deviation due to Equal Components of +bY and +dX
DO NOT DISTRIBUTE AP 3456
Page 75 : Wed Jan 02 02:28:48 2002 Alignment 3- 2- 2- 2

b. If unequal, there is a constant deviation and one which varies as the cosine of twice the heading (Figs 14 and 15).
The variable part of the deviation is represented by the coefficient E and the constant part by the coefficient A.
20. Coefficient E. The maximum values of deviation occur on the cardinal headings. If the deviations δN, δE, δS, and δW onthe cardinal headings are measured, the value of coefficient E is given by:
Coe±cient E =(±N + ±S) ¡ (±E + ±W)
4
The variable deviation due to bY and dX on any compass heading can be found from:
±µ = E cos 2 µ
3-2-2-2 Fig 14 Combination of Deviations due to Unequal Components of +bY and +dX
DO NOT DISTRIBUTE AP 3456
Page 76 : Wed Jan 02 02:28:48 2002 Alignment 3- 2- 2- 2

3-2-2-2 Fig 15 Combination of Deviations due to Unequal Components of +bY and -dX3-2-2-2 Fig 15 Combination of Deviations due to Unequal Components of +bY and -dX
DO NOT DISTRIBUTE AP 3456
Page 77 : Wed Jan 02 02:28:48 2002 Alignment 3- 2- 2- 2

21. Coefficient A. Coefficient A represents the constant deviation due to the vectors bY and dX. It can be determined bytaking the average of the deviations measured on any number of equally spaced headings; the more headings, the greater theaccuracy. For the initial correction of a compass before calibration coefficient A is normally determined from observations onfour headings, but for deviation analysis it is calculated from observations on eight or twelve headings, thus:
Coefficient A = 1/8 (δ N + δ NE + δ E + δ SE + δ S + δ SW + δ W + δ NW)
Other Sources of Deviation22. In addition to deviations due to the permanent and induced magnetism of the aircraft, deviations may be caused by thefollowing:
a. Index or Alignment Error. If the sensor is not correctly aligned with the axis of the aircraft, or if the transmissionsynchros are out of alignment, an error constant for all headings will be present. The effect is identical to that of coefficientA, and although the errors may be distinguished by the term Apparent A, with magnetic effects being termed Real A, inpractice it is not necessary to distinguish between them; they are both included in the term coefficient A.
b. Electrical Fields. Direct currents will create fields which have a similar effect to hard iron magnetism. Although theeffects can be determined by calibrating the aircraft with and without the appropriate circuits operating, in practice,providing the sensor is in a remote part of the aircraft, the effects of any field will be negligible.
c. Transmission Errors. With remote indicating compasses, impedance and voltage imbalances in the flux valve andsynchros can cause errors of the sin 2θ or cos 2θ form. These errors are usually greater than those due to inducedmagnetism, but it is unnecessary to differentiate between the sources of error and both are included in coefficients D and E.
Total Deviation23. The two hard iron horizontal components, P and Q, and the six soft iron horizontal components, aX, bY, cZ, dX, eY, andfZ, can be grouped according to their similarity of effect to produce five coefficients, A, B, C, D, and E, which represent themaximum deviations caused by the individual sets of components. The deviation due to any set on a compass heading θ can
DO NOT DISTRIBUTE AP 3456
Page 78 : Wed Jan 02 02:28:48 2002 Alignment 3- 2- 2- 2

then be determined by multiplying the coefficient by the appropriate trigonometric function of the heading, eg B sin θ for P andcZ. The total deviation (δ) on any heading (θ) is then the sum of these individual expressions, thus:
δ = A + B sin θ + C cos θ + D sin 2 θ + E cos 2 θ
This addition is shown graphically in the example of Fig 16.
3-2-2-2 Fig 16 Graphs of Components Deviations and Total Deviation
24. Although the previous discussion has considered the components of total deviation separately, they cannot in practice bemeasured individually as they act simultaneously. However if the total deviation is measured on the eight headings at which theindividual maxima occur, the values of all of the coefficients can be obtained by analysis of the total deviation equation.
25. An expression for the total deviation on each cardinal and intercardinal heading can be obtained by substituting the value ofthe heading into the total deviation equation, thus:
± N = A + C + E
± NE = A + B sin 45± + C cos 45± + D
± E = A + B ¡ E
± SE = A + B sin 45± ¡ C cos 45± ¡ D
± S = A ¡ C + E
DO NOT DISTRIBUTE AP 3456
Page 79 : Wed Jan 02 02:28:49 2002 Alignment 3- 2- 2- 2
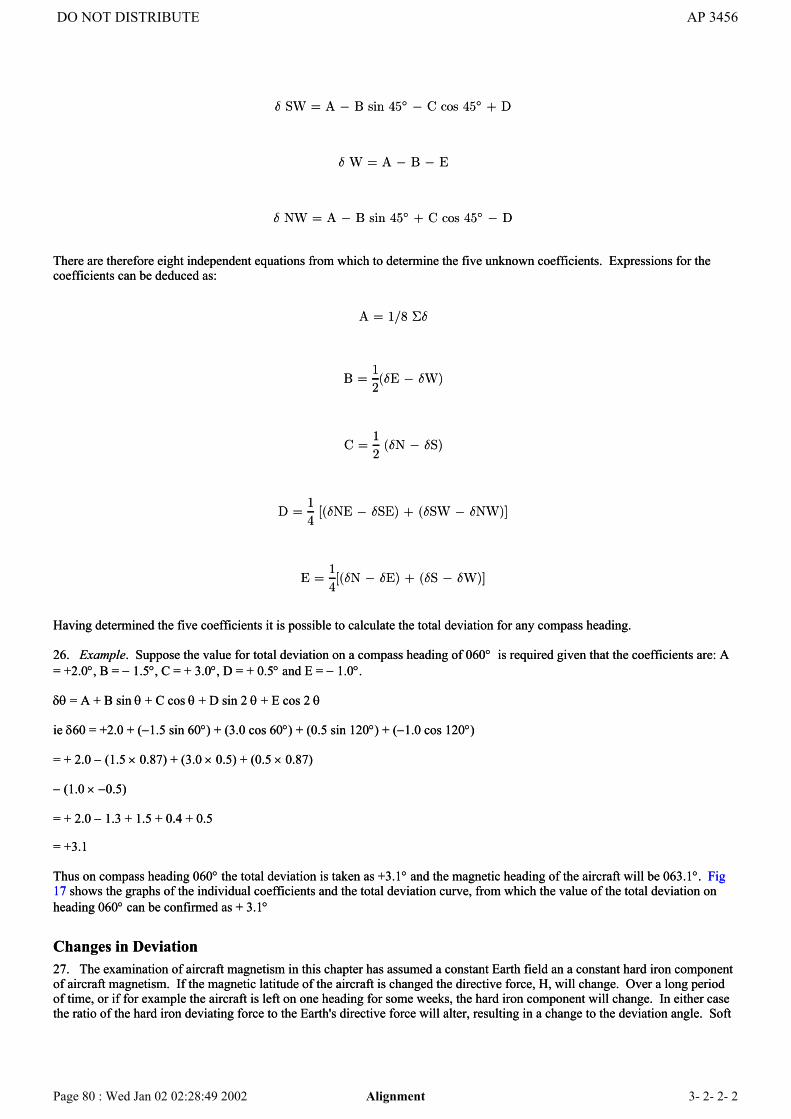
± SW = A ¡ B sin 45± ¡ C cos 45± + D
± W = A ¡ B ¡ E
± NW = A ¡ B sin 45± + C cos 45± ¡ D
There are therefore eight independent equations from which to determine the five unknown coefficients. Expressions for thecoefficients can be deduced as:
A = 1/8 §±
B =1
2(±E ¡ ±W)
C =1
2(±N ¡ ±S)
D =1
4[(±NE ¡ ±SE) + (±SW ¡ ±NW)]
E =1
4[(±N ¡ ±E) + (±S ¡ ±W)]
Having determined the five coefficients it is possible to calculate the total deviation for any compass heading.
26. Example. Suppose the value for total deviation on a compass heading of 060° is required given that the coefficients are: A= +2.0°, B = − 1.5°, C = + 3.0°, D = + 0.5° and E = − 1.0°.
δθ = A + B sin θ + C cos θ + D sin 2 θ + E cos 2 θ
ie δ60 = +2.0 + (−1.5 sin 60°) + (3.0 cos 60°) + (0.5 sin 120°) + (−1.0 cos 120°)
= + 2.0 − (1.5 × 0.87) + (3.0 × 0.5) + (0.5 × 0.87)
− (1.0 × −0.5)
= + 2.0 − 1.3 + 1.5 + 0.4 + 0.5
= +3.1
Thus on compass heading 060° the total deviation is taken as +3.1° and the magnetic heading of the aircraft will be 063.1°. Fig17 shows the graphs of the individual coefficients and the total deviation curve, from which the value of the total deviation onheading 060° can be confirmed as + 3.1°
Changes in Deviation27. The examination of aircraft magnetism in this chapter has assumed a constant Earth field an a constant hard iron componentof aircraft magnetism. If the magnetic latitude of the aircraft is changed the directive force, H, will change. Over a long periodof time, or if for example the aircraft is left on one heading for some weeks, the hard iron component will change. In either casethe ratio of the hard iron deviating force to the Earth's directive force will alter, resulting in a change to the deviation angle. Soft
DO NOT DISTRIBUTE AP 3456
Page 80 : Wed Jan 02 02:28:49 2002 Alignment 3- 2- 2- 2

iron components will also change with latitude as the horizontal and vertical components of the Earth's field vary. Finally alightning strike can radically alter an aircraft's magnetism.
3-2-2-2 Fig 17 Graph of Total Deviation
AlignmentChapter 3 - Compass Swinging Procedures
Introduction1. In chapter 2 it was shown that the value of the deviation coefficient determines the amplitude of the deviation curve for thecomponent represented by that coefficient. If the coefficients can be reduced in size, the curves will be flattened and morenearly approach the central axis of the graph, and the total deviation curve will correspondingly be reduced in amplitude.Ideally, if all the coefficients could be reduced to zero, the deviation curve would become a straight line coincident with thecentral axis, ie there would be no deviation. The purpose of compass correction is to approach this condition of zero deviationas closely as possible by reducing the values of the coefficients. This is achieved by setting up, by means of a corrector device,magnetic fields which are equal in magnitude but opposite in direction to those caused by the components of aircraft magnetism.In practice it is impossible to reduce the coefficients entirely, and indeed in most cases only coefficients A, B and C arecorrected. After correction the compass is therefore calibrated so that the residual deviations can be determined and recorded.The correction and calibration procedure is known as compass swinging.
2. The accuracy with which deviations are measured and corrected depends upon the accuracy to which it is possible to readboth the compass and datum instrument during the swing, and the accuracy requirements stipulated by the user which willdepend on how important the magnetic compass is to the aircraft's primary navigation system.
Occasions for a Compass Swing3. Responsibility for the calibration and adjustment of aircraft compasses is promulgated in General and AdministrativeInstructions (GAI). Compass swinging is carried out only on the following occasions and, except under exceptionalcircumstances, in weather conditions clear of persistent rain and winds of 15kts or less:
a. Whenever the accuracy of the compass is in doubt as a result of airborne observations or aircraft maintenance
DO NOT DISTRIBUTE AP 3456
Page 81 : Wed Jan 02 02:28:49 2002 Alignment 3- 2- 2- 3

procedures known to affect accuracy.
b. When the aircraft has been struck by lightning. In this case, particular attention must be paid to compass accuracy and,if necessary, the appropriate demagntization procedures laid down by the operating authority must be followed.
c. Before delivery of an aircraft from a Maintenance Unit to a user unit, unless the total work carried out is of a minornature and a waiver has been obtained from the relevant support authority.
d. Before delivery of an aircraft from a Storage Unit to a user unit.
e. On acceptance by a user unit when the aircraft has been delivered from Industry, unless a compass swing forms part ofthe pre-delivery schedule.
f. For training or specific calibration purposes.
Types of Compass Swing4. There are four types of compass swing but only the refined swing will be covered in detail:
a. Refined Swing. The refined swing is used when the compass is used as a source of heading information for navigation orweapon aiming equipment, eg Doppler. A Watts Datum compass is used to provide the datum headings and the calibrationswing is carried out on twelve headings. The procedure for the refined swing is detailed in paras 10 - 13.
b. Standard Swing. The standard swing is used where the compass system is not used as an input to other navigation orweapon aiming systems. Although a Watts Datum compass can be used as the datum, a Medium Landing compass issufficient. The procedure is otherwise similar to that used in the refined swing except that the calibration swing is carriedout on only eight headings, the cardinals and intercardinals.
c. Electrical Swing. The electrical swing is essentially the same as the refined swing except that instead of physicallymoving the aircraft onto the appropriate headings, the heading is simulated by a Compass Calibrator which applies a DCcurrent to the secondary coils of the detector unit. The aircraft is aligned with the magnetic meridian and unlikeconventional swings the area used for calibration need not be free from magnetic disturbances, provided there is magneticstability.
d. Air Swing. Although compass swinging is normally carried out on the ground, it is possible to carry out an airbornecompass swing using either celestial information or, more normally, inertially derived heading as a datum.
The Compass Base5. To ensure that the deviations derived from a compass swing are caused only by aircraft magnetism, the swing (other than anelectrical swing) must be carried out in an area free from magnetic fields other than that of the Earth.
6. In addition to the need to be free from extraneous magnetic fields, a compass base should be sited such that its use does notinterfere with normal aircraft movements on the airfield and its surface should not preclude its use in wet weather. It must belarge enough to take all types of aircraft likely to use it bearing in mind the radii of the aircraft's turning circles, whether towedor taxied during the swing, and the position of any sighting rods on the aircraft and their path during the swing.
7. The base must be clearly and permanently marked to show the base centre, the central area within which the aircraft's sensorshould remain, the datum compass circle and areas of magnetic anomalies.
8. Magnetic Anomalies. Compass bases are classified as Class 1 if there are no known magnetic anomalies in excess of ±0.1°at 1.5m above ground level, or Class 2 provided any anomalies are less than ±0.25° at 1.5m above ground level. If a base is tobe used for aircraft which have magnetic detectors significantly below 1.5m, a special survey is required. It is unusual for thereto be any natural ferrous deposits on an airfield, and any ferro-magnetic interference is therefore most likely due to buried scrapmetal, reinforced concrete, drainage systems, wire fences or conduit for electrical cabling. Electro-magnetic interference may becaused by electrical cabling and if such cables cannot be avoided or re-routed, their effect with and without current flowing mustbe assessed. The Admiralty Compass Observatory has the overall responsibility for the survey of compass bases.
9. Changes in Variation. Changes in variation may occur through diurnal changes and magnetic storms. Diurnal changes invariation may vary from a few arc minutes close to the magnetic equator to many degrees close to the magnetic poles. Insouthern England the diurnal change varies from about 0.25° in the summer to about 0.07° in the winter. Magnetic storms areusually associated with sunspot activity. Although the frequency of such storms is only about once per year, they may last
DO NOT DISTRIBUTE AP 3456
Page 82 : Wed Jan 02 02:28:49 2002 Alignment 3- 2- 2- 3

several hours or even days, and can alter the variation by up to 0.5° in the UK.
The Refined Swing10. The refined swing is used for those installations where the compass is used as an input to other navigation or weaponaiming equipment. A Watts Datum compass is used to provide the datum heading and great care must be taken to ensure thatboth the datum and aircraft readings are read simultaneously and to the limits of accuracy. The compass must be allowed tosettle after each change of heading before the reading is taken. After the corrections have been made to the compass system, theresults of the calibration swing are used as the basis of a Fourier analysis of the swing (see Chapter 4). The necessary accuracyand limits of the swing are stipulated by operating authorities, but in general coefficients should be reduced to less than 0.5°, andthe 50% error of an observed deviation to less than ±0.30°.
11. The Correcting Swing. The purpose of the correcting swing is to reduce all the correctable coefficients to within the limitsset. The swing may have to be repeated several times to achieve the required accuracy. The data from each correcting swing isentered in the appropriate page of the Compass Calibration Log (RAF F712A). The procedure is as follows, all headings beingwithin 5° of those stated:
a. Head the aircraft on South, record the aircraft and datum compass readings.
b. Head the aircraft on West, record the aircraft and datum compass readings.
c. Head the aircraft on North, record the aircraft and datum compass readings.
d. Head the aircraft on East, record the aircraft and datum compass readings.
e. Calculate the deviations.
f. Sum the deviations algebraically and divide by four to find coefficient A.
g. Apply coefficient A to the compass reading (sign unchanged) and correct the compass.
h. Calculate coefficient B ³±E ¡ ±W
2
´i. Apply coefficient B (sign unchanged) to the resultant compass heading after correcting for coefficient A, and with theaircraft still on East correct the compass.
j. Calculate coefficient C ³±N ¡ ±S
2
´Turn the aircraft onto South, apply coefficient C (sign changed) to the compass reading and correct the compass.
When there are no coefficients to be corrected the calibration swing may start.
12. The Calibration Swing. The aircraft is moved through a twelve point swing and the datum and compass readings arerecorded every 30°. The deviations obtained from this swing form the basis of the Fourier and accuracy analyses which aredescribed in Chapter 4.
13. RAF F712A. A typical record of correcting and calibration swings, entered on RAF F712A, is shown in Fig 1.
3-2-2-3 Fig 1 Compass Calibration Log Entries for Correction and Calibration Swings
DO NOT DISTRIBUTE AP 3456
Page 83 : Wed Jan 02 02:28:49 2002 Alignment 3- 2- 2- 3

AlignmentChapter 4 - The Analysis of the Compass Swing
THE FOURIER ANALYSIS
Derivation of the Coefficients1. The purpose of the Fourier Analysis is to extract from a set of observations the most accurate assessment of the deviationcoefficients and residual deviations. Chapter 3 described how the coefficients can be found, but in two cases, B and C, only tworeadings were used. A more accurate method is needed.
2. In Chapter 2 it was shown that the deviation caused by coefficient B is a function of the sine of the heading. The observeddeviation on each heading is multiplied by the sine of that heading, and the results algebraically summed. It can be shown thatdivision of this sum by n2; where n is the number of headings, gives coefficient B. Similar calculations may be done to findcoefficients C, D and E. Coefficient A is derived from the sum of the deviations and the number of readings. The results can besummarized by the equations:
A = §±n
B = 2§± sin 2µn
C = 2§± cos µn
D = 2§± sin 2 µn
E = 2§± cos 2 µn
where δ is the observed deviation on heading θ, and n is the number of observations.
3. The greater the number of readings used the greater will be the accuracy of the derived coefficients. As the band of erroronly decreases as the inverse square root of n, twelve readings have been accepted as the practical figure, ie n = 12. As an aid tocalculation a table of values of sin θ, cos θ, sin 2θ and cos 2θ, at 30° intervals, is incorporated the Compass Calibration Logwhich is used for the Fourier Analysis. For convenience these values have been extracted and are listed at Table 1.
Table 1 - Value of Functions of θ
Hdg (θ) sin θ cos θ sin 2θ cos 2θa b c d e
DO NOT DISTRIBUTE AP 3456
Page 84 : Wed Jan 02 02:28:50 2002 Alignment 3- 2- 2- 4
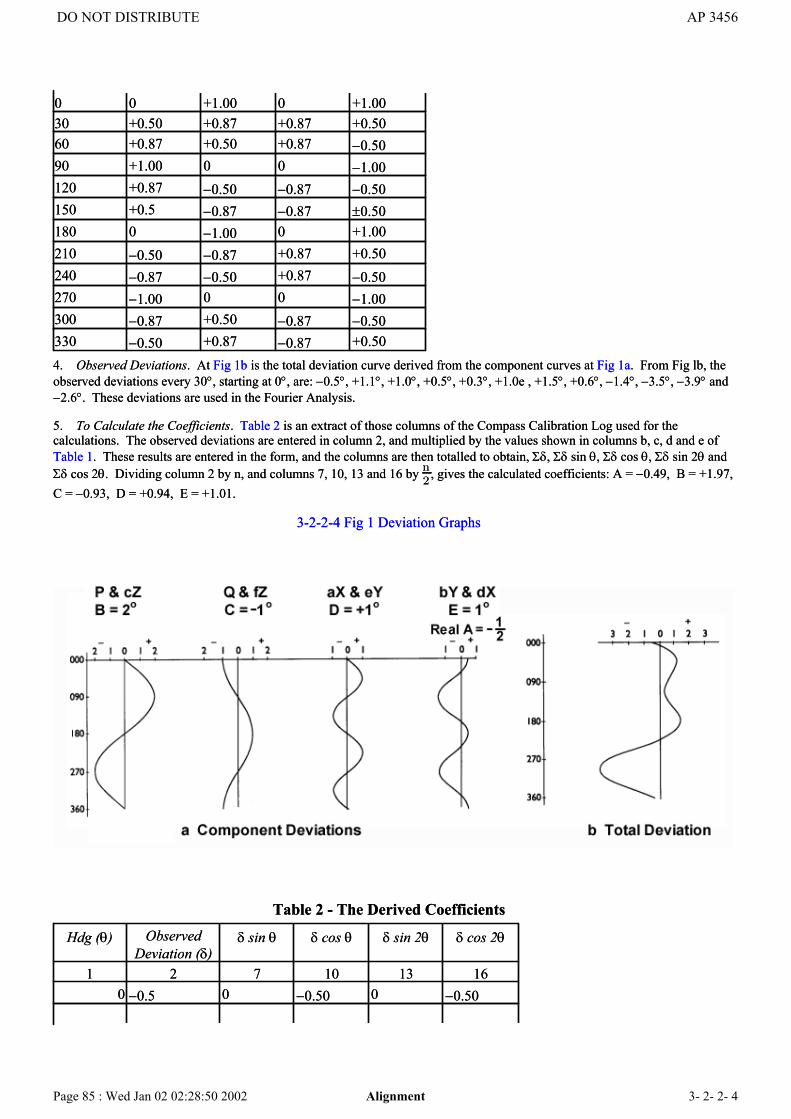
0 0 +1.00 0 +1.0030 +0.50 +0.87 +0.87 +0.5060 +0.87 +0.50 +0.87 −0.5090 +1.00 0 0 −1.00120 +0.87 −0.50 −0.87 −0.50150 +0.5 −0.87 −0.87 ±0.50180 0 −1.00 0 +1.00210 −0.50 −0.87 +0.87 +0.50240 −0.87 −0.50 +0.87 −0.50270 −1.00 0 0 −1.00300 −0.87 +0.50 −0.87 −0.50330 −0.50 +0.87 −0.87 +0.504. Observed Deviations. At Fig 1b is the total deviation curve derived from the component curves at Fig 1a. From Fig lb, theobserved deviations every 30°, starting at 0°, are: −0.5°, +1.1°, +1.0°, +0.5°, +0.3°, +1.0e , +1.5°, +0.6°, −1.4°, −3.5°, −3.9° and−2.6°. These deviations are used in the Fourier Analysis.
5. To Calculate the Coefficients. Table 2 is an extract of those columns of the Compass Calibration Log used for thecalculations. The observed deviations are entered in column 2, and multiplied by the values shown in columns b, c, d and e ofTable 1. These results are entered in the form, and the columns are then totalled to obtain, Σδ, Σδ sin θ, Σδ cos θ, Σδ sin 2θ andΣδ cos 2θ. Dividing column 2 by n, and columns 7, 10, 13 and 16 by n
2, gives the calculated coefficients: A = −0.49, B = +1.97,
C = −0.93, D = +0.94, E = +1.01.
3-2-2-4 Fig 1 Deviation Graphs
Table 2 - The Derived Coefficients
Hdg (θ) ObservedDeviation (δ)
δ sin θ δ cos θ δ sin 2θ δ cos 2θ
1 2 7 10 13 160 −0.5 0 −0.50 0 −0.50
DO NOT DISTRIBUTE AP 3456
Page 85 : Wed Jan 02 02:28:50 2002 Alignment 3- 2- 2- 4

30 +1.1 +0.55 +0.96 +0.96 +0.5560 +1.0 +0.87 +0.50 +0.87 −0.5090 +0.5 +0.50 0 0 −0.50
120 +0.3 +0.26 −0.15 −0.26 −0.15150 +1.0 +0.50 −0.87 −0.87 +0.50180 +1.5 0 −1.50 0 +1.50210 +0.6 −0.30 −0.52 +0.52 +0.30240 −1.4 +1.22 +0.70 −1.22 +0.70270 −3.5 +3.50 0 0 +3.50300 −3.9 +3.39 −1.95 +3.39 +1.95330 −2.6 +1.30 −2.26 +2.26 −1.30
Sums −5.9 +11.79 −5.59 +5.65 +6.05Divisors 12 6 6 6 6
Coeffs −0.49 +1.97 −0.93 +0.94 +1.01
The Calculated Deviations6. The second part of the Fourier Analysis is to find the calculated deviations. In effect, this is the reverse of the first process:having made the most accurate assessments of the coefficients they are used to determine the most accurate deviation curve. InChapter 2 the composite curve was found by visually adding together the coefficient curves as in Fig 1. The Fourier Analysisuses a similar process, but by calculation.
7. The Calculated Deviation Curve. Table 3 is an extract of the columns of the Compass Calibration Log used for the processof finding the calculated deviation curves and the composite curve. The coefficients are multiplied by their associatedtrigonometrical functions from Table 1. When columns 6, 8, 11, 14 and 17 are complete, each line is summed and the totalsentered in column 3. These totals are the end result of the Fourier Analysis - the calculated deviations which are used to plot thedeviation curve and to complete the aircraft deviation card.
Summary of the Fourier Analysis8. Any periodic function (the compass swing period is 2π) can be broken down into sinusoids of different amplitudes (thecoefficients) and phases (sin, cos, etc). If sufficient readings are available, the derived parts of the original can be built up againto give the most accurate assessment of the function. A convenient form for the breaking down and building up processes is theCompass Calibration Log (Refined Swing).
Table 3 - The Calculated Deviations
Hdg (θ) CalculatedDeviation
A B sin θ C Cos θ D sin 2θ E cos 2θ
1 3 6 8 11 14 170 −0.41 −0.49 0 −0.93 0 +1.01
30 +1.01 −0.49 +0.99 −0.81 +0.82 +0.5060 +1.07 −0.49 +1.71 −0.47 +0.82 −0.5090 +0.47 −0.49 +1.97 0 0 −1.01
120 +0.37 −0.49 +1.71 +0.47 −0.82 −0.50150 +0.99 −0.49 +0.99 +0.81 −0.82 +0.50180 +1.45 −0.49 0 +0.93 0 +1.01210 +0.65 −0.49 −0.99 +0.81 +0.82 +0.50240 −1.41 −0.49 −1.71 +0.47 +0.82 −0.50270 −3.47 −0.49 −1.97 0 0 −1.01300 −3.99 −0.49 −1.71 −0.47 −0.82 −0.50
DO NOT DISTRIBUTE AP 3456
Page 86 : Wed Jan 02 02:28:51 2002 Alignment 3- 2- 2- 4

330 −2.61 −0.49 −0.99 −0.81 −0.82 +0.50Sums −5.88 −5.88 0 0 0 0
THE ACCURACY ANALYSIS
Introduction9. The accuracy analysis gives a statistical assessment of the reliance that can be placed on the results of the swing, and enablesone swing to be compared with another. The analysis is based on the differences between the observed and calculateddeviations, differences which arise because the aircraft and datum instruments are being used at or beyond their accuracy limits.
10. It will be useful to summarize the following terms which are used in a Fourier Analysis. The probable error (ε) is thedifference between the mean of a series of observations and any single observation which will not be exceeded on 50% ofoccasions. Probable error equals 0.674 σ, where σ (sigma) is the standard deviation. Normally the standard deviation is found
from: ¾ = §q
§ (X ¡ X)2
n , where X is the particular reading, and X is the mean of all the readings. As the compass calibrationmethod does not provide a mean, the calculated deviation is used instead. The probable error formula then becomes: Single
reading " = §0.674
r§D
2
n ¡ s, where D is the difference between the corresponding observed and calculated deviations and s is
the number of unknowns (ie the coefficients). To find the greatest probable error of coefficient A, use is made of the formula:"A = "p
n and for coefficients B, C, D and E of the formula: "B to E= "
q2n, or 1.4 εA.
Statistical Analysis of the Swing
11. Fig 2 shows a completed form for the swing used in the Fourier Analysis. Column 4 is D, Column 5 is D2. Thus for thefigures used:
" = §0.05±.
"A = §0.014±, ie A = ¡0.49 §0.14±.
"B to E = §0.02± ie B,C,D and E are within §0.02± " of their stated ¯gures.
12. The Meaning of the Probable Errors. The figure for ε of ±0.05° means that any single observed deviation has an evenschance of being within .05° of the calculated deviation, and one would therefore expect half of the differences to be within±0.05°. Column 4 confirms this. The coefficient's probable errors provide a means of comparing one compass swing withanother form of correlation test.
Further Applications of Statistics13. Fig 3 also shows a completed form. No observed deviation differs from the next by more than 1° - at first sight a goodswing. But examination of the e values shows that the swing gives coefficients and calculated deviations that are meaningless:the coefficients all stand an evens chance of equalling zero. Fig 4 shows another set of observed deviations where consecutivereadings change by as much as 1.5° - at first sight a bad swing. But examination shows that the rapid changes are due to largecoefficients D and E. The probable accuracy of the single reading is better than the accepted maximum of ε = ± 0.20, andcoefficients which can be corrected are less than the accepted maximum of 0.5°.
14. The Effect of Carriage of Stores. To show how statistics can be used to compare one swing with another the effect of a loadof bombs will be considered. A further statistical limit must be explained - a result is only considered as being significant whenit is at the 95% probability level, 2σ or 3ε. The following two sets of figures may be compared,
A −0.06 −0.11 +0.05B +0.29 −0.14 +0.43
DO NOT DISTRIBUTE AP 3456
Page 87 : Wed Jan 02 02:28:51 2002 Alignment 3- 2- 2- 4

C +0.16 −0.24 +0.40D −0.81 −0.45 −0.36E +0.67 +0.24 +0.43
ε = ±0.28 ±0.25εB to E = ±0.114 ±0.102
At first sight there are large differences in the values of the coefficients B to E. But first the probable error (since all the figuresare at the 50% level) of the differences must be found. This is done by finding the square root of the sum of the squares of theprobable errors of the coefficients:
"D =q
"21+ "22
To use the figures shown:
"D = §q
0.1142 + 0.1022
= §0.153±
This figure becomes significant at the 3e level ie 0.459°. Therefore it can be said that the bombs have no effect on the aircraft'smagnetism because no difference exceeds 0.459°, and there is a better than 19 to 1 chance of being right.
3-2-2-4 Fig 2 Compass Calibration Log - Example 1
3-2-2-4 Fig 3 Compass Calibration Log - Example 2
DO NOT DISTRIBUTE AP 3456
Page 88 : Wed Jan 02 02:28:52 2002 Alignment 3- 2- 2- 4

3-2-2-4 Fig 4 Compass Calibration Log - Example 33-2-2-4 Fig 4 Compass Calibration Log - Example 3
DO NOT DISTRIBUTE AP 3456
Page 89 : Wed Jan 02 02:28:54 2002 Alignment 3- 2- 2- 4

3-2-2-4 Fig 1a Component Deviations
3-2-2-4 Fig 1b Deviation Graphs
ManoeuvreChapter 1 - Turn and Slip Indicators
Introduction1. The turn and slip indicator comprises two instruments in the same case. The turn indicator is used to indicate the rate atwhich the aircraft changes heading; a rate 1 turn (of 3 degrees per second) is the standard turn during procedural instrumentflying. The instrument is also invaluable while spinning; in a spin it always indicates the direction of yaw. The slip indicator
DO NOT DISTRIBUTE AP 3456
Page 90 : Wed Jan 02 02:28:54 2002 Manoeuvre 3- 2- 3- 1

shows whether or not corrective rudder is required to achieve balanced flight.
THE TURN INDICATOR
Construction2. The construction of a basic turn indicator is illustrated in Fig 1, where the X (roll), Y (pitch), and Z (yaw) gyro axes areshown. The instrument consists of a rate gyro mounted with its spin axis arthwartships, and with only one gimbal such that ithas freedom in roll only. This freedom is, however, limited by a restraining spring connecting the gimbal to the outer casing.Movement of the gimbal is transmitted to a pointer on the instrument face via a reverse gearing. This gearing is so arranged thatgimbal tilt to the right causes the pointer to move to the left and vice versa. The gimbal is damped and gimbal stops preventinstrument damage at high turn rates. The scale is non-linear, the calibrations representing standard rate turns (Rate 1, 180° permin; Rate 2, 360° per min; Rate 3, 540° per min). As gyro speed is critical to accuracy, any change is sensed by centrifugalswitches which control the DC motor.
Principle of Operation3. Consider, in respect of Fig 1, a banked turn to the left. When the instrument casing rotates around the X axis, the gyro'srigidity causes it to remain spatially fixed, extending the spring which exerts an anti-clockwise torque. This torque in turnproduces a secondary (or indirect) precessionary force about the Z axis in the direction in which the aircraft is starting to turn. Infact, the gyroscope has no freedom to move independently about its Z axis, but a state of equilibrium will be reached when therate of turn of the aircraft equals the rate of secondary precession induced in the gyroscope. If the aircraft rate of turn becomesfaster than the secondary precession rate of the gyroscope, primary (or direct) bearing-induced precession will tilt the gyrofurther to the right with respect to the casing, so increasing the spring tension and causing increased secondary precession until abalance is once again restored. Conversely, if the aircraft rate of turn decreases, primary bearing-induced precession will tilt thegyro to the left with respect to the casing, reducing spring tension and reducing the rate of secondary precession until it matchesthe aircraft turn rate. At equilibrium the tilt angle of the gyroscope within its casing is related to the aircraft rate of turn and thedial can be calibrated accordingly.
3-2-3-1 Fig 1 Turn Indicator - Simplified Construction
Errors4. Pitching Error. The turn indicator measures the rate of turn about the yaw axis and movement about the pitch axis, whichcoincides with the gyro spin axis, would not, ideally produce any gyro precession. However, if the aircraft is simultaneouslyyawed and pitched nose up, gyro axis cross-coupling can cause a torque to be applied such that the indicated rate of turn will
DO NOT DISTRIBUTE AP 3456
Page 91 : Wed Jan 02 02:28:55 2002 Manoeuvre 3- 2- 3- 1

exceed the true rate of turn. The error is dependent on the rate of yaw and the rate of pitch, and in some circumstances can causefull scale deflection of the indicator. The error is unlikely to be corrected until the rate of pitch is significantly reduced and as aconsequence it may continue to indicate a turn in one direction while the aircraft turns in the other. Conversely, with nose downpitch, the instrument will under-read, and in extreme cases may indicate zero regardless of actual turn rate.
5. Gyro Speed Errors. The angle of tilt, θ, of a rate gyro is given by:
µ = Rate of turn £ I!
where I = Moment of inertia of the gyro
and ω = Angular velocity of the gyro
Thus if the angular velocity (rotor speed) of the gyro is altered a different angle of tilt is generated by the same rate of turn. Anover-speeding gyro is uncommon because of the speed governing system, but electrical faults or excessive bearing friction mayproduce under-speeding. This will be manifest as under-reading and an oversensitive, badly damped, needle.
THE SLIP INDICATOR
Operation6. The slip indicator consists of a ball mounted in a curved, clear tube filled with a damping liquid. When the aircraft is instraight, balanced flight the only force acting on the ball is gravity, and the ball will be in the centre of the tube (Fig 2a).
3-2-3-1 Fig 2 Operation of Slip Indicator
7. If the aircraft is in straight but unbalanced flight, the pilot will be countering the rudder-induced yaw with opposite bank.The tube is tilted with respect to the outside world and gravity takes the ball to the lowest position of the tube (Fig 2b).
8. In a properly balanced turn, centrifugal force acts on the ball in addition to gravity, and the resultant of these two forcescauses the ball to remain in the centre of the tube (Fig 2c). If the aircraft is slipping inwards (ie the relative airflow is comingfrom the inside of the turn), the ball will be displaced towards the low wing. Conversely if the aircraft is skidding outwards(with the relative airflow coming from the outside of the turn), the ball will be displaced towards the high wing. In all cases thecorrective action is to move the feet to 'kick' the ball back to the centre (ie if the ball is to the right of the tube, more right rudderis needed).
Summary of Turn and Slip Indications9. Fig 3 summarizes various situations that the turn and slip indicator can show, together with the correct sense of ruddermovement required.
3-2-3-1 Fig 3 Indications of Turn and Slip in Flight
DO NOT DISTRIBUTE AP 3456
Page 92 : Wed Jan 02 02:28:55 2002 Manoeuvre 3- 2- 3- 1

3-2-3-1 Fig 2a Straight and Balanced Flight
3-2-3-1 Fig 2b Side-slip
3-2-3-1 Fig 2a Straight and Balanced Flight
3-2-3-1 Fig 2b Side-slip
DO NOT DISTRIBUTE AP 3456
Page 93 : Wed Jan 02 02:28:55 2002 Manoeuvre 3- 2- 3- 1

3-2-3-1 Fig 2c Balanced Turn
ManoeuvreChapter 2 - Attitude Indicators
3-2-3-1 Fig 2c Balanced Turn
ManoeuvreChapter 2 - Attitude Indicators
DO NOT DISTRIBUTE AP 3456
Page 94 : Wed Jan 02 02:28:55 2002 Manoeuvre 3- 2- 3- 2
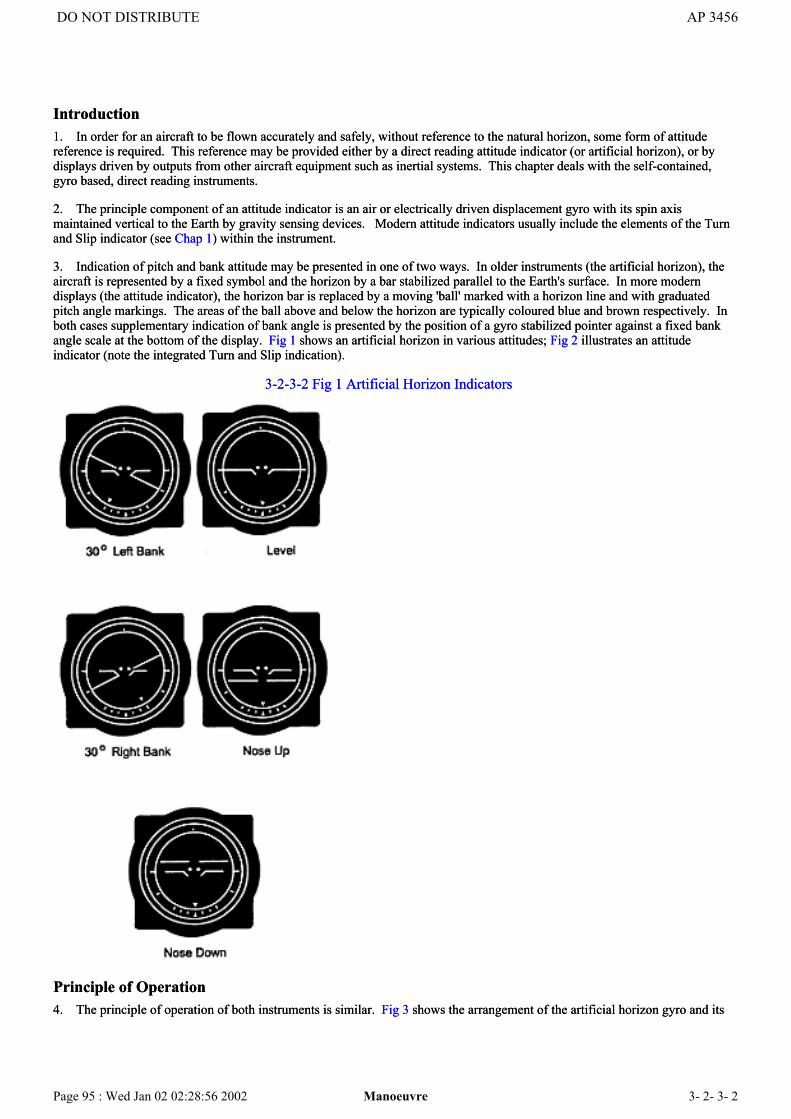
Introduction1. In order for an aircraft to be flown accurately and safely, without reference to the natural horizon, some form of attitudereference is required. This reference may be provided either by a direct reading attitude indicator (or artificial horizon), or bydisplays driven by outputs from other aircraft equipment such as inertial systems. This chapter deals with the self-contained,gyro based, direct reading instruments.
2. The principle component of an attitude indicator is an air or electrically driven displacement gyro with its spin axismaintained vertical to the Earth by gravity sensing devices. Modern attitude indicators usually include the elements of the Turnand Slip indicator (see Chap 1) within the instrument.
3. Indication of pitch and bank attitude may be presented in one of two ways. In older instruments (the artificial horizon), theaircraft is represented by a fixed symbol and the horizon by a bar stabilized parallel to the Earth's surface. In more moderndisplays (the attitude indicator), the horizon bar is replaced by a moving 'ball' marked with a horizon line and with graduatedpitch angle markings. The areas of the ball above and below the horizon are typically coloured blue and brown respectively. Inboth cases supplementary indication of bank angle is presented by the position of a gyro stabilized pointer against a fixed bankangle scale at the bottom of the display. Fig 1 shows an artificial horizon in various attitudes; Fig 2 illustrates an attitudeindicator (note the integrated Turn and Slip indication).
3-2-3-2 Fig 1 Artificial Horizon Indicators
Principle of Operation4. The principle of operation of both instruments is similar. Fig 3 shows the arrangement of the artificial horizon gyro and its
DO NOT DISTRIBUTE AP 3456
Page 95 : Wed Jan 02 02:28:56 2002 Manoeuvre 3- 2- 3- 2

gimbals. The inner gimbal forms the rotor casing and is pivoted to the outer gimbal ring parallel to the aircraft's pitch axis (YY).The outer gimbal is pivoted to the front and rear of the instrument case parallel to the aircraft's roll axis (XX). This arrangementensures that with the gyro spin axis maintained vertical to the Earth, all three axes of the gyro are mutually at right angles whenthe aircraft is in straight and level flight and are coincident with the three aircraft axes. The aircraft symbol is fixed to the frontglass of the instrument.
3-2-3-2 Fig 2 Attitude Indicator
3-2-3-2 Fig 3 Artificial Horizon Principle
DO NOT DISTRIBUTE AP 3456
Page 96 : Wed Jan 02 02:28:56 2002 Manoeuvre 3- 2- 3- 2

5. Any change in pitch attitude will result in the instrument case and the outer gimbal rotating around the YY axis of the gyro.A pin attached to the gyro housing moves in a slot in the horizon bar, producing the correct sense of horizon bar movement,relative to the aircraft symbol. The major drawback to this arrangement is that it results in a non-linear scaling in pitch, withreduced sensitivity at high pitch angles. Any change in bank attitude will result in the instrument case rotating around the XXaxis, taking the aircraft symbol with it. In some instruments the movements are also sensed electrically so that attitudeinformation can be transmitted to other aircraft equipment.
6. Fig 4 shows the general construction of the attitude indicator. Bank is indicated in exactly the same manner as described forthe artificial horizon, but the pitch mechanism is greatly improved - movement of the gyro unit relative to the outer gimbalproducing correct sense movement of the ball by a direct drive consisting of either a wire loop (as shown), or gearwheels.Attitude indicators are therefore equally sensitive at both low and extreme pitch angles.
3-2-3-2 Fig 4 Attitude Indicator Principle
DO NOT DISTRIBUTE AP 3456
Page 97 : Wed Jan 02 02:28:56 2002 Manoeuvre 3- 2- 3- 2

Control of the Gyro Spin Axis7. To provide accurate indications the gyro spin axis must be maintained vertical to the Earth and therefore correcting torquesmust be applied to compensate for Earth rotation, transport error, and internally generated torques due to any gimbal imbalanceor bearing friction.
8. The gyro spin axis is kept vertical by a pendulous system which responds to Earth's gravity and thus initiates the necessarycorrecting torques (which can be compensated for axis cross-coupling during turns) either mechanically or by controlling theoperation of air jets or electric torque motors.
9. Turning and Acceleration Errors. A pendulous system responds not only to Earth's gravity but also to any accelerationforce that the aircraft experiences. This force will displace the pendulous system and the torque generated by the erecting systemwill cause a misalignment of the spin axis to produce a verticality error. To prevent the generation of significant gyro verticalityerror with high acceleration, a cut-off device can be incorporated to inhibit the erecting system above a pre-determined level ofhorizontal acceleration. However if accelerated flight below the cut-off limit is maintained, considerable verticality error can bebuilt up, which may affect indications in both pitch and roll, influenced by factors such as axis cross-coupling and gyroprecession. Acceleration errors cannot be fully eliminated, but they can be reduced by the use of compensating design andconstruction features.
10. Fast Erection. After extended periods of manoeuvring the gyro may have very large verticality error or it may be toppled.To restore the gyro to its normal operating position as quickly as possible, a fast erection mechanism is fitted which applieshigh-rate precessing torques to erect the gyro with respect to the instrument casing. The aircraft must therefore be in unbanked,level, flight when this facility is used. It may also be selected following start-up when errors in attitude indications areapparent.
Controlled Precession11. It is necessary that the attitude indication should be consistent and coherent over the full flight envelope of an unrestrictedmanoeuvrability aircraft, irrespective of how any particular attitude is achieved. For example an inverted flight, zero pitchattitude may result from a 180° roll or from a 180° pitch manoeuvre, starting from wings level flight.
DO NOT DISTRIBUTE AP 3456
Page 98 : Wed Jan 02 02:28:56 2002 Manoeuvre 3- 2- 3- 2

12. In both cases the outer gimbal is required to rotate 180° relative to the airframe. During a 180° roll manoeuvre, the rotationof the airframe and instrument case around the gyro-stabilized outer gimbal provides the necessary inverted flight indication. Toretain the correct attitude display during a 180° pitch manoeuvre however, a rapid 180° rotation of the outer gimbal has to occurjust before passing the vertical (otherwise the outer gimbal axis would become coincident with the gyro spin axis, the conditionof gimbal lock, leading to topple). The means of achieving this is known as Controlled Precession.
13. Inner gimbal resilient stops are incorporated in the instrument to cause the pitch rotation of the airframe to apply a torque tothe gyro, about the inner gimbal YY1 axis, at about 85° of pitch. This causes the gyro to precess, forcing the outer gimbal torotate. After 180° of rotation the continuing pitch rate of the aircraft results in the inner gimbal moving away from the stop.However, if the aircraft is held in the vertical, during a stall turn or climbing roll for example, the instrument may topple.
Geometric Error14. Many aircraft have instrument panels inclined from the vertical in normal cruise flight. Zero pitch attitude indication isrestored by adjusting the linkage to the indicator to correct for the tilt. However the inner gimbal stops are intercepted early indive and late in climb relative to the attitude of the airframe. This geometric offset produces errors, known as geometric errors,in the displayed attitude which vary as a function of the true pitch and bank angles. If the aircraft is looped or rolled inverted thepitch error is twice the panel tilt angle. At intermediate bank angles the geometric error in pitch increases from zero at 0° bankangle, to tilt angle at ± 90° bank angle, and twice tilt angle at 180° bank angle. The geometric error in roll cannot be expressedso simply but in any case is < 5° at pitch angles less than ± 30°. In manoeuvres involving large pitch or bank angles geometricerrors can combine with limitations in the controlled precession system to produce a significant error in the displayed attitude.
ManoeuvreChapter 3 - Accelerometers
Introduction1. An indicating accelerometer is an instrument used in aircraft to provide a visual indication of acceleration components in thedirection of the aircraft Z axis (Fig 1). In addition auxiliary pointers are provided which preserve a reading of the maximum andminimum accelerations sustained during any period; these can be reset as required.
3-2-3-3 Fig 1 Aircraft Axes
2. The purpose of the instrument is to indicate loadings due to manoeuvre and turbulence, so that excessive loadings may beavoided.
DO NOT DISTRIBUTE AP 3456
Page 99 : Wed Jan 02 02:28:57 2002 Manoeuvre 3- 2- 3- 3

3. Although the accelerometer gives a reasonably accurate indication of the accelerations encountered in flight, indications ofthe instrument with respect to accelerations of extremely short duration, such as landing shocks, should be treated with cautionsince the accuracy under these conditions is dependent on the damping characteristics and no generalization is possible.
4. The instrument should be mounted on a rigid part of the aircraft structure in the cockpit. Accurate results cannot beobtained from accelerometers mounted on anti-vibration mountings which would tend to reduce the effect of accelerations on theinstrument.
Principle of Operation5. An accelerometer depends upon the displacement of a mass under the influence of an acceleration. Fig 2 illustrates theprinciple of operation, although other mechanisms may be used. The mass-weight, suspended between 2 springs, is free to movealong the aircraft Z axis and is coupled to a main shaft so that when vertical acceleration forces along the Z axis are imposed onthe mass, the main shaft is caused to rotate. The linear movement is thus converted to the rotary movement of a set of threepointers, one to indicate instantaneous acceleration and the other two to remain at the maximum indications, plus or minus, untilreset manually.
3-2-3-3 Fig 2 Accelerometer Mechanism
6. A cranked lever is attached to the shaft, and the horizontal arm of this lever is interposed between positive and negativepointers so that they will be moved when the shaft rotates, and will remain in their new positions on the return of the shaft to theneutral position. The recording pointers may be reset to the neutral position when desired. A device is fitted to damp outvibrations and prevent violent pointer fluctuations under short period accelerations.
7. Fig 3 shows a typical cockpit display.
8. The cockpit accelerometer should not be confused with the aircraft fatigue meter. This instrument will normally be installedoutside the cockpit (often in the undercarriage bay) to monitor cumulative acceleration forces on the airframe. Details of the
DO NOT DISTRIBUTE AP 3456
Page 100 : Wed Jan 02 02:28:57 2002 Manoeuvre 3- 2- 3- 3

fatigue meter may be found in this volume, Pt 4, Sect 4, Chap 2, Para 15 and in Vol 1, Pt 1, Sect 2, Chap 2, Para 12.
3-2-3-3 Fig 3 Accelerometer Display
ManoeuvreChapter 4 - Stall Warning and Angle of Attack Indication
Introduction1. For any given configuration, an aircraft will stall or depart from controlled flight once a specific angle of attack (AOA) isexceeded. In straight and level flight this angle of attack will be reached at a particular airspeed for a given aircraft weight, butsince there will be variations in aircraft weight both during and between flights, there is no simple correlation between airspeedand angle of attack. During manoeuvre the situation becomes considerably more complex, and the critical angle of attack can beinduced by the pilot at almost any airspeed. The airspeed indicator is therefore of limited use in warning the crew of theapproach to this potentially dangerous situation, and some other means must be devised.
2. The pilot of an aerodynamically unsophisticated aircraft will usually be given warning by the onset of airframe buffet whichcan be felt through the control column. However, in modern, more complex, aircraft this is less likely to be the case, andmoreover the situation is more difficult to recover if the limit should be exceeded. It is therefore necessary to have a systemwhich will warn the crew of the onset of departure, either by artificially inducing buffet on the controls, or by giving some audioor visual indication, or both, once a designated AOA is exceeded.
3. Whereas a simple stall warning device can give adequate warning to the crew, it cannot indicate the margin of safety thatexists at any time. Furthermore, in high performance aircraft it is usually desirable to fly at the optimum angle of attack for anystage of flight. Such aircraft are often therefore fitted with an AOA indexer to indicate when the aircraft is flying at the optimumapproach AOA regardless of aircraft weight, and this may be replaced by or supplemented with an AOA gauge to enable theaircraft to be flown efficiently during other stages of flight.
Simple Stall Warner4. A typical simple stall warning device comprises a forward facing vane, edge on to the airflow, mounted on the leading edgeof the wing. The vane is spring loaded to the central position and in flight the vane is held in place by air pressure when the
DO NOT DISTRIBUTE AP 3456
Page 101 : Wed Jan 02 02:28:57 2002 Manoeuvre 3- 2- 3- 4

AOA is safe, but is pushed upwards when it is not. This upward movement operates a micro-switch which triggers an audio orvisual stall warning device in the cockpit, or can be used to initiate a stick shaker or pusher.
Airstream Direction Detector (ADD)5. Where a more sophisticated system is needed, some form of airstream direction detector (ADD) is employed which measuresthe direction of the localized airflow striking it, and relays this information to an indexer, gauge, warning device, or anycombination of these. A simple example may consist of a trailing aerofoil, mounted on the outside of the aircraft, which alignsitself with the direction of the local airflow.
6. A paddle type of ADD is illustrated in Fig 1. A cylindrical casing carries a central shaft which is free to rotate through arestricted angular range (typically 50°). The shaft protrudes through one end of the casing and through the aircraft skin to form aprobe into the local airflow. Two rows of forward facing slots are cut near the outer end of the probe, and each row is connectedby internal ducts to two paddle chambers located within the casing. Operating in these chambers are paddles which are attachedto the central shaft. Pressure from one of the ducts acts on both paddles to induce clockwise rotation of the shaft while pressurefrom the other duct similarly induces anti-clockwise rotation. Thus, if the pressures in the two ducts are equal, the probe will notrotate. This equal pressure state can only occur if the two rows of slots are equally disposed about the direction of the localairstream. In conditions of misalignment the pressure in one duct will be greater than in the other, and the paddles will becaused to rotate until the probe is once again aligned with the airstream, whence the pressures will be equalized and the probewill stop rotating. Thus, providing that there is sufficient airflow to operate the system (typically above 50 kts), the probe willfollow any changes in the direction of the local airflow.
7. The position of the central shaft relative to the casing, and therefore to the aircraft, is transmitted to potentiometer assembliesby means of wiper arms, and the output voltage, which is related to AOA, may be used to operate the particular aircraftindicators or warning devices. In some installations two ADDs are provided to add a measure of redundancy, and so that theoutput voltage from the two can be compared, and the higher taken, to provide an additional margin of safety.
8. An ADD can only measure the direction of the local airflow, and not the AOA explicitly, although changes in this measureddirection reflect changes in AOA. Accordingly, an AOA gauge is marked in arbitrary units (usually 0 - 30) rather than in angles(of attack).
3-2-3-4 Fig 1 Paddle Type of Airstream Direction Detector (ADD)
NAVIGATION SYSTEMS
Control SystemsChapter 1 - Remote Indication and Control
DO NOT DISTRIBUTE AP 3456
Page 102 : Wed Jan 02 02:28:58 2002 Control Systems 3- 3- 1- 1
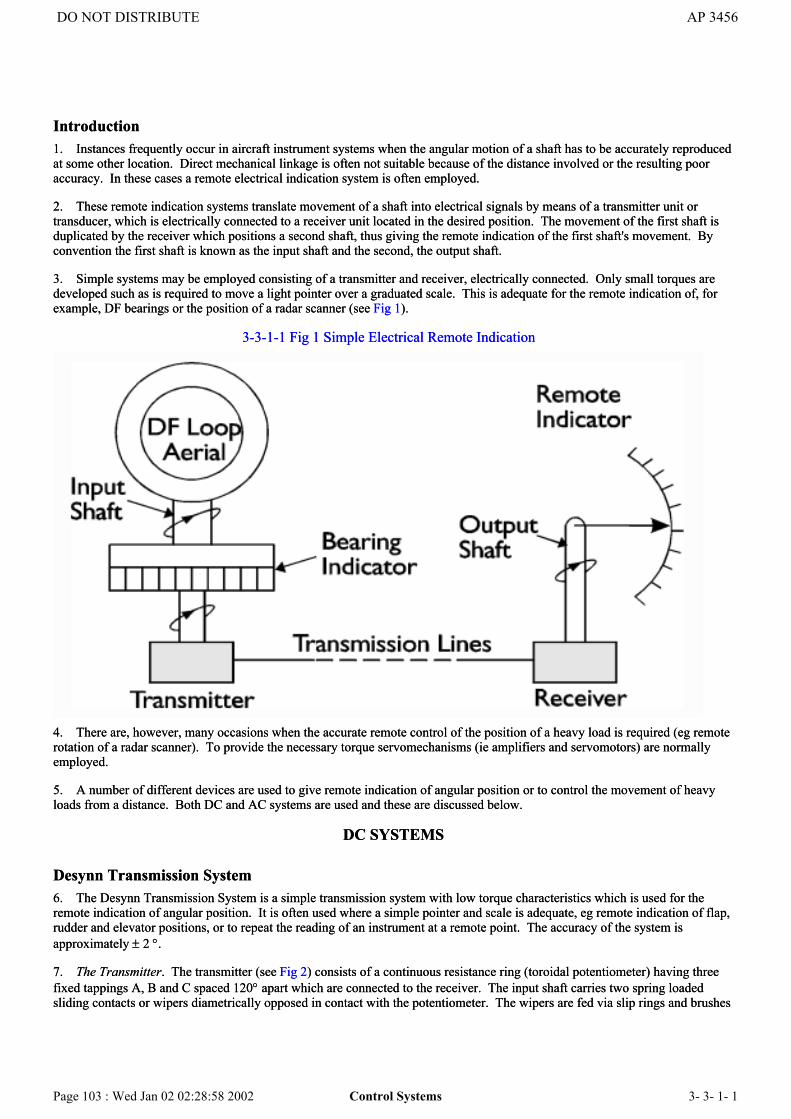
Introduction1. Instances frequently occur in aircraft instrument systems when the angular motion of a shaft has to be accurately reproducedat some other location. Direct mechanical linkage is often not suitable because of the distance involved or the resulting pooraccuracy. In these cases a remote electrical indication system is often employed.
2. These remote indication systems translate movement of a shaft into electrical signals by means of a transmitter unit ortransducer, which is electrically connected to a receiver unit located in the desired position. The movement of the first shaft isduplicated by the receiver which positions a second shaft, thus giving the remote indication of the first shaft's movement. Byconvention the first shaft is known as the input shaft and the second, the output shaft.
3. Simple systems may be employed consisting of a transmitter and receiver, electrically connected. Only small torques aredeveloped such as is required to move a light pointer over a graduated scale. This is adequate for the remote indication of, forexample, DF bearings or the position of a radar scanner (see Fig 1).
3-3-1-1 Fig 1 Simple Electrical Remote Indication
4. There are, however, many occasions when the accurate remote control of the position of a heavy load is required (eg remoterotation of a radar scanner). To provide the necessary torque servomechanisms (ie amplifiers and servomotors) are normallyemployed.
5. A number of different devices are used to give remote indication of angular position or to control the movement of heavyloads from a distance. Both DC and AC systems are used and these are discussed below.
DC SYSTEMS
Desynn Transmission System6. The Desynn Transmission System is a simple transmission system with low torque characteristics which is used for theremote indication of angular position. It is often used where a simple pointer and scale is adequate, eg remote indication of flap,rudder and elevator positions, or to repeat the reading of an instrument at a remote point. The accuracy of the system isapproximately ± 2 °.
7. The Transmitter. The transmitter (see Fig 2) consists of a continuous resistance ring (toroidal potentiometer) having threefixed tappings A, B and C spaced 120° apart which are connected to the receiver. The input shaft carries two spring loadedsliding contacts or wipers diametrically opposed in contact with the potentiometer. The wipers are fed via slip rings and brushes
DO NOT DISTRIBUTE AP 3456
Page 103 : Wed Jan 02 02:28:58 2002 Control Systems 3- 3- 1- 1

with DC.
8. The Receiver. The receiver (see Fig 2) consists of three high resistance coils whose axes are spaced 120° apart, with apermanent magnet rotor pivoted at their centre carrying a pointer. The three coils are connected to the tapping points A, B and Cin the transmitter.
9. Desynn Operation. When DC is applied to the transmitter wipers, the voltages at the tapping points A, B and C produce acurrent flow in the three stators of the receiver and a resultant magnetic field is produced. The rotor magnet aligns itself withthis magnetic field. The magnitude and polarity of each tapping point voltage varies according to the position of the wipers andthus, if the input shaft is rotated, the change of voltages at A, B and C produces a variation in the current flowing in the statorcoils and rotation of the resultant magnetic field in sympathy with the rotation of the input shaft. The rotor magnet remainsaligned with this field at all times and so rotates in synchronism with the input shaft. This operation is shown in Fig 3a and b:
a. In Fig 3a the voltage distribution around the potentiometer is such that point A is at +24 V while B and C are both at +8V. Thus, as the voltage at A differs from that at B and C by the same amount, current flows from A through coil A in thereceiver then divides equally at the star point with half the total current flowing through coil B and half through coil C backto the transmitter. The resultant magnetic field in the receiver, with which the rotor magnet aligns itself, is compoundedfrom the vectors representing the individual fields.
3-3-1-1 Fig 2 Desynn Transmission System
3-3-1-1 Fig 3 Operation of Desynn Transmission System
DO NOT DISTRIBUTE AP 3456
Page 104 : Wed Jan 02 02:28:58 2002 Control Systems 3- 3- 1- 1
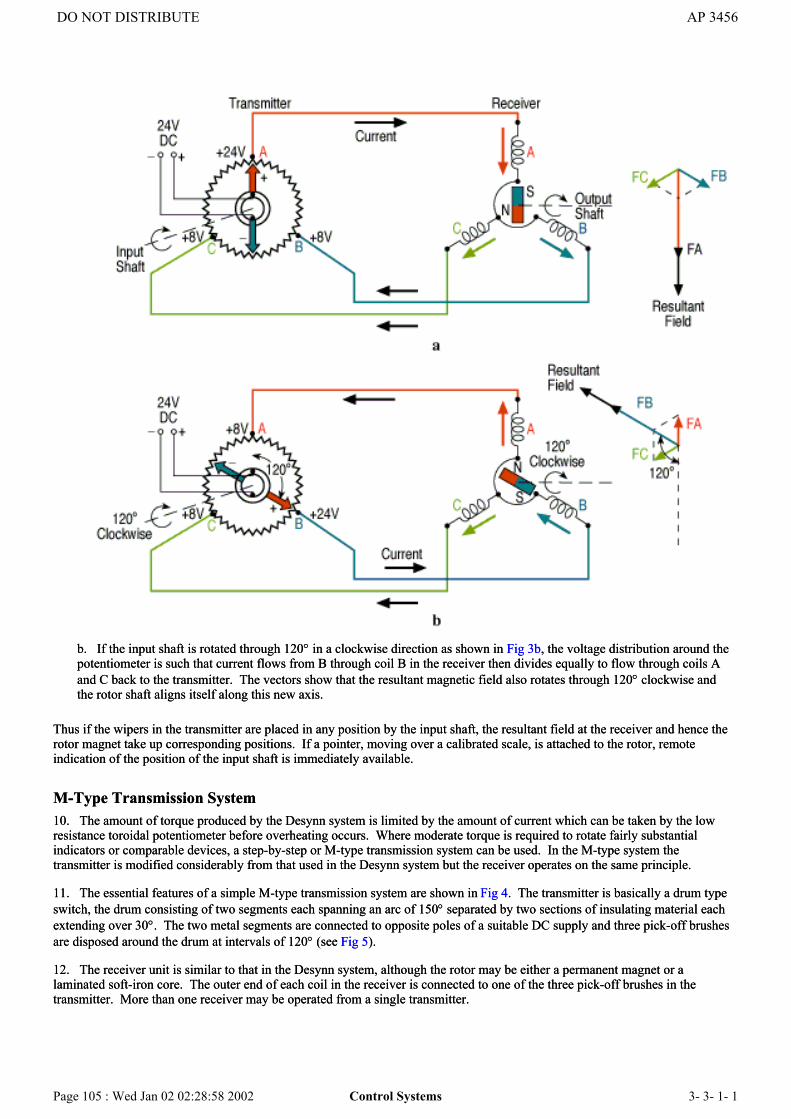
b. If the input shaft is rotated through 120° in a clockwise direction as shown in Fig 3b, the voltage distribution around thepotentiometer is such that current flows from B through coil B in the receiver then divides equally to flow through coils Aand C back to the transmitter. The vectors show that the resultant magnetic field also rotates through 120° clockwise andthe rotor shaft aligns itself along this new axis.
Thus if the wipers in the transmitter are placed in any position by the input shaft, the resultant field at the receiver and hence therotor magnet take up corresponding positions. If a pointer, moving over a calibrated scale, is attached to the rotor, remoteindication of the position of the input shaft is immediately available.
M-Type Transmission System10. The amount of torque produced by the Desynn system is limited by the amount of current which can be taken by the lowresistance toroidal potentiometer before overheating occurs. Where moderate torque is required to rotate fairly substantialindicators or comparable devices, a step-by-step or M-type transmission system can be used. In the M-type system thetransmitter is modified considerably from that used in the Desynn system but the receiver operates on the same principle.
11. The essential features of a simple M-type transmission system are shown in Fig 4. The transmitter is basically a drum typeswitch, the drum consisting of two segments each spanning an arc of 150° separated by two sections of insulating material eachextending over 30°. The two metal segments are connected to opposite poles of a suitable DC supply and three pick-off brushesare disposed around the drum at intervals of 120° (see Fig 5).
12. The receiver unit is similar to that in the Desynn system, although the rotor may be either a permanent magnet or alaminated soft-iron core. The outer end of each coil in the receiver is connected to one of the three pick-off brushes in thetransmitter. More than one receiver may be operated from a single transmitter.
DO NOT DISTRIBUTE AP 3456
Page 105 : Wed Jan 02 02:28:58 2002 Control Systems 3- 3- 1- 1

3-3-1-1 Fig 4 M-Type Transmission System
13. System Operation. Operation of the M-type transmission system is shown in Fig 6.
a. In position 1 of the input shaft, brush 1 is connected to the negative supply and brushes 2 and 3 to the positive. Thesepolarities are applied to the three coils in the receiver so that the current divides through coils 2 and 3 with all the currentflowing through coil 1. Magnetic fields F1, F2 and F3 are produced and vector resolution produces the resultant field asshown.
b. Rotation of the input shaft through 30° clockwise ( position 2 in Fig 6 ) produces a condition where brush 1 is negative,brush 2 is disconnected by the insulated segment and brush 3 is positive. At the receiver, equal currents flow through coils1and 3, while coil 2 carries no current. Resolution of fields F1, F2 and F3 now produces a resultant field which is seen tohave rotated through 30° clockwise in sympathy with the input shaft.
3-3-1-1 Fig 5 M-Type Drum Transmitter
c. The condition after a further 30° rotation of the input shaft is shown at position 3. The resultant field, again following
DO NOT DISTRIBUTE AP 3456
Page 106 : Wed Jan 02 02:28:59 2002 Control Systems 3- 3- 1- 1

the input shaft, is now rotated 60° from the initial position.
The receiver rotor aligns itself with the axis of the resultant field and hence the angular movement of the input shaft, but only indiscreet steps of 30°. There is a change of pick-off brush polarity at one or other of the brushes each time the, input shaft isturned through 30°. For certain purposes, the 30° step is too large and a modified system, giving 24 steps of 15° each, may beused to improve the sensitivity of the system.
14. Types of Transmitter. Two other types of transmitter are in common use in M-type transmission systems. These arecommutator and eccentric cam type transmitters. The former is a development of the drum transmitter and gives 24 x 15° steps.The latter does not suffer from brush wear and is preferred when the rotation rate is high.
3-3-1-1 Fig 6 Operation of M-Type Transmission
15. Types of Receiver. The rotor of the the receiver may be either of the soft iron (inductor) type or a permanent magnet. Theinductor rotor is built up of iron and aluminium laminations and continuously aligns itself with the axis of the resultant field inthe stator to offer the path of lowest reluctance, ie when the laminations are in line with the resultant flux. Since this type ofrotor is non-polarized it is possible for it to align itself in either of two positions 180° apart. The permanent magnet rotor, whichis more commonly used, does not suffer from this ambiguity. Due to the relatively strong magnetic field produced by themagnet, the rotor torque is considerably higher than that of the induced type and, being polarized, the rotor lines up in oneposition only.
16. Synchronization of Transmitter and Receiver. The fact that the receiver rotor in an M-type transmission system only movesin 30° (or 15°) steps is a disadvantage. Greater sensitivity can be achieved by gearing up the input shaft to the transmitter shaft.A 60:1 gearing system is commonly used, the transmitter shaft completing 60 revolutions for each revolution of the input shaft.The receiver is geared down by an equal ratio if a 1:1 output to input ratio is required. Although a 60 times increase in
DO NOT DISTRIBUTE AP 3456
Page 107 : Wed Jan 02 02:28:59 2002 Control Systems 3- 3- 1- 1

sensitivity is obtained in this case, the possibility of ambiguity is introduced. One revolution of the transmitter shaft nowrepresents a rotation of 6° of the input shaft producing 12 steps of 0.5° each (with a 30° step transmitter) and there are 60different positions in the full 360° movement of the input shaft, each separated by 6°, into which the receiver can "lock" and stillfollow the M-type sequence. In all but one of these positions, the output shaft will be out of synchronization with the inputshaft. Initial course synchronization is therefore necessary and this is normally achieved by manual adjustment before thetransmission system is used.
17. Accuracies. Because of frictional and resistive losses, the accuracy of M-type transmission systems is seldom better than±1°. This accuracy is adequate for the remote transmission of shaft rotation rates such as analogues of ground speed, butpresents problems in the transmission of actual shaft position, eg heading.
AC SYSTEMS
Introduction18. The application of the DC systems described above is limited to the remote indication of shaft position and the transmissionof moderate torques to remote indicators or other devices. AC systems are generally preferred for high accuracy applicationsand also where servomechanisms are involved. The AC systems are self-synchronous (hence the name - synchro) and aredivided into four groups:
a. Torque synchros.
b. Control synchros.
c. Differential synchros.
d. Resolver synchros.
Torque Synchros19. The basic torque synchro consists of a transmitter (TX) and a receiver (TR), both of which are very similar. Each has astator made up of three windings, star connected at 120° to each other, and a rotor which is a single winding energized by an ACsupply. Fig 7 shows a diagrammatic representation of a torque synchro system, and the actual construction is shown in Fig 8.The TX and TR rotors differ in that the TR rotor is normally fitted with a mechanical damper to prevent oscillation.
20. Torque Synchro Operation. The operation of torque synchro is shown in Fig 9. The TX rotor, energized by the AC supply,has an associated alternating field which cuts the windings of the TX stator coils producing an induced emf. Because the TXstator windings are in closed circuit with the TR stator windings a current flow occurs which, by Henry's Law, must be of such adirection and magnitude as to produce a field associated with the TX stator which is equal in strength, but in the oppositedirection to the TX rotor inducing field. A similar field, parallel to the
3-3-1-1 Fig 7 Basic Torque Synchro System
DO NOT DISTRIBUTE AP 3456
Page 108 : Wed Jan 02 02:28:59 2002 Control Systems 3- 3- 1- 1

3-3-1-1 Fig 8 Construction of Torque Synchro
3-3-1-1 Fig 9 Operation of the Torque Synchor
3-3-1-1 Fig 8 Construction of Torque Synchro
3-3-1-1 Fig 9 Operation of the Torque Synchor
DO NOT DISTRIBUTE AP 3456
Page 109 : Wed Jan 02 02:28:59 2002 Control Systems 3- 3- 1- 1

TX rotor field, is produced in association with the TR stator. The TX and TR rotors are energized by the same AC supply andthus have associated magnetic fields. The presence of both rotor and stator fields within the TR causes the rotor to turn to alignits field with that of the stator and thus with the fields of the TX stator and rotor. As the phase of the AC supply changes, all thefield directions simply reverse and the system remains in alignment. As the two rotors reach alignment, they induce equal butopposite emfs in the two stators; currentceases to flow and the fields collapse. The stator coils are of low impedance and anyrotor misalignment produces sufficient current flow to produce reasonable torque.
21. Torque Synchro Accuracy. As the torque synchro approaches synchronization, the field structure collapses and theavailable torque falls off. If a high degree of accuracy is required the load must be limited; lightly loaded torque synchroaccuracy is approximately ± 1°.
Control Synchros22. If it is required to move heavier loads a control synchro, employing a separate servomotor to provide the necessary torqueamplification, may be used. Control and torque synchros are similar; both have three-winding stators and single-winding rotors.The control transmitter (CX) rotor is AC energized, but not the control transformer (CT) rotor. A control synchro system isshown at Fig 10.
23. Control Synchro Operation. The CX rotor, fed from an AC supply, produces an alternating field which, by Henry's Law,induces an opposing field in the CX stator. The circuit current causes a magnetic field associated with the CT stator and parallelto the CX rotor field. When the CT rotor is at 90° to the CT stator field there is no induced emf (or error signal) in the rotor: therotor is said to be in the "null" position. If the CX rotor is displaced, the CT field alignment will change and the CT rotor will nolonger be in the “null” position. An emf, proportional to the angular displacement from the null position, is induced in the rotor,the phase of this induced emf depending upon the direction of displacement. The operation of the control system is shown in Fig11. The induced error signal is amplified and fed to one phase of a two phase servomotor which drives the output shaft of theCT rotor. The second phase is supplied by the same AC source supplying the original CX rotor input. The motor drives theoutput shaft and the CT rotor until the induced error signal is zero; the direction of movement being determined by the phase ofthe error signal. A complete control synchro system is shown at Fig 12.
NOTE:Current flow is continuous in the control synchro, the current magnitude being limited by employing highimpedance stators.
24. Control Synchro Accuracy. Using a suitably powered motor, the control synchro accuracy is independent of load. Typicalaccuracy figures are 16 minutes of arc.
DO NOT DISTRIBUTE AP 3456
Page 110 : Wed Jan 02 02:28:59 2002 Control Systems 3- 3- 1- 1

3-3-1-1 Fig 10 Control Synchro System
3-3-1-1 Fig 11 Operation of a Control Synchro System
3-3-1-1 Fig 10 Control Synchro System
3-3-1-1 Fig 11 Operation of a Control Synchro System
DO NOT DISTRIBUTE AP 3456
Page 111 : Wed Jan 02 02:29:00 2002 Control Systems 3- 3- 1- 1

DO NOT DISTRIBUTE AP 3456
Page 112 : Wed Jan 02 02:29:01 2002 Control Systems 3- 3- 1- 1
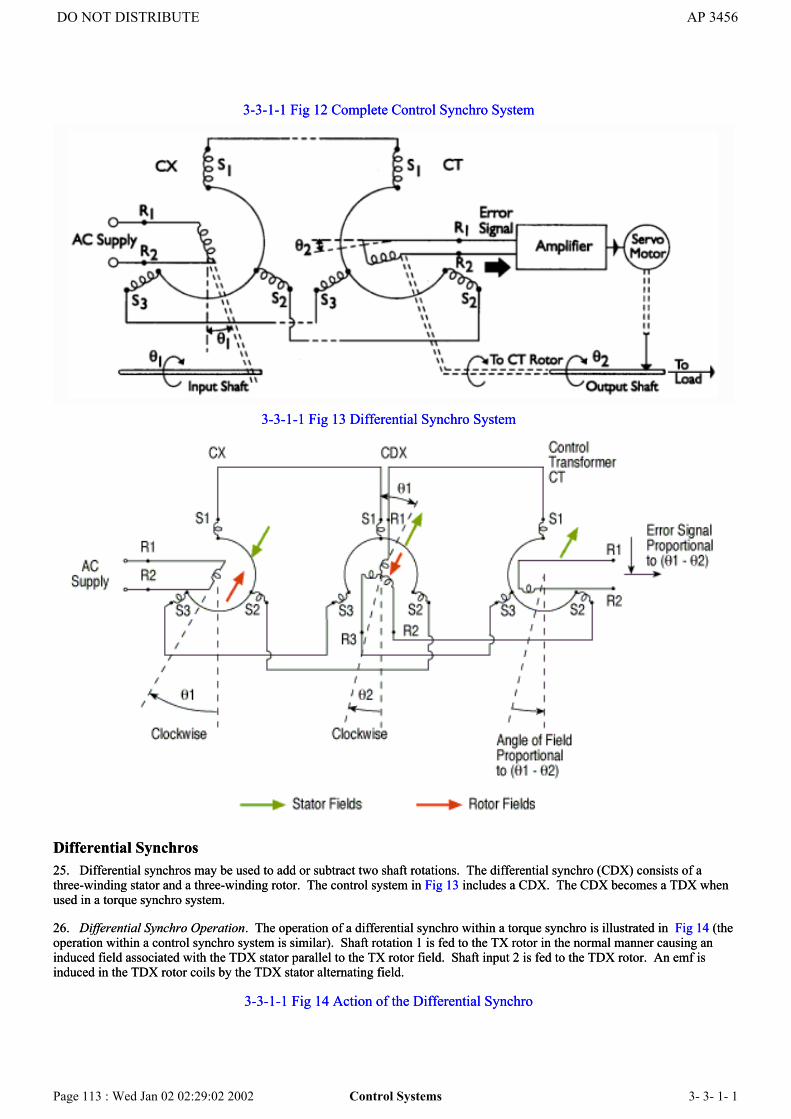
3-3-1-1 Fig 12 Complete Control Synchro System
3-3-1-1 Fig 13 Differential Synchro System
Differential Synchros25. Differential synchros may be used to add or subtract two shaft rotations. The differential synchro (CDX) consists of athree-winding stator and a three-winding rotor. The control system in Fig 13 includes a CDX. The CDX becomes a TDX whenused in a torque synchro system.
26. Differential Synchro Operation. The operation of a differential synchro within a torque synchro is illustrated in Fig 14 (theoperation within a control synchro system is similar). Shaft rotation 1 is fed to the TX rotor in the normal manner causing aninduced field associated with the TDX stator parallel to the TX rotor field. Shaft input 2 is fed to the TDX rotor. An emf isinduced in the TDX rotor coils by the TDX stator alternating field.
3-3-1-1 Fig 14 Action of the Differential Synchro
DO NOT DISTRIBUTE AP 3456
Page 113 : Wed Jan 02 02:29:02 2002 Control Systems 3- 3- 1- 1
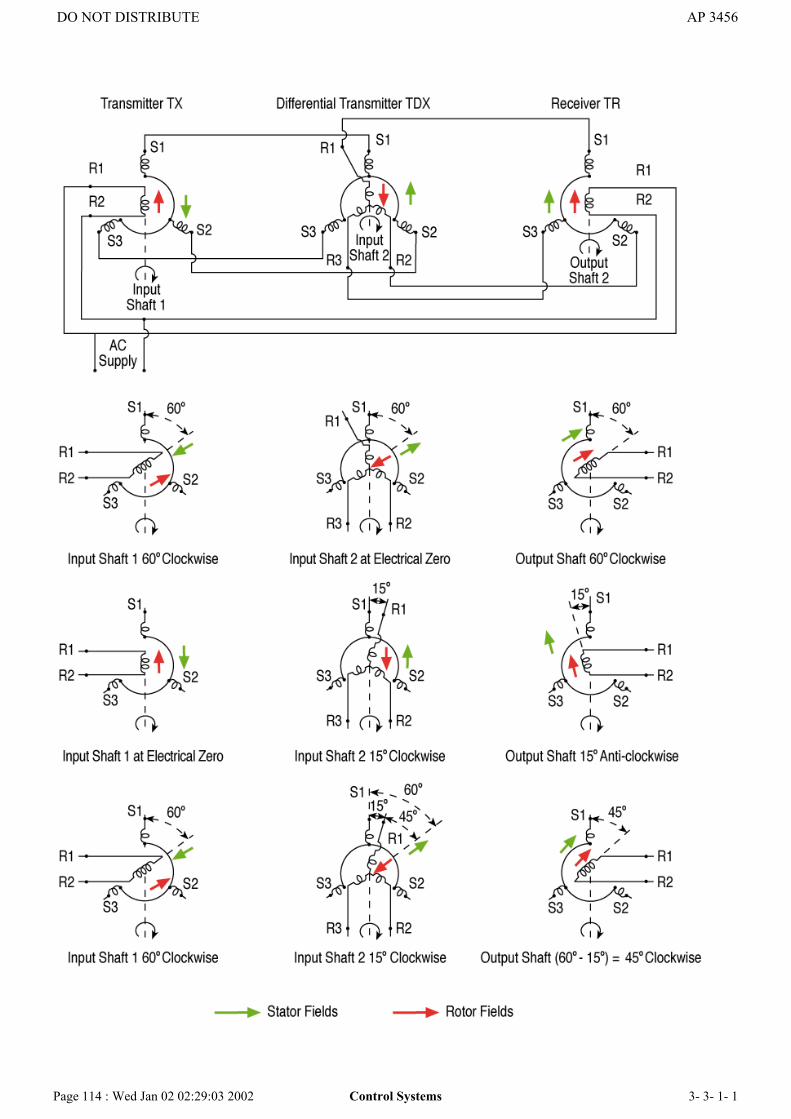
DO NOT DISTRIBUTE AP 3456
Page 114 : Wed Jan 02 02:29:03 2002 Control Systems 3- 3- 1- 1
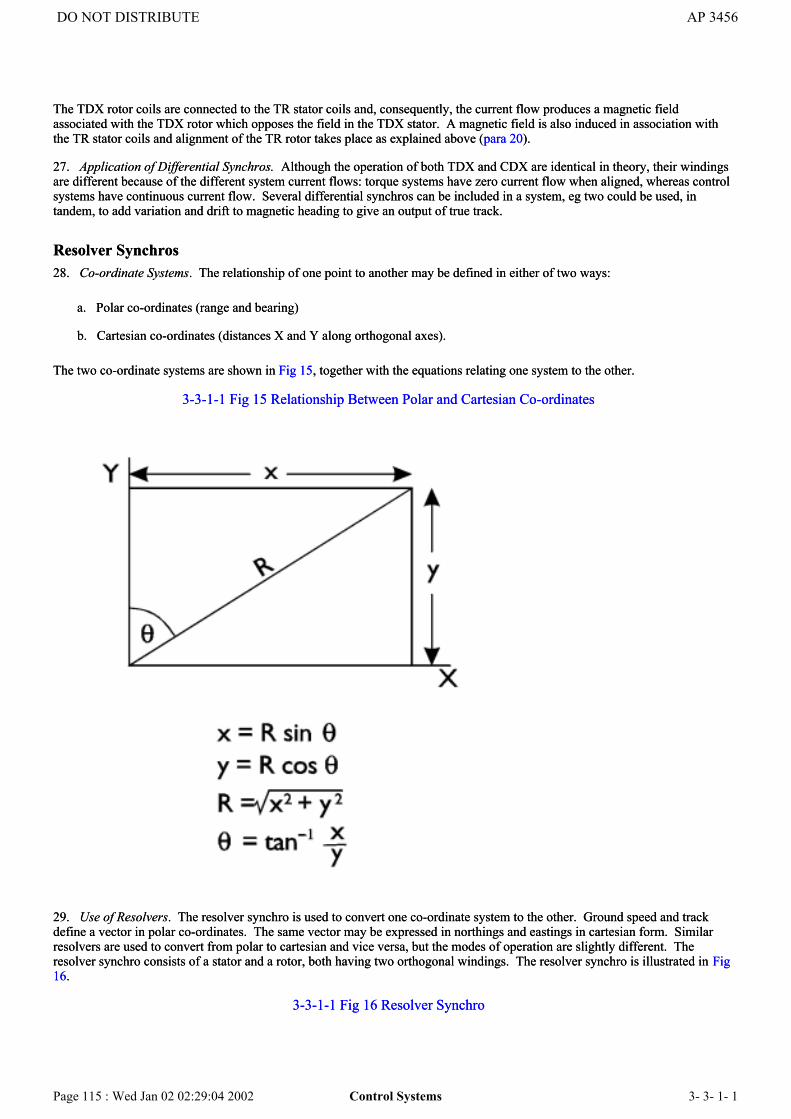
The TDX rotor coils are connected to the TR stator coils and, consequently, the current flow produces a magnetic fieldassociated with the TDX rotor which opposes the field in the TDX stator. A magnetic field is also induced in association withthe TR stator coils and alignment of the TR rotor takes place as explained above (para 20).
27. Application of Differential Synchros. Although the operation of both TDX and CDX are identical in theory, their windingsare different because of the different system current flows: torque systems have zero current flow when aligned, whereas controlsystems have continuous current flow. Several differential synchros can be included in a system, eg two could be used, intandem, to add variation and drift to magnetic heading to give an output of true track.
Resolver Synchros28. Co-ordinate Systems. The relationship of one point to another may be defined in either of two ways:
a. Polar co-ordinates (range and bearing)
b. Cartesian co-ordinates (distances X and Y along orthogonal axes).
The two co-ordinate systems are shown in Fig 15, together with the equations relating one system to the other.
3-3-1-1 Fig 15 Relationship Between Polar and Cartesian Co-ordinates
29. Use of Resolvers. The resolver synchro is used to convert one co-ordinate system to the other. Ground speed and trackdefine a vector in polar co-ordinates. The same vector may be expressed in northings and eastings in cartesian form. Similarresolvers are used to convert from polar to cartesian and vice versa, but the modes of operation are slightly different. Theresolver synchro consists of a stator and a rotor, both having two orthogonal windings. The resolver synchro is illustrated in Fig16.
3-3-1-1 Fig 16 Resolver Synchro
DO NOT DISTRIBUTE AP 3456
Page 115 : Wed Jan 02 02:29:04 2002 Control Systems 3- 3- 1- 1

30. Resolver Synchro (Resolving). In the resolving mode, the resolver synchro converts polar to cartesian co-ordinates egground speed and track to northings and eastings. In this example R (an electrical analogue of groundspeed) is applied, as anAC voltage, to one rotor winding. The rotor is then turned through angle θ (track). The rotor field has components of R cos θ(northings) and R sin θ (eastings) along the stator winding axes; the voltages induced in the stator windings are proportional toR cos θ and R sin θ. The operation of the resolver synchro (resolving) is shown in Fig 17.
31. Resolver Synchro (Compounding). A similar resolver is used to convert cartesian to polar co-ordinates, but in this caseadditional components are needed as shown in Fig 18. The Y and X co-ordinates (northings and eastings) are fed to the statorwindings as AC voltages, the associated fields combining to produce a stator field of magnitude R at an angle θ (R and θ areanalogues of groundspeed and track). One of the rotor windings is connected to an amplifier and servomotor in the same manneras a control receiver (CT). It is therefore driven to a position at 90° to the stator field and the output shaft is turned through theangle θ, thereby deriving track. When the CT connected rotor winding is at 90° to the total stator field, the other rotor windinglies parallel to that field. In this position a field proportional to R is produced in association with this rotor winding and hence avoltage analogue
px2 + y2 of groundspeed may be obtained.
3-3-1-1 Fig 17 Conversion of Polar to Cartesian Co-ordinates
DO NOT DISTRIBUTE AP 3456
Page 116 : Wed Jan 02 02:29:04 2002 Control Systems 3- 3- 1- 1

3-3-1-1 Fig 18 Conversion of Cartesian to Polar Co-ordinates
32. Resolver Synchro (Differential). It is often necessary to produce the sine and cosine of the sum of two angles multiplied bya given value, eg northings and eastings relative to true North represented by R (ground speed), multiplied by cosine and sineθ(true track) may be required as grid northings and grid eastings. If the angle between true North and grid North is representedby φ, then required outputs are R cos (θ + φ) and R sin (θ + φ) as illustrated in Fig 19.
33. Operation of Differential Resolver Synchro. The operation of the differential resolver synchro is shown at Fig 20. Thereare three inputs; R cos θ (true northings) and R sin θ (true eastings) both fed as voltage analogues to the stator coils, φ
DO NOT DISTRIBUTE AP 3456
Page 117 : Wed Jan 02 02:29:05 2002 Control Systems 3- 3- 1- 1

(convergence) is fed as a shaft rotation to position the rotor coils relative to the stator. The fields associated with the stator coilsmay be resolved into 4 sub-fields, two parallel to each rotor coil. From Fig 20, two of the sub-fields are
3-3-1-1 Fig 19 Action of a Resolver Synchro (Differential)
shown to be additive and two subtractive. The sub-field values are:
a. R cos θ cos φ − R sin θ sin φ = R cos (θ + φ).
b. R sin θ cos φ − R cos θ sin φ = R sin (θ + φ).
Output voltages taken from the rotor coils are analogues of Rcos (θ + φ) (grid northings) and Rsin (θ + φ) (grid eastings). Thusthe differential resolver synchro redefines cartesian co-ordinates about a new datum direction. The versatility of the device maybe illustrated by imagining inputs of northings, eastings and desired track. The outputs would then be distance gone along andacross desired track.
3-3-1-1 Fig 20 Operation of Differential Resolver Synchro
DO NOT DISTRIBUTE AP 3456
Page 118 : Wed Jan 02 02:29:05 2002 Control Systems 3- 3- 1- 1
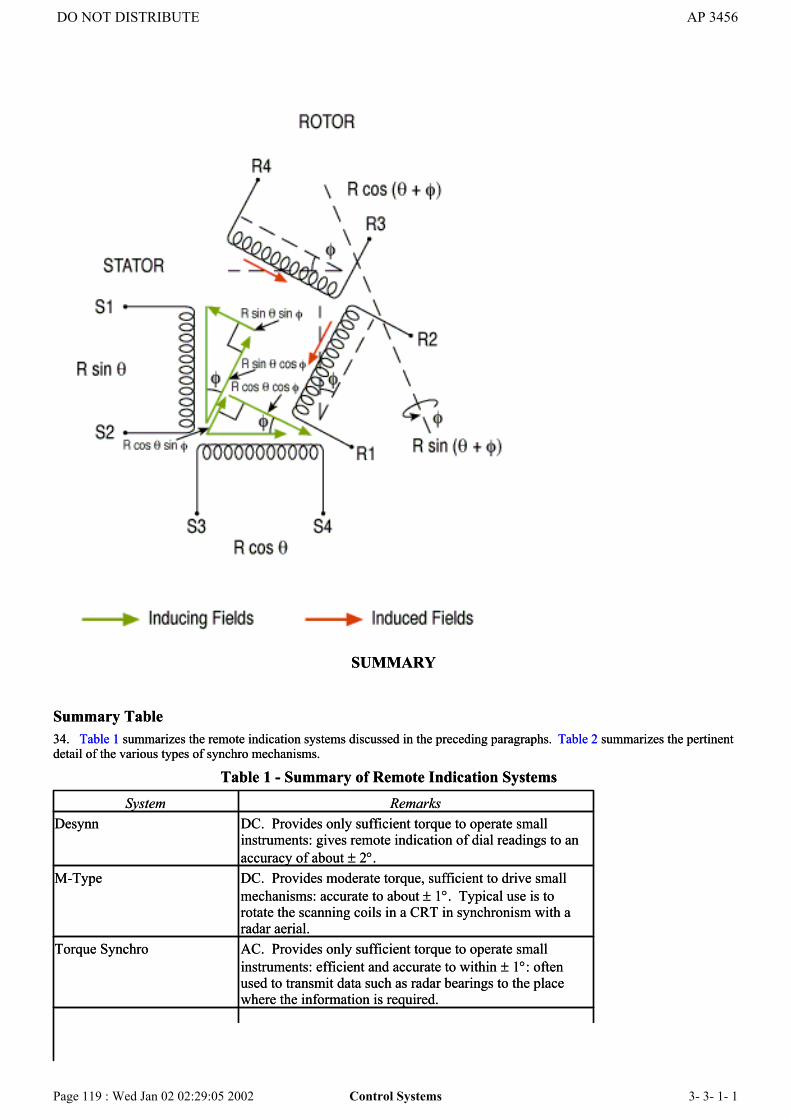
SUMMARY
Summary Table34. Table 1 summarizes the remote indication systems discussed in the preceding paragraphs. Table 2 summarizes the pertinentdetail of the various types of synchro mechanisms.
Table 1 - Summary of Remote Indication SystemsSystem Remarks
Desynn DC. Provides only sufficient torque to operate smallinstruments: gives remote indication of dial readings to anaccuracy of about ± 2°.
M-Type DC. Provides moderate torque, sufficient to drive smallmechanisms: accurate to about ± 1°. Typical use is torotate the scanning coils in a CRT in synchronism with aradar aerial.
Torque Synchro AC. Provides only sufficient torque to operate smallinstruments: efficient and accurate to within ± 1°: oftenused to transmit data such as radar bearings to the placewhere the information is required.
DO NOT DISTRIBUTE AP 3456
Page 119 : Wed Jan 02 02:29:05 2002 Control Systems 3- 3- 1- 1

Torque Differential Synchro AC. As for the torque synchro, but provides summation oftwo input shaft angles, eg to combine a DF loop readingand a compass reading to give true bearing.
Control Synchro AC. Gives an electrical output that is dependent on theerror in alignment between driving shaft and load shaft.The error signal is normally used as the input to a controlsystem driving a heavy load. Accuracy about ± 6' arc.
Control Differential Synchro AC. As for control synchro, but provides summation oftwo input shaft angles.
Resolver Synchro AC. Used in computers to give either cartesian or polarco-ordinates of an input, and for conversion of one to theother: can also be used in a manner similar to that of acontrol synchro.
Resolver Differential Synchro AC. Gives an electrical output in the form of sine andcosine values of the sum or difference of two input angles.
Table 2 - Synchro DetailsComponent Code Inputs Outputs Uses
TorqueTransmitter
TX Mechanical rotationof rotor
Electrical fromstator
Transmits angularinformation
Torque Receiver TR Electrical to stator Mechanicalrotation fromrotor
Operates low torqueequipment
Torque DifferentilTransmitter
TDX Electrical to statorand mechanicalrotation of rotor
Electrical fromrotor
Transmits the sum ofangular inputs
TorqueDifferentialReceiver
TDR Electrical to statorand rotor
Mechanicalrotation fromrotor
Provides low torqueequipment with thesum of two angularinputs
ControlTransmitter
CX Mechanical rotationof rotor
Electrical fromstator
Transmits angularinformation
ControlTransformer
CT Electrical to stator Error signal toservo loop
Control position ofservo mechanism
ControlDifferentialTransmitter
CDX Electrical to statorand mechanicalrotation of rotor
Electrical fromrotor
Transmits the sum oftwo angular inputs
ControlTransmitter withRotatable Stator
CXB Mechanical rotationof stator and rotor
Electrical fromstator
Transmits the sum oftwo angular inputs
Control Receiverwith RotatableStator
CTB Electrical to statorand mechanicalrotation of stator
Error signal toservo loop
Provides a positionservomechanism witha control signal whichis the sum of twoangular inputs
Resolver Synchro(Resolving)
RS Electrical to rotorand mechanicalrotation of rotor
Electrical fromstator
Resolves polarco-ordinate inputs tocartesian co-ordinateoutputs
Resolver Synchro(Compunding)OR Arc/TanResolver
RS Electrical to stator Electrical fromrotor andmechanicalrotation of rotor
Compounds cartesianinputs to polar outputs
DO NOT DISTRIBUTE AP 3456
Page 120 : Wed Jan 02 02:29:05 2002 Control Systems 3- 3- 1- 1

Resolver Synchro(Differential)
RS Electrical to statorand mechanicalrotation of rotor
Electrical fromrotor
Redefines cartesianco-ordinates about anew datum direction
3-3-1-1 Fig 3a
3-3-1-1 Fig 3b
Control SystemsChapter 2 - Servomechanisms
Introduction1. The transmission systems described in Chapter 1 of this Section included many devices capable only of remote indication onlight pointers. At least one, however, the control transmission system, could do more than this. It could not only transmit theinformation over considerable distances, but its receiving element included parts which released much greater power at theoutput than was available at the input. A lightly applied movement at the input could control the position of a heavy load.
2. The receiving elements of the control transmission system are members of a large family of control devices known asservomechanisms, all of which have this ability to amplify the input force. To define a servomechanism (or servo) properly,however, its pattern of operation must follow a particular sequence. This sequence, which need not involve remoteness ofcontrol, will now be examined.
DO NOT DISTRIBUTE AP 3456
Page 121 : Wed Jan 02 02:29:05 2002 Control Systems 3- 3- 1- 2

Simple Control System3. In order to control the position of a radar scanner or other heavy load, an arrangement such as that in Fig 1 could be puttogether.
3-3-1-2 Fig 1 Elements of Control System
4. The control element, perhaps a variable resistor, applies the input to a power amplifier, which drives the motor in therequired direction. The motor, in turn, moves the load.
5. The control element could be calibrated with a scale indicating the angle through which the input is turned. When the inputis moved a voltage proportional to this angle is applied through the amplifier to the motor. The motor accelerates at a ratecompatible with the load inertia and with restraints, such as friction, until it reaches a steady speed with the driving torque equalto the restraining torques.
6. Since restraining torques increase with speed, the load speed, and not its position, is controlled by a device of this type.Clearly the load will not stop at the required position unless some further action is taken.
7. Several courses of action are possible but perhaps the simplest and most obvious is to brief an operator to watch the loadmovement. He could slow the motor down as the load closed on the required position by drawing back on the control element,finally bringing it to rest. His actions would probably be such as to allow high speeds for large load movements and low speedsfor small movements. In other words he would, at any rate during his first few attempts, move the control element by an amountproportional to the required angle. The voltage would then be regulated by the difference between the load angle and the inputangle.
8. This control system, however, is not automatic; it can only be used when the operator can see the load and when fatigue onhis part is unlikely. Once the possibility of prolonged operation is envisaged, or when the operator cannot read the load positionor if the changes of input are too rapid for him to follow, then an automatic system must be used.
Automatic Control System9. A simple automatic system can be designed to work in precisely the same way as the operator. The load position is fed tosome device which compares it with the input and the difference between them regulates the voltage to the amplifier. The linkbetween the load and the comparison device is known as feedback; the difference between the load angle and the input angle iscalled the error and the comparison device is termed the error detector. The voltage to the amplifier is called the error signal andit is usually produced within the error detector.
10. A block schematic diagram of the automatic system is illustrated in Fig 2. The essential features are as follows:
3-3-1-2 Fig 2 Automatic Control System
DO NOT DISTRIBUTE AP 3456
Page 122 : Wed Jan 02 02:29:06 2002 Control Systems 3- 3- 1- 2

a. Application of the input angle, θi, to the error detector.
b. Feedback of the load position, θo to the error detector.
c. Subtraction of θi, from θo to produce the error.
d. Production of an error signal proportional to θo − θi.
e. Control of the amplifier output by the error signal.
f. Control of the motor movement by the amplifier output.
g. Movement of the load by the motor in a direction which reduces the error.
The new load position is fed back to the error detector and the sequence b to g continues until the error is zero, when the errorsignal disappears and movement stops.
11. The automatic control system described operates by continuous cycling of the load position through the loop formed by thefeedback, error detector, amplifier, and motor. Control mechanisms in which this loop can be identified are known as closedloop systems, while those which do not have feedback are known as open loop systems.
Servomechanisms12. To be classed as a servomechanism, an automatic control system must be capable of continuous operation and have:
a. Error actuation.
b. Power amplification.
c. Closed loop control.
13. Thus the system in Fig 2 is a servomechanism. It is actuated by the error since the net input to the amplifier is the errorsignal and not a voltage representing the input angle. It has power amplification and closed loop control; it is fully automaticand capable of continuous operation.
Types of Servo14. There are two main classes of servomechanism - position control servos and speed control servos:
a. Position Control Servos. Position control servos are used to control the angular or linear position of a load. The inputalso will normally be an angle or position, but may be found in other forms.
DO NOT DISTRIBUTE AP 3456
Page 123 : Wed Jan 02 02:29:06 2002 Control Systems 3- 3- 1- 2

b. Speed Control Servos. Speed control servos are used to control the speed of a load. In this case the input will notnormally itself be a speed; inputs are usually in the form of voltages or shaft angles.
15. The classification into position and speed control servos is a convenient one in view of the applications of the servoprinciple met in normal service equipments. In general, however, the servo can control many things not embraced by theseterms. Thermostatic control of a gas oven uses the servo principle, being actuated by the error in oven temperature; the controlof the concentration of a solution in a chemical process is another example. Indeed, the input and output may take so manyforms that it is common practice to use non-committal descriptions such as input demand for θi and load behaviour for θo.
16. Servomechanisms of either classification, can be operated by AC or DC power supplies. In general the AC system iscapable of greater accuracy and stability, but is limited to low power applications. The DC servo is used in high torquesituations, but more often a hybrid AC/DC servo, combining the merits of both, will be found when heavy loads are involved.
17. The synchro control transmission system has already been mentioned as an example of a servomechanism. It is illustratedin Fig 3 with the servo terms added to assist the reader in identifying the features enumerated in para 10.
3-3-1-2 Fig 3 Servo Elements of Control Synchro
EXAMPLES OF SERVOMECHANISMS
Position Control Servo - The Gyro-Magnetic Compass18. Fig 4 shows the arrangement of a typical gyro-magnetic compass and Fig 5 illustrates the same system in block form. Theprecession coils replace the servomotor, and the gyro spin axis is the load. Magnetic heading, θi, is applied to the resolversynchro together with gyro heading. Gyro heading is the load position, θo and the resolver synchro is the error detector. Theerror in gyro heading actuates the system.
19. The compass is therefore essentially a servomechanism, and the fact that a second servo is used to provide the load positionfeedback is a matter of design convenience. Indeed some systems use a direct mechanical link for the feedback. Whatever thefeedback method, the servo principle can be identified in all gyro-magnetic compasses.
3-3-1-2 Fig 4 GM Compass System
DO NOT DISTRIBUTE AP 3456
Page 124 : Wed Jan 02 02:29:06 2002 Control Systems 3- 3- 1- 2

3-3-1-2 Fig 5 GM Compass System Servo Outline
Speed Control Servo The Velodyne20. The situation calling for a speed control servo in navigation equipments is most commonly that of converting a voltagerepresenting airspeed or groundspeed into an angular velocity. A shaft turning at this angular velocity can then be used todisplay distance gone. The device used is called a velodyne and its components are illustrated in Fig 6.
3-3-1-2 Fig 6 Speed Control Servo, the Velodyne
DO NOT DISTRIBUTE AP 3456
Page 125 : Wed Jan 02 02:29:06 2002 Control Systems 3- 3- 1- 2
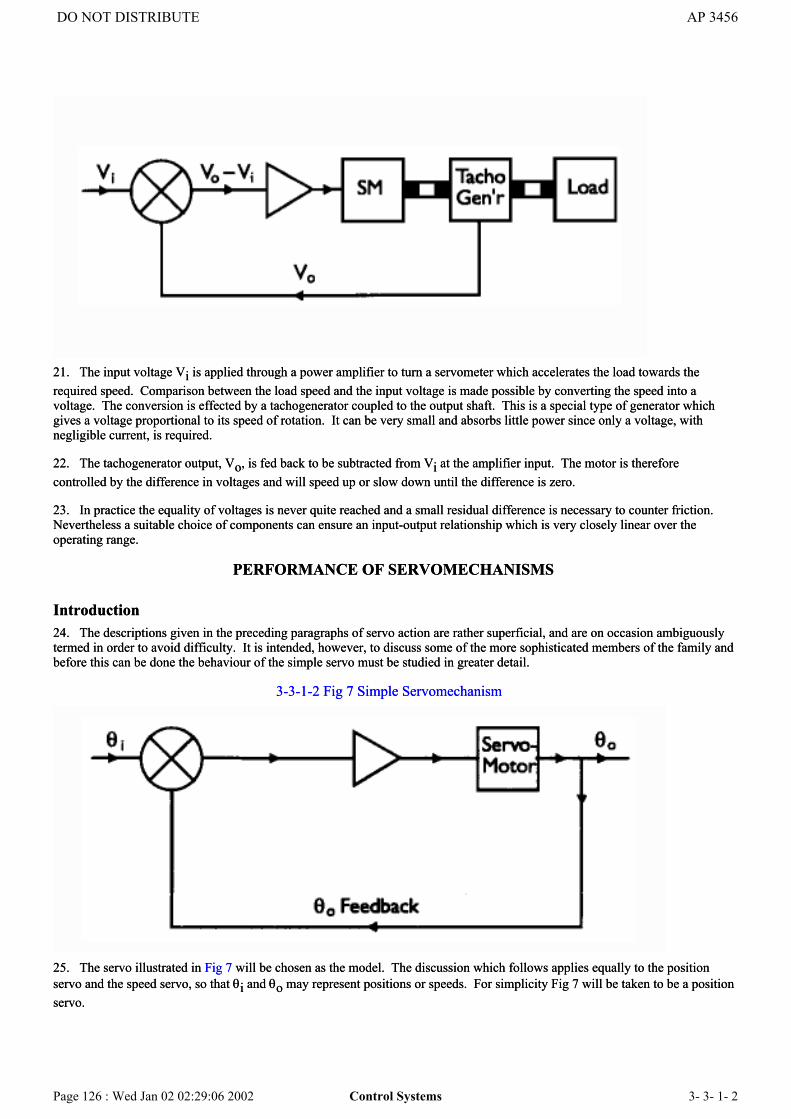
21. The input voltage Vi is applied through a power amplifier to turn a servometer which accelerates the load towards therequired speed. Comparison between the load speed and the input voltage is made possible by converting the speed into avoltage. The conversion is effected by a tachogenerator coupled to the output shaft. This is a special type of generator whichgives a voltage proportional to its speed of rotation. It can be very small and absorbs little power since only a voltage, withnegligible current, is required.
22. The tachogenerator output, Vo, is fed back to be subtracted from Vi at the amplifier input. The motor is thereforecontrolled by the difference in voltages and will speed up or slow down until the difference is zero.
23. In practice the equality of voltages is never quite reached and a small residual difference is necessary to counter friction.Nevertheless a suitable choice of components can ensure an input-output relationship which is very closely linear over theoperating range.
PERFORMANCE OF SERVOMECHANISMS
Introduction24. The descriptions given in the preceding paragraphs of servo action are rather superficial, and are on occasion ambiguouslytermed in order to avoid difficulty. It is intended, however, to discuss some of the more sophisticated members of the family andbefore this can be done the behaviour of the simple servo must be studied in greater detail.
3-3-1-2 Fig 7 Simple Servomechanism
25. The servo illustrated in Fig 7 will be chosen as the model. The discussion which follows applies equally to the positionservo and the speed servo, so that θi and θo may represent positions or speeds. For simplicity Fig 7 will be taken to be a positionservo.
DO NOT DISTRIBUTE AP 3456
Page 126 : Wed Jan 02 02:29:06 2002 Control Systems 3- 3- 1- 2

Response26. The response of a servo is the pattern of behaviour of the load when a change is made to the input condition. It has so farbeen assumed that if the input moves to θi the load will simply follow, its response being a reproduction of the input movement.The paragraphs which follow will show that matters are not as simple as this.
27. Two important factors affecting response are the form which the input change takes, and the various restraints, friction etc,which act on the output. These are now considered in turn. Two types of input change will be covered, one when the inputsuddenly changes to a new position, the other when it suddenly moves at a constant speed. The first is known as a step input, thesecond a ramp input, the names deriving from the curves of input against time shown in Fig 8. Both are discussed withoutconsidering restraints in the first instance.
3-3-1-2 Fig 8 Types of Input
Step Input No Friction28. For this discussion we will assume that the input and output were aligned at θo, until the input suddenly changed to θi. Anerror signal proportional to θo− θi appears at the amplifier input and the motor is energized to null the error.
29. One important point must now be emphasized. The torque delivered by the motor to the load is directly proportional to theerror; it acts only on the inertia of the load which therefore accelerates at a rate proportional to the error. As the error reduces sothe acceleration reduces, until it reaches zero with zero error.
30. But this is not a satisfactory state of affairs, for the load acceleration is in one sense only and that is to increase its velocity.Saying that the acceleration is zero at zero error simply means that the load has reached a steady speed when we require it to bestationary. Further, since there is nothing to stop it, it keeps moving past the required position.
31. The error signal produced, and, therefore, the torque applied to the load, now reverse in sense to slow down the load.Since, however, the components operate symmetrically about the null, the pattern of deceleration is a mirror image of theoriginal acceleration. The load stops when it has overshot by the initial error, and from there the performance is repeated. Theresulting load oscillation about the demanded position is illustrated graphically in Fig 9.
3-3-1-2 Fig 9 Oscillating Response to a Step Input
DO NOT DISTRIBUTE AP 3456
Page 127 : Wed Jan 02 02:29:07 2002 Control Systems 3- 3- 1- 2
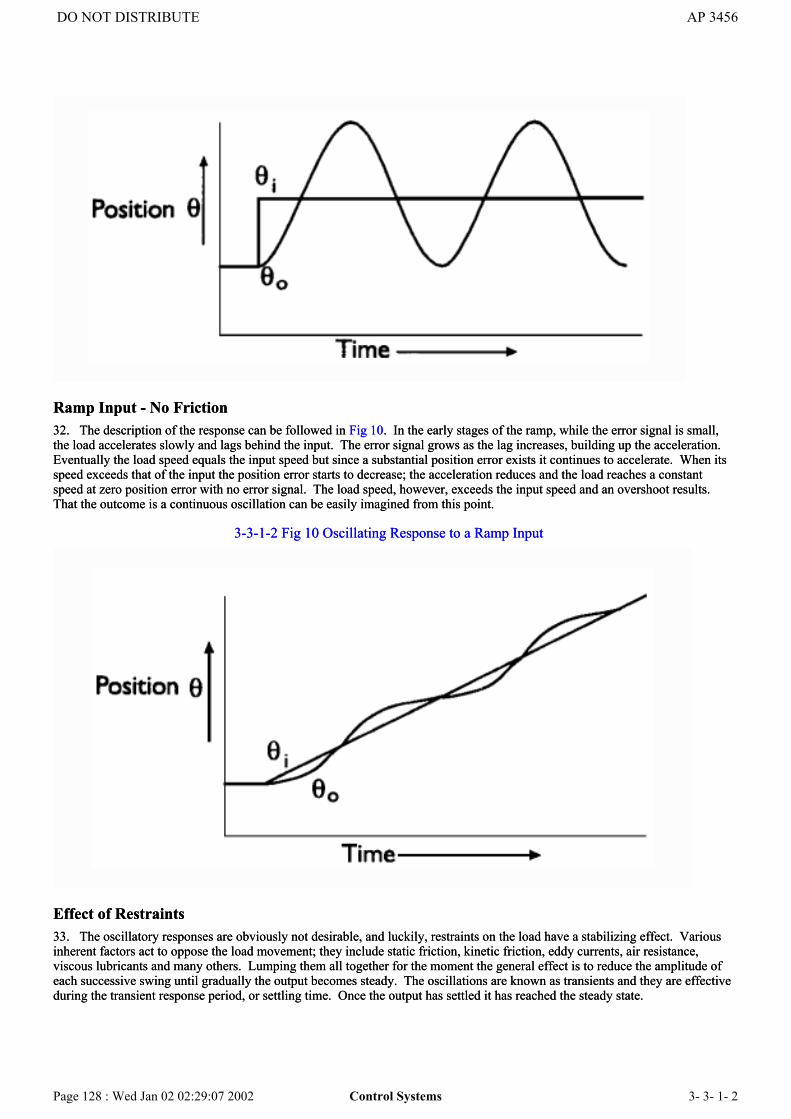
Ramp Input - No Friction32. The description of the response can be followed in Fig 10. In the early stages of the ramp, while the error signal is small,the load accelerates slowly and lags behind the input. The error signal grows as the lag increases, building up the acceleration.Eventually the load speed equals the input speed but since a substantial position error exists it continues to accelerate. When itsspeed exceeds that of the input the position error starts to decrease; the acceleration reduces and the load reaches a constantspeed at zero position error with no error signal. The load speed, however, exceeds the input speed and an overshoot results.That the outcome is a continuous oscillation can be easily imagined from this point.
3-3-1-2 Fig 10 Oscillating Response to a Ramp Input
Effect of Restraints33. The oscillatory responses are obviously not desirable, and luckily, restraints on the load have a stabilizing effect. Variousinherent factors act to oppose the load movement; they include static friction, kinetic friction, eddy currents, air resistance,viscous lubricants and many others. Lumping them all together for the moment the general effect is to reduce the amplitude ofeach successive swing until gradually the output becomes steady. The oscillations are known as transients and they are effectiveduring the transient response period, or settling time. Once the output has settled it has reached the steady state.
DO NOT DISTRIBUTE AP 3456
Page 128 : Wed Jan 02 02:29:07 2002 Control Systems 3- 3- 1- 2

34. While restraints are beneficial in stabilizing, or damping, the response, they do have certain detrimental effects. One ofthese is that power is wasted, another is the introduction of error in the steady state.
Steady State Errors35. Examination of the various restraints present would show that their effect is in part due to a small constant magnitude forceknown as coulomb friction and in part to viscous friction which increases with speed
3-3-1-2 Fig 11 Response with Coulomb Friction to Step Input
36. The resistance due to coulomb friction tends to degrade the sensitivity of a servo, for a torque which overcomes it must begenerated before any movement of the load takes place. To provide this torque the load error must reach some finite size, andany errors less than this will not be corrected. Fig 11 shows the effect of coulomb friction on the response to a step input. Theload comes to rest somewhere within a band of error, known as the dead space, the width of which depends on the amount ofcoulomb friction. For most modern servos the coulomb friction is very small, and its effect is often neglected.
37. Viscous friction does not produce a dead space in the step input case since it has no value when the speed is zero. It does,however, produce a similar effect when the ramp input is considered. In the steady state the load is moving with constant speed;it is therefore being resisted by viscous friction. An error signal must be produced to overcome this, therefore an error mustexist. The response is illustrated in Fig 12 , and the error necessary to overcome the friction is known as velocity lag. Coulombfriction may be considered small compared with viscous friction during a ramp input, but, of course, it also contributes to thiserror. However, the greater part is due to viscous friction, and since this increases with speed the error is generally reckoned tovary directly with speed.
3-3-1-2 Fig 12 Response with Viscous Friction to Ramp Input
DO NOT DISTRIBUTE AP 3456
Page 129 : Wed Jan 02 02:29:07 2002 Control Systems 3- 3- 1- 2
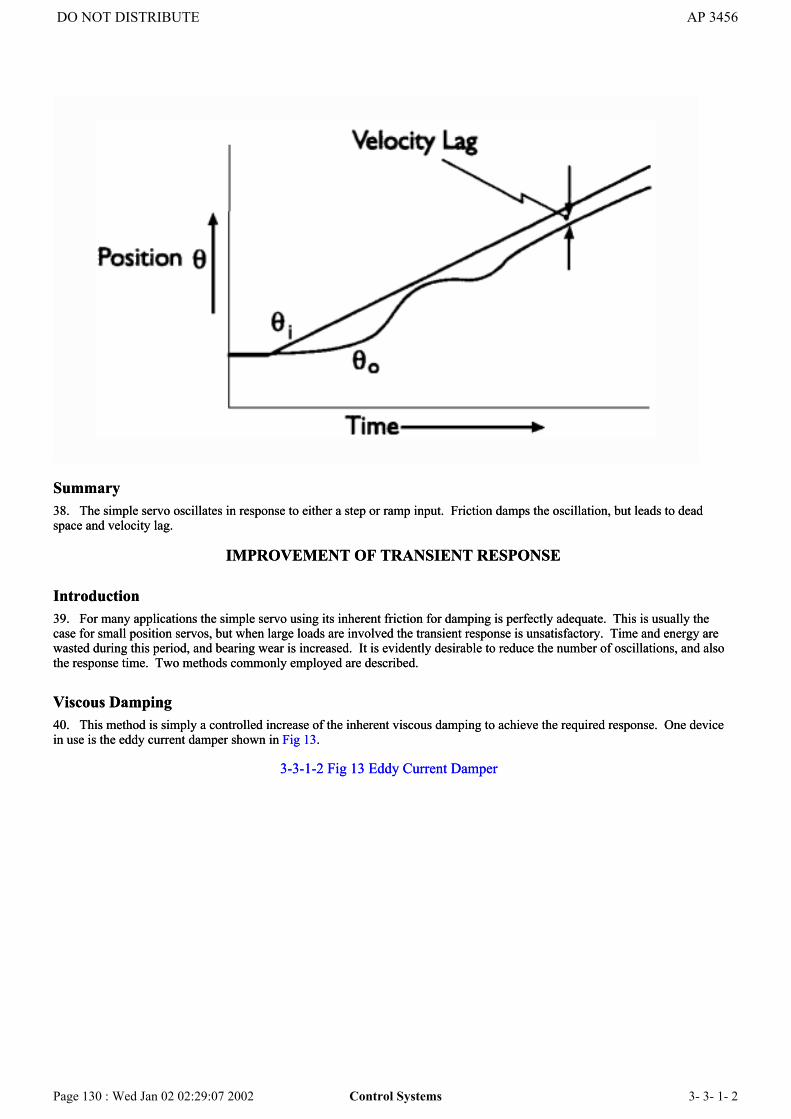
Summary38. The simple servo oscillates in response to either a step or ramp input. Friction damps the oscillation, but leads to deadspace and velocity lag.
IMPROVEMENT OF TRANSIENT RESPONSE
Introduction39. For many applications the simple servo using its inherent friction for damping is perfectly adequate. This is usually thecase for small position servos, but when large loads are involved the transient response is unsatisfactory. Time and energy arewasted during this period, and bearing wear is increased. It is evidently desirable to reduce the number of oscillations, and alsothe response time. Two methods commonly employed are described.
Viscous Damping40. This method is simply a controlled increase of the inherent viscous damping to achieve the required response. One devicein use is the eddy current damper shown in Fig 13.
3-3-1-2 Fig 13 Eddy Current Damper
DO NOT DISTRIBUTE AP 3456
Page 130 : Wed Jan 02 02:29:07 2002 Control Systems 3- 3- 1- 2

41. This simple device consists of a thin disc of metal with high electrical conductivity (usually aluminium) which is attachedto the output shaft. It spins between the poles of electromagnets mounted round its periphery. Eddy currents are induced ofmagnitude proportional to the field strength and to the disc velocity. These eddy currents set up magnetic fields which actagainst the inducing fields and forces opposing the disc rotation are created. These forces are closely proportional to the discvelocity, and therefore provide parallels to the inherent viscous forces. They can be controlled by adjusting the current flow tothe electromagnets.
42. Varying degrees of damping can be applied. Fig 14 shows some of the stages, coulomb friction being ignored forsimplicity. Using only inherent friction light damping is achieved. Too much extra viscous friction will produce a very sluggishresponse and the system is heavily damped. The degree of damping which just prevents any overshoot is known as criticaldamping. Slightly less damping than this, to allow one small overshoot, is optimum damping which gives the smallest settlingtime. Most designs are aimed at this condition.
43. The effect on the transients for a ramp input can be similarly adjusted to produce optimum damping. A snag arises,however, for any increase in viscous friction also increases the velocity lag. Thus to remove the transient oscillations completelya considerable velocity lag must be expected. Fig 15 illustrates the response for two degrees of damping for a ramp input.
3-3-1-2 Fig 14 Degrees of Damping - Step Input
DO NOT DISTRIBUTE AP 3456
Page 131 : Wed Jan 02 02:29:07 2002 Control Systems 3- 3- 1- 2
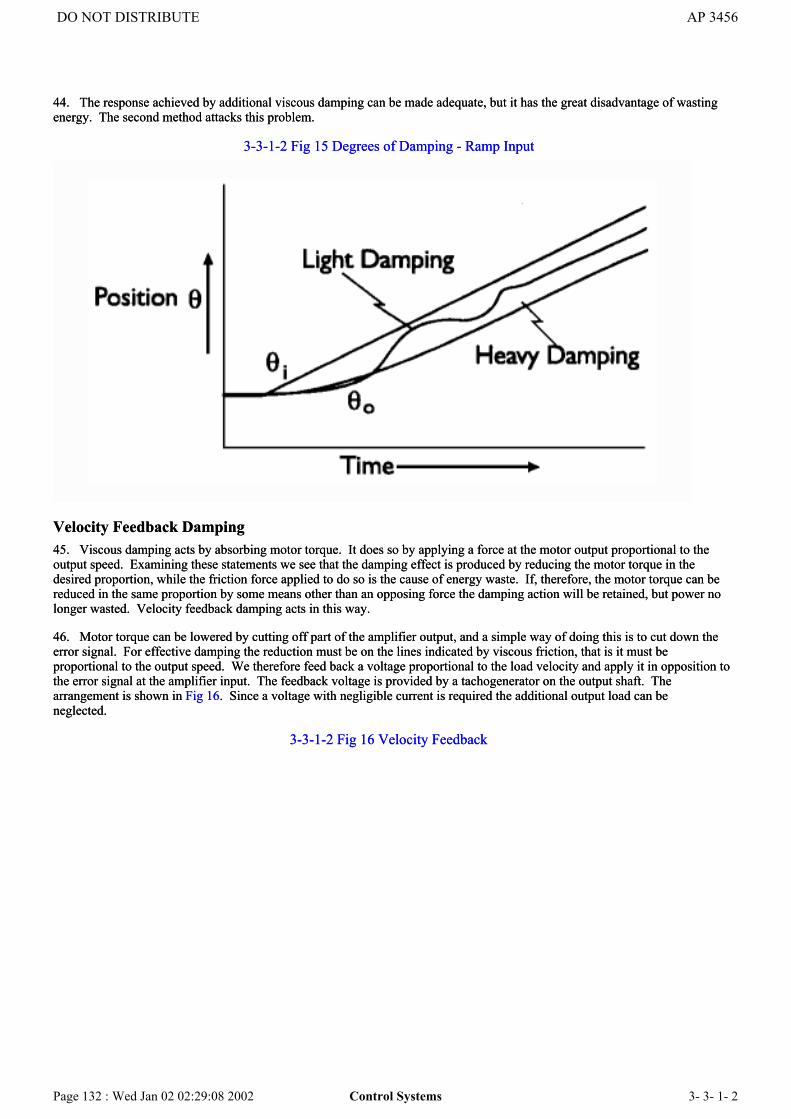
44. The response achieved by additional viscous damping can be made adequate, but it has the great disadvantage of wastingenergy. The second method attacks this problem.
3-3-1-2 Fig 15 Degrees of Damping - Ramp Input
Velocity Feedback Damping45. Viscous damping acts by absorbing motor torque. It does so by applying a force at the motor output proportional to theoutput speed. Examining these statements we see that the damping effect is produced by reducing the motor torque in thedesired proportion, while the friction force applied to do so is the cause of energy waste. If, therefore, the motor torque can bereduced in the same proportion by some means other than an opposing force the damping action will be retained, but power nolonger wasted. Velocity feedback damping acts in this way.
46. Motor torque can be lowered by cutting off part of the amplifier output, and a simple way of doing this is to cut down theerror signal. For effective damping the reduction must be on the lines indicated by viscous friction, that is it must beproportional to the output speed. We therefore feed back a voltage proportional to the load velocity and apply it in opposition tothe error signal at the amplifier input. The feedback voltage is provided by a tachogenerator on the output shaft. Thearrangement is shown in Fig 16. Since a voltage with negligible current is required the additional output load can beneglected.
3-3-1-2 Fig 16 Velocity Feedback
DO NOT DISTRIBUTE AP 3456
Page 132 : Wed Jan 02 02:29:08 2002 Control Systems 3- 3- 1- 2

47. Varying degrees of damping can be achieved by adjustment of the feedback and much greater precision is possible thanwith viscous friction. Once again optimum damping is sought.
48. Velocity feedback increases velocity lag just as did the viscous friction method, but for a different physical reason. In thiscase the steady state velocity of the load imposes a signal on the amplifier input which must be cancelled in some way if thesteady velocity is to be maintained. The cancellation can only be made by an equal error signal, which means that an error mustexist.
Summary49. Transient response can be improved in two ways, by applying extra viscous friction or by velocity feedback. Both increasevelocity lag in the response to ramp inputs, but of the two velocity feedback is to be preferred since power is not wasted.
DR Position ComputingChapter 1 - Ground Position Indicator (GPI) MK 4A
Introduction1. The Ground Position Indicator Mk 4A is an electromechanical computer designed for use with Doppler radars and remoteindicating compass systems. The inputs are heading by M-type transmission from the heading reference, drift transmitted bysynchros from the Doppler aerial, and ground distance gone by M-type transmission from the Doppler tracker unit. The outputis the computed position in Northing/Easting, Latitude/ Longitude, or Along/Across track co-ordinates. A storage system is builtinto the equipment, permitting the freezing and correction of the position counters.
Components2. There are two components; an indicator unit and an amplifier unit. The latter is used in conjunction with a servo system toprovide a power drive of track angle. It has no controls, is mounted remotely, and is therefore not described in this chapter. Allcontrols are on the face of the indicator (Fig 1).
Indicator3. Main Switch. The ON/OFF switch, which is at the bottom of the unit, controls the 28V DC supply to the motors andtransmitters within the GPI. It also controls the transmission of groundspeed to the instrument. Heading transmission becomesoperative as soon as the compass is switched on, and transmission of drift and ground mileage occurs a few seconds after theDoppler is switched on.
DO NOT DISTRIBUTE AP 3456
Page 133 : Wed Jan 02 02:29:08 2002 DR Position Computing 3- 3- 2- 1

4. Heading and Track Indicator. A compass rose on the face of the instrument carries two pointers. One of these has a doublearrow to indicate track, while the other has a single arrow indicating heading. The pointer indications are accurate to about 0.5°.The heading pointer is synchronized with the compass master indicator by the use of the knob at the left-hand side of thecompass rose. The input of heading is by M-type transmission and would normally be in 30° steps. To improve the accuracythe heading is passed via a 60:1 gearing reducing the steps to 0.5° but allowing the system to appear to be synchronized every6°. Synchronization should be carried out with the drift servo powered (ie Doppler switched on). The track pointer then followsthe heading, lagging or leading by an amount equal to the drift reading on the Drift and G/S indicator. If the drift servo is notpowered the track pointer will remain stationary until it lags by 36° from the heading. A limiting stop in the azimuth synchrounit then engages, dragging the track pointer along 36° behind the heading pointer. When this happens the drift conditions inthe GPI may differ by more than 36° from the drift input from the Doppler eg, Doppler drift of 20° port and GPI drift conditionof 20° starboard. In these circumstances, as soon as the Doppler is switched on, both pointers will be driven continuously roundthe dial in one direction. This is because the azimuth resolving mechanism has a null position every 72°, allowing it to deal withnormal drifts of up to 36° relayed from the Doppler; but when more than 36° of drift is presented to the mechanism it tries toreach a null position in the wrong direction. The servo-motor used in the azimuth resolving mechanism has sufficient power toovercome the power of the heading repeater motor, and therefore both pointers are driven continuously in one direction by theservomotor. To stop this continuous rotation, the drift on the Doppler indicator should be inched until its drift indication iswithin 36° of that on the GPI; the continuous rotation will stop and the track pointer will be pulled into synchronization. Theheading must then be resynchronized.
3-3-2-1 Fig 1 Controls on GPI MK 4A
DO NOT DISTRIBUTE AP 3456
Page 134 : Wed Jan 02 02:29:08 2002 DR Position Computing 3- 3- 2- 1

5. Presentation Selection Switch. A three-positioned switch in the centre of the indicator allows a selection of any one of threetypes of position presentation. Movement of the switch applies the appropriate form of drive to the counters, and adjusts thecounter shutters to give the correct presentation. It must be noted that a change of presentation in flight requires a completecounter resetting. The three presentations are:
a. GRID. Position is indicated as nautical miles travelled in North or South and East or West directions from any point atwhich the counters have been set to zero. The range obtainable on this setting is 4,000 nm on each counter, with anovershoot of approximately 200 nm.
b. LAT. LONG. The two counters give degrees and minutes of latitude and longitude. The minutes are read on theright-hand drum against a mark on the shutter, and the other drums give the number of whole degrees. At the zerochangeover, the minute mark moves with the shutter, and any reading must be delayed until the changeover is complete.The range on each counter is 400°. Slipping of a secant gear in the resolving mechanism usually causes errors in latitudesabove 70° North or South.
c. A/A SET TRACK. When A/A is set, the counters appear the same as for GRID, but they give nautical miles gone alongand across any track which has been set on the set track drum. The normal North/South counters record distance along theselected track, the counters increasing North; the East/West counters record distance across track, increasing East for
DO NOT DISTRIBUTE AP 3456
Page 135 : Wed Jan 02 02:29:08 2002 DR Position Computing 3- 3- 2- 1

distance to the right of the set track and West for distance to the left. The East/West counters are marked R (right) and L(left) respectively.
6. Set Track Drum and Knob. A drum marked off at two-degree intervals, and numbered every 10°, appears through a windowin the lower right-hand corner of the GPI face. The drum is rotated by a setting knob near the window, one revolution of theknob representing 4°. The knob is divided into four by projecting points at 90° intervals, and setting this knob scale against afixed datum mark above the knob allows very accurate track setting. The track set on this control does not affect the trackpointer on the compass rose, which continues to give the true track of the aircraft. A locking device prevents movement of thedrum from its zero position unless the A/A presentation is chosen and also prevents return of the presentation switch to GRID orLAT. LONG. until the drum has been returned to zero. Care should be taken when change of presentation is made, since thelocking device can be forced and this will result in unserviceability of the GPI.
7. Counter Resets. Resetting of the counters can be carried out either manually or with the aid of an electric motor. A knobalongside each set of counters controls both manual and electrical resetting, the knob being pulled out for manual control. Onmanual resetting, rotation of the knob gives a corresponding rotation of the indicator dials. With electrical resetting, rotation ofthe knob gives a rate of reset of about 700 nm (on A/A and GRID presentations) or about 70° (on LAT. LONG. presentation)per minute. This high rate of reset permits a rapid change of the counters when selecting a different position presentation.
8. Storage System. The storage system is controlled by the NORMAL/FIX switch, two hand reset knobs and two drumindicators which are illuminated by concealed lamps at all times when any information is in store. To store information, theNORMAL/ FIX switch is turned to FIX, whereupon the indicator lamps light, and the position shown on the position countersremains constant. Counter resetting can then be carried out. When the switch is put back to NORMAL, electric motorsautomatically feed all the stored mileage into the position counters until the storage is cleared, when the indicator lamps will goout. Should the automatic system fail, manual unstoring can be carried out. A handle, shown in its stowed position in Fig 1, isinserted in the upper keyway (N/S). The cross and dot indicator nearest to this keyway shows the direction in which the handlemust be turned, and a line dividing dots from crosses indicates the neutral position. The handle is then inserted in the lowerkeyway (E/W) and a similar procedure carried out with reference to the other cross and dot indicator.
NOTE:The storage indicator markings cover a range of 160 nm for each component, although in effect 200 nm can bestored, corresponding to 0.5 revolution of the indicator drum. Should 200 nm be exceeded, the counter affectedwould be 400 nm in error after unstoring. The rate of automatic unstore is equivalent to approximately 3,000knots. If the 160 nm figure is exceeded, and only manual unstorage is available, there is no indication of thecorrect unstore direction and large errors may be introduced.
Errors9. The GPI Mk 4A is subject to instrument error, latitude and altitude error, and input error.
10. Instrument Error. Distance resolution is accurate to within 0.5% and track resolution is accurate to within 0.5 degrees.Slipping of the secant gear, which is likely to occur at latitudes higher than 70° N or S, will increase the instrument error. Afurther inherent source of error is backlash in the transmission and resolution gear. Backlash error is kept to a minimum byensuring that the GPI reset knobs are at their central position when not in use.
11. Latitude and Altitude Error. The design of constant-scale measuring instruments such as the GPI Mk 4A is based on theassumptions that:
a. At all altitudes and latitudes the length of a nautical mile is 6,080 feet and is equal to one minute of latitude.
b. A distance of 6,080 feet multiplied by the cosine of the latitude is equal to one minute of longitude.
These assumptions are true only at sea level at latitudes 47°42' N and S, and at any other latitude or altitude must introduceerrors. These errors are maximum at high altitudes and in high and low latitudes; altitude error always causes an overreading indistance while latitude error causes overreading in high latitudes and underreading in low latitudes. The overall error at 50,000feet at 45° N is an overreading of approximately 0.25%.
12. Input Error. Despite the inherent accuracy of the GPI Mk 4A the ultimate accuracy depends on the quality of the inputs.The drifts and groundspeed values supplied by Doppler are accurate to about 0.3°, and 0.7% respectively. The accuracy of thetrue heading input is much less than that of the drift and is, in fact, the greatest source of error. Very accurate compasscalibration and precise alignment of the M-type transmission system, together with careful application of corrections forvariation, deviation and coriolis effect are necessary to minimize heading error.
DO NOT DISTRIBUTE AP 3456
Page 136 : Wed Jan 02 02:29:08 2002 DR Position Computing 3- 3- 2- 1

13. System Error. The error which concerns the operator is that which arises when the GPI Mk 4A, Doppler and the headingreference are used together in a particular type of aircraft; an error growth rate of 6 nm/hr would be typical.
Operation14. The following drills apply to the GPI Mk 4A in any installation.
15. Pre-flight.
a. Set NORMAL/FIX switch to NORMAL and GPI main switch to OFF.
b. Switch on and synchronize the compass; switch on Doppler.
c. Synchronize heading and track pointers with compass.
d. Set zero drift and 600 kt groundspeed on the Doppler.
e. Set presentation selection switch to A/A and the track drum to the value indicated by the heading and track pointers plus45 degrees.
f. Switch GPI main switch to ON and check N/S and E/W electrical resetting in both directions. Return counters to zeroand switch off GPI.
g. Note the time, and simultaneously switch on the GPI and the Doppler distance gone counter.
h. Switch to FIX and note that both storage lights come on, the counters freeze, and a dot or cross appears on each storagedrum.
i. Switch to NORMAL and note that both storage lights go out together as the drums reach their neutral positions.
j. Exactly two minutes after switching on in g switch off the GPI and the Doppler distance gone counter.
k. Check that the distance gone counter reads 20 nm and that the GPI counters read 14.1 nm North and 14.1 nm Left.
l. Set the presentation switch and track drum as required for flight.
m. Set the GPI counters to take-off co-ordinates and the Doppler distance gone counter to zero.
n. Switch off GPI.
o. Immediately before take-off check that the GPI heading repeater is still synchronized with the heading reference.
16. Take-off.
a. As aircraft becomes airborne switch on GPI and distance gone counter.
b. Carry out Doppler switching on procedure as appropriate.
17. Operation in Flight. LAT/LONG is the most commonly used and versatile mode of operation, but tactical considerationsmay favour the use of an alternative presentation. When a single track is to be flown, A/A track presentation permits immediatechecking of track-keeping accuracy and of distance to go. The GPI counters can be set so that the actual distance to go is shown,by setting the South counter to read that distance before take-off; the counters should then read zero at destination. With dopplergroundspeed readily available frequent and accurate revision of ETA can be calculated. Circumstances may arise when a changefrom LAT/LONG to A/A track presentation is required in flight. The process, described in relation to the example illustrated atFig 2 is as follows:
3-3-2-1 Fig 2 Changing from LAT/LONG to A/A Track
DO NOT DISTRIBUTE AP 3456
Page 137 : Wed Jan 02 02:29:09 2002 DR Position Computing 3- 3- 2- 1

a. Plot the GPI position at 1000 and DR ahead for 6 mins.
b. Between 1000 and 1006, switch from LAT/LONG to A/A track and set the track drum to 0.75°.
c. For the DR position at 1006 measure the distance off track (10R and distance to go (605 nm).
d. At 1006 switch to fix, set 605 on the N/S counters and 10R on the E/W counters.
e. Switch to Normal.
DR Position ComputingChapter 2 - The Tactical Air Navigation System (TANS)
Introduction
1. The Tactical Air Navigation System (TANS) comprises a digital computer, and a display and control unit, combined into asingle unit. The computer is a general purpose type with a fixed program designed to resolve navigation problems.
2. There are a number of variants and sub-variants of TANS which use different inputs and produce different outputs. Thischapter will provide an overview of the variant (T9447-D); it is not intended to be a User Manual. The inputs for this variantare:
a. Air Data Inputs - Mach Number and True Outside Air Temperature (which are processed in TANS to calculate TAS).
b. Heading - From the GM compass system.
c. Doppler Inputs - Drift, Along and Across Heading velocity and Vertical velocity.
d. Manual Inputs - Start and Waypoint Positions, Wind Velocity, Magnetic Variation, and Time.
3. The TANS computer uses these inputs to calculate and display the following information:
a. Present Position.
b. Continuously predicted steering information from present position direct to a previously inserted waypoint.
c. Sensor input values and computed navigation variables, eg heading, track and wind velocity.
The computer will normally operate using Doppler inputs, however should these fail, navigation calculations will continue usingair data information together with the last stored, or manually inserted, value of wind velocity.
DO NOT DISTRIBUTE AP 3456
Page 138 : Wed Jan 02 02:29:09 2002 DR Position Computing 3- 3- 2- 2

4. Accuracy. The TANS computer has a 6 nm/hr error growth rate when fed by Doppler inputs, and 20 nm/hr in the Air DataSystem (ADS) mode.
DESCRIPTION
Display and Control Unit5. The display, control switches, fail lamps, and push button keyboard are all mounted on the front panel of the TANS unit asillustrated in Fig 1.
3-3-2-2 Fig 1 TANS Computer T9447D Front Panel
TANS Display6. The display comprises 2 lines of 9 alpha-numeric digits; the decimal point is not indicated and its position varies witheach display format. When the TANS is not in the OP mode the extreme left-hand digit(s) flash.
Control Switches7. The purpose of the control switches is as follows:
a. ON/OFF Switch. Power is switched on or off by a spring loaded toggle switch which must be pulled outwards and up toprovide the necessary 28V DC to the equipment. All information stored in the TANS is lost if the power is switched off.
b. Navigation Mode Switch. Modes are selected by rotating a four position switch marked:(1) L/L. Position L/L selects latitude and longitude format for position display (Fig 2).
DO NOT DISTRIBUTE AP 3456
Page 139 : Wed Jan 02 02:29:09 2002 DR Position Computing 3- 3- 2- 2
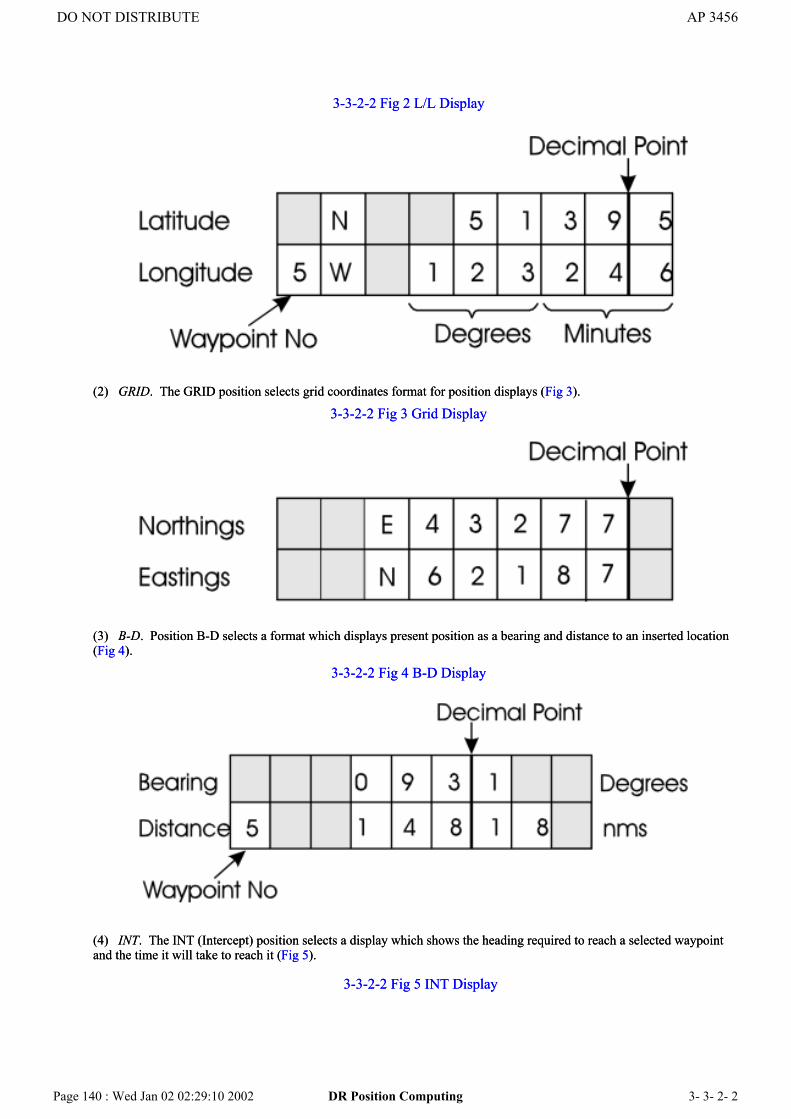
3-3-2-2 Fig 2 L/L Display
(2) GRID. The GRID position selects grid coordinates format for position displays (Fig 3).
3-3-2-2 Fig 3 Grid Display
(3) B-D. Position B-D selects a format which displays present position as a bearing and distance to an inserted location(Fig 4).
3-3-2-2 Fig 4 B-D Display
(4) INT. The INT (Intercept) position selects a display which shows the heading required to reach a selected waypointand the time it will take to reach it (Fig 5).
3-3-2-2 Fig 5 INT Display
DO NOT DISTRIBUTE AP 3456
Page 140 : Wed Jan 02 02:29:10 2002 DR Position Computing 3- 3- 2- 2

c. Sensor Switch. This is a 3 position switch used in conjunction with the Sensor Fail lamp and controls the sensor inputsto the computer as follows:
(1) DOP. In the DOP (Doppler Operation) position, and with the Doppler 'ON' and locked on, the TANS will updatepresent position using heading plus Doppler inputs.
(2) S/Y. The S/Y (Stand-by) position is used when no inputs are required to be fed to the TANS, eg start-up and taxiing.
(3) ADS. The ADS (Air Data System) position isolates the Doppler from the computer and TANS will operate usingthe remaining sensor inputs and either the last wind velocity stored by the computer or a wind manually entered by theoperator.
d. Land/Sea Switch. The equipment is normally operated in the LAND position but the SEA functions are designed tocompensate for Doppler spectrum distortion when flying over the sea. The SEA-S (Sea Smooth) position is normally onlyused in helicopter installations when flying over a smooth sea, at low level and in light wind condition. It comparesDoppler and ADS velocities to guard against a Doppler runaway and will revert to ADS if the 2 velocities are markedlydifferent. The SEA-R (Sea Rough) position is used when low level winds exceed force 3 on the Beaufort scale (7-10kts).
e. Display Dimmer Switch. The DIM switch controls the brilliance of displays, illuminated keys, and fail lamps.
Fail Lamps8. Two lamps are used as follows to indicate failures in the system:
a. Computer Fail Lamp. A Computer Fail lamp (marked FAIL) is situated above the DIM control. It illuminates in theevent of computer malfunction. It also illuminates approximately 10 seconds after switch on to check the lamp circuit. Ifno fault exists in the circuit the lamp will extinguish after present position (latitude and longitude) has been entered in thecomputer.
b. Sensor Fail Lamp. A Sensor Fail lamp is situated to the right of the Sensor Switch and operates as follows:(1) Flashing. If the sensor light flashes there are 3 possibilities:
i. The sensor switch is at stand-by thus inhibiting both Doppler and ADS velocities.
ii. Both ADS and Doppler inputs have failed.
iii. The heading input has failed.
(2) Steady On. If the sensor light illuminates steadily the selected input source (ie Doppler or ADS) is invalid but theother source is still available. With DOP selected, if the Doppler loses lock, the Sensor Fail light will illuminate, and theTANS will automatically revert to ADS mode using heading, Mach number, temperature, and the stored value of windvelocity. If the Doppler regains lock, the light will extinguish and the equipment will again use the Doppler information,even if the Doppler lock is to false values. This possibility can be avoided by switching manually to ADS until correctDoppler lock is achieved. In this situation the light will extinguish so long as the ADS information remains valid. Ifthe ADS inputs should fail, the Sensor Fail light will illuminate but the system will not automatically switch to DOP; themode must be selected manually.
DO NOT DISTRIBUTE AP 3456
Page 141 : Wed Jan 02 02:29:10 2002 DR Position Computing 3- 3- 2- 2

Computer Keyboard9. The keyboard has 21 press-button keys; 11 provide functional control and 10 are used to insert numerical data. The numerickeys are numbered 0 - 9, and keys 2, 4, 6, and 8 are additionally labelled N, W, E, and S respectively. All keys have integrallighting. The functional keys, with the exception of the OP, ENT and CLR keys, increase their brightness when pressed toindicate the function selected.
Functional Key10. The nine functional keys operate as follows:
a. FIX. The FIX key freezes the present position display which may then be amended (eg to a fix position at that time).Once the correct position is displayed ENT must be pressed to input the information into the computer. Aircraft movementis stored whilst in FIX and pressing OP or DTA will release the FIX mode and present position updating will recommence.
b. VAR. The VAR (Variation) key is used to set or display magnetic variation. Variation should be set only if the headinginput to TANS is magnetic. All bearings and headings displayed will be magnetic, ie True IN, True OUT, Mag IN, MagOUT. The variation value and sense is shown on the top line of the display as illustrated in Fig 6.
3-3-2-2 Fig 6 VAR Display
c. STR. The STR (Steer) key permits the selection of steering facilities.
d. SET. The entering sequence for information other than present position is initiated by the SET key which must bepushed before selecting the function to be updated. Data entered will be valid from the instant of pressing ENT.
e. GL. The GL (Grid Lock) key is used to enter present position, in grid coordinates, into the computer.
f. DTA. In conjunction with the numeric keys the DTA (Data) key is used for setting and displaying selected data modes.If data modes are required consecutively there is no need to press DTA each time.
g. VEC. The VEC (Vector) key permits the entry or display of waypoint vector (course and speed).
h. WP. The WP (Waypoint) key is used in conjunction with the numeric keys to insert and/or display information relatingto waypoints. The Navigation Mode switch must be set to the appropriate position when displaying or entering waypointinformation. Up to 10 waypoints (labelled 0 - 9) may be stored.
i. OP. The OP (Operation) key may be pressed at any time to restore normal operation. (Present position displayed,continuously updated).
j. CLR. The CLR (Clear) key is used in 2 ways when entering new information on the display.(1) One short press will clear the last entered digit, or the last digit on the right if no digit has been entered.
(2) If the key is depressed for 2 seconds, the display will clear completely.
k. ENT. The ENT (Enter) key is used to enter data which has been keyed in via the numeric keyboard. When presentposition is to be entered the ENT key must be held depressed for about 3 seconds (to guard against accidental insertion ofwrong information); when entering other data it need only be depressed for about 1 second. In either case the display willblink momentarily once the position or data has been entered.
DO NOT DISTRIBUTE AP 3456
Page 142 : Wed Jan 02 02:29:10 2002 DR Position Computing 3- 3- 2- 2

Position Format11. The TANS will only accept inputs in the correct format, therefore care must be exercised to ensure that latitude figures arealways preceded by N or S and longitude and grid coordinates by E or W, Leading zeros must always be entered but trailingzeros may be omitted. Decimal place positions vary and users need to be aware of the format they are trying to enter or read.
Data Displays12. The data displays are used to show the values of sensor inputs and calculated navigation variables. For each display formatthe decimal point changes position. Speeds have no decimal places, bearings and headings have one, and distances have two.The various displays are accessed by pressing the DTA key plus the appropriate numeric key (which is then displayed in theleft-most position on the top line) as follows:
a. DTA 1. Track and Groundspeed. The DTA 1 display (Fig 7) shows track made good and groundspeed, calculated fromeither Doppler or ADS information.
3-3-2-2 Fig 7 DTA 1 Display
b. DTA 2. Wind Velocity. DTA 2 gives wind direction (°T or °M) and speed (kts) as in Fig 8. With valid Doppler inputsthe wind displayed is the average wind found over the preceding 2 minutes. If Doppler inputs become invalid, the displayfreezes and the computer uses the indicated wind, which may be updated manually via the keyboard. The computer resumesthe averaging process should Doppler inputs become available again. The wind velocity must be manually input ifoperating in ADS mode.
3-3-2-2 Fig 8 DTA 2 Display
c. DTA 3. Heading and Drift. DTA 3 (Fig 9) displays heading and drift angle. Drift is calculated about a datum of 360°,thus an angle <360° indicates port drift and an angle >000° indicates starboard drift.
3-3-2-2 Fig 9 DTA 3 Display
DO NOT DISTRIBUTE AP 3456
Page 143 : Wed Jan 02 02:29:10 2002 DR Position Computing 3- 3- 2- 2

d. DTA 4. Roll and True Air Speed. The DTA 4 display (Fig 10) shows roll angle (if available) on the top line and TASon the bottom line.
3-3-2-2 Fig 10 DTA 4 Display
e. DTA 5. Pitch and Mach Number. DTA 5 (Fig 11) indicates pitch angle (if available) on the top line and Mach numberon the bottom line.
3-3-2-2 Fig 11 DTA 5 Display
f. DTA 6. Doppler Along and Across Velocity. The DTA 6 display (Fig 12) gives Doppler Along Velocity on the top lineand Across Velocity on the bottom line.
3-3-2-2 Fig 12 DTA 6 Display
DO NOT DISTRIBUTE AP 3456
Page 144 : Wed Jan 02 02:29:10 2002 DR Position Computing 3- 3- 2- 2

g. DTA 7. Angle of Attack and Vertical Speed. DTA 7 (Fig 13) displays Angle of Attack on the top line and VerticalSpeed on the bottom line.
3-3-2-2 Fig 13 DTA 7 Display
h. DTA 8. Surface Motion Compensation. The DTA 8 display (Fig 14) presents the Surface Motion Compensation that isapplied to the Doppler. The top line indicates the direction and the bottom line the speed of this correction.
3-3-2-2 Fig 14 DTA 8 Display
i. DTA 9. Time and Static Air Temperature. When DTA 9 is selected (Fig 15) the elapsed or clock time is displayed on thetop line and static (true) outside air temperature on the bottom line.
3-3-2-2 Fig 15 DTA 9 Display
DO NOT DISTRIBUTE AP 3456
Page 145 : Wed Jan 02 02:29:11 2002 DR Position Computing 3- 3- 2- 2
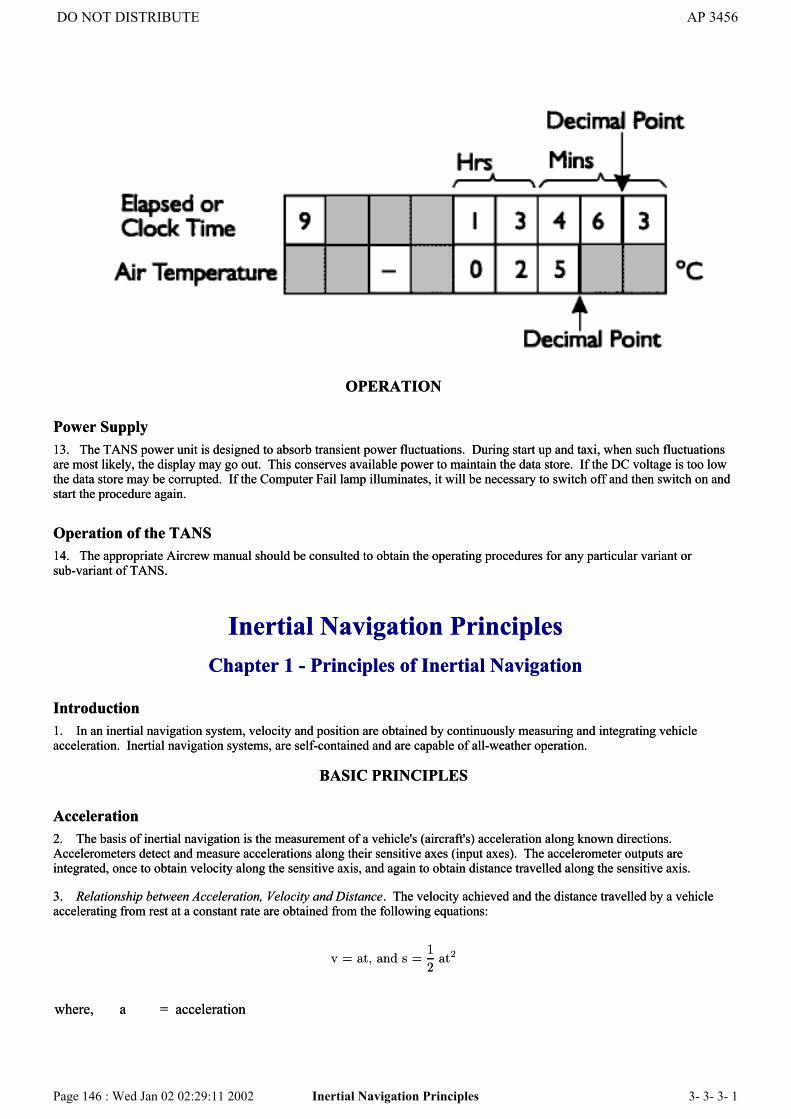
OPERATION
Power Supply13. The TANS power unit is designed to absorb transient power fluctuations. During start up and taxi, when such fluctuationsare most likely, the display may go out. This conserves available power to maintain the data store. If the DC voltage is too lowthe data store may be corrupted. If the Computer Fail lamp illuminates, it will be necessary to switch off and then switch on andstart the procedure again.
Operation of the TANS14. The appropriate Aircrew manual should be consulted to obtain the operating procedures for any particular variant orsub-variant of TANS.
Inertial Navigation PrinciplesChapter 1 - Principles of Inertial Navigation
Introduction1. In an inertial navigation system, velocity and position are obtained by continuously measuring and integrating vehicleacceleration. Inertial navigation systems, are self-contained and are capable of all-weather operation.
BASIC PRINCIPLES
Acceleration2. The basis of inertial navigation is the measurement of a vehicle's (aircraft's) acceleration along known directions.Accelerometers detect and measure accelerations along their sensitive axes (input axes). The accelerometer outputs areintegrated, once to obtain velocity along the sensitive axis, and again to obtain distance travelled along the sensitive axis.
3. Relationship between Acceleration, Velocity and Distance. The velocity achieved and the distance travelled by a vehicleaccelerating from rest at a constant rate are obtained from the following equations:
v = at, and s =1
2at2
where, a = acceleration
DO NOT DISTRIBUTE AP 3456
Page 146 : Wed Jan 02 02:29:11 2002 Inertial Navigation Principles 3- 3- 3- 1

v = velocitys = distancet = time
Aircraft accelerations are not constant, and must be integrated to obtain velocity and distance:
v =
Za.dt, and
s =
Z Za.dt, or s =
Zv.dt
The basic principle of inertial navigation is, therefore, the double integration of acceleration with respect to time (Fig 1).
4. Measurement Axes. Acceleration must be measured along two axes, usually orthogonal, if vehicle velocity anddisplacement are to be defined in a given plane. Since most accelerometers are designed to measure acceleration along one axisonly, two accelerometers are required for inertial navigation in a two dimensional plane. In aircraft systems the accelerometersare usually mounted with their input axes aligned with North and East, and this alignment must be maintained if the correctaccelerations are to be measured. Moreover, the sensitive axes must be kept perpendicular to the gravity vertical, otherwise, theaccelerometers sense part of the gravity acceleration. The reference frame defined by these directions, ie local North, local Eastand local Vertical, is called the Local Vertical Reference Frame. Other reference frames can be used, but the local vertical is thefundamental mechanization and is the one primarily considered in this Chapter.
5. Gyro Stabilization. Once the accelerometers have been aligned in the chosen reference frame, they must be capable ofmaintaining that orientation during aircraft manoeuvres. The accelerometers are therefore mounted on a platform which issuspended in a gimbal system that isolates the accelerometers from aircraft manoeuvres. However, this platform is notinherently stable, and any tendency for the platform to rotate with the aircraft must be detected and opposed. Gyros are thereforemounted on the platform to detect platform rotation and control platform attitude. Three single degree of freedom gyros arenormally used; one gyro detects rotation about the North axis, another rotation about East, and the third rotation about thevertical. The platform rotations detected by the gyros are used to generate error signals, proportional to change in platformattitude, which are used to motor the platform back to its correct orientation.
3-3-3-1 Fig 1 Principle of Inertial Navigation
6. Effect of Earth Rotation and Vehicle Movement. An INS operating in the local vertical reference frame must maintain itsalignment relative to Earth directions. The gyros used to stabilize the platform are rigid in space and must therefore be correctedfor Earth rate and transport wander to make them "Earth stable". Additionally, the accelerometers must be corrected for theeffects of coriolis acceleration and the central acceleration caused by rotating the platform to maintain alignment with the localvertical reference frame.
7. Platform Control. The platform control unit computes and applies the gyro and accelerometer correction terms fromcalculated values of ground-speed and latitude and stored values of Earth radius and Earth rotation rate.
8. Simple INS. A simple INS, capable of solving the navigation problem, is illustrated in Fig 2. A third vertically mountedaccelerometer must be added if vertical velocity is required, eg in weapon aiming applications. Conventionally, velocity Northis annotated ‘V’, velocity East ‘U’, Latitude 'φ', Earth rate 'Ω' and the radius of the Earth ‘R’. Other annotations areself-explanatory and the individual INS components are discussed in detail in the following paragraphs.
3-3-3-1 Fig 2 A Simple Inertial Navigation System
DO NOT DISTRIBUTE AP 3456
Page 147 : Wed Jan 02 02:29:11 2002 Inertial Navigation Principles 3- 3- 3- 1
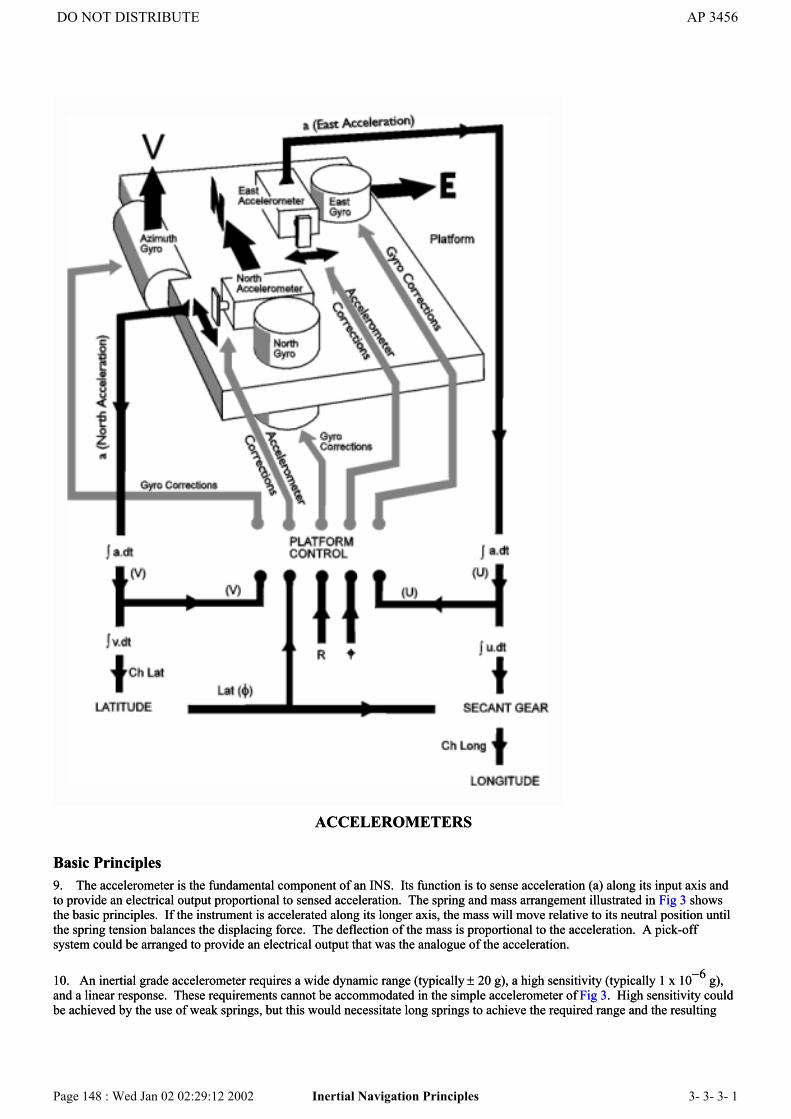
ACCELEROMETERS
Basic Principles9. The accelerometer is the fundamental component of an INS. Its function is to sense acceleration (a) along its input axis andto provide an electrical output proportional to sensed acceleration. The spring and mass arrangement illustrated in Fig 3 showsthe basic principles. If the instrument is accelerated along its longer axis, the mass will move relative to its neutral position untilthe spring tension balances the displacing force. The deflection of the mass is proportional to the acceleration. A pick-offsystem could be arranged to provide an electrical output that was the analogue of the acceleration.
10. An inertial grade accelerometer requires a wide dynamic range (typically ± 20 g), a high sensitivity (typically 1 x 10⁻⁶ g),and a linear response. These requirements cannot be accommodated in the simple accelerometer of Fig 3. High sensitivity couldbe achieved by the use of weak springs, but this would necessitate long springs to achieve the required range and the resulting
DO NOT DISTRIBUTE AP 3456
Page 148 : Wed Jan 02 02:29:12 2002 Inertial Navigation Principles 3- 3- 3- 1

instrument would be too large for use in a practical INS. Alternatively strong springs could be used to achieve a wide range butthis would deny high sensitivity.
3-3-3-1 Fig 3 Simple Spring and Mass Accelerometer
11. A number of accelerometer designs have been developed to overcome these shortcomings, some of which are moreapplicable to other than aircraft INS (eg ballistic missile systems). In aircraft applications the 'Pendulous Force BalanceAccelerometer' is the most common type.
Pendulous Force Balance Accelerometer12. A basic pendulous force balance accelerometer is shown schematically in Fig 4. With the case horizontal and theinstrument at rest or moving at a constant velocity, the pendulous mass is central and no pick-off current flows. When theinstrument is accelerated along its sensitive axis the pendulous mass is deflected and the deflection is sensed by the pick-off. Acurrent flows through the restorer coils such that a force is exerted on the displaced mass to restore it to the central position. Theinitial deflecting force is proportional to the acceleration experienced since the mass is constant (F = ma). The restoring force isproportional to the current through the restorer coil and is equal and opposite to the initial force, ie the restorer current isproportional to the acceleration. The pendulous mass is free to move only along the sensitive axis and accelerationsperpendicular to this axis have no effect.
3-3-3-1 Fig 4 Basic Pendulous Force Balance Accelerometer
DO NOT DISTRIBUTE AP 3456
Page 149 : Wed Jan 02 02:29:12 2002 Inertial Navigation Principles 3- 3- 3- 1

13. Instead of the flexure support system the pendulous element may be floated. The element has its centre of mass displacedfrom the centre of buoyancy, thus producing a couple in the presence of a linear acceleration.
Pendulous Accelerometer Errors14. Cross-coupling. The accelerometer is sensitive to accelerations along an axis perpendicular to, and in the plane of, thependulum. If the pendulum is displaced from the null position, either by an acceleration or by tilting of the platform, then thesensitive axis no longer coincides with the designed fixed input axis. Fig 5 shows the situation where the pendulum has beendisplaced through a small angle, θ. The input (sensitive axis) IA is rotated through the same angle. If the instrument isaccelerated along the displaced axis the acceleration will have horizontal and vertical components ax and ay and the measuredacceleration will be:
ax cos µ + ay sin µ
If θ is small and measured in radians this becomes:
ax + ay µ
The acceleration that should have been measured is ax and the term ay θ is an error known as cross-coupling error. It should benoted that when the input axis is displaced from the horizontal it will sense a component of the acceleration due to gravity.Cross-coupling error can be minimized by ensuring that the accelerometer platform is maintained horizontal and by using a highgain feed-back loop so that the displacement of the pendulum due to accelerations is kept small. Alternatively the error, ay θ,can be calculated and corrected.
3-3-3-1 Fig 5 Cross-Coupling Error
DO NOT DISTRIBUTE AP 3456
Page 150 : Wed Jan 02 02:29:12 2002 Inertial Navigation Principles 3- 3- 3- 1

15. Vibropendulosity. When an accelerometer is operated in a vibration environment, below the natural frequency of theaccelerometer loop, components of the vibration may act along the input axis causing the pendulum to deflect and thus registererroneous accelerations.
16. Displaced Orientation. Accelerometers are arranged, mutually at right angles, to measure accelerations in specificdirections, normally North and East. If the platform is misaligned as in Fig 6 and accelerated in a North/South direction, thenorth sensitive accelerometer will not detect the full acceleration and the east accelerometer will detect an unwanted component.
3-3-3-1 Fig 6 Accelerometer Misaligned
Performance Characteristics
DO NOT DISTRIBUTE AP 3456
Page 151 : Wed Jan 02 02:29:12 2002 Inertial Navigation Principles 3- 3- 3- 1

17. Accelerometers are required to give an accurate indication of vehicle acceleration over a wide range (typically ± 25 g) andwith a high degree of sensitivity. Fig 7 shows a typical accelerometer response and indicates the performance parametersusually referred to in technical descriptions. The dotted straight line represents the desired response from the instrument, ie thedesired scale factor in mA/g. The pair of curved lines represent the actual response, which is not a single line but has a band ofuncertainty caused by, for example, mechanical friction.
a. Sensitivity. The width of the band of uncertainty is termed sensitivity. It is the minimum change in acceleration inputrequired to cause a change in accelerometer electrical output. The sensitivity will generally be different at different levels of
indicated acceleration but a typical value would be 1 x 10⁻⁶ g.
b. Threshold. Threshold is the minimum acceleration input which causes an accelerometer electrical output. It is
equivalent to sensitivity but with an incremental change about a zero input. A typical value is 1 x 10⁻⁶ g.
3-3-3-1 Fig 7 Accelerometer Performance Parameters
c. Bias. Bias is the electrical output under conditions of no acceleration input due to residual internal forces acting on themass after it has been electrically or mechanically zeroed. Bias is expressed as an equivalent error in g's and is usually less
than 1 x 10⁻⁴ g. An INS can be designed to compensate for known accelerometer bias provided the bias is stable.
d. Null (Zero) Uncertainty. Null uncertainty is also known as bias uncertainty and is the variation in accelerometer outputunder conditions of zero acceleration input. The random drift of the accelerometer output at zero acceleration input isknown as null (zero) stability.
e. Scale Factor. The ratio of the current in the torquer to the measured acceleration (mA/g) is the accelerometer scalefactor. Ageing in permanent magnet torquers can lead to small changes in scale factor with time.
f. Linearity. Linearity error is defined as the deviation from the best fit straight line drawn through a plot of the electrical
DO NOT DISTRIBUTE AP 3456
Page 152 : Wed Jan 02 02:29:12 2002 Inertial Navigation Principles 3- 3- 3- 1
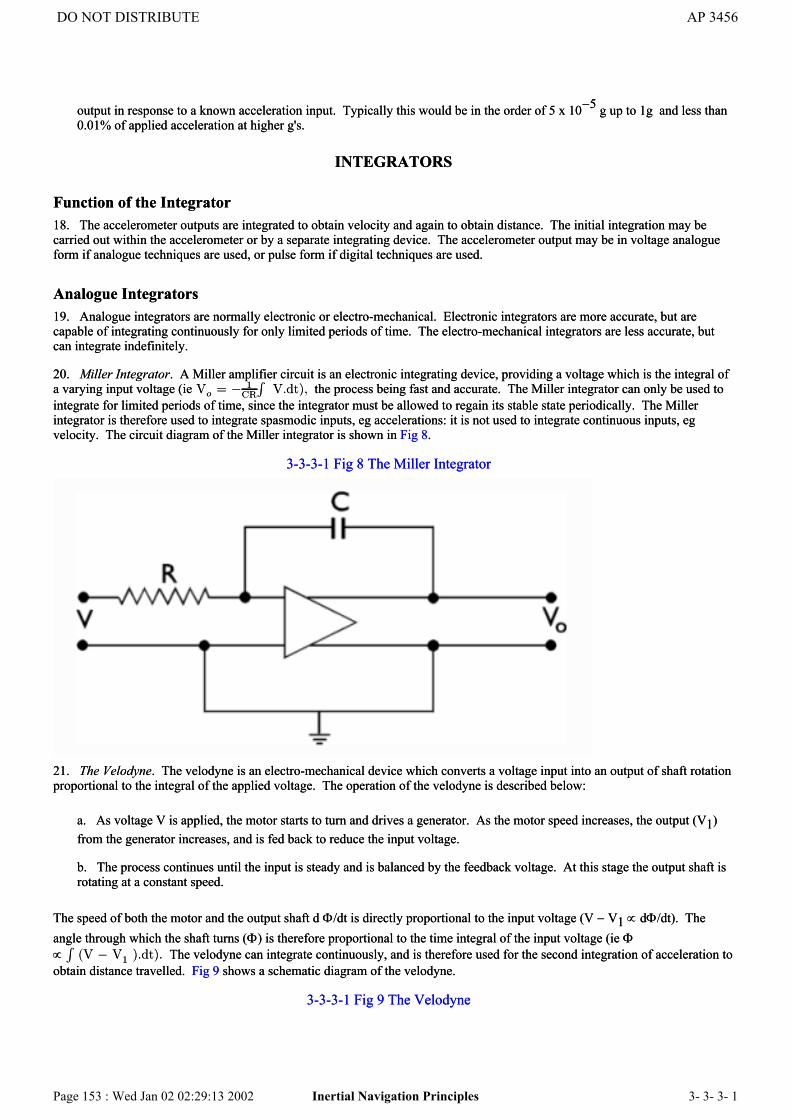
output in response to a known acceleration input. Typically this would be in the order of 5 x 10⁻⁵ g up to 1g and less than0.01% of applied acceleration at higher g's.
INTEGRATORS
Function of the Integrator18. The accelerometer outputs are integrated to obtain velocity and again to obtain distance. The initial integration may becarried out within the accelerometer or by a separate integrating device. The accelerometer output may be in voltage analogueform if analogue techniques are used, or pulse form if digital techniques are used.
Analogue Integrators19. Analogue integrators are normally electronic or electro-mechanical. Electronic integrators are more accurate, but arecapable of integrating continuously for only limited periods of time. The electro-mechanical integrators are less accurate, butcan integrate indefinitely.
20. Miller Integrator. A Miller amplifier circuit is an electronic integrating device, providing a voltage which is the integral ofa varying input voltage (ie Vo = ¡ 1
CR
RV.dt); the process being fast and accurate. The Miller integrator can only be used to
integrate for limited periods of time, since the integrator must be allowed to regain its stable state periodically. The Millerintegrator is therefore used to integrate spasmodic inputs, eg accelerations: it is not used to integrate continuous inputs, egvelocity. The circuit diagram of the Miller integrator is shown in Fig 8.
3-3-3-1 Fig 8 The Miller Integrator
21. The Velodyne. The velodyne is an electro-mechanical device which converts a voltage input into an output of shaft rotationproportional to the integral of the applied voltage. The operation of the velodyne is described below:
a. As voltage V is applied, the motor starts to turn and drives a generator. As the motor speed increases, the output (V1)from the generator increases, and is fed back to reduce the input voltage.
b. The process continues until the input is steady and is balanced by the feedback voltage. At this stage the output shaft isrotating at a constant speed.
The speed of both the motor and the output shaft d Φ/dt is directly proportional to the input voltage (V − V1 ∝ dΦ/dt). Theangle through which the shaft turns (Φ) is therefore proportional to the time integral of the input voltage (ie Φ∝ R(V ¡ V1 ).dt). The velodyne can integrate continuously, and is therefore used for the second integration of acceleration to
obtain distance travelled. Fig 9 shows a schematic diagram of the velodyne.
3-3-3-1 Fig 9 The Velodyne
DO NOT DISTRIBUTE AP 3456
Page 153 : Wed Jan 02 02:29:13 2002 Inertial Navigation Principles 3- 3- 3- 1

Digital Integrators22. Many inertial systems use digital computers and therefore digital integration techniques. A digital computer integrates byadding small increments of the quantity to be integrated. As the computer will be dealing with discrete quantities instead ofcontinuous values there will be a certain amount of approximation in the integration process. The principle of approximatenumerical integration is introduced in Volume 8 and developments of these techniques are commonly used.
GYROSCOPES
Terms23. The following discussion on gyroscopes complements the contents of Vol 8, Part 2, Sect 4, Chap 5. The following termsare included for clarification:
a. Degrees of Freedom. In the convention used throughout this chapter, the gyro rotor axis is not counted as a degree offreedom, since it cannot be a sensitive axis. A free or space gyro is therefore defined as a two degree of freedom gyro.
b. Gyro Drift. The term gyro drift describes any movement of the gyro spin axis away from its datum direction.
c. Levelling Gyros. Gyros which control the platform about the horizontal axes are called levelling or vertical gyros,irrespective of the direction of their spin axes.
24. Inertial Quality. A gyro is described as being of inertial quality when the real drift rate is 0.01° per hour or less. Such lowdrift rates were first achieved with single degree of freedom rate integrating gyros.
Single Degrees of Freedom (SDF) Gyros25. Rate Integrating Gyro. The rate integrating gyro achieves its accuracy by reducing gimbal friction: the gimbal and rotorassemblies are floated in a fluid. A typical floated rate integrating gyro is illustrated in Fig 10; the rotor is pivoted in an innercan (gimbal), which in turn is floated in an outer can. The outer can contains all the controls, pick-offs, torquers and heaters, etc.Rotation of the gyro about the input (sensitive) axis causes the gyro inner can to precess about the output axis, ie there is relativemotion between the inner and outer cans. This precession is sensed by the pick-offs which measure the angular displacement ofthe inner can relative to the outer can. Thus, the pick-off output is proportional to the time integral of the input turning rate.This output signal is used to drive the platform gimbals to maintain the platform in the required orientation. The ratio of outputto input (gimbal gain) is a function of rotor mass, gimbal size and fluid viscosity. A high ratio enables the gyro to detect smallinput rates. However, the fluid viscosity varies with temperature. Temperature must therefore be controlled to ensure a constant
DO NOT DISTRIBUTE AP 3456
Page 154 : Wed Jan 02 02:29:13 2002 Inertial Navigation Principles 3- 3- 3- 1

gimbal gain. With this type of gyro, it is also important to limit the inner can precession: as the inner can precesses, the rotorand the input axes are also precessed. Unless this precession is rapidly detected and opposed (the gimbal drives the platform andthe gyro in opposition to the input), cross coupling errors are likely to occur. A cross coupling error is caused by the gyrosensing a rotation about a displaced input axis.
Two Degrees of Freedom (TDF) Gyros26. Two degree of freedom gyros are used in some IN applications. SDF and TDF gyros have comparable performances, butthe TDF gyro has the advantage of being able to detect movement about two axes. Since the INS monitors motion about threeaxes, two TDF gyros are not only sufficient, but also supply a redundant axis; the spare axis is normally utilized to monitorazimuth, The two TDF gyros must have their spin axes at right angles to each other; both axes may be horizontal, oralternatively one horizontal and the other vertical.
3-3-3-1 Fig 10 Typical Floated Rate Integrating Gyro
Table 1 - Comparison of SFD and TDF GyrosProperty SDF TDF
Number Required inIN platform
Three Two (one redundant axis)
Gyro Gain Normally controlled by fluidviscosity
Output = input
Cross Coupling Limited rotor axis movementminimizes cross coupling
No cross coupling - angulardisplacement is measuredagainst fixed input axis
Vehicle Movementdetection capability
Detected by rotor axismovement
Detected by gimbal axismovement
Accuracy 0.003°/hr to 0.1°/hr As for SDF
DO NOT DISTRIBUTE AP 3456
Page 155 : Wed Jan 02 02:29:13 2002 Inertial Navigation Principles 3- 3- 3- 1

Comparison of Single and Two Degrees of Freedom Gyros27. The single and two degree of freedom gyros are compared in Table 1.
Pick-Offs and Torquers28. Angular movement about a gyro's sensitive axis is detected by pick-offs which generate electrical signals proportional tothe movement. The action of the torquers is virtually the reverse; electrical signals proportional to the desired correcting torqueare applied to the torquers which cause the gyro to precess at the desired rate. The pick-offs and torquers are usually of theinduction type, and may be separate devices or combined in a single unit; in the latter type, the pick-off would use AC and thetorquer DC to avoid interaction between the fields.
PLATFORMS STABILIZATION
Gyro Control of the Platform29. Platform Mounted Accelerometers. The accelerometers are mounted on a platform which is oriented to a fixed referenceframe. The platform is aligned with the desired reference frame and subsequently controlled to maintain its alignment.
30. Choice of Reference Axes. A fundamental aircraft INS is aligned in the local vertical reference frame, the axes of which areshown in Fig 11. Basic stabilization procedures are described for this simple system, but in practice most RAF aircraft INS use amodified local vertical reference frame known as a Wander Azimuth System. These systems allow the azimuth gyro to wander,and the IN computer continually transforms position in the wander azimuth frame to the required Earth-fixed co-ordinates.
31. Platform Alignment. Inertial platforms are aligned in attitude and azimuth using one of the techniques described in Chapter2. Any platform misalignment will cause errors.
3-3-3-1 Fig 11 Local Vertical Reference Frame
3-3-3-1 Fig 12 Platform Arrangement (Aircraft Heading North)
DO NOT DISTRIBUTE AP 3456
Page 156 : Wed Jan 02 02:29:13 2002 Inertial Navigation Principles 3- 3- 3- 1

32. Use of Gyros. The desired platform orientation is maintained by mounting reference gyros on the platform to detectchanges in platform alignment. The gyro outputs are used to drive gimbal motors which return the platform to its correctorientation.
33. Platform Arrangement. The platform may be arranged as shown in Fig 12. The three gyros have their input axes mutuallyat right angles and aligned with the local vertical reference frame. The error pick-offs and torquers are built into the gyro casesand are not shown in the diagram. The platform is gimbal mounted to permit the aircraft freedom of manoeuvre withoutdisturbing the platform away from its alignment with the local vertical reference frame. Each gimbal is driven by a servo motorcontrolled by the error signals from the gyros.
34. Control on North. The gyros in Fig 12 are arranged with their sensitive axes pointing in the directions about which rotationis to be detected. The East gyro has its sensitive axis pointing East, and is therefore capable of detecting rotation about East. Onnortherly headings, pitch manoeuvres are detected by the East gyro which generates an error signal. This error signal activatesthe pitch gimbal, thereby maintaining the platform's alignment with the reference frame. Similarly, roll is detected by the Northgyro, and yaw by the azimuth gyro: the North gyro activates the roll gimbal motor, and the azimuth gyro the yaw gimbal motor.The action is summarized in Table 2.
Table 2 - Action on NorthHeading Manoeuvre Sensing Gyro Correcting
Servo-motorYaw Azimuth Azimuth
North Pitch East PitchRoll North Roll
3-3-3-1 Fig 13 Platform Arrangement (Aircraft Heading East)
DO NOT DISTRIBUTE AP 3456
Page 157 : Wed Jan 02 02:29:13 2002 Inertial Navigation Principles 3- 3- 3- 1

35. Control on East. In Fig 13, the same platform is again shown, this time heading East. The action on East is summarized inTable 3.
Table 3 - Action on EastHeading Manoeuvre Sensing Gyro Correcting
Servo - motorYaw Azimuth Azimuth
East Pitch North PitchRoll East Roll
36. Conclusions. Two main conclusions may be drawn from Tables 2 and 3:
a. Yaw, or change of heading, is corrected by the azimuth servo-motor which is always controlled by the azimuth gyro.
b. Pitch and roll are corrected by the pitch and roll servo-motors respectively. However, the control may be exercised byeither the North or the East gyros or both, dependent upon aircraft heading.
37. Change of Heading. The action of the azimuth gyro and servo-motor keeps the platform aligned with the North datum.However, the pitch and roll gimbals remain oriented to the aircraft pitch and roll axes (Figs 12 and 13). Relative motion aboutthe vertical between the platform and the pitch and roll gimbals is yaw, and angular displacement is change of heading. Apick-off of the angular displacement relative to true North as defined by the platform, produces an output of heading.
DO NOT DISTRIBUTE AP 3456
Page 158 : Wed Jan 02 02:29:14 2002 Inertial Navigation Principles 3- 3- 3- 1

38. Control During Manoeuvres. On northerly headings, the North gyro senses roll and wholly controls the roll servo-motor;on easterly headings the East gyro controls the roll servo-motor. On intermediate headings, the control is shared between theNorth and East gyros, the amount of control exercised being determined by the heading. A sine-cosine resolver, set by theazimuth servo-motor, determines the amount of control and transmits the error signal to the appropriate servo-motor. The actionis shown in Fig 14.
3-3-3-1 Fig 14 Gimbal Control Signals
PLATFORM MOUNTING
Gimballed Systems39. The stable element of the inertial platform is mounted in gimbals to isolate the platform from vehicle manoeuvres. Threetypes of gimbal system are in common use.
40. Three-gimbal System. Figs 12 and 13 are diagrams of a three-gimbal system. In such a system there are three input/outputaxes, azimuth, pitch and roll. Each gimbal imparts freedom about one particular axis, the particular gimbal being named afterthat axis.
a. Azimuth Gimbal. The stable element is rigidly attached to the azimuth, or first, gimbal. In allowing relative motionbetween the stable element and the pitch gimbal, the platform is isolated from vehicle movement about the vertical axis.
b. Pitch Gimbal. The pitch gimbal isolates the platform from pitch manoeuvres.
c. Roll Gimbal. The roll gimbal isolates the platform from roll manoeuvres.
In some installations, the pitch and roll gimbals are reversed in order of position.
41. Gimbal Lock. Gimbal lock occurs when two axes of rotation become co-linear and, as a result, one degree of freedom islost. Fig 15 illustrates how gimbal lock can occur in a three-gimbal system. If the vehicle pitches through 90° the first and thirdgimbal axes become coincident, and the platform stable element is no longer isolated from yaw.
3-3-3-1 Fig 15 Gimbal Lock
DO NOT DISTRIBUTE AP 3456
Page 159 : Wed Jan 02 02:29:14 2002 Inertial Navigation Principles 3- 3- 3- 1
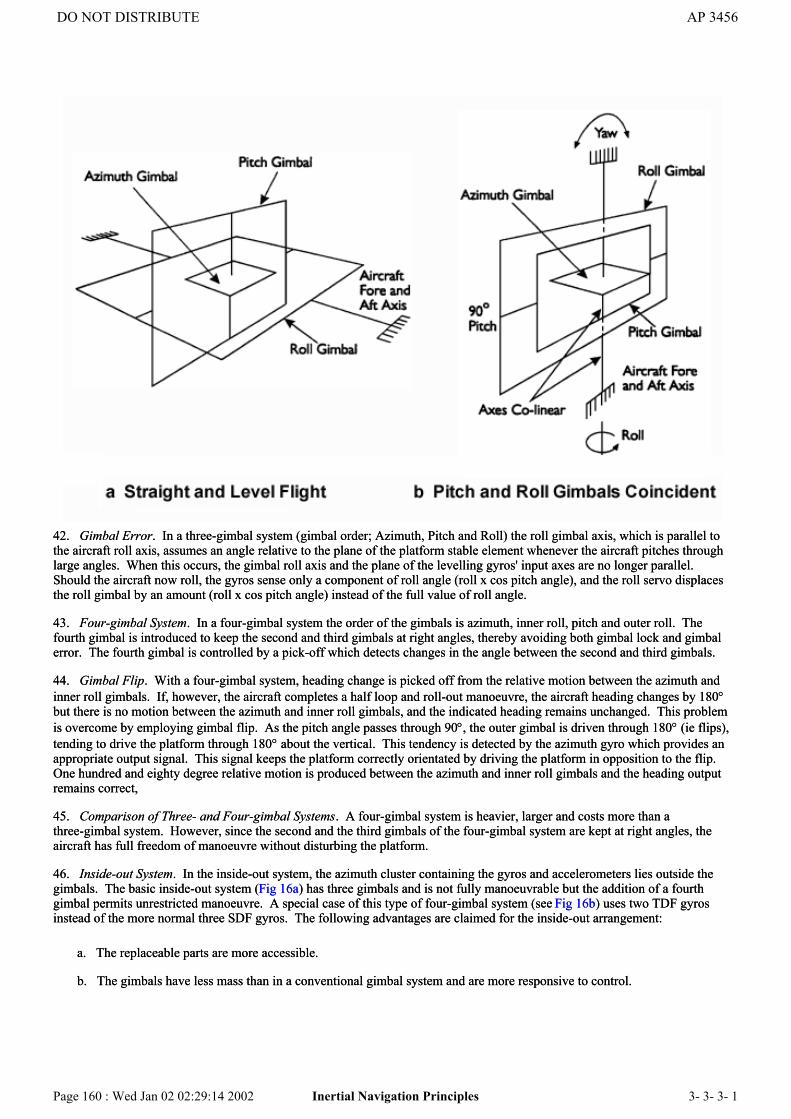
42. Gimbal Error. In a three-gimbal system (gimbal order; Azimuth, Pitch and Roll) the roll gimbal axis, which is parallel tothe aircraft roll axis, assumes an angle relative to the plane of the platform stable element whenever the aircraft pitches throughlarge angles. When this occurs, the gimbal roll axis and the plane of the levelling gyros' input axes are no longer parallel.Should the aircraft now roll, the gyros sense only a component of roll angle (roll x cos pitch angle), and the roll servo displacesthe roll gimbal by an amount (roll x cos pitch angle) instead of the full value of roll angle.
43. Four-gimbal System. In a four-gimbal system the order of the gimbals is azimuth, inner roll, pitch and outer roll. Thefourth gimbal is introduced to keep the second and third gimbals at right angles, thereby avoiding both gimbal lock and gimbalerror. The fourth gimbal is controlled by a pick-off which detects changes in the angle between the second and third gimbals.
44. Gimbal Flip. With a four-gimbal system, heading change is picked off from the relative motion between the azimuth andinner roll gimbals. If, however, the aircraft completes a half loop and roll-out manoeuvre, the aircraft heading changes by 180°but there is no motion between the azimuth and inner roll gimbals, and the indicated heading remains unchanged. This problemis overcome by employing gimbal flip. As the pitch angle passes through 90°, the outer gimbal is driven through 180° (ie flips),tending to drive the platform through 180° about the vertical. This tendency is detected by the azimuth gyro which provides anappropriate output signal. This signal keeps the platform correctly orientated by driving the platform in opposition to the flip.One hundred and eighty degree relative motion is produced between the azimuth and inner roll gimbals and the heading outputremains correct,
45. Comparison of Three- and Four-gimbal Systems. A four-gimbal system is heavier, larger and costs more than athree-gimbal system. However, since the second and the third gimbals of the four-gimbal system are kept at right angles, theaircraft has full freedom of manoeuvre without disturbing the platform.
46. Inside-out System. In the inside-out system, the azimuth cluster containing the gyros and accelerometers lies outside thegimbals. The basic inside-out system (Fig 16a) has three gimbals and is not fully manoeuvrable but the addition of a fourthgimbal permits unrestricted manoeuvre. A special case of this type of four-gimbal system (see Fig 16b) uses two TDF gyrosinstead of the more normal three SDF gyros. The following advantages are claimed for the inside-out arrangement:
a. The replaceable parts are more accessible.
b. The gimbals have less mass than in a conventional gimbal system and are more responsive to control.
DO NOT DISTRIBUTE AP 3456
Page 160 : Wed Jan 02 02:29:14 2002 Inertial Navigation Principles 3- 3- 3- 1
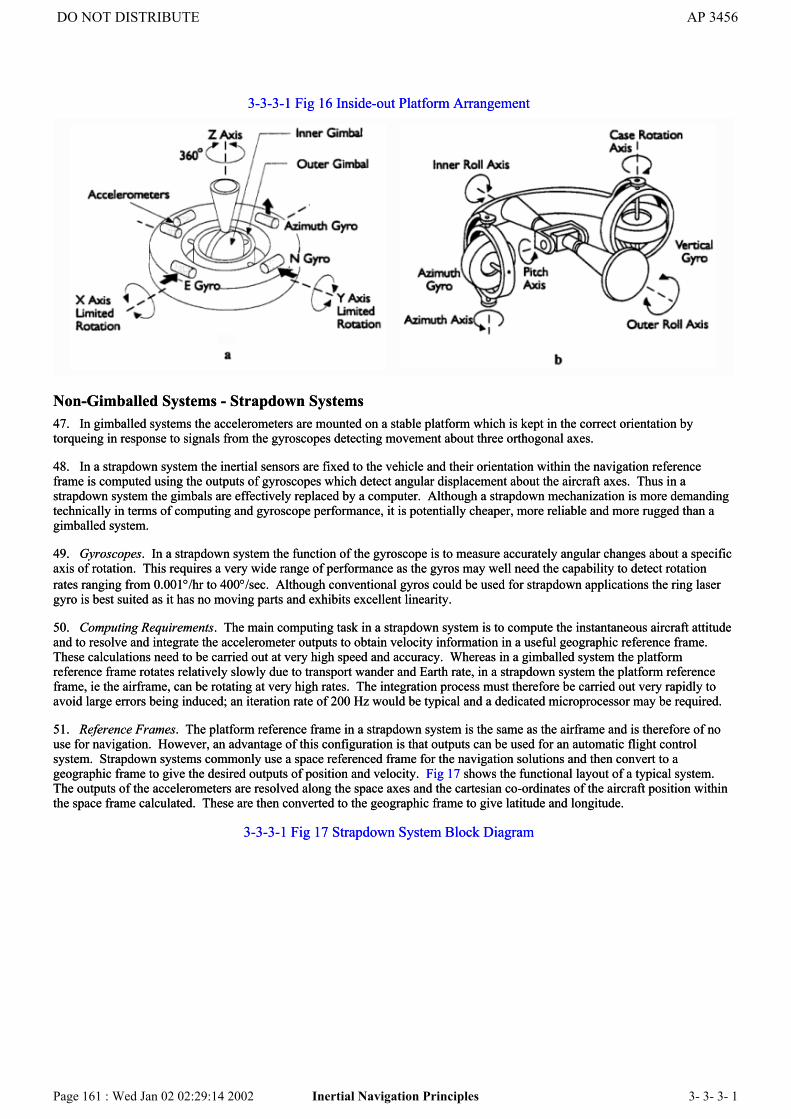
3-3-3-1 Fig 16 Inside-out Platform Arrangement
Non-Gimballed Systems - Strapdown Systems47. In gimballed systems the accelerometers are mounted on a stable platform which is kept in the correct orientation bytorqueing in response to signals from the gyroscopes detecting movement about three orthogonal axes.
48. In a strapdown system the inertial sensors are fixed to the vehicle and their orientation within the navigation referenceframe is computed using the outputs of gyroscopes which detect angular displacement about the aircraft axes. Thus in astrapdown system the gimbals are effectively replaced by a computer. Although a strapdown mechanization is more demandingtechnically in terms of computing and gyroscope performance, it is potentially cheaper, more reliable and more rugged than agimballed system.
49. Gyroscopes. In a strapdown system the function of the gyroscope is to measure accurately angular changes about a specificaxis of rotation. This requires a very wide range of performance as the gyros may well need the capability to detect rotationrates ranging from 0.001°/hr to 400°/sec. Although conventional gyros could be used for strapdown applications the ring lasergyro is best suited as it has no moving parts and exhibits excellent linearity.
50. Computing Requirements. The main computing task in a strapdown system is to compute the instantaneous aircraft attitudeand to resolve and integrate the accelerometer outputs to obtain velocity information in a useful geographic reference frame.These calculations need to be carried out at very high speed and accuracy. Whereas in a gimballed system the platformreference frame rotates relatively slowly due to transport wander and Earth rate, in a strapdown system the platform referenceframe, ie the airframe, can be rotating at very high rates. The integration process must therefore be carried out very rapidly toavoid large errors being induced; an iteration rate of 200 Hz would be typical and a dedicated microprocessor may be required.
51. Reference Frames. The platform reference frame in a strapdown system is the same as the airframe and is therefore of nouse for navigation. However, an advantage of this configuration is that outputs can be used for an automatic flight controlsystem. Strapdown systems commonly use a space referenced frame for the navigation solutions and then convert to ageographic frame to give the desired outputs of position and velocity. Fig 17 shows the functional layout of a typical system.The outputs of the accelerometers are resolved along the space axes and the cartesian co-ordinates of the aircraft position withinthe space frame calculated. These are then converted to the geographic frame to give latitude and longitude.
3-3-3-1 Fig 17 Strapdown System Block Diagram
DO NOT DISTRIBUTE AP 3456
Page 161 : Wed Jan 02 02:29:14 2002 Inertial Navigation Principles 3- 3- 3- 1

CORRECTIONS TO INERTIAL SENSORS
Introduction52. It is normal to navigate aircraft with reference to the local Earth co-ordinates of latitude, longitude and height. Aircraft INSare therefore normally aligned as described in para 30; each of the 3 axes of the local vertical reference frame has anaccelerometer to detect movement along it and a gyro to provide stabilization against rotation around it. Accelerometers andgyros are both inertial devices in that their sensitive axes extend infinitely in straight lines; in other words they operate withreference to the constant axes of inertial space. Local vertical axes however are not constant. For an aircraft system using localvertical Earth co-ordinates it is therefore necessary to change the orientation of the platform axes relative to inertial space inorder that the accelerometers are kept aligned with the local vertical axes. This means that the stabilizing effect of the gyrosmust be adjusted by the rates at which local vertical axes diverge from inertial axes. These rates are due to Earth rotation andvehicle movement as shown in Table 4. The changing orientation of the platform also makes corrections to the accelerometeroutputs necessary.
Table 4 - Platform Correction TermsEarth Rate Vehicle Movement
North Gyro Ω cos φ UR
East Gyro zero ¡ VR
Azimuth Gyro Ω sin φ URtan Á
53. It is now necessary to analyse Earth and transport rates into components affecting the local vertical axes. These are therates which are applied to the platform's axes to correct it from inertial space stabilization to local vertical stabilization. Themethod used in the following discussion is that of vector analysis. A rate of rotation is represented by a vector shown parallel tothe axis of the rotation. Its length is proportional to the rate of rotation and its direction is the direction an ordinary right handthreaded screw would move if subjected to the rotation in question. This is shown in Fig 18 which shows the Earth's rotationvector. The vector is parallel to the Earth's spin axis, its length represents 15:04°/hr (Ω) and its direction is from South to North.
3-3-3-1 Fig 18 Earth's Rotation Vector
DO NOT DISTRIBUTE AP 3456
Page 162 : Wed Jan 02 02:29:15 2002 Inertial Navigation Principles 3- 3- 3- 1
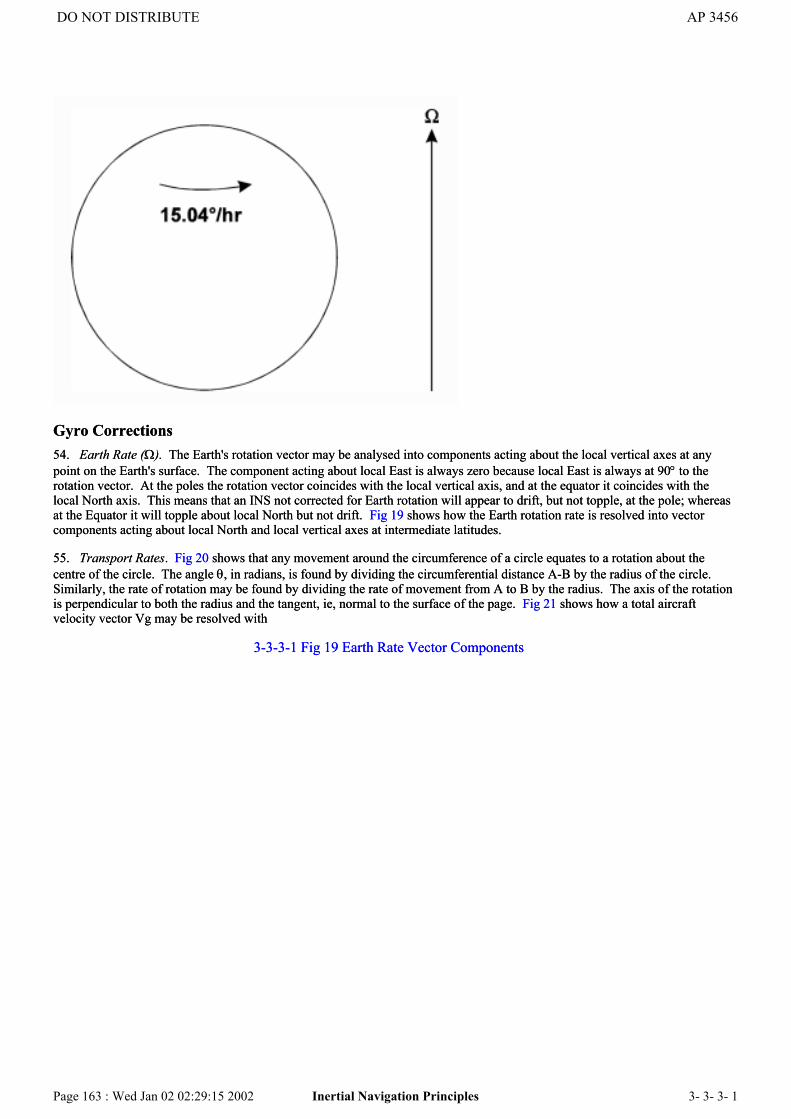
Gyro Corrections54. Earth Rate (Ω). The Earth's rotation vector may be analysed into components acting about the local vertical axes at anypoint on the Earth's surface. The component acting about local East is always zero because local East is always at 90° to therotation vector. At the poles the rotation vector coincides with the local vertical axis, and at the equator it coincides with thelocal North axis. This means that an INS not corrected for Earth rotation will appear to drift, but not topple, at the pole; whereasat the Equator it will topple about local North but not drift. Fig 19 shows how the Earth rotation rate is resolved into vectorcomponents acting about local North and local vertical axes at intermediate latitudes.
55. Transport Rates. Fig 20 shows that any movement around the circumference of a circle equates to a rotation about thecentre of the circle. The angle θ, in radians, is found by dividing the circumferential distance A-B by the radius of the circle.Similarly, the rate of rotation may be found by dividing the rate of movement from A to B by the radius. The axis of the rotationis perpendicular to both the radius and the tangent, ie, normal to the surface of the page. Fig 21 shows how a total aircraftvelocity vector Vg may be resolved with
3-3-3-1 Fig 19 Earth Rate Vector Components
DO NOT DISTRIBUTE AP 3456
Page 163 : Wed Jan 02 02:29:15 2002 Inertial Navigation Principles 3- 3- 3- 1
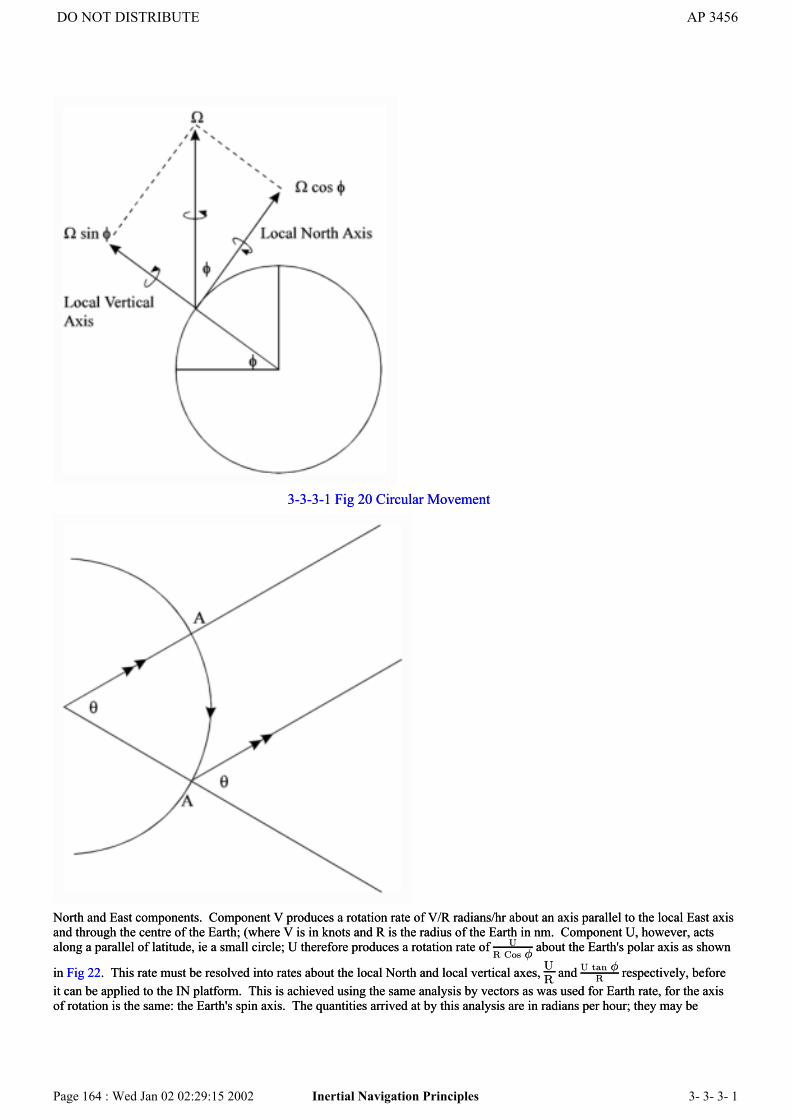
3-3-3-1 Fig 20 Circular Movement
North and East components. Component V produces a rotation rate of V/R radians/hr about an axis parallel to the local East axisand through the centre of the Earth; (where V is in knots and R is the radius of the Earth in nm. Component U, however, actsalong a parallel of latitude, ie a small circle; U therefore produces a rotation rate of U
R Cos Á about the Earth's polar axis as shown
in Fig 22. This rate must be resolved into rates about the local North and local vertical axes, UR
and U tan ÁR respectively, before
it can be applied to the IN platform. This is achieved using the same analysis by vectors as was used for Earth rate, for the axisof rotation is the same: the Earth's spin axis. The quantities arrived at by this analysis are in radians per hour; they may be
DO NOT DISTRIBUTE AP 3456
Page 164 : Wed Jan 02 02:29:15 2002 Inertial Navigation Principles 3- 3- 3- 1

approximated to degrees per hour by substituting 60 for R in the final expressions.
3-3-3-1 Fig 21 Components of Velocity Vector
3-3-3-1 Fig 22 Rotation Rates
56. Correction Method. The drift due to the error rate is eliminated by applying an equal and opposite correction to the gyrooutput axis. The correction is applied through a torque motor on the gyro output axis, which turns the gyro about its output axisat the same rate but in the opposite direction to the precession caused by the error rate.
Accelerometer Corrections57. Stabilizing a platform to local Earth axes requires that it be rotated relative to a spatial reference in order to compensate forthe effects of Earth rotations and vehicle movement. The resulting change in the local axes relative to spatial references makes 2types of accelerometer corrections necessary:
DO NOT DISTRIBUTE AP 3456
Page 165 : Wed Jan 02 02:29:15 2002 Inertial Navigation Principles 3- 3- 3- 1

a. Central or Centripetal Acceleration. A body moving at a constant speed v in a circle radius r has a constant acceleration
of v2
r directed towards the centre of the circle (see Vol 8, Pt 2, Sect 4, Chap 2, Paras 14 - 16). This is a central or
centripetal acceleration and affects a local vertical INS because as the platform is transported over a spherical surface it isrotated to maintain its alignment with local North and the local vertical.
b. Coriolis Acceleration. Coriolis acceleration results from the combination of aircraft velocity and the rotation of theEarth over which it flies. A lateral acceleration relative to inertial references is necessary to make good a desired trackmeasured against meridians which are themselves in motion.
58. Central Accelerations. At any instant when an INS is moving over the Earth's surface it is moving along an arc of a great
circle. An acceleration of Vg 2
R therefore affects the vertical accelerometer where Vg is along track velocity and R is the radius
of the Earth. Pythagoras' theorem enables us to convert this term to its component form V2 + U 2
R and thus make use of the 1st
integrals of the North and East channels accelerations. This quantity as a correction must be added to the output of the verticalaccelerometer. (See note at end of para 63). Central acceleration corrections must also be applied to the horizontalaccelerometers because of meridian convergence. Any East component of velocity acts along a small circle of latitude whoseradius is R cos φ. There is thus a central acceleration of U2
R cos Á along this radius, that is, along an axis inclined at φ to the localvertical. This is shown in Fig 23.
3-3-3-1 Fig 23 Axis of Central Acceleration
59. Resolution of Total Acceleration. Because of this inclination, the total acceleration may be resolved by vector analysis into2 components, one affecting the North accelerometer and the other the vertical accelerometer. These are shown in Fig 24. The
component U2
R is contained within the vertical accelerometer correction already discussed. The acceleration component U
2tan ÁR
however, must be subtracted from the output of the North accelerometer because it is caused entirely by an Eastward motion.This apparent contradiction arises because while "East" is a constant direction in terms of navigation over the surface of theEarth, it is a direction which constantly changes with respect to the fixed axes of inertial space. We thus have an Eastwardvelocity component producing an output from the North accelerometer, this must be removed for purposes of navigation.
3-3-3-1 Fig 24 Components of Central Acceleration
DO NOT DISTRIBUTE AP 3456
Page 166 : Wed Jan 02 02:29:15 2002 Inertial Navigation Principles 3- 3- 3- 1

60. Application. Now consider an aircraft flying a great circle track at a constant groundspeed. The track angle is constantlychanging and, therefore, so are U and the North accelerometer correction. In order that a constant total velocity vector results,the output of the East accelerometer must be adjusted in inverse proportion to the North accelerometer correction. Thehorizontal accelerometer central corrections thus produce varying V and U components of total velocity as track angle changesrelative to the converging meridians. Table 5 shows that if there is no East component of velocity there is no central correctionto either horizontal axis. If there is no North component only the North accelerometer correction is applied, as discussed earlier.Also the magnitude of the corrections to the horizontal accelerometers increases as latitude increases, ie as meridian convergenceincreases.
61. Coriolis Acceleration. An aircraft flying a constant track over a spherical rotating Earth follows a path which is curvedrelative to the constant axes of inertial space. As shown in para 54 there is a component of Earth rotation which acts about thelocal vertical axis, this component Ω sin φ varies with latitude. An observer may thus be regarded as being at the centre of arotating disc of Earth's surface; the direction of rotation being anti-clockwise when viewed from above, in the Northernhemisphere. An aircraft flying towards a given point on the horizon is therefore flying to a destination which is movingconstantly to the left. A straight track over the ground thus produces a track which is curved relative to a constant spatialdirection; this can only be achieved if there is a sideways acceleration. This acceleration is the Coriolis effect and is detected bythe horizontal accelerometers. It must, however, be removed if the system is to produce navigation information which is correctrelative to Earth co-ordinates. A similar correction is applied to the vertical accelerometer because of the component of Earthrotation acting about the local North horizontal axis. The corrections are given below:
a. 2ΩVsinφ applied to the East accelerometer.
b. −2ΩUsin φ applied to the North accelerometer.
c. 2Ω Ucosφ applied to the Vertical accelerometer.
62. Gravity Corrections. When a third accelerometer is used in the vertical channel to measure vertical acceleration for weaponaiming purposes its sensitive axis will necessarily be in line with the gravity vector; the accelerometer will sense the accelerationdue to gravity as well as aircraft vertical acceleration. Its output must therefore, be corrected for gravity, in addition to coriolis,and centripetal accelerations. Because the gravity acceleration decreases as the distance from the centre of the Earth increases,the correction is dependent on aircraft altitude. The correction is given by:
go
½2h
r¡1
¾
where go is the gravity at the surface of the Earth and h is the aircraft latitude.
Summary
DO NOT DISTRIBUTE AP 3456
Page 167 : Wed Jan 02 02:29:16 2002 Inertial Navigation Principles 3- 3- 3- 1

63. The gyro and accelerometer correction terms are summarized in Table 5.
NOTE:In the Southern Hemisphere, the signs of the azimuth gyro correction terms are reversed. That is, Earth rate (Ω)and velocity East (U) are negative.
Table 5 - Gyro and Accelerometer TermsGyros Accelerometers
Axis Earth Rate TransportWander
Central Coriolis Gravity
North − cos Á UR
¡U2
tan ÁR
¡2− U sin Á nil
East nil ¡VR
UV tan ÁR
2− V sin Á nil
Azimuth/
Vertical
− sin Á URtan Á U2 + V 2
R
2− U cos Á go©2hR
¡1ª
3-3-3-1 Fig 16a
3-3-3-1 Fig 16b
DO NOT DISTRIBUTE AP 3456
Page 168 : Wed Jan 02 02:29:16 2002 Inertial Navigation Principles 3- 3- 3- 1

Inertial Navigation PrinciplesChapter 2 - Alignment
Introduction1. An INS computes the velocity and position of a vehicle within a given reference frame and unless the platform is initiallyaligned to that frame all subsequent computations will be meaningless. Once this initial alignment has taken place the systemuses its own computed values of position and velocity to torque the stabilizing gyros at the required rates to maintain the correctplatform orientation. The fundamental aircraft INS is a local vertical North slaved system and in this case the initial alignmentconsists of levelling the horizontal axes and aligning the North axis with North. These two actions are carried out sequentiallyand are usually known as 'levelling' and 'azimuth alignment'.
2. Three methods of alignment will be considered in this chapter:
a. Self Alignment.
b. Reference Alignment.
c. Airborne Alignment.
3. Various factors affect the choice of alignment method and these include:
a. The reference frame being used.
b. The time available.
c. The accuracy required.
d. The amount of support equipment available.
The stability of the vehicle during the alignment phase.
A full alignment will typically take between 10 and 15 minutes and this may not always be compatible with operationalrequirements. Accordingly much research has been carried out into rapid alignment techniques for combat aircraft.
DO NOT DISTRIBUTE AP 3456
Page 169 : Wed Jan 02 02:29:16 2002 Inertial Navigation Principles 3- 3- 3- 2

Self Alignment of Local Vertical Referenced INS4. An INS can align itself using the local gravity vector for levelling and the Earth's rotation vector for azimuth alignment. Aconventional self alignment consists of the following phases:
a. Warm-up period.
b. Coarse alignment.
c. Fine levelling.
d. Gyro-compassing.
5. Warm-up Period. During the warm-up period the fluid filled accelerometers and gyros are brought to the correct operatingtemperature (typically 70°C) by rapid heating (approx 15°C/min) and the gyros are run up. This phase normally takes between 3and 4 minutes.
6. Coarse Alignment. During the coarse alignment phase the platform is roughly levelled and aligned in azimuth therebyremoving gross errors and reducing the overall alignment time.
a. Coarse Levelling. The pitch and roll gimbals are driven until they are at 90° to each other. The platform is then levelledto ± 1 by reference to the aircraft frame or to gravity using the horizontal accelerometers or gravity switches.
b. Coarse Azimuth Alignment. Coarse azimuth alignment, (± 2°), is achieved by turning the platform in azimuth until theheading output agrees with the aircraft's best known heading, normally obtained from the gyro-magnetic compass.
Coarse levelling and alignment is usually carried out concurrently with the rapid heating once the temperature is above about35°C. The phase itself takes only a few seconds but the overall time is governed by the heating process.
7. Fine Levelling. Fine levelling is achieved using the accelerometer null technique. With the aircraft stationary there shouldbe no output from the horizontal accelerometers provided the platform is level. Any tilt error will cause the accelerometers tosense a component of gravity and the resulting signal, which will be proportional to tilt, is used to torque the levelling gyros. Inpractice the accelerometer outputs are zero only when the acceleration due to gravity is balanced by the accelerometer bias. Theaccuracy is largely dependent on the null characteristics of the accelerometers but levelling to within 6 seconds of arc isachievable. Fine levelling normally takes about 1.5 minutes.
8. Gyro-compassing. Gyro-compassing or fine azimuth alignment is the final stage of self alignment and is based on the factthat if the East gyro input axis is pointing East it will not sense any component of Earth rate. If it is misaligned however it willsense a component, Ω cos φ sin Ψ where φ is latitude and Ψ is the angle of misalignment. This sensed component can be used toalign the platform and two main methods are employed: closed loop and open loop gyro-compassing.
a. Closed Loop Gyro-compassing. The sensed component of Earth rate will cause the platform to tilt out of level and sothe North accelerometer senses a component of gravity. The signal from the accelerometer is fed through a high gainamplifier in order to torque the platform in azimuth until the error is nulled. The levelling loop continues to be operativeduring the gyro-compassing phase. Alignment in azimuth using this method should achieve an accuracy of about 6 arcminutes in about 6 - 10 minutes.
b. Open Loop Gyro-compassing. The majority of modern North slaved INS use open loop gyro-compassing. The sensedcomponent of Earth rate is measured and since Ω and φ are known the misalignment angle, Ψ, can be calculated. When thesystem is switched from the alignment to the navigate mode the platform is rotated through the computed misalignmentangle. Although this would appear to be a quicker method than the closed loop technique, in practice the error signal issmall and difficult to measure in the presence of noise. In order to overcome this problem the misalignment signal has to befiltered and averaged over time, usually about 7 minutes, and so in fact there is little difference in the time taken by eachmethod.
The Earth rate sensed by a misaligned East gyro depends on the cosine of the latitude and therefore gyro-compassing accuracydecreases with increasing latitude and cannot be achieved close to the poles. Furthermore the time taken to achieve alignmentwill increase with latitude due to the reducing strength of the error signal. The accuracy of the alignment will also depend on thereal drift rate of the East gyro as this will be an unwanted component of the error signal.
9. Self Alignment Time. The time taken in carrying out the full self alignment sequence depends on the accuracy required, the
DO NOT DISTRIBUTE AP 3456
Page 170 : Wed Jan 02 02:29:17 2002 Inertial Navigation Principles 3- 3- 3- 2

latitude, and the ambient temperature. In UK latitudes, starting at a temperature between 0°C and 15°C, a typical INS will selfalign in 10 - 15 minutes, of which between 6 and 9 minutes will be attributable to the gyro-compassing phase. This may beoperationally restrictive and some systems have a rapid align mode which reduces the time but at the cost of some accuracy. Thealignment is carried out with the gyros running at half speed and at the ambient temperature, provided this is above 5°C, whichcuts out the platform heating phase and reduces the gyro spin-up time. The accuracy depends on the time allowed for measuringthe misalignment angle but the system can be switched from 'align' to 'navigate' after about two minutes. As soon as this is donethe heading error is torqued out and rapid heating is commenced to bring the system to operating temperature. Once heating iscomplete the gyros spin-up to their full speed. Although the alignment time is reduced to about two minutes this must bebalanced by an accuracy reduction by about a factor of two.
Reference Alignment10. The most time consuming phase of the self alignment sequence is the gyro-compassing phase and several methods of finealignment have been developed which use some form of external reference. These methods are in general less accurate than selfalignment and usually rely on support equipment or specially located aircraft pan. The following methods will be discussed:
a. Transfer Gyro Alignment
b. Synchro Memory Alignment
c. Head-up Display Alignment
d. Runway Alignment
11. Transfer Gyro Alignment. The transfer gyro method permits rapid alignment and, as it is portable, it is particularly suitablefor use in the field. There are two main components: the datum gyro and the transfer gyro. The datum gyro is mounted on afirm protected base and is used to establish North by gyro-compassing. The transfer gyro is an azimuth gyro which is located onthe datum gyro base plate by dowels. The transfer gyro is aligned to North by reference to the datum gyro and is then carried tothe aircraft and used to align the aircraft azimuth gyro. The transfer gyro is powered by its own batteries during the transfer.The transfer gyro takes about 20 minutes to align to the datum after which it is ready for immediate use. Transfer of the headingto the aircraft takes about 15 seconds. The accuracy of the system is about 0.2° for around 30 minutes after removal from thedatum.
12. Synchro Memory Alignment. The platform may be gyro-compassed at any convenient time and the azimuth obtained storedin a synchro memory system. Provided the aircraft is not moved the platform may be realigned subsequently by torqueing it tothe stored azimuth. If the aircraft frame is rigid and immobile the output is accurate and repeatable to a few minutes of arc but inpractice it is very difficult to ensure that the aircraft does not move by a few minutes of arc.
13. Head-Up Display (HUD) Alignment. If the true bearing of a distant object is known the HUD can be used to measure therelative bearing of the object from the aircraft and the true heading can then be calculated. The INS is then slewed until theheading output agrees with the calculated heading. This method can be used as an extension of the synchro memory technique.After gyro-compassing the HUD is used to measure the relative bearing of a distant object. As the true heading of the aircraft isknown the true bearing of the object can be calculated. The INS can then be shut down and the aircraft can be moved providingthat when it is necessary to carry out the alignment it is returned to within a few feet of its original position and the object iswithin the HUD field of view. Accuracies of around 0.2° can be achieved by this method and the technique has the advantage ofbeing independent of external facilities or support equipment.
14. Runway Alignment. Azimuth errors may be corrected during the take-off run if precise runway heading and take-offdistance are known. At lift off the aircraft is held as close to the centre line as possible and the accelerometer outputs areprocessed in a small computer to provide along and across distances. The computed lateral displacement is assumed to beentirely due to platform misalignment in azimuth and the gyro is torqued until the error is removed. An accuracy approaching0.2° should be attainable by this method.
Airborne Alignment15. A pure INS cannot self align in flight as an external reference is required to distinguish between movement induced andmisalignment induced accelerations. However, fix monitored INS may be mechanized to perform airborne alignmentautomatically by comparing the INS track-made-good with the track-made-good determined from the fixing. Any across trackdiscrepancy is attributed to azimuth misalignment. Airborne alignment can also be achieved in doppler/inertial mixed systemsby comparing the doppler and inertial velocity outputs.
DO NOT DISTRIBUTE AP 3456
Page 171 : Wed Jan 02 02:29:17 2002 Inertial Navigation Principles 3- 3- 3- 2
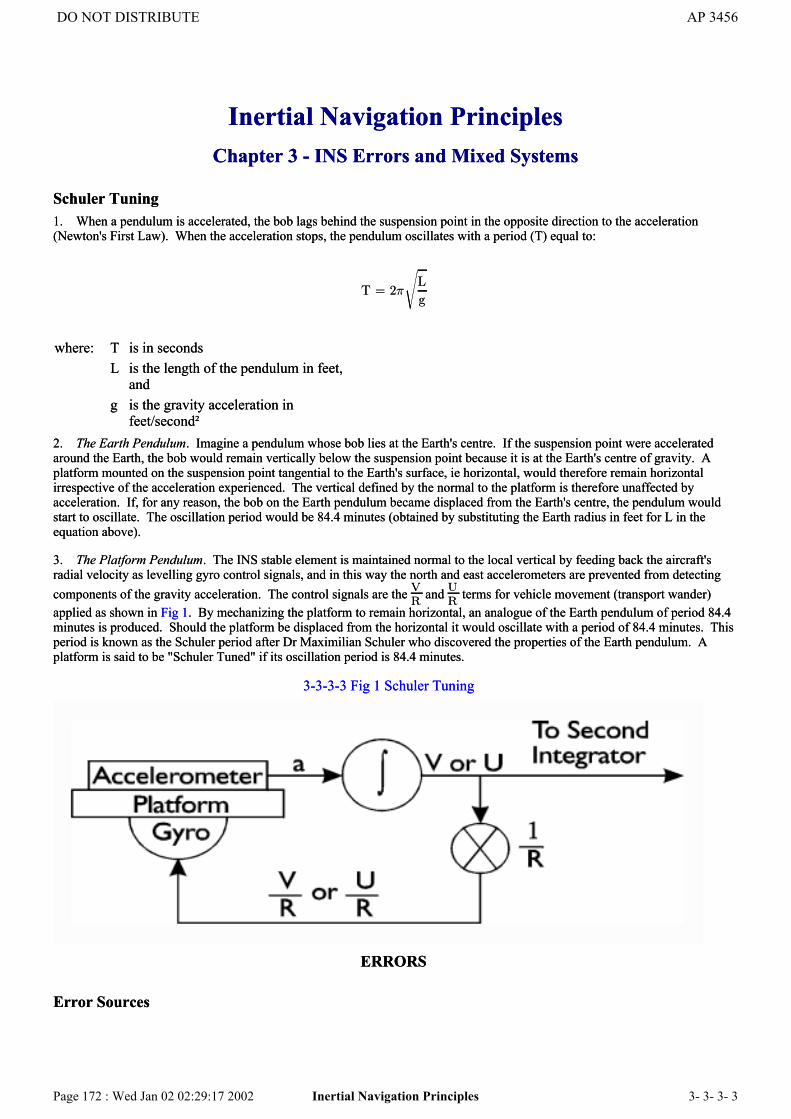
Inertial Navigation PrinciplesChapter 3 - INS Errors and Mixed Systems
Schuler Tuning1. When a pendulum is accelerated, the bob lags behind the suspension point in the opposite direction to the acceleration(Newton's First Law). When the acceleration stops, the pendulum oscillates with a period (T) equal to:
T = 2¼
sL
g
where: T is in secondsL is the length of the pendulum in feet,
andg is the gravity acceleration in
feet/second²2. The Earth Pendulum. Imagine a pendulum whose bob lies at the Earth's centre. If the suspension point were acceleratedaround the Earth, the bob would remain vertically below the suspension point because it is at the Earth's centre of gravity. Aplatform mounted on the suspension point tangential to the Earth's surface, ie horizontal, would therefore remain horizontalirrespective of the acceleration experienced. The vertical defined by the normal to the platform is therefore unaffected byacceleration. If, for any reason, the bob on the Earth pendulum became displaced from the Earth's centre, the pendulum wouldstart to oscillate. The oscillation period would be 84.4 minutes (obtained by substituting the Earth radius in feet for L in theequation above).
3. The Platform Pendulum. The INS stable element is maintained normal to the local vertical by feeding back the aircraft'sradial velocity as levelling gyro control signals, and in this way the north and east accelerometers are prevented from detectingcomponents of the gravity acceleration. The control signals are the V
R and U
R terms for vehicle movement (transport wander)
applied as shown in Fig 1. By mechanizing the platform to remain horizontal, an analogue of the Earth pendulum of period 84.4minutes is produced. Should the platform be displaced from the horizontal it would oscillate with a period of 84.4 minutes. Thisperiod is known as the Schuler period after Dr Maximilian Schuler who discovered the properties of the Earth pendulum. Aplatform is said to be "Schuler Tuned" if its oscillation period is 84.4 minutes.
3-3-3-3 Fig 1 Schuler Tuning
ERRORS
Error Sources
DO NOT DISTRIBUTE AP 3456
Page 172 : Wed Jan 02 02:29:17 2002 Inertial Navigation Principles 3- 3- 3- 3

4. The following errors affect inertial navigation systems:
a. Initial levelling error.
b. Accelerometer error.
c. Integrator error.
d. Levelling gyro drift.
e. Initial azimuth misalignment error.
f. Azimuth gyro drift.
g. Vertical channel errors.
5. Bounded Errors. Errors originating in, or effective within, the Schuler loops, are oscillatory and propagate at the Schulerfrequency. These errors, which oscillate about a constant mean and therefore do not grow continuously with time, are termedbounded errors.
Initial Levelling Error6. Oscillation. No matter how carefully the stable element (platform) and its sensors are aligned, there is always some residualerror in the vertical, ie the platform is not completely level. When the "navigate" mode is selected (at the conclusion of thealignment phase) the following sequence takes place. (Note: The lettering of the sub-paragraphs corresponds with the letteringin Fig, 2):
a. The accelerometer detects the component of gravity, gΦo (strictly g sin Φo but the approximation is correct and forsmall angles and Φo expressed in radians). Following the convention that clockwise tilts produce positive acceleration,gΦo is sensed as a positive acceleration. The integration of the accelerometer output takes a finite time, and therefore,velocity and distance are zero at the instant the "navigate" mode is selected.
b. The integration of the detected acceleration produces a positive velocity which drives the platform anti-clockwise to thehorizontal. The accelerometer now detects zero acceleration, but the positive velocity continues to drive the platform.
c. After the platform passes the horizontal the accelerometer detects the opposite gravity effect, sensed as a negativeacceleration. The positive velocity reduces to zero at angle Φo (the original tilt error) and for an instant the platform drivestops. However, the negative acceleration is integrated into negative velocity which drives the platform clockwise.
3-3-3-3 Fig 2 Initial Levelling Misalignment - Oscillation
DO NOT DISTRIBUTE AP 3456
Page 173 : Wed Jan 02 02:29:17 2002 Inertial Navigation Principles 3- 3- 3- 3

d. The clockwise drive brings the platform once again to the level position, resulting in zero output from the accelerometer.However, the negative velocity continues to drive the platform clockwise.
e. After the platform passes the horizontal the accelerometer detects the gravity effect, sensed as a positive acceleration.This reduces the negative velocity to zero at angle Φo. The cycle is then repeated.
7. Initial Tilt Errors. The errors caused by an initial tilt are shown in Fig 3. Note: the errors are bounded and do not increasewith time. An initial levelling error of 6 seconds of arc is shown to cause a velocity error bounded by ± 0.75 feet per second(0.45 knots) and a mean distance error of 0.1 nm. After one complete Schuler period both the velocity and distance errors havereturned to zero. The a, b, c, d and e positions of the error curve are labelled to correspond to the sub-figure lettering of Fig 2.
3-3-3-3 Fig 3 Initial Levelling Misalignment - Errors
DO NOT DISTRIBUTE AP 3456
Page 174 : Wed Jan 02 02:29:17 2002 Inertial Navigation Principles 3- 3- 3- 3
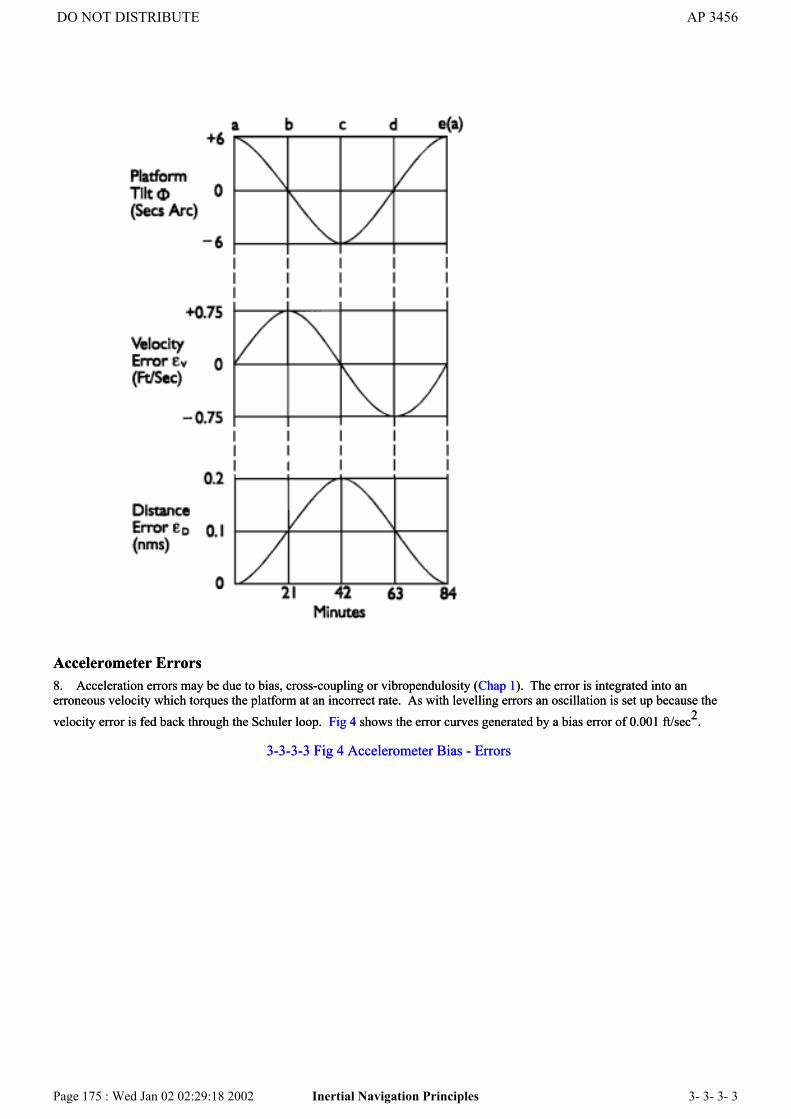
Accelerometer Errors8. Acceleration errors may be due to bias, cross-coupling or vibropendulosity (Chap 1). The error is integrated into anerroneous velocity which torques the platform at an incorrect rate. As with levelling errors an oscillation is set up because thevelocity error is fed back through the Schuler loop. Fig 4 shows the error curves generated by a bias error of 0.001 ft/sec2.
3-3-3-3 Fig 4 Accelerometer Bias - Errors
DO NOT DISTRIBUTE AP 3456
Page 175 : Wed Jan 02 02:29:18 2002 Inertial Navigation Principles 3- 3- 3- 3

Integrator Errors9. The first integrator is within the Schuler loop. Any error in the integration results in an incorrect velocity output whichproduces a platform oscillation and associated error curves similar to those previously discussed. The second integrator isoutside the Schuler loop and any errors caused by it produce a position error that increases linearly with time.
Levelling Gyro Drift10. Although the desired drift for an IN gyro is of the order of 0.001°/hr it is probable that the drift rate in flight will be greater.A typical figure of 0.01°/hr is used to illustrate the effect of gyro drift on the platform:
a. Oscillation. The stable element is turned away from the horizontal at the rate of 0.01°/hr. The rotation is bounded bythe Schuler loop, and the platform tilt curve is shown at Fig 5a.
DO NOT DISTRIBUTE AP 3456
Page 176 : Wed Jan 02 02:29:18 2002 Inertial Navigation Principles 3- 3- 3- 3

b. Velocity Error. The acceleration error follows the same curve as that shown for platform tilt (Fig 5a). After integrationthe velocity curve at Fig 5b is obtained, which shows that a mean velocity error develops over the Schuler period.
c. Distance Error. The second integration results in the distance error which grows with time because of the mean velocityerror. The growth rate is oscillatory about a mean ramp increase (Fig 5c). The distance error due to levelling gyro drift isunbounded, and for a drift of 0.01°/hr, the ramp grows at approximately 0.6 nm/hr and has an oscillation of ± 0.13 nm.
3-3-3-3 Fig 5 Errors Caused by Gyro Drift
Initial Azimuth Misalignment11. If an INS is properly aligned in azimuth the East gyro senses zero component of Earth-rate and the North gyro outputs asignal proportional to −Ωcosφ. If the INS is misaligned in azimuth by an angle Ψ, the East gyro will output −ΩcosφsinΨ, andthe North gyro −ΩcosφcosΨ.
DO NOT DISTRIBUTE AP 3456
Page 177 : Wed Jan 02 02:29:18 2002 Inertial Navigation Principles 3- 3- 3- 3

12. The North gyro is torqued for Earth-rate by Ω cos φ and therefore the torqueing error will be:
− cos Á ¡ − cos Á cos ª
= − cos Á (1 ¡ cos ª)±/hr
Since the magnitude of the misalignment angle is unlikely to exceed 0.5°, this error may be disregarded.
eg at Latitude 55± and ª = 0.5± the error is:
15.05 cos 55± (1 ¡ 0.99996)±/hr
= 0.0003±/hr
13. The error for the East gyro, given by − Ωcosφ sin Ψ°/hr, is appreciable even when Ψ is small. At Latitude 55° and Ψ of0.1°, the error is 0.015°/hr. This error appears as East levelling gyro drift which causes the platform to oscillate about East andaffects the North accelerometer, northern velocity and latitude determination. The error curves produced in the latitude channelby an initial azimuth misalignment are similar to those caused by levelling gyro drift. The unbounded nature of the resultingdistance error makes it essential to keep the initial azimuth alignment error as small as possible, and preferably less than 0.1°.The effect of various misalignment angles is shown in Table 1.
Table 1 - Effect of Initial Azimuth Misalignment (North Channel) - LAT 55°NAzimuth
Error Deg'sResultant East
Gyro DriftDegree/hr
DistanceError at 1
hour
MaxVelocity
Error ft/sec0.03° 0.005°/hr 2,220 ft 1 ft/sec0.1° 0.015°/hr 6,600 ft 3 ft/sec0.2° 0.030°/hr 13,310 ft 6 ft/sec0.3° 0.045°/hr 19,970 ft 9 ft/sec
14. Azimuth misalignment also results in slightly incorrect accelerations being sensed by the misaligned accelerometers. Theresultant errors may become significant under prolonged accelerations, eg during long accelerated climbs.
Azimuth Gyro Drift15. Azimuth gyro drift (δΨ), like azimuth misalignment, registers as East levelling gyro drift and produces an increasingazimuth alignment error. The errors produced oscillate about means which increase with time. The increasing mean velocityerror produces an unbounded distance error which follows a parabolic growth rate (illustrated in Fig 6).
3-3-3-3 Fig 6 Azimuth Gyro Drift - Distance Error
DO NOT DISTRIBUTE AP 3456
Page 178 : Wed Jan 02 02:29:18 2002 Inertial Navigation Principles 3- 3- 3- 3
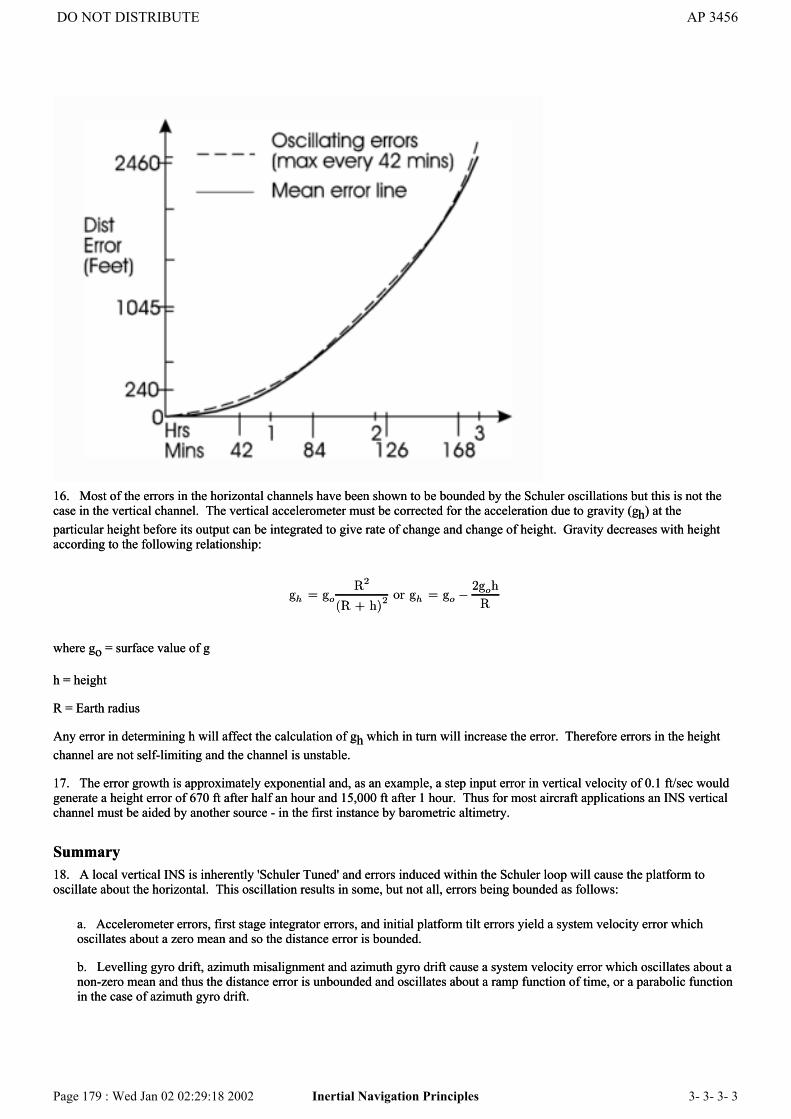
16. Most of the errors in the horizontal channels have been shown to be bounded by the Schuler oscillations but this is not thecase in the vertical channel. The vertical accelerometer must be corrected for the acceleration due to gravity (gh) at theparticular height before its output can be integrated to give rate of change and change of height. Gravity decreases with heightaccording to the following relationship:
gh = goR2
(R + h)2 or gh = go ¡
2goh
R
where go = surface value of g
h = height
R = Earth radius
Any error in determining h will affect the calculation of gh which in turn will increase the error. Therefore errors in the heightchannel are not self-limiting and the channel is unstable.
17. The error growth is approximately exponential and, as an example, a step input error in vertical velocity of 0.1 ft/sec wouldgenerate a height error of 670 ft after half an hour and 15,000 ft after 1 hour. Thus for most aircraft applications an INS verticalchannel must be aided by another source - in the first instance by barometric altimetry.
Summary18. A local vertical INS is inherently 'Schuler Tuned' and errors induced within the Schuler loop will cause the platform tooscillate about the horizontal. This oscillation results in some, but not all, errors being bounded as follows:
a. Accelerometer errors, first stage integrator errors, and initial platform tilt errors yield a system velocity error whichoscillates about a zero mean and so the distance error is bounded.
b. Levelling gyro drift, azimuth misalignment and azimuth gyro drift cause a system velocity error which oscillates about anon-zero mean and thus the distance error is unbounded and oscillates about a ramp function of time, or a parabolic functionin the case of azimuth gyro drift.
DO NOT DISTRIBUTE AP 3456
Page 179 : Wed Jan 02 02:29:18 2002 Inertial Navigation Principles 3- 3- 3- 3

19. The vertical channel is not governed by Schuler oscillation and is inherently unstable due to the change of gravity withheight.
20. Although the Schuler oscillations predominate in the short term (less than 4 hours), over the long term there are otherperiodic oscillations caused by interactions between the 3 axes.
MIXED INERTIAL SYSTEMS
Introduction21. An INS is very accurate in the short term but the introduction of errors is inevitable, and in a conventional local verticalsystem these cause the platform to oscillate about the horizontal. The shortcomings of such a system can be summarized asfollows:
a. The velocity error resulting from gyro drift oscillates about a non-zero mean and several applications, such as weaponaiming, require a very accurate velocity.
b. The position error resulting from gyro drift is unbounded.
c. High long term accuracy requires very expensive components to minimize the errors.
d. The system cannot be aligned in flight.
e. The vertical channel is inherently unstable.
22. It is possible to overcome these disadvantages by 'mixing' the INS outputs with those of other navigation aids. These aidshave errors which, although relatively large, do not increase with time and so a mixed system combines the short term accuracyof a pure INS with the long term accuracy of another aid, thus enhancing the overall accuracy of both systems. Additionally amixed system can be aligned in flight.
23. The most common mixed systems are those which use Doppler as a reference velocity source which is used to damp theSchuler oscillations. Alternatively an accurate fixing aid such as GPS could be used to bound the position error. In addition it ispossible to stabilize the vertical channel using barometric height. Sophisticated forms of mixing may involve several aids anduse a software controlled statistical technique, such as Kalman Filtering, to continuously monitor and analyse the outputs to givethe best results.
Doppler/IN Mixing24. In a Doppler/IN system the Doppler and inertial velocities are compared to give an error signal which can be used invarious configurations to modify the system performance and in particular to damp the Schuler oscillations. In a simple systemthe error signal is fed to the input of the first integrator, however in practice this leads to an unacceptable long time to reduce theerror. In order to reduce the errors more quickly the error signal is in addition fed forward directly to modify the gyro torqueingsignal; this arrangement is known as a Tuned Second Order System.
25. The reductions in velocity error achieved with a tuned second order Doppler/IN system will have a significant effect on theaccuracy of weapon delivery when compared with a pure INS. However, although the position error is slightly reduced, there isin general little to be gained in positional accuracy when the two systems are compared during the first 4 to 6 hours of flight.
Fix Monitored System26. The problem of the unbounded position error in a pure INS or Doppler/INS can be reduced by coupling the system with anaccurate fixing aid such as GPS. The latitude and longitude outputs from the fixing aid are compared with those from the INSand the resulting error signals are fed through suitable gains to update the inertial position. The difference signals are also usedto provide a degree of damping to the platform. The fix monitored arrangement has the disadvantage of relying to a certainextent on an external source of information whereas the pure INS and Doppler/INS are self-contained.
Airborne Alignment27. The self alignment and reference alignment techniques are restricted to a fixed base as it is not possible for a pure INS todistinguish between the accelerations due to aircraft movement and those due to platform misalignment. An INS which iscombined with an alternative velocity source or position information can however be aligned in flight. The platform is roughly
DO NOT DISTRIBUTE AP 3456
Page 180 : Wed Jan 02 02:29:18 2002 Inertial Navigation Principles 3- 3- 3- 3

aligned and then the error signals from either the external velocity or position information are used to level the platform andalign it in azimuth. The accuracy of an airborne alignment is not as high as that obtained from a full self alignment but thetechnique does give the aircraft a rapid reaction capability and the ability to update the system during a long flight or after atransient equipment failure.
Vertical Channel Stabilization28. The vertical channel does not display the same characteristics as the horizontal channels as it is inherently unstable due tothe fact that the value of g varies with height. It is therefore necessary to supplement the vertical channel with another source ofheight reference in order to provide the accurate values of height and vertical velocity which are essential for weapon aimingcalculations.
29. The barometric altimeter whilst inaccurate in the short term is very accurate in the long term and this characteristic can beused to stabilize the INS height and vertical velocity outputs. The inertial height output is compared with the barometric heightto give an error signal which is fed back to the first integrator and this has the effect of stabilizing the accuracy in the long termwhilst maintaining it in the short term.
KALMAN FILTERING
Introduction30. The hardwired mixed systems described in the preceding paragraphs are inflexible because the feedback gains are fixed andhave to be carefully chosen at the design stage, thus assigning a fixed level of relative performance to the sensors. In reality therelative merits of each sensor will vary considerably and depend on such parameters as time of flight, range from a ground aid,flight conditions and altitude. Consequently the weighting factor applied to each sensor of a mixed system by a fixed gain loopis unlikely to be the true measure of the relative merits of the sensors and could possibly be significantly in error. By using asoftware controlled statistical technique, such as Kalman Filtering, these weighting factors can be optimized and continuouslyupdated for any operating conditions. This method can use any number of sensors and can select the best information availableat any particular time.
Kalman Filter Design31. The Kalman Filtering process estimates each of the parameters which give rise to an error between the INS and one or moreexternal sensors on the basis of maximum likelihood. By using a weighting factor which is continually revised the error betweenthe external data and the INS is apportioned among all the possible error sources so that the probability of these errors occurringis greatest.
32. The computer holds an estimate of the system errors and uses known error propagation equations to forecast how theseerrors will behave with passing time. Thus this error model will always maintain up to date values. When an externalmeasurement is made the error held in the computer is compared with the measured error. All the quantities in the error modelare then corrected in the light of the known variances of the external information and the variances of each quantity in the errormodel. The variances of the system errors are recalculated after each external measurement has been processed so that the errorsof the next measurement can be apportioned in the optimum manner.
33. The design of a practical Kalman Filter for use in an aircraft system is complex. The first problem is to define a set ofvariables that specify the system. In practice there is never enough information to enable the system to be perfectly modelledand there will frequently be limitations on computer time and storage. Extensive trials and simulation are necessary to enablethe designer to define the error model and variables as accurately as possible within the computer limitations. Once designedhowever the filter performance is not affected by changes in aircraft role or tactics, and additional sensors can be incorporatedinto the system with relatively minor changes to the computer software.
Advantages of Kalman Filtering34. By making better use of the information available, Kalman Filtering increases the flexibility and enhances the accuracy of amixed system thus overcoming the disadvantages of a hardwired mixed system. Other important advantages are:
a. Alignment and gyro drift trimming are improved.
b. Weapon aiming accuracy is improved including the elimination of fixed bias errors.
c. Post flight analysis of the navigation system and fault detection can be carried out.
DO NOT DISTRIBUTE AP 3456
Page 181 : Wed Jan 02 02:29:18 2002 Inertial Navigation Principles 3- 3- 3- 3
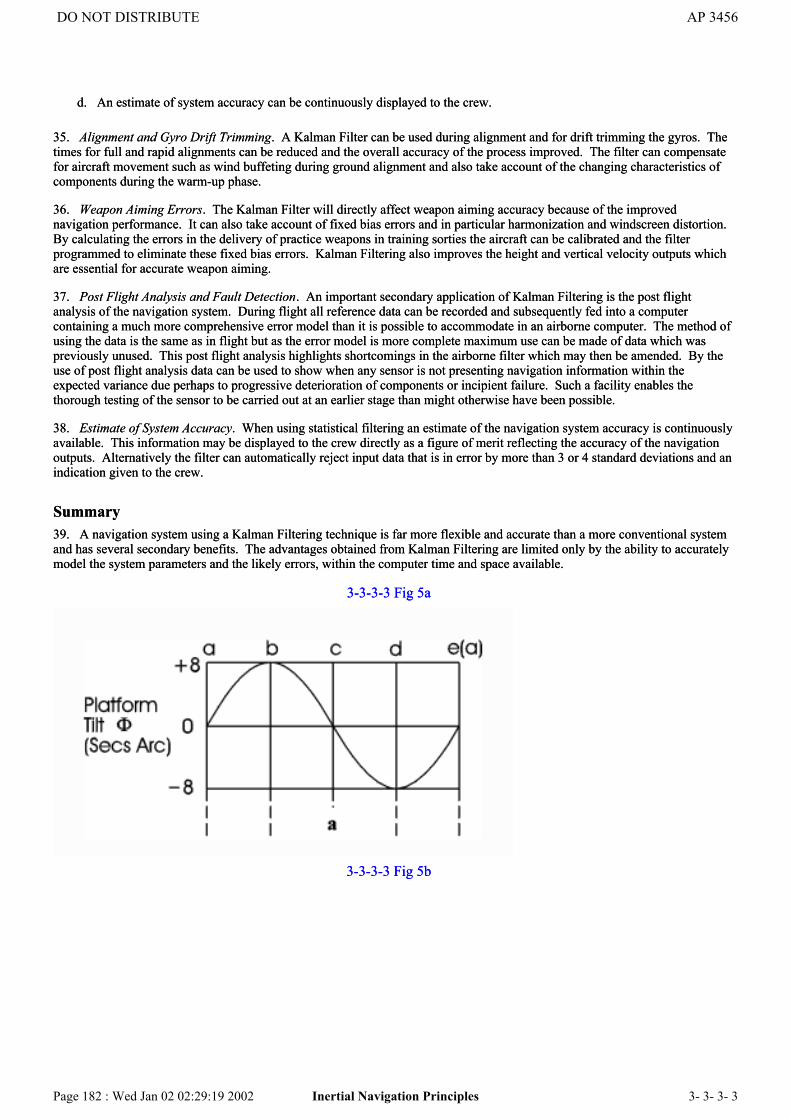
d. An estimate of system accuracy can be continuously displayed to the crew.
35. Alignment and Gyro Drift Trimming. A Kalman Filter can be used during alignment and for drift trimming the gyros. Thetimes for full and rapid alignments can be reduced and the overall accuracy of the process improved. The filter can compensatefor aircraft movement such as wind buffeting during ground alignment and also take account of the changing characteristics ofcomponents during the warm-up phase.
36. Weapon Aiming Errors. The Kalman Filter will directly affect weapon aiming accuracy because of the improvednavigation performance. It can also take account of fixed bias errors and in particular harmonization and windscreen distortion.By calculating the errors in the delivery of practice weapons in training sorties the aircraft can be calibrated and the filterprogrammed to eliminate these fixed bias errors. Kalman Filtering also improves the height and vertical velocity outputs whichare essential for accurate weapon aiming.
37. Post Flight Analysis and Fault Detection. An important secondary application of Kalman Filtering is the post flightanalysis of the navigation system. During flight all reference data can be recorded and subsequently fed into a computercontaining a much more comprehensive error model than it is possible to accommodate in an airborne computer. The method ofusing the data is the same as in flight but as the error model is more complete maximum use can be made of data which waspreviously unused. This post flight analysis highlights shortcomings in the airborne filter which may then be amended. By theuse of post flight analysis data can be used to show when any sensor is not presenting navigation information within theexpected variance due perhaps to progressive deterioration of components or incipient failure. Such a facility enables thethorough testing of the sensor to be carried out at an earlier stage than might otherwise have been possible.
38. Estimate of System Accuracy. When using statistical filtering an estimate of the navigation system accuracy is continuouslyavailable. This information may be displayed to the crew directly as a figure of merit reflecting the accuracy of the navigationoutputs. Alternatively the filter can automatically reject input data that is in error by more than 3 or 4 standard deviations and anindication given to the crew.
Summary39. A navigation system using a Kalman Filtering technique is far more flexible and accurate than a more conventional systemand has several secondary benefits. The advantages obtained from Kalman Filtering are limited only by the ability to accuratelymodel the system parameters and the likely errors, within the computer time and space available.
3-3-3-3 Fig 5a
3-3-3-3 Fig 5b
DO NOT DISTRIBUTE AP 3456
Page 182 : Wed Jan 02 02:29:19 2002 Inertial Navigation Principles 3- 3- 3- 3
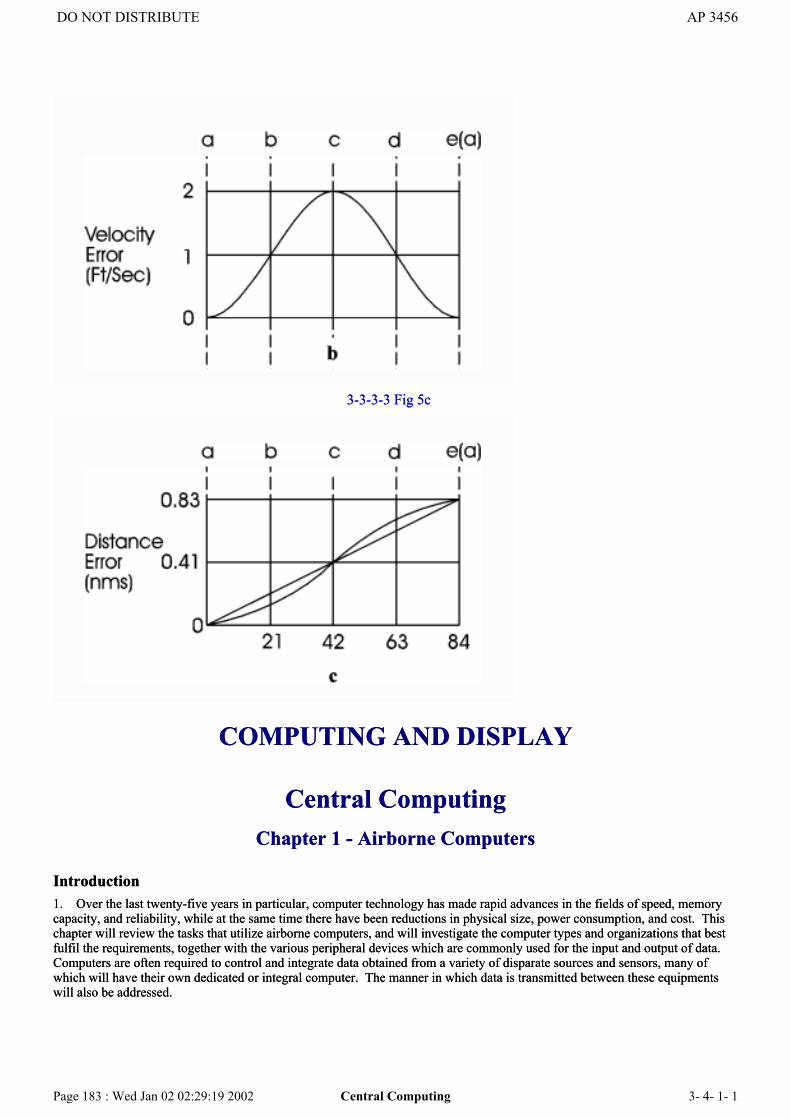
3-3-3-3 Fig 5c
COMPUTING AND DISPLAY
Central ComputingChapter 1 - Airborne Computers
Introduction1. Over the last twenty-five years in particular, computer technology has made rapid advances in the fields of speed, memorycapacity, and reliability, while at the same time there have been reductions in physical size, power consumption, and cost. Thischapter will review the tasks that utilize airborne computers, and will investigate the computer types and organizations that bestfulfil the requirements, together with the various peripheral devices which are commonly used for the input and output of data.Computers are often required to control and integrate data obtained from a variety of disparate sources and sensors, many ofwhich will have their own dedicated or integral computer. The manner in which data is transmitted between these equipmentswill also be addressed.
DO NOT DISTRIBUTE AP 3456
Page 183 : Wed Jan 02 02:29:19 2002 Central Computing 3- 4- 1- 1

Airborne Computer Tasks2. Airborne computing tasks can be broadly divided into three main groups:
a. Navigation and weapon aiming.
b. Control and management.
c. Data processing.
3. Navigation and Weapon Aiming. Examples of the navigation and weapon aiming problems which are normally solved bycomputer are:
a. Control of inertial and doppler navigation systems, including Kalman filtering.
b. Co-ordinate conversion (eg Lat/Long to Grid).
c. Hyperbolic fix processing (Decca).
d. Air data processing.
e. Weapon aiming calculations.
4. Control and Management. The control and management functions that are carried out by computer include:
a. Flight control systems (eg fly-by-wire)
b. Fuel and engine monitoring and control.
c. EW equipment management.
d. In flight recording.
e. Equipment self-test routines.
f. Data transmission control and management.
5. Data Processing. Examples of data processing applications are:
a. Image processing (eg IR and television).
b. Radar data processing.
c. EW data processing.
d. Digital land mass data manipulation.
6. Presentation. Each of these applications involves the manipulation of large amounts of data so that they can be presented ina form which is usable by either the crew or other systems. Whereas many functions could be completed totally automatically, itis normally desirable that the crew should be able to make any necessary decisions and maintain some measure of control overthe computer.
Airborne Computer Types7. There are three types of computer currently being used in airborne applications:
a. Analogue.
b. Hybrid (mixed analogue and digital).
c. Digital - General Purpose and Special Purpose.
DO NOT DISTRIBUTE AP 3456
Page 184 : Wed Jan 02 02:29:19 2002 Central Computing 3- 4- 1- 1

A further type, the optical computer, is still at the development stage. The characteristics of analogue and hybrid computers willbriefly be summarized, but the remainder of this chapter will be concerned with the digital computer.
8. Analogue Computers. Analogue computers accept and process data as continually varying quantities, represented byphysical parameters, eg voltage or shaft angle. In the early days of digital computers, analogue machines had the advantages ofavoiding the sampling errors associated with digital techniques, and of being inherently 'real time' machines. However theanalogue computer is inflexible in its applications, and does not have the ability to store large quantities of data. Thedevelopment of digital computers has been such that their sampling errors are now generally much lower than those generatedby the mechanical tolerances in the analogue computer. In addition, modern digital systems are now able to operate at speedswhich make them essentially 'real time'. Although there are still many analogue machines in service (eg GPI 4), it is unlikelythat future military aircraft will use analogue computing systems to any significant degree.
9. Hybrid Computers. Hybrid computers use a mixture of analogue and digital techniques. They were originally used toovercome the slow speed of digital machines where real time operation was required, while still retaining memory, accuracy,reliability, and programming flexibility. In addition to suffering to some extent from the drawbacks of analogue machines, theyalso require analogue/digital and digital/analogue conversion devices. Hybrid computers are still sometimes used in inertialnavigation systems, but they have largely been supplanted by digital computers.
10. Digital Computers. Digital computers are in widespread use for airborne applications and are likely to remain the prevalentcomputer type for the foreseeable future. There are two general types; the general purpose computer which can be adapted for avariety of uses by suitable programming, and the special purpose computer which is designed by the manufacturer to perform aspecific task. The characteristics of the special purpose type are optimized for the task in hand and it therefore tends to be moreefficient, however this advantage must be weighed against additional cost and sometimes increased difficulty of maintenance.
The Airborne Environment11. Ground based computers usually operate in clean air-conditioned surroundings with little chance of mechanical damage,whereas the airborne environment is essentially hostile to electronic equipment which may be subjected to large temperaturechanges, vibration, and acceleration forces. Thus high standards of hardware ruggedness are necessary. It is clearlyadvantageous for the computer to have low size, weight, and power requirements, but although large scale integrated circuitryhas been beneficial in these respects, the dense packing of components has increased the problems of heat dissipation.
Precision12. The precision to which a digital computer can work is a function of wordlength and the required wordlength will bedetermined by the quality of the various sensor inputs, and the requirements of the systems that the computer is required to drive.Whereas an 18-bit word is sufficient for most navigation, weapon aiming, control, and management functions, other systems(such as imaging tasks) require greater precision, and the current trend is away from 18 or 24 bit words to 32 or 64 bit words.
Computer Organization13. The decision as to which computer arrangement is appropriate in any aircraft will depend on the scale of the computing taskand the number of systems to be controlled or integrated, and on whether real time operation is required. There are essentiallyfour options:
a. Single processing.
b. Dual processing.
c. Multiprocessing.
d. Distributed processing
14. Single Processing. In a single processing arrangement all tasks are performed in a single computer. This organization wasfavoured when computers were first installed into aircraft and were very bulky items, but although such systems are still to befound (eg Jaguar), they are unlikely to be used in new installations. The arrangement has very poor real time performance, andvery low integrity as there is no redundancy or reversionary capability; failure of the single processor results in the loss of allcomputing capability.
15. Dual Processing. In a dual processing organization two digital computers work independently, sharing the workload. It ispossible for this arrangement to provide better integrity than the single system if essential programs and data are stored in both
DO NOT DISTRIBUTE AP 3456
Page 185 : Wed Jan 02 02:29:19 2002 Central Computing 3- 4- 1- 1
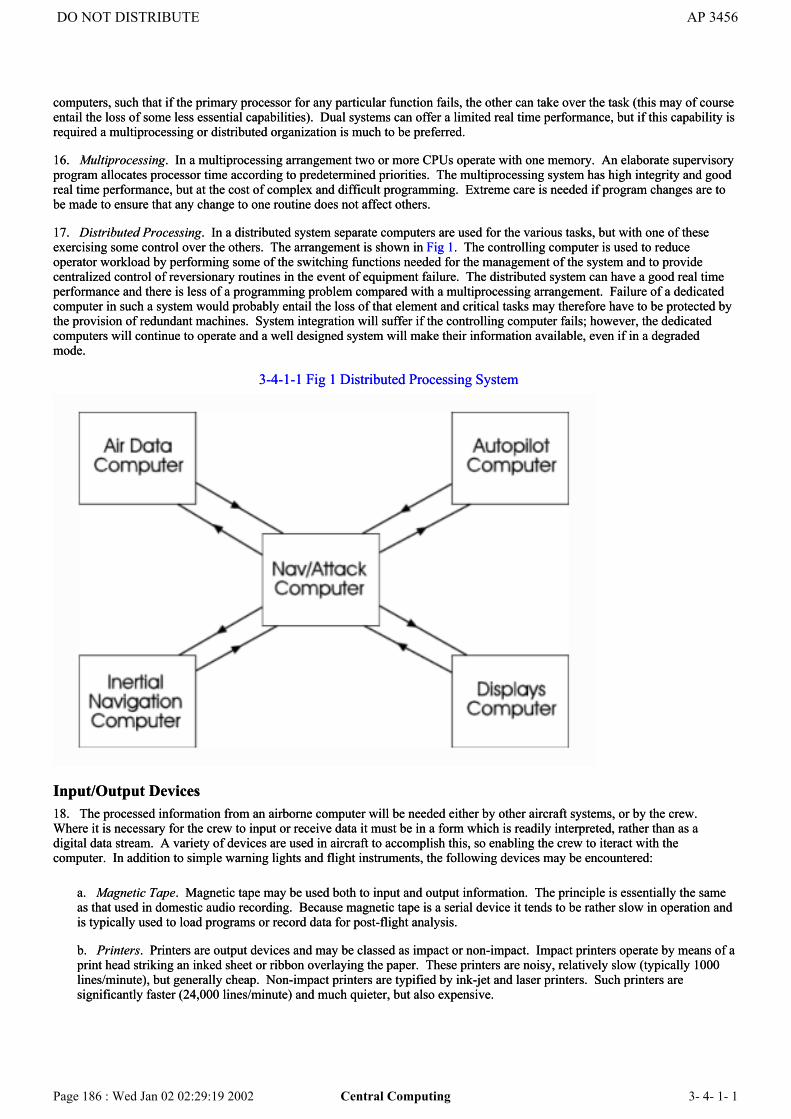
computers, such that if the primary processor for any particular function fails, the other can take over the task (this may of courseentail the loss of some less essential capabilities). Dual systems can offer a limited real time performance, but if this capability isrequired a multiprocessing or distributed organization is much to be preferred.
16. Multiprocessing. In a multiprocessing arrangement two or more CPUs operate with one memory. An elaborate supervisoryprogram allocates processor time according to predetermined priorities. The multiprocessing system has high integrity and goodreal time performance, but at the cost of complex and difficult programming. Extreme care is needed if program changes are tobe made to ensure that any change to one routine does not affect others.
17. Distributed Processing. In a distributed system separate computers are used for the various tasks, but with one of theseexercising some control over the others. The arrangement is shown in Fig 1. The controlling computer is used to reduceoperator workload by performing some of the switching functions needed for the management of the system and to providecentralized control of reversionary routines in the event of equipment failure. The distributed system can have a good real timeperformance and there is less of a programming problem compared with a multiprocessing arrangement. Failure of a dedicatedcomputer in such a system would probably entail the loss of that element and critical tasks may therefore have to be protected bythe provision of redundant machines. System integration will suffer if the controlling computer fails; however, the dedicatedcomputers will continue to operate and a well designed system will make their information available, even if in a degradedmode.
3-4-1-1 Fig 1 Distributed Processing System
Input/Output Devices18. The processed information from an airborne computer will be needed either by other aircraft systems, or by the crew.Where it is necessary for the crew to input or receive data it must be in a form which is readily interpreted, rather than as adigital data stream. A variety of devices are used in aircraft to accomplish this, so enabling the crew to iteract with thecomputer. In addition to simple warning lights and flight instruments, the following devices may be encountered:
a. Magnetic Tape. Magnetic tape may be used both to input and output information. The principle is essentially the sameas that used in domestic audio recording. Because magnetic tape is a serial device it tends to be rather slow in operation andis typically used to load programs or record data for post-flight analysis.
b. Printers. Printers are output devices and may be classed as impact or non-impact. Impact printers operate by means of aprint head striking an inked sheet or ribbon overlaying the paper. These printers are noisy, relatively slow (typically 1000lines/minute), but generally cheap. Non-impact printers are typified by ink-jet and laser printers. Such printers aresignificantly faster (24,000 lines/minute) and much quieter, but also expensive.
DO NOT DISTRIBUTE AP 3456
Page 186 : Wed Jan 02 02:29:19 2002 Central Computing 3- 4- 1- 1

c. Visual Display Unit (VDU) and Keyboard. A VDU is a high quality cathode ray tube with either a full colour ortwo-tone screen. With suitable software it can display both alphanumerics and diagrams, and data can easily be edited. TheVDU is normally associated with a keyboard to enable manual entry of data by the crew. This may be either a standardQWERTY type as found on a typewriter, or a special type designed to fulfil a specific function. In some systems there is a'soft' keyboard in which the function of a key is dictated by the computer software according to the mode of operation, andis displayed on the VDU adjacent to the key. Touch screens may also be used and these are generally faster and moreaccurate than keyboards.
d. Direct Voice Input (DVI). In a DVI system the computer is programmed to recognize a limited vocabulary of commandand data words having first been taught the operator's speech characteristics. The system is inherently faster than keyboardentry, but is still in the development stage.
e. Manual Input Devices. A variety of hand controllers (joysticks and roller balls), and switches may be used to input data.Hand controllers are typically used to move cursors on a radar, moving map display, or HUD.
DATA TRANSMISSION
Introduction19. Once a digital computer is installed in an aircraft there will be a need to transmit data between the computer and othersystems such as sensors and displays, or indeed other computers. Some analogue transmission systems have been reviewed inPart 3, Section 1 of this volume, but the trend now, where there are still analogue devices in a system, is to connect them to adigital transmission system using analogue/digital converters.
Transmission Media20. Copper Wire. Copper wire is still the commonest form of transmission medium, and may be in the form of a screenedtwisted pair, or co-axial cable. Binary signals are represented by electrical pulses. Cables of this type are easily handled, but arebulky, heavy, of limited bandwidth, and prone to corruption by electro-magnetic interference.
21. Optical Fibre. Optical fibres are in common use as transmission media. They consist of lengths of glass fibre, usually cladin plastic, and along which binary signals are transmitted in the form of pulses of light. The light sources are either lightemitting diodes (LEDs), or injection laser diodes (ILDs), and operate in the near infra-red region of the spectrum. Photodiodesat the receiving end of the cable convert the light signals back into electrical signals. Because optical fibres use light waves totransmit signals they do not suffer from electrical interference caused by high voltages, radio frequencies, magnetic fields,lightning, or electro-magnetic pulse. Similarly they are themselves non-radiating and therefore do not interfere with otherelectronic equipment, have inherent security, and are safer to use in a potentially explosive environment. The bandwidth of themedium far exceeds that of copper wire; LED sources can operate at bandwidths up to 100 MHz, and ILDs at up to a few GHz.In summary, compared to copper wire, optical fibres can transmit greater amounts of data, over longer distances, are imperviousto electro-magnetic interference, and are physically much smaller, lighter, and less cumbersome.
Channel Configurations22. A channel is the connection needed to transmit a word, and the number of wires required will depend on the form in whichdata is to be transmitted. There are four options:
a. Bit Serial Word Serial (BSWS). In this form both the words in the data stream, and the constituent bits of a data word,are transmitted serially.
b. Bit Serial Word Parallel (BSWP). In this form the words within the data stream are transmitted in parallel, but the bitswithin a word are transmitted serially.
c. Bit Parallel Word Serial (BPWS). In this form the bits within a data word are transmitted in parallel, but the words inthe stream are transmitted serially.
d. Bit Parallel Word Parallel (BPWP). In this form both blocks of words and their constituent bits are transmitted inparallel.
Serial transmission requires fewer wires and is relatively cheap and light, but slow. Parallel transmission is more expensive,complex, and heavier, but faster.
DO NOT DISTRIBUTE AP 3456
Page 187 : Wed Jan 02 02:29:20 2002 Central Computing 3- 4- 1- 1

Transmission Control23. In most systems, data is transmitted as a stream of data words, preceded by a command word which includes such details asthe number of words in the ensuing stream, and the destination address. The data word will often have some bits designed forthe detection, and possibly correction, of corruption in the data.
24. The transmission of data streams must be controlled to ensure that the appropriate information reaches the correctdestination. There are two types of control, synchronous and asynchronous:
a. Synchronous. Under synchronous control, peripherals will be accessed in a strict sequence under some form of centralcontrol, normally based on a clock. Each peripheral is connected for the length of time necessary to pass the maximumnumber of permitted data words regardless of how much information is actually transmitted. Therefore, although such asystem is relatively simple to design and construct, it tends to be slow, inflexible, and inefficient.
b. Asynchronous. In an asynchronous system, when a peripheral has information to transmit it tells the processor whicharranges a connection, and maintains it until the message has been passed. On completion, the connection is broken,allowing another peripheral to use the line. An asynchronous system is more complex than a synchronous one, but is fasterand more efficient. Asynchronous control is becoming more widely used as experience and technology improves.
25. Time Division Multiplexing. Time division multiplexing is an example of synchronous control which provides a means ofreducing the amount of hardware required by sharing transmission channels. The concept is illustrated in Fig 2 where T1, T2,etc are transmitters and R1, R2, etc are receivers. There is a single shared link which switches between each pair of transmittersand receivers under the control of a clock.
3-4-1-1 Fig 2 Time Division Multiplexing
26. Data Highways. Data highways are asynchronous arrangements whereby all devices are connected to a common databusbar and the flow of data is controlled by a highway (or bus) controller on a 'handshaking' basis. The controller will beinformed that a peripheral wishes to transmit and the appropriate receiver will be commanded to receive. The command will beacknowledged and the data transmitted.
27. Mil Std 1553 (NATO STANAG 3838) Data Bus. The Mil Std 1553 data bus was introduced in 1973 by the US Departmentof Defense as a standard format for aircraft data buses and all new US aircraft were to employ the system. The system isorganized such that up to 30 remote terminals can be connected to a common data highway. A remote terminal can beembedded in a particular avionic component, or can stand alone and service up to five avionic systems. The bus controller canallow any remote terminal to communicate with any other. A significant advantage of the system is that the avionic system canbe expanded or modified without the costly and time consuming exercise of changing the aircraft wiring. A change ofequipment involves connections to, or disconnections from, the bus, and modification to the bus controller software. The buscontroller is the the most important, complex, and costly part of the system and its major function is to ensure that information isrouted correctly between remote terminals. In addition it monitors the status of remote terminals and if, for example, one sourceof information failed, the bus controller would automatically arrange for systems requiring that information to receive it from asecondary source if available. The primary disadvantages of the system are its complexity and slow speed. Also, bus controllersand remote terminals represent a significant part of the system cost and it would not be cost effective for an aircraft with only afew digital avionic equipments. The transmission medium is a twisted pair of copper wires which limits the bandwidth to to 1MHz and suffers from the other disadvantages of electrical transmission; future developments will probably involve optical fibretransmission.
DO NOT DISTRIBUTE AP 3456
Page 188 : Wed Jan 02 02:29:20 2002 Central Computing 3- 4- 1- 1

Central ComputingChapter 2 - Real Time Programs
Introduction1. A real time system is a combination of computer hardware and software which has the ability to process data sufficientlyquickly that it can keep pace with events and influence or control responses with minimal time lag. In the case of airbornesystems the acceptable time lag will be in the order of milliseconds.
2. A system's ability to operate in real time depends principally on the amount of CPU time available and, as was suggested inChap 1, the multiprocessing or distributed processing arrangements are the most suitable. The multiprocessor allocates tasks to aCPU on the basis of priorities which leads to a very flexible but complicated system, but which nevertheless is probably the mostsuitable when tasks occur at random times. The distributed arrangement allocates specific tasks to dedicated computers. Thisavoids the need for a complex supervisory program, but requires careful initial design and accurate forecasting of systemworkload. Communication between machines may cause delays especially if dissimilar computers are used as different wordlengths and input/output characteristics dictate the need for complicated interface units.
Iteration Rates3. An airborne computer will usually have several different programs to run. Each program will take a certain amount of timeand must be repeated at certain intervals. The number of times each program is repeated in 1 second is termed the iteration rateand is expressed in Hertz (Hz), thus, for example, an iteration rate of 10 Hz means that the program must be completed every100 ms. The iteration rate will be determined by consideration of the maximum error in a variable that can be permitted and themaximum rate at which the variable can change. For example, it may be that a certain aircraft navigation system cannot toleratean error in pitch of greater than 1 if it is to meet the specified accuracy. If the maximum pitch rate of the aircraft is 20° theiteration rate must be at least 20 Hz and in practice a higher rate would be chosen to give a safety margin, provided thatsufficient CPU time is available. Some typical iteration rates for various airborne computing tasks are shown in Table 1.
Table 1 - Typical Iteration RatesSystem Iteration Rate
Air Data Computer 20 HzAutopilot (stability) 100 HZ(control) 50 HzHead-up Display 50 HzWeapon Aiming 50 HzRoutine Navigation 10 Hz
Priority and Interrupt System4. In order to achieve the required real time performance with a digital computer the tasks will be grouped into a number ofpriority levels with the most important tasks (generally those with the highest iteration rates) having the highest priority. Aseries of interrupt pulses generated by a real time clock will be used. Interrupt signals from a peripheral, such as a navigator'scontrol unit, may also be used. For convenience of organization the iteration rates of programs on the same level may bechanged to ensure that they are multiples or submultiples of each other. As an example, it may be necessary to run threeprograms, A, B, and C at the same level, with program A requiring a rate of 5 Hz, B a rate of 7 Hz, and C a rate of 9 Hz. In thissituation it would be more convenient to run A at 5 Hz as needed, but to increase the iteration rates of both B and C to 10 Hz.Iteration rates would not normally be reduced as this would in most cases entail either a lower safety margin or decreasedaccuracy.
5. The timing, initialization, control, and scheduling of work is accomplished by a supervisory program, which also handlesthe input and output of data and the servicing of interrupts. The heart of the supervisory program is the main scheduler routinewhich determines the order in which processing is done, and allocates resources to the various programs.
6. The sequence of events is as follows:
a. After each instruction is complete a check will be made on the contents of an interrupt status word (ISW) in a specialregister. If a particular bit is set to 0 this indicates that an interrupt has not been generated and the computer will go on to
DO NOT DISTRIBUTE AP 3456
Page 189 : Wed Jan 02 02:29:20 2002 Central Computing 3- 4- 1- 2

the next instruction. If however a 1 is present an interrupt has been generated.
b. If a 1 is present the rest of the ISW will be examined to determine the priority level of the interrupt.
c. If the interrupt is of lower priority than the program currently being run the interrupt will be ignored. If it is of a higherpriority the contents of various registers, such as the accumulator, will be stored, and the location of the first instruction ofthe new program will be loaded into the program counter.
d. The new program will then be run until it is complete or is in its turn interrupted by a still higher level program.
e. When a program is complete, and there are no further programs to be run at that level, the last instruction will cause theregisters to be loaded with the values pertinent to the next most important program which will then be run until it iscomplete or interrupted.
7. As an example, consider a computer being used in a nav/attack system, having the following 4 program priority levels:
a. Level 1 is the highest priority level and is used only for switch on, switch off, and fault conditions.
b. Level 2 is used for programs requiring an iteration rate of 50 Hz, such as an Inertial Navigation Schuler loop, or weaponaiming calculations. An interrupt signal is generated every 20 ms to ensure that a rate of 50 Hz is achieved.
c. Level 3 services routine navigation equations and the generation of display information. The iteration rate required is 10Hz and so interrupts are generated every 100 ms.
d. Level 4 is used for self-test routines and programs are run only when time is available in the CPU after the tasks at thehigher levels have been completed.
8. The nav/attack system may be operated in several modes and in this example it will be assumed that the computer isoperating in the routine navigation mode in which Level 2 programs require 5 ms per iteration and Level 3 programs require 50ms per iteration. The allocation of computer time and the associated hardware interrupt signals is illustrated in Fig 1 anddescribed below:
a. At t = 0 the CPU begins the Level 2 program.
b. At point A (t = 5 ms) the Level 2 program is complete and the last instruction causes an automatic reversion to the nextlowest priority level - Level 3.
c. At point B (t = 20 ms) a hardware interrupt signal is generated which demands that the Level 2 program is servicedagain. Before the computer leaves Level 3 the address of the current instruction and intermediate data results areautomatically stored in protected memory locations. Only 15 ms of the 50 ms needed by the Level 3 program has beenmade available at this stage.
3-4-1-2 Fig 1 Priority System
DO NOT DISTRIBUTE AP 3456
Page 190 : Wed Jan 02 02:29:20 2002 Central Computing 3- 4- 1- 2

d. The sequence now repeats with the Level 2 program being serviced every 20 ms to maintain the 50 Hz iteration rate.The time available between Level 2 iterations is spent at Level 3 where the stored data and instruction addresses are used toensure continuity.
e. At point C (t = 70 ms) the Level 3 program has been completed and time is available for Level 4 programs. Programrunning will now alternate between Levels 2 and 4.
f. At point D (t = 100 ms) interrupt signals are received for Levels 2 and 3. Level 3 must be serviced again to achieve therequired 10 Hz iteration rate, but the Level 2 has priority and the Level 3 interrupt is stored until the Level 2 program iscomplete (point E), when the Level 3 program can be commenced. The whole cycle is then repeated.
9. The time spent at various levels will vary with the mode of operation. Suppose that the operator carries out an attack using aweapon aiming mode which requires 5 ms of calculation at Level 2. The total time required at Level 2 is now 10 ms. In every100 ms period the time required by Levels 2 and 3 is now 100 ms (5 x 10 ms at Level 2 and 1 x 50 ms at Level 3). Thus no timeis available to service the self-test programs at Level 4 and these must be dropped for the duration of the attack.
10. It may be necessary to adjust the Level 3 tasks at some stages of flight. Suppose the weapon aiming mode selected requires7 ms of time at Level 2 giving a total of 12 ms per iteration. In every 100 ms period the Level 2 program now requires 60 ms (5x 12 ms) leaving only 40 ms available at Level 3. As Level 3 requires 50 ms in every 100 ms to achieve a 10 Hz iteration ratesome adjustment must be made, either by accepting a lower iteration rate for the Level 3 programs, or by reducing the Level 3tasks, ie during the period of the attack some less important facility or information will be lost. In most cases this will bepossible without significantly degrading the overall system performance.
DisplaysChapter 1 - CRT Displays
Introduction1. The principles of operation of a cathode ray tube (CRT) are covered in detail in Volume 9. For convenience, this chapterwill review the basic operation before describing the manner in which the CRT can be used for airborne displays.
CRT Operating Principle2. Fig 1 is a simplified diagram showing the components of a CRT which are contained in an evacuated tube with a phosphorcoating deposited on the inside of one glass end. At the other end of the tube an electron gun produces a beam of electrons
DO NOT DISTRIBUTE AP 3456
Page 191 : Wed Jan 02 02:29:20 2002 Displays 3- 4- 2- 1

which are accelerated along the tube by an extra-high tension (EHT) voltage, until they strike the phosphor at very high velocity.The phosphor glows at a specific frequency or frequency range (colour), and for a specific length of time when struck by thehigh velocity electrons. The electron beam can be focused or deflected, to move the spot of light around the screen, and itsintensity can be altered to control brightness in order to form an image.
3. The brightness, deflection, and focusing of the spot may be achieved by magnetic or electrostatic techniques or by acombination of methods. For any given application a compromise has to be made between desirable attributes. In most airborneapplications a short tube length is desirable so that the device can be more easily accommodated. However, to achieve this it isnecessary to provide a higher deflection power, and to accept a lower resolution, as well as a greater difference between theresolution at the centre and edges of the display. Extra brightness, which may be needed in a cockpit, also carries the penalty oflower resolution, and a slower writing speed.
3-4-2-1 Fig 1 Simplified Construction of a Cathode Ray Tube
Image Quality4. The total image in a CRT display is built up by the rapid movement of the spot of light traced by the electron beam, and theeye's integration of the image. There are two methods by which a total image is produced; the raster scan technique which is thatused in domestic television, and the cursive technique which is that used in, for example, oscilloscopes. Each of thesetechniques will be described in more detail later. The size of the spot is normally fixed by the focusing and will be dictated by anumber of design factors; however, the resolution of the final image can never be finer than the spot size. The persistence of thespot is a measure of its decay time and is defined by the length of time it takes for the brightness to fall to 10% of its peakbrightness following the electron beam's cessation or movement. The persistence of the phosphor is utilized together with theeye's persistence of vision to build up a complete image from what is in reality a moving spot and the correct choice ofpersistence is therefore very important. A phosphor's persistence is described as shown in Table 1. The colour of the spot isdetermined by the choice of phosphor and some examples are shown in Table 2.
Raster Scan5. In a raster scan system the spot is moved over the whole area of the screen in a regular pattern, normally a series of parallelhorizontal lines. The image is built up by varying the brightness of the spot in synchronization with the raster. The wholeprocess is repeated at the refresh rate to give an apparently continuous and dynamic image, and the effect is enhanced by thechoice of a phosphor with an appropriate persistence. A commonly used variation, known as interlacing, involves producingtwo or more images in rapid succession by interleaving the horizontal lines of the scan. The effect is to reduce the true refreshrate without flicker becoming apparent. Each separate picture is known as a field and the total picture, ie the sum of theindividual fields, is called a frame.
Table 1 - Standard Nomenclature for Phosphor PersistenceTime to rise to 90% of steadystate brightness or time todecay to 10% of final
Persistence (Worddescription ofluminance rise time or
DO NOT DISTRIBUTE AP 3456
Page 192 : Wed Jan 02 02:29:21 2002 Displays 3- 4- 2- 1

brightness decay)± 1 sec Very long100 ms − 1 sec Long1 ms − 100 ms Medium10 µ s −1 ms Medium short1 µ s − 10 µ s Short< 1 µ s Very short6. The vertical resolution of a raster scan system is set by the number of lines used. Thus for example, in a domestic televisionwith 625 lines, of which 585 are used for imaging, the smallest theoretically resolvable detail is equal to the line width which is1/585 of the picture height. In practice this figure is degraded by other factors.
Table 2 - Characteristics of Typical PhosphorsEmission Colour
Phosphor Fluorescene(Initial Glow)
Phosphorescence(After Glow)
Persistence Applications andRemarks
P1 Yellow-green Yellow-green Medium Oscillographs RadarsHUDs
P4 White White Medium toMedium-short
Monochrome TVs
P12 Orange Orange Long RadarsP34 Blue-green Yellow-green Very Long Visual Info storageP43 Green Green Medium Rare Earth Phosphor
used for HUDs7. The horizontal resolution is set by the video bandwidth and the line frequency. In a UK television system this gives justover 700 resolvable elements horizontally.
8. The way in which a raster scan forms an image is shown in Fig 2. Fig 2a shows the display which consists of a black and awhite letter 'T' on a grey background. For simplicity the scan has only 12 lines of which 10 are used for imaging, and there is nointerlacing. Fig 2b shows the line timebase which has a sawtooth form and represents the 'x' deflection of the spot. The 'x' valueincreases within each line causing the spot to move across the screen. At the end of each line the spot returns to the left handend (minimum 'x') as represented by the vertical part of the waveform. During this 'flyback' the brightness of the spot isnormally reduced to zero. Fig 2c shows the 'y' deflection of the spot as it moves down the screen. It will be seen that there is 'y'movement coincident with 'x' movement thus accounting for the slope of the lines evident in Fig 2a. When the spot reaches theend of any line the accrued 'y' movement ensures that after the flyback the spot is at the start of the next line down. After a timeequivalent to scanning the ten lines, the spot returns to the top of the display. This frame flyback coincides with the timeoccupied by the non-imaging lines 11 and 12. Finally, Fig 2d shows the variation of the video signal, ie the variation inbrightness of the spot from black through grey to white with time. It will be seen that during the period of line 1 the video signalshows grey throughout. During line 2 the video starts at grey, moves to black to begin forming the top of the black letter 'T',back to grey to form the space between the letters, then to white to start to form the white letter 'T', and finally back to grey at theend of the letter. Similar variations can be detected within the other lines. In addition to the image forming waveforms therewill be additional pulses, not shown in Fig 2, to ensure correct synchronization of the time bases.
3-4-2-1 Fig 2 Formation of Raster Scan Image
DO NOT DISTRIBUTE AP 3456
Page 193 : Wed Jan 02 02:29:21 2002 Displays 3- 4- 2- 1

Cursive Writing9. Although the term cursive writing may be used to describe any non-raster imaging technique, it is used here to describe theway in which the electron beam is used to draw line symbology, in a similar way to a pencil drawing on paper. Because of thelimited persistence of the phosphors any line has to be re-drawn at regular intervals (the refresh rate). The spot position is set by'x' and 'y' signals and the intensity by a 'z' signal, which in most applications is either on or off. Because only the specific symbolrequired is drawn, the display can be much brighter than with a raster scan, in which all of the screen must be covered withineach refresh period. The disadvantages of the cursive technique are that three signals are required to produce the image, and it isin practice impossible to produce realistic dynamic images with shades of grey. The production of symbology can often besimplified by storing specific images such as lines and circles in computer memory and recalling and positioning them asrequired. The way in which a cursive system can be made to form a letter 'R' by simultaneously varying the 'x', 'y' and 'z'parameters is shown in Fig 3.
3-4-2-1 Fig 3 Example of Production of a Simple Cursive Image
DO NOT DISTRIBUTE AP 3456
Page 194 : Wed Jan 02 02:29:21 2002 Displays 3- 4- 2- 1

Colour Displays10. Although a monochromatic display is quite suitable for many airborne applications, there are some uses for which amulti-colour display would be desirable or necessary. There are three practical colour tubes available, the shadowmask CRT,the beam index CRT and the penetration CRT.
11. The shadowmask tube (in which a mask behind the screen carries the colour apertures through which 3 electron beams mustbe aimed to build up a chromatic image) is the type used in most domestic television receivers. Although it has airborneapplications it is sensitive to vibration, and susceptible to stray magnetic fields, providing a relatively low contrast display forthe cockpit environment.
12. The beam index CRT is a bright, high contrast display capable of being viewed in direct sunlight. Because there is noshadowmask as in the conventional colour CRT, there is less loss of energy in the electron beam, and vibration causes fewerdifficulties. Fig 4 shows the beam-index tube principle, in which strips of coloured phosphor are arranged in columns on thescreen. As the electron beam scans across the face, it illuminates the red, green and blue phosphor as required. There is onlyone electron gun in the beam index CRT, which therefore writes at three times the rate, and hence three times the bandwidth, ofthe conventional tube. The highly accurate synchronization needed by a fast-scanning high bandwidth electron beam is achievedby using ultra-violet radiation feedback from metal backed index strips in the face of the screen.
3-4-2-1 Fig 4 The Beam-Index Tube Principle
DO NOT DISTRIBUTE AP 3456
Page 195 : Wed Jan 02 02:29:21 2002 Displays 3- 4- 2- 1

13. The penetration CRT has several layers of transparent phosphor deposited on the faceplate, each of which glows with adifferent colour. By varying the EHT, the penetration of the electron beam into the phosphor layers can be varied, and hence thecolour can be controlled. A simplified diagram showing the construction of a penetration tube is at Fig 5, while Fig 6 showshow the colour varies with changes in voltage for a typical screen. The tube is much brighter and more robust than theshadowmask tube, but currently the available colours are limited, and the tube lacks the ability to display subtle variations oftone. It is therefore more suitable for the presentation of symbology, eg flight instrument displays, than for the portrayal of realworld images.
3-4-2-1 Fig 5 Penetration CRT Principle
DO NOT DISTRIBUTE AP 3456
Page 196 : Wed Jan 02 02:29:22 2002 Displays 3- 4- 2- 1
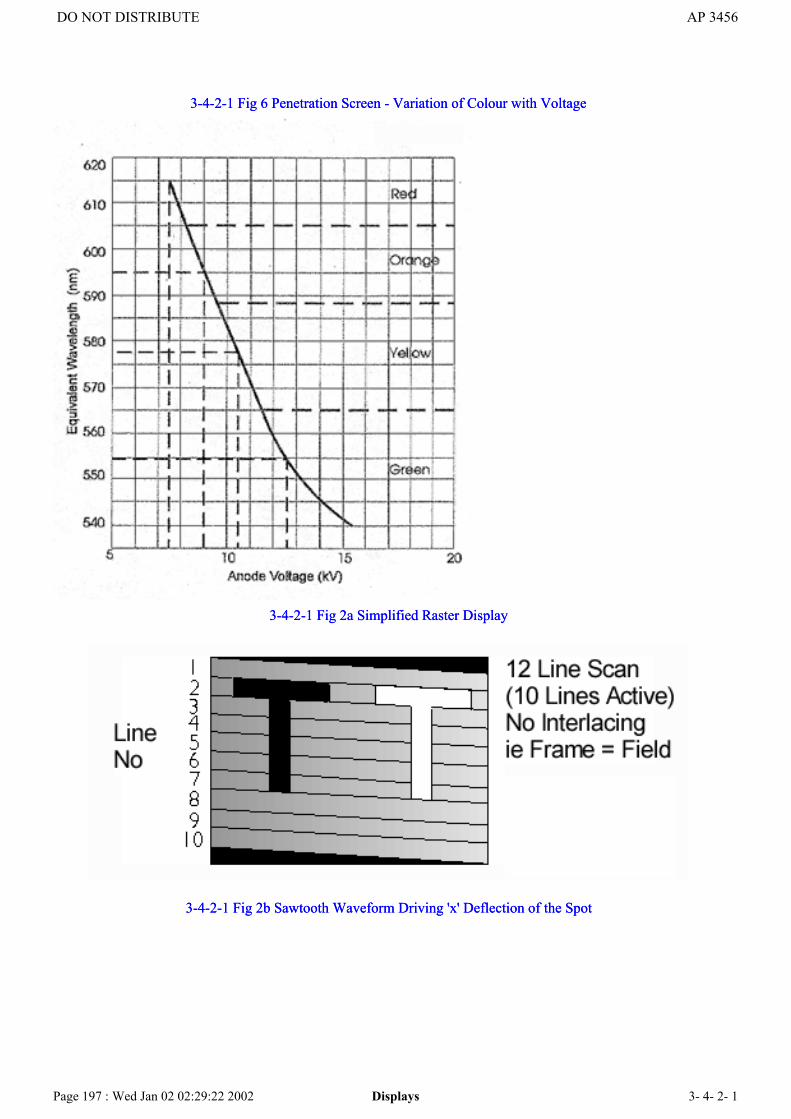
3-4-2-1 Fig 6 Penetration Screen - Variation of Colour with Voltage
3-4-2-1 Fig 2a Simplified Raster Display
3-4-2-1 Fig 2b Sawtooth Waveform Driving 'x' Deflection of the Spot
3-4-2-1 Fig 6 Penetration Screen - Variation of Colour with Voltage
3-4-2-1 Fig 2a Simplified Raster Display
3-4-2-1 Fig 2b Sawtooth Waveform Driving 'x' Deflection of the Spot
DO NOT DISTRIBUTE AP 3456
Page 197 : Wed Jan 02 02:29:22 2002 Displays 3- 4- 2- 1
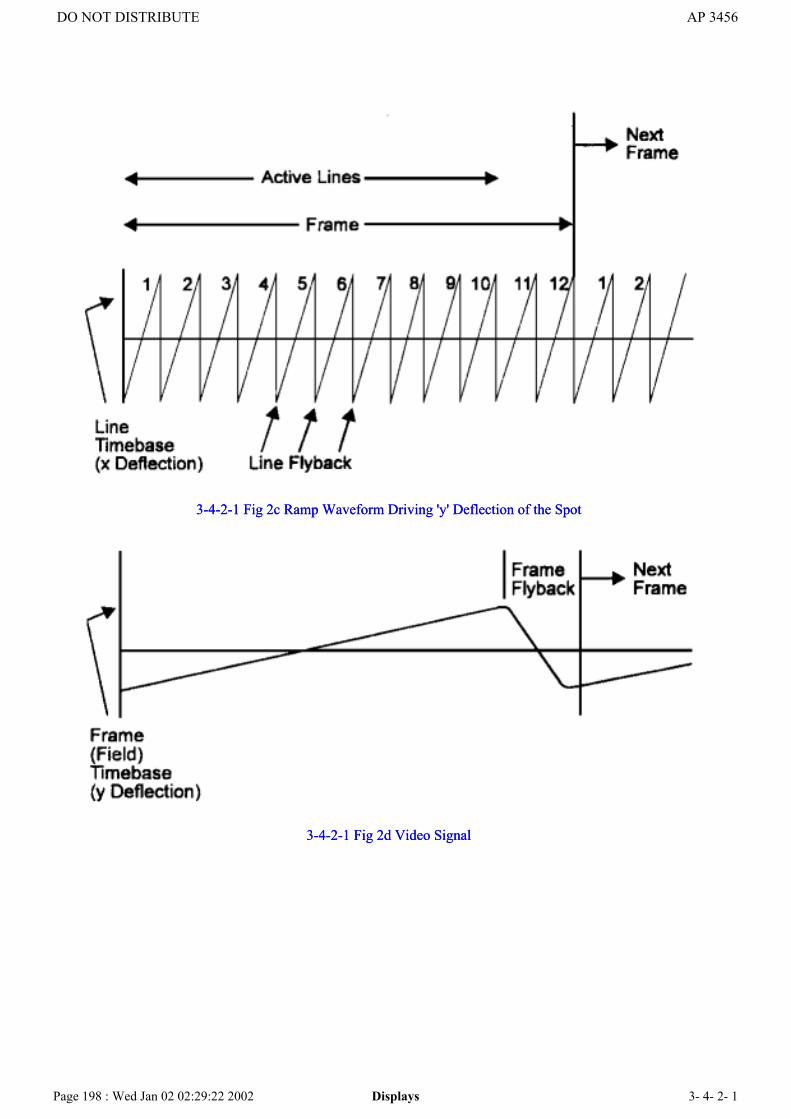
3-4-2-1 Fig 2c Ramp Waveform Driving 'y' Deflection of the Spot
3-4-2-1 Fig 2d Video Signal
3-4-2-1 Fig 2c Ramp Waveform Driving 'y' Deflection of the Spot
3-4-2-1 Fig 2d Video Signal
DO NOT DISTRIBUTE AP 3456
Page 198 : Wed Jan 02 02:29:22 2002 Displays 3- 4- 2- 1
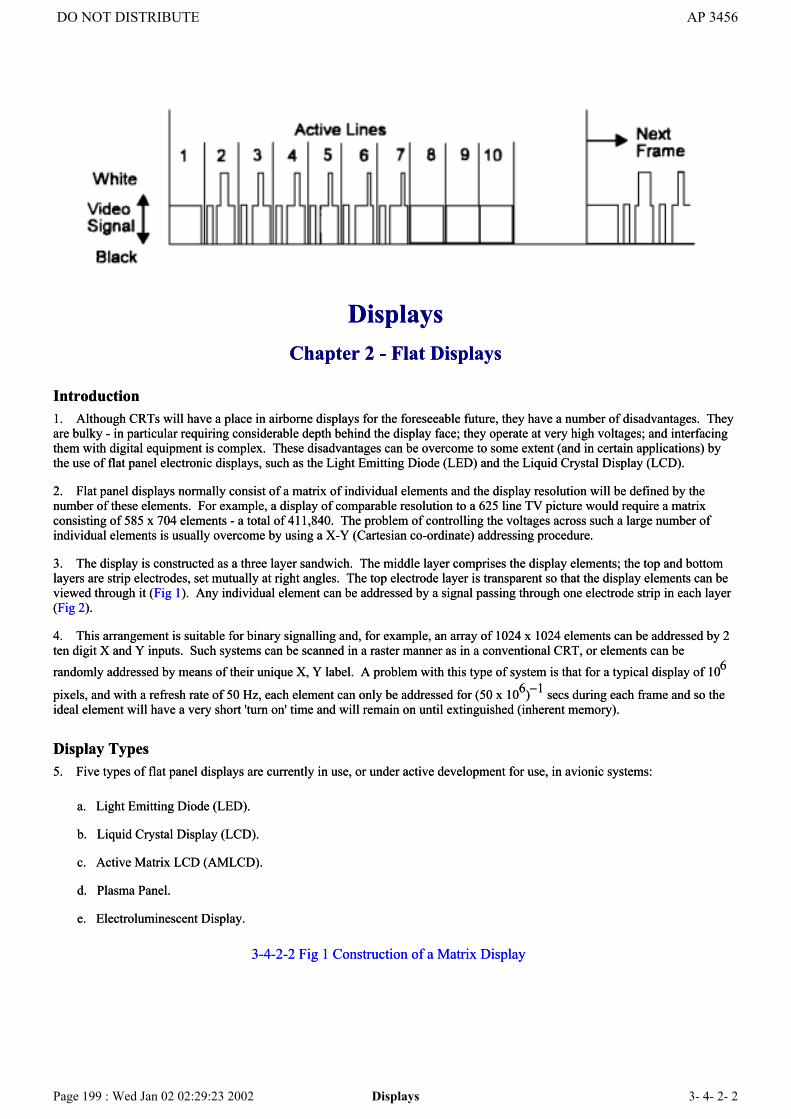
DisplaysChapter 2 - Flat Displays
Introduction1. Although CRTs will have a place in airborne displays for the foreseeable future, they have a number of disadvantages. Theyare bulky - in particular requiring considerable depth behind the display face; they operate at very high voltages; and interfacingthem with digital equipment is complex. These disadvantages can be overcome to some extent (and in certain applications) bythe use of flat panel electronic displays, such as the Light Emitting Diode (LED) and the Liquid Crystal Display (LCD).
2. Flat panel displays normally consist of a matrix of individual elements and the display resolution will be defined by thenumber of these elements. For example, a display of comparable resolution to a 625 line TV picture would require a matrixconsisting of 585 x 704 elements - a total of 411,840. The problem of controlling the voltages across such a large number ofindividual elements is usually overcome by using a X-Y (Cartesian co-ordinate) addressing procedure.
3. The display is constructed as a three layer sandwich. The middle layer comprises the display elements; the top and bottomlayers are strip electrodes, set mutually at right angles. The top electrode layer is transparent so that the display elements can beviewed through it (Fig 1). Any individual element can be addressed by a signal passing through one electrode strip in each layer(Fig 2).
4. This arrangement is suitable for binary signalling and, for example, an array of 1024 x 1024 elements can be addressed by 2ten digit X and Y inputs. Such systems can be scanned in a raster manner as in a conventional CRT, or elements can berandomly addressed by means of their unique X, Y label. A problem with this type of system is that for a typical display of 106
pixels, and with a refresh rate of 50 Hz, each element can only be addressed for (50 x 106)−1 secs during each frame and so theideal element will have a very short 'turn on' time and will remain on until extinguished (inherent memory).
Display Types5. Five types of flat panel displays are currently in use, or under active development for use, in avionic systems:
a. Light Emitting Diode (LED).
b. Liquid Crystal Display (LCD).
c. Active Matrix LCD (AMLCD).
d. Plasma Panel.
e. Electroluminescent Display.
3-4-2-2 Fig 1 Construction of a Matrix Display
DO NOT DISTRIBUTE AP 3456
Page 199 : Wed Jan 02 02:29:23 2002 Displays 3- 4- 2- 2

3-4-2-2 Fig 2 Matrix Addressing
Light Emitting Diode (LED)6. A light emitting diode is a semiconductive junction which emits light when a current is passed through it. Fig 3 shows theconstruction of a typical LED, in which a shallow p-n junction is formed. While electrical contact is made to both regions, theupper surface of the p material is largely uncovered so that the flow of radiation from the device is impeded as little as possible.The primary materials used are gallium arsenide, gallium phosphide, and gallium arsenide phosphide. Red, yellow and greenLEDs are currently available and the development of a blue LED continues, but at present is uneconomical and inefficient.
DO NOT DISTRIBUTE AP 3456
Page 200 : Wed Jan 02 02:29:23 2002 Displays 3- 4- 2- 2

LEDs are most suitable for 'on-off' displays rather than in applications requiring a grey scale. LEDs have no inherent storageand displays must be refreshed at a rate fast enough to avoid flicker.
3-4-2-2 Fig 3 Construction of Typical LED
Liquid Crystal Display (LCD)7. Liquid crystal displays are unlike other flat displays in that they are not light emitters but rely on an external light source fortheir operation.
8. Liquid crystal is an organic compound which, while having the physical characteristics of a liquid, has a molecular structureakin to a crystalline solid. There are three classes of liquid crystal which vary in their molecular structure and, although all threehave been used in LCDs, the structure known as nematic is by far the most common. In this structure the elongated, rod shaped,molecules are aligned parallel to each other but not in regular layers (Fig 4).
9. In the display cell, the inner surfaces of the top and bottom glass or perspex walls are grooved, with the top grooves alignedat 90° to the bottom grooves. The grooves induce a corresponding alignment of the molecules so that their alignment within theliquid crystal twists through 90° (the twisted nematic structure). The top and bottom of the display cell is covered by linearpolarizing plates such that the plane of polarization of one plate is at 90° to the other.
3-4-2-2 Fig 4 Nematic Molecular Structure
DO NOT DISTRIBUTE AP 3456
Page 201 : Wed Jan 02 02:29:23 2002 Displays 3- 4- 2- 2
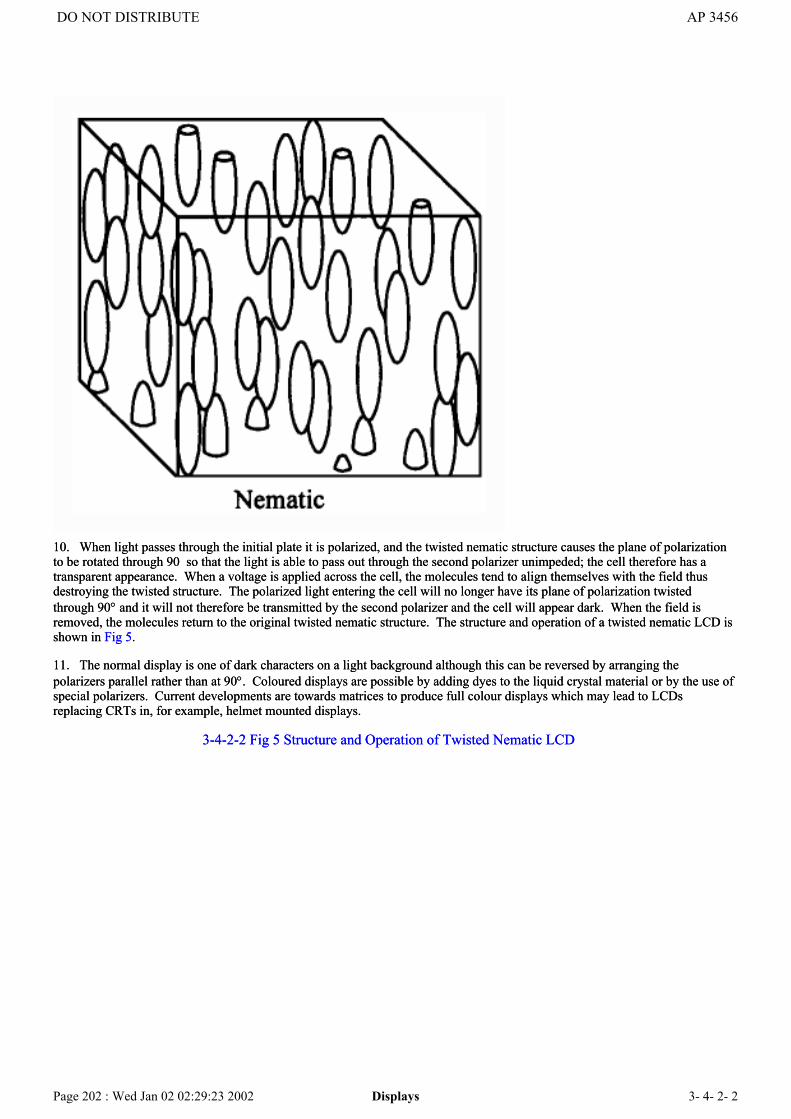
10. When light passes through the initial plate it is polarized, and the twisted nematic structure causes the plane of polarizationto be rotated through 90 so that the light is able to pass out through the second polarizer unimpeded; the cell therefore has atransparent appearance. When a voltage is applied across the cell, the molecules tend to align themselves with the field thusdestroying the twisted structure. The polarized light entering the cell will no longer have its plane of polarization twistedthrough 90° and it will not therefore be transmitted by the second polarizer and the cell will appear dark. When the field isremoved, the molecules return to the original twisted nematic structure. The structure and operation of a twisted nematic LCD isshown in Fig 5.
11. The normal display is one of dark characters on a light background although this can be reversed by arranging thepolarizers parallel rather than at 90°. Coloured displays are possible by adding dyes to the liquid crystal material or by the use ofspecial polarizers. Current developments are towards matrices to produce full colour displays which may lead to LCDsreplacing CRTs in, for example, helmet mounted displays.
3-4-2-2 Fig 5 Structure and Operation of Twisted Nematic LCD
DO NOT DISTRIBUTE AP 3456
Page 202 : Wed Jan 02 02:29:23 2002 Displays 3- 4- 2- 2

Active Matrix LCD (AMLCD)12. In an AMLCD the voltage applied on each element is actively controlled by a transistor, as shown in Fig 6a, ensuring thatthe liquid crystal receives the correct voltage during the address time, and is isolated from stray voltages when it is switchedoff.
13. Fig 6b shows a cross-section of an AMLCD. In this case rows and columns of the matrix are disposed on the samesubstrate, the upper substrate carrying the earth electrode. An element (or pixel) is addressed by applying the video voltagecorresponding to the signal to be displayed on the column, and a voltage to energize the element on the appropriate row. Theelement is then turned off while the other rows of the display are successively addressed.
14. A grey effect can be obtained by modulating the amplitude of the input video voltage. The display needs to be refreshedperiodically due to leakage currents.
3-4-2-2 Fig 6a AMLCD Element
DO NOT DISTRIBUTE AP 3456
Page 203 : Wed Jan 02 02:29:23 2002 Displays 3- 4- 2- 2

3-4-2-2 Fig 6b Representative Cross Section of AMLCD Display
Plasma Panels15. Plasma (or gas discharge) displays use an electrical discharge in a gas to produce light; both DC and AC systems areavailable.
16. A DC display consists essentially of a gas filled space between two electrodes (Fig 7a). When the DC potential across theelectrodes exceeds a certain value, typically 180V, but which depends on the gas type, pressure and the electrode gap and type,the gas molecules ionize and emit light. The DC technique has no inherent memory and therefore requires constant refreshing.
17. An AC display has a similar basic concept, but the electrodes are insulated; the structure is illustrated in Fig 7b. A voltageis applied to all the row electrodes and its antiphase to all column electrodes. The field generated across the gas is insufficient tostrike a discharge and in order to light a particular pixel the AC voltages on the appropriate row and column are increased forone half cycle. This causes a capacitive current to flow and build up a charge at the insulating layers. Subsequent cycles are at
DO NOT DISTRIBUTE AP 3456
Page 204 : Wed Jan 02 02:29:24 2002 Displays 3- 4- 2- 2

the normal AC voltage but this is sufficient to maintain the discharge previously created. To switch off the pixel, row andcolumn voltage must be selectively lowered. AC types of plasma displays have inherent memory for each element.
18. Plasma displays are not generally suitable for producing grey scales and are primarily available in neon orange colour foruse in on-off displays.
Electroluminescent Displays19. Electroluminescent displays consist of a layer of phosphor, sandwiched between two electrodes, which glows when anelectrical field is applied across it. Displays may be either AC or DC driven and the structure of each type is somewhatdifferent.
3-4-2-2 Fig 7a DC Plasma Display
3-4-2-2 Fig 7b AC Plasma Display
DO NOT DISTRIBUTE AP 3456
Page 205 : Wed Jan 02 02:29:24 2002 Displays 3- 4- 2- 2

20. Fig 8a shows the structure of an AC device in which phosphor particles are suspended within a transparent insulatingmedium (thick film technique) and sandwiched between two electrodes one of which is transparent. As an alternative thephosphor can be deposited, normally by evaporation, as a thin layer onto a dielectric base (thin film technique). The phosphorparticles emit light when an AC voltage is applied.
21. Fig 8b shows the construction of a DC device. The phosphor particles have a coating of either Cu2S or CU3S (generallytermed CUxS) which is removed from the the anode side of the particles in contact with the anode by the application of an initialhigh current pulse. Light is emitted from the CuxS depleted particles when a normal DC voltage is applied.
22. A full video capability has been demonstrated for electroluminescent devices and the technique has potential as areplacement for CRTs in helmet mounted displays. All colours are available dependent on the phosphor selected and a fullcolour display is therefore considered feasible. However, the production status of such devices is some way in the future andcurrently electroluminescent devices are used for instrument panel lighting, as formation lights, and for signs in passengercompartments.
3-4-2-2 Fig 8a Structure of Thick Film AC Electroluminescent Device
DO NOT DISTRIBUTE AP 3456
Page 206 : Wed Jan 02 02:29:24 2002 Displays 3- 4- 2- 2
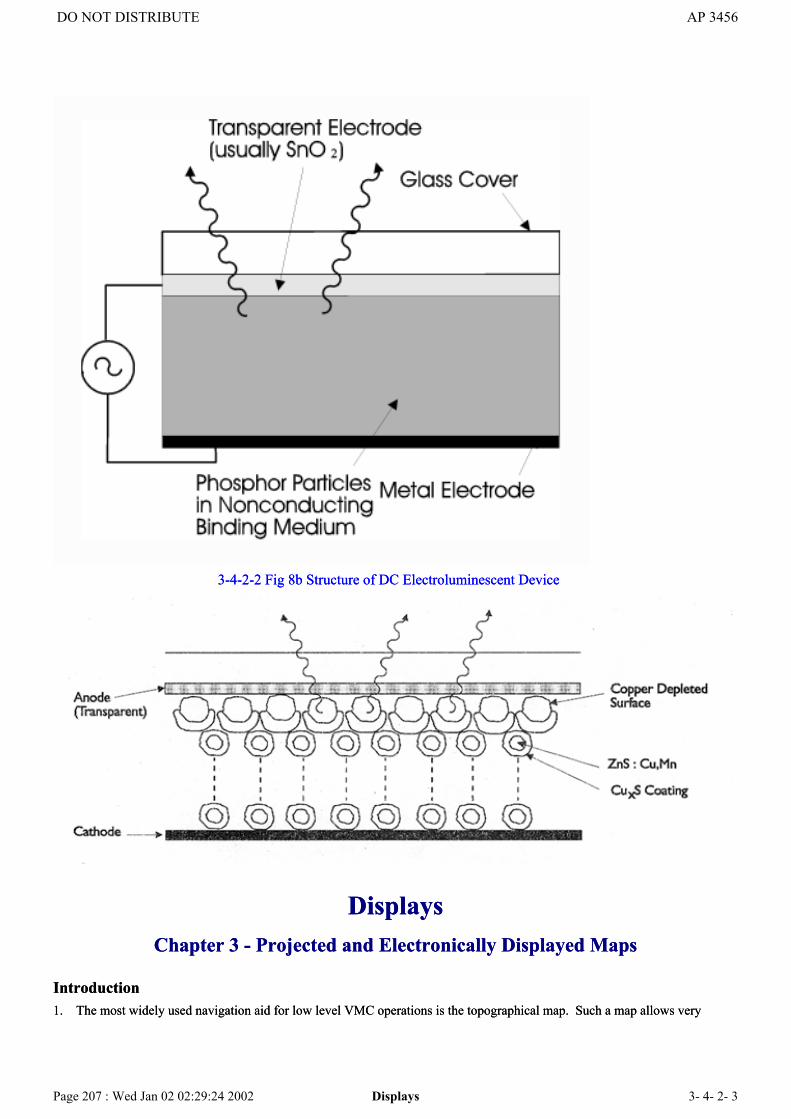
3-4-2-2 Fig 8b Structure of DC Electroluminescent Device
DisplaysChapter 3 - Projected and Electronically Displayed Maps
Introduction1. The most widely used navigation aid for low level VMC operations is the topographical map. Such a map allows very
3-4-2-2 Fig 8b Structure of DC Electroluminescent Device
DisplaysChapter 3 - Projected and Electronically Displayed Maps
Introduction1. The most widely used navigation aid for low level VMC operations is the topographical map. Such a map allows very
DO NOT DISTRIBUTE AP 3456
Page 207 : Wed Jan 02 02:29:24 2002 Displays 3- 4- 2- 3

accurate pinpoints to be obtained, and also presents information about the aircraft's position in relation to its surroundings in arelatively easily assimilated way. However, the use (in small aircraft cockpits) of conventional maps covering large areaspresents handling problems; moving and electronic map systems have been devised to overcome these difficulties.
2. Early systems used strips of paper maps wound on rollers with an overlying cursor to indicate position; the rollers andcursor were driven by outputs from a doppler or radio navigation aid. The majority of current systems use maps projected froma film strip, and tend to be driven by an inertial or other automatic navigation system. However, progress is being made in therealm of electronically produced maps, and these may become more prevalent in the future.
Projected Moving Maps3. The most usual technique for displaying a moving map in low-level, high speed, aircraft is the projected map display (PMD)driven by an inertial or mixed inertial navigation system. The map is reproduced onto 35mm film and back-projected usingconventional optics to give a bright image on a translucent screen.
4. The screen is designed to concentrate the image luminance within a limited field of view, matched to the observer's eye, inorder to increase the resistance to strong ambient light. A typical system is illustrated in Fig 1, where it will be seen that thescreen has three layers. The first (inner) layer is a Fresnel lens which converts the light cone from the projection lens into a lightcylinder in the plane of the operator's eye datum. The image is formed on the second layer which is designed to minimize hotspots towards the centre, and image degradation towards the circumference. The third, outer, layer is a polarizing filter whicheliminates reflections from both inside and outside the PMD which might otherwise obscure the image.
3-4-2-3 Fig 1 Schematic of Projected Map Display (PMD)
5. In a typical PMD, the map is photographed in segments onto 35mm film, and a coverage of up to 4 million square miles at ascale of 1:500,000 can be reproduced on a 20 metre strip. In practice some area coverage will usually be sacrificed in order tohave a selection of map scales available, and there may also be check lists and terminal charts included. In normal operation thechange over from one frame to the next is automatic and is usually accomplished in under three seconds. The life of the filmstrip tends to be limited by the currency of the map rather than by fading, or wear and tear.
6. The accuracy of a PMD is governed by the accuracy of the driving navigation system, and by manufacturing tolerances inthe electro-mechanical projection system. Errors due to map scale and convergency limitations are reduced to relativelyinsignificant levels by automatically applying a correction to the map drive system, or by applying a correcting distortion duringthe photographic process. Typical values for the overall accuracy of the system are ¼ nm on a 1:500,000 map and 50 metres ona 1:50,000 map.
7. Fig 2 shows a simplified diagram of the internal construction of an example PMD, in which scale change is accomplished byincreasing magnification rather than by changing the map. The fairly complex electro-mechanical system is one of thedrawbacks of current PMDs, and although reasonable levels of reliability have been achieved, the use of many moving partsleads to mechanical wear and failure. It is this aspect which is largely driving the development of purely electronic
DO NOT DISTRIBUTE AP 3456
Page 208 : Wed Jan 02 02:29:25 2002 Displays 3- 4- 2- 3

alternatives.
3-4-2-3 Fig 2 Simplified Diagram of PMD Construction
8. The other disadvantage of the technique is that the film strip is not produced at squadron or station level and cannot beeasily amended to reflect late changes, or to incorporate up-to-date tactical information.
Combined Displays9. The PMD overcomes the problem of handling paper maps in a small cockpit. However, the equipment uses considerablecockpit space for just a single function, and the current trend is to combine the moving map with the display from otherelectronic systems, principally radar. Two techniques are used:
a. Ported CRT. The ported CRT is a conventional CRT with a transparent window in the envelope through which the filmimage can be optically back-projected on to the phosphor surface. The phosphor must be selected so that it can be used bothas a back-projection screen and for writing the electron beam. Since the electron gun and the projector cannot both be onthe optical axis of the system, one of the images must be distorted to allow them both to be correctly harmonized forsimultaneous viewing. A simplified diagram of a ported CRT system is illustrated in Fig 3.
3-4-2-3 Fig 3 Combined CRT and Projected Display Using a Ported CRT
DO NOT DISTRIBUTE AP 3456
Page 209 : Wed Jan 02 02:29:25 2002 Displays 3- 4- 2- 3

b. Optically Combined Display. The optically combined display combines the optical and electronic images usingconventional optics and semi-reflecting surfaces. This technique overcomes the distortion problem and makes the phosphorindependent of the projection system. The arrangement of an optically combined display is shown in Fig 4.
3-4-2-3 Fig 4 Arrangement of an Optically Combined Display
DO NOT DISTRIBUTE AP 3456
Page 210 : Wed Jan 02 02:29:25 2002 Displays 3- 4- 2- 3

10. Both techniques are capable of over-writing the topographical map with cursive symbology thus allowing routes, dangerareas, and tactical information to be added or amended.
Electronically Displayed Maps11. Combined display systems overcome some of the problems of keeping the map up to date, but the problems inherent in anelectro-mechanical device remain. A preferred solution is to replace the projected map by an electronically derived version inone of two forms:
a. Digitized (or raster) Maps. Most of the displayed maps are digitized versions of the familiar paper originals. Anelectronic scanner is used to scan the paper map in a raster fashion either as a complete entity or as separate overlays. Forexample, the air information, including airfields, restricted airspace and obstructions, can be scanned separately from thebase topographical map, to facilitate more efficient updating. Digitized maps, which are also referred to as "raster" maps,have the advantage that the source data in the form of paper maps is already available at the scales and coverage required.Disadvantages include the fact that a digitized map is expensive in terms of digital storage requirements and also thatcomplex algorithms are required to process and reduce the data for display on small CRTs while still retaining the requireddetail.
b. Digital (or vector) Maps. Digital maps are those that contain separate feature types as data sets in a digital data base.Features such as coastlines, contours, railways, roads, woodland etc are constructed in vector format and combined on thedisplay to provide a usable map. Digital (or vector) maps are more efficient in terms of data storage requirements and theyoffer great flexibility in what is displayed on the screen - unwanted data sets can be de-cluttered from the display asrequired. The major disadvantage of the digital map concept is that, currently, only limited data base production has takenplace. Examples of existing digital map products are the familiar coastline maps already used in many applications and anew Digital Chart of the World (DCW) product developed by the US Defence Mapping Agency ( this is a world-widedigital version of the 1:1M scale ONC Series of charts). Another major existing vector series is the 8-nation Digital LandMass Simulation (DLMS) product. This combines Digital Terrain Elevation Data (DTED) with Digital Feature AnalysisData (DFAD). DTED is used in combination with digitized or digital topographical maps to provide relief information onelectronic displays. Intervisibility techniques allow for line of sight information and radar shadow areas to be displayed in adynamic fashion as an aircraft moves across the map.
12. Both types of maps allow superimposition of latitude/longitude grids and other mission data. Mission data can be producedin a ground-based facility and transferred to the aircraft at initialization or inserted manually by the aircrew at any stagethroughout the mission.
13. Various data storage techniques have been investigated. These include holographic, magnetic, bubble, optical disc andrandom access memory (RAM). Both optical disc and RAM have been used in UK airborne applications for data storage. Eachcan now provide sufficient data storage for a fast jet ground attack mission and can be manufactured with adequate ruggednessto survive the harsh airborne environment.
DisplaysChapter 4 - Head-Up and Helmet Mounted Displays
Introduction1. Normal cockpit displays entail the pilot dividing his time between observing the outside world and reading the instruments.Thus the pilot’s eyes have frequently to switch between reading instruments situated at no more than a few feet away, andsurveying the outside world, which is effectively at infinity. This requires not only a change of focus, but also an adjustment tolight conditions which are often considerably different. It is a far more satisfactory arrangement if the instruments are read underthe same conditions of focus and illumination as the outside world; this can be achieved by the use of head-up or helmetmounted displays.
THE COLLIMATED HEAD-UP DISPLAY
Principle2. The collimated head-up display (HUD) is a development of the gyro gunsight and is used to project an instrument display at
DO NOT DISTRIBUTE AP 3456
Page 211 : Wed Jan 02 02:29:25 2002 Displays 3- 4- 2- 4

the pilot’s eye level. The symbols are produced in a waveform generator, displayed on a CRT, and reflected on a glass screen infront of the pilot. The symbols may be driven by a variety of aircraft sensors (eg IN, ADC, Radar, LRMTS) to provide aircraftattitude, altitude, and velocity, together with navigation and weapon aiming information. A control unit is provided to allow thepilot to select the appropriate symbols for any particular stage of flight. Initially, the display brightness can be adjustedmanually by the pilot, after which it is controlled by a photocell to compensate for changes in the illumination of the outsidescene. Fig 1 shows a block diagram of a typical HUD installation.
3-4-2-4 Fig 1 Block Diagram of Typical Fighter Aircraft HUD Installation
3. The pilot’s display unit (PDU) incorporates a very bright CRT to ensure that the symbols can be viewed against a very highbackground brightness, equivalent to sunlight on cloud. The reflector, or combiner glass, is semi-transparent and reflects theCRT image while allowing the outside world to be viewed through it. The presented image is collimated, ie focused at infinity,so that the CRT symbols and the outside scene can be viewed as a composite image, without the need to change eye focus.
4. The optical system in the HUD may be either refractive (lenses and prisms) or diffractive (holographic); reflective opticshave been used, but any advantages in terms of field of view (FOV) have been outweighed by considerations of size, cost,weight, and optical efficiency.
5. In addition to symbolic displays, the use of holographic technology has the potential to allow sensor imagery to be shown,such as LLTV, FLIR, or radar.
Refractive Optics6. The use of refractive optics is still the most common technique although there are disadvantages in terms of restricted fieldof view, low optical efficiency, and bulky, heavy components.
7. Field of View. The field of view of a conventional refractive HUD is determined principally by the size of the output lens,and the distance between it and the eye (via the combiner). The reflected output lens acts as a porthole through which the virtualimage produced by the HUD is viewed (Fig 2). As an example, for a 12 cm diameter lens at an eye to lens distance of 70 cm, thesingle eye FOV will be approximately 10°. In practice the total FOV in azimuth will be extended due to the separation betweenthe pilot’s eyes, and a further increase will result from small head movements (Fig 3). Some PDUs increase the vertical FOV byusing a movable combiner glass. A servo mechanism moves the glass, thus shifting the FOV in the vertical plane and increasingthe total, but not the instantaneous, FOV (Fig 4). The major problem with a limited FOV is that of marking a target, or updatingfrom a visual pinpoint, which is at a large angle-off from the aircraft centre line. In addition, the effect of the porthole and the
DO NOT DISTRIBUTE AP 3456
Page 212 : Wed Jan 02 02:29:26 2002 Displays 3- 4- 2- 4
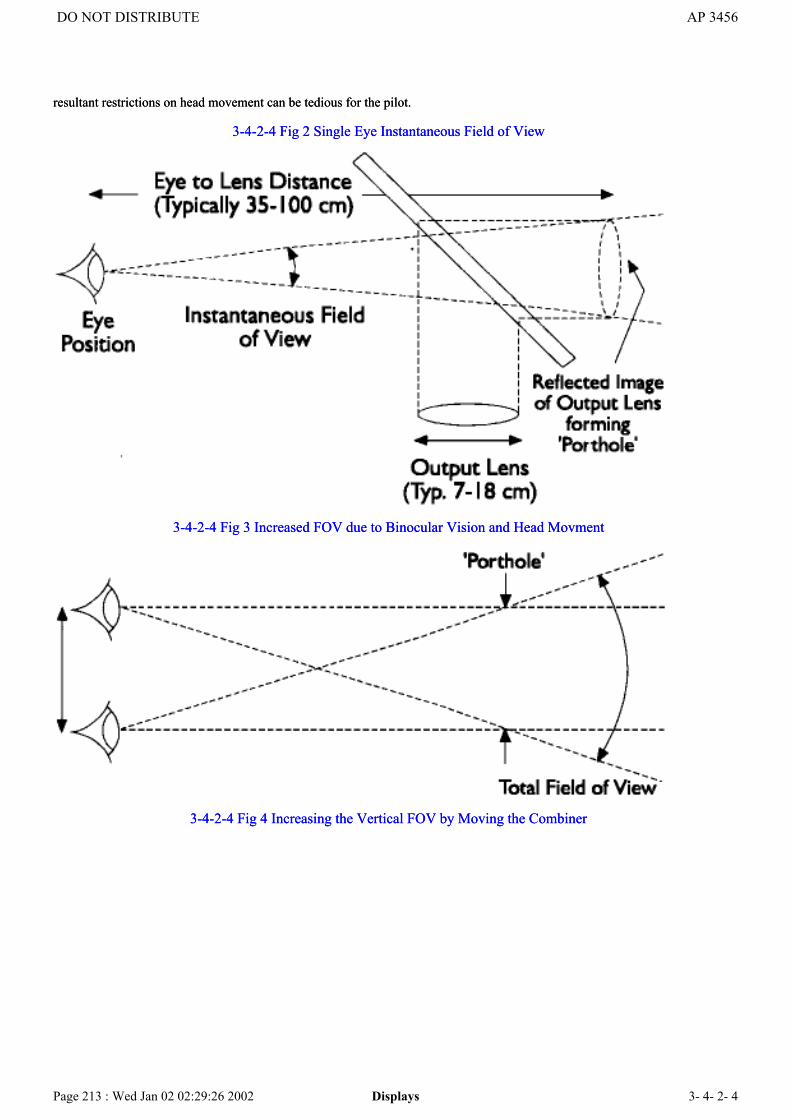
resultant restrictions on head movement can be tedious for the pilot.
3-4-2-4 Fig 2 Single Eye Instantaneous Field of View
3-4-2-4 Fig 3 Increased FOV due to Binocular Vision and Head Movment
3-4-2-4 Fig 4 Increasing the Vertical FOV by Moving the Combiner
resultant restrictions on head movement can be tedious for the pilot.
3-4-2-4 Fig 2 Single Eye Instantaneous Field of View
3-4-2-4 Fig 3 Increased FOV due to Binocular Vision and Head Movment
3-4-2-4 Fig 4 Increasing the Vertical FOV by Moving the Combiner
DO NOT DISTRIBUTE AP 3456
Page 213 : Wed Jan 02 02:29:26 2002 Displays 3- 4- 2- 4

8. Optical Efficiency. In any optical system there will be losses in light transmission. Typically only 40% of the lightproduced by the CRT will reach the pilot’s eye, and to compensate for this loss the CRT must be run at a very high output level,leading to a reduction in its life. Light entering from the outside scene may be reduced to about 70% which may cause asignificant reduction in forward visibility.
9. Size and Weight. High quality lenses and prisms are heavy and expensive items, and since the output lens and the associatedoptics must be mounted on the pilot’s side of the combiner, they tend to protrude into the cockpit. The equipment must beinstalled such that adequate clearance for ejection is maintained, while at the same time being close enough to the pilot’s eye toyield an acceptable FOV.
Diffractive Optics10. The trend in HUD construction is towards the use of diffractive optics in which a holographic element, tuned to thefrequency of the CRT light output, is used as the combiner. Compared to the refractive system, the holographic combiner has ahigher transmission efficiency, improved reflectivity, and variable geometry.
3-4-2-4 Fig 5 Example of Typical UK HUD Symbology - General Mode
DO NOT DISTRIBUTE AP 3456
Page 214 : Wed Jan 02 02:29:26 2002 Displays 3- 4- 2- 4
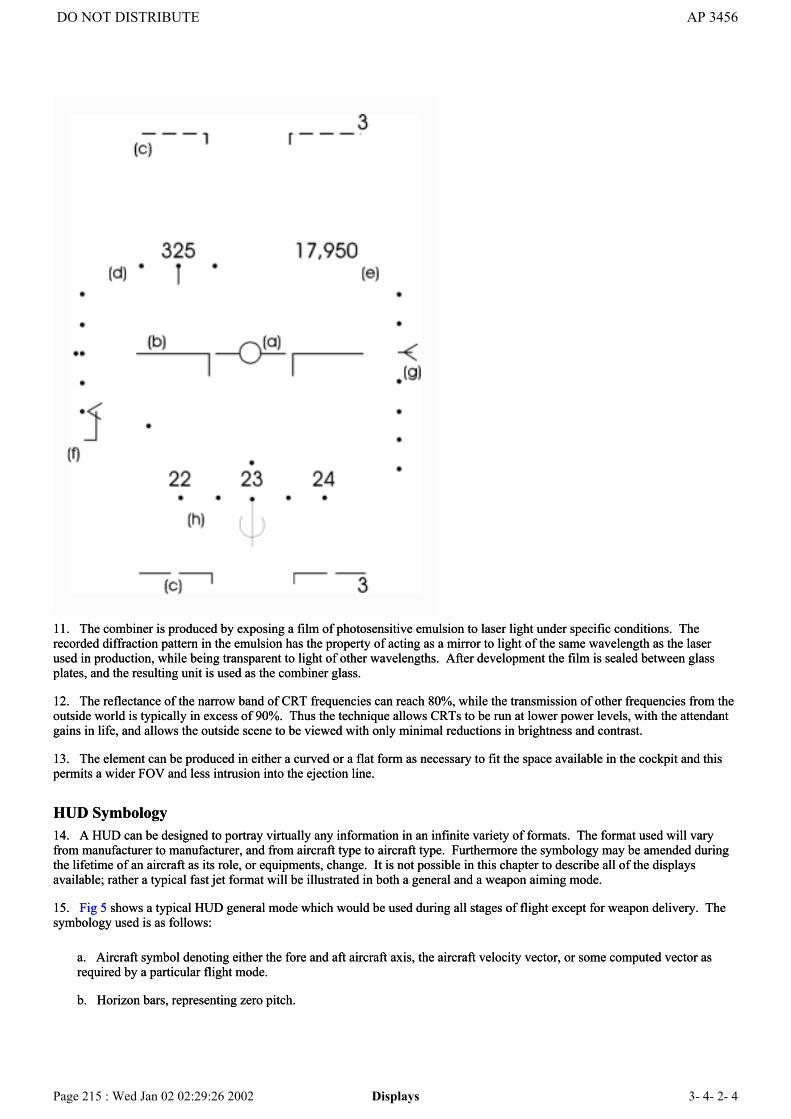
11. The combiner is produced by exposing a film of photosensitive emulsion to laser light under specific conditions. Therecorded diffraction pattern in the emulsion has the property of acting as a mirror to light of the same wavelength as the laserused in production, while being transparent to light of other wavelengths. After development the film is sealed between glassplates, and the resulting unit is used as the combiner glass.
12. The reflectance of the narrow band of CRT frequencies can reach 80%, while the transmission of other frequencies from theoutside world is typically in excess of 90%. Thus the technique allows CRTs to be run at lower power levels, with the attendantgains in life, and allows the outside scene to be viewed with only minimal reductions in brightness and contrast.
13. The element can be produced in either a curved or a flat form as necessary to fit the space available in the cockpit and thispermits a wider FOV and less intrusion into the ejection line.
HUD Symbology14. A HUD can be designed to portray virtually any information in an infinite variety of formats. The format used will varyfrom manufacturer to manufacturer, and from aircraft type to aircraft type. Furthermore the symbology may be amended duringthe lifetime of an aircraft as its role, or equipments, change. It is not possible in this chapter to describe all of the displaysavailable; rather a typical fast jet format will be illustrated in both a general and a weapon aiming mode.
15. Fig 5 shows a typical HUD general mode which would be used during all stages of flight except for weapon delivery. Thesymbology used is as follows:
a. Aircraft symbol denoting either the fore and aft aircraft axis, the aircraft velocity vector, or some computed vector asrequired by a particular flight mode.
b. Horizon bars, representing zero pitch.
DO NOT DISTRIBUTE AP 3456
Page 215 : Wed Jan 02 02:29:26 2002 Displays 3- 4- 2- 4

c. Pitch bars at 5° intervals with a 1:1 scaling.
d. Airspeed indication, either IAS or Mach No, both as a digital read-out and as a pointer movement indicating rate ofchange.
e. Height. As shown the display indicates barometric height, but alternatively radar height may be shown, in which casethe figures will be preceded by a letter ‘R’.
f. Angle of attack. The values associated with the scale will vary with aircraft type.
g. Vertical speed. The values associated with the scale will vary with aircraft type.
h. Heading (or track) scale with a superimposed steering bug (∪).
16. A HUD will have a number of different modes and sub-modes, some of which will be selected automatically dependent onthe mode of operation of the navigation and attack system, and others which may be selected manually. An example of anair-to-ground weapon aiming mode is shown in Fig 6 with the following symbology:
3-4-2-4 Fig 6 HUD in Target Tracking-Acquisition Mode
a. Target bar. The gapped target bar represents the system’s computed target position. Once the pilot can see the target,delivery accuracy can be refined by changing phase and slewing the target bar, now a solid line, to overlie the target, whereit will be stabilized by the system.
b. Time circle. The time circle unwinds anti-clockwise from 60 seconds to release (50 seconds to release illustrated).
c. Impact line. The impact line represents the track along which the weapons will fall and the pilot’s task is to fly theaircraft such that the impact line overlies the target position. The top of the line represents the minimum safe pass distance,and the gap 112 times the pass distance.
d. Continuously Computed Impact Point (CCIP). The CCIP represents the point on the ground where the weapons willimpact if released at that instant.
17. The weapon is released, normally automatically, when the target bar and CCIP coincide. Until then, the pilot must ensurethat the impact line overlies the target bar, and, for safe clearance, that the CCIP and target bar coincide before the target reachesthe top of the impact line. In some systems and modes additional symbols may be used, for example, to indicate LRMTSpointing and operation, air-to-air missile aiming, and gun aiming solutions, or to enable the navigation system to be updated byslewing the symbol to overlie a visual pinpoint.
HELMET MOUNTED DISPLAY (HMD) SYSTEMS
DO NOT DISTRIBUTE AP 3456
Page 216 : Wed Jan 02 02:29:26 2002 Displays 3- 4- 2- 4

General18. With the increasing complexity of airborne detection and display systems and the associated additional workload on thepilot, more and more designers are focusing on integrating sensor information into the flying helmet. This is aimed at removingthe disadvantage of the Head-up Display (HUD) in that the display is only available to the pilot whilst he is looking at the HUDcombiner and not when he looks away. Although not yet widespread in use, HMDS technology was first used operationally inattack helicopters where the need to meet ejection safety criteria did not exist. These HMD systems allow the pilot to benefitfrom displays of aircraft symbology superimposed, on demand, on his normal field of vision. HMD systems (often termedIntegrated Helmet Systems (IHS)) become an inherent part of the aircraft avionics and weapons systems enabling off boresightweapon aiming, target designation and pilot cueing, for example.
Displays19. To permit aircraft to operate throughout the 24 hour spectrum a HMD normally incorporates a miniature cathode ray tube(CRT) and an image intensifier tube (IIT). The display of thermal imagery (TI) or output from other electro-optical (EO) sensorsis provided to the pilot by means of the CRT. Miniature CRTs may present the forward-looking infra-red (FLIR) imagery andalso provide flight and weapon aiming information in a similar manner to a conventional HUD. Alone, the TI may be dangerousfor the 24 hour mission since the emissivity of natural materials will vary over the period. A so-called zero contrast (or washouteffect) during rainfall is sometimes observed especially during twilight or at dawn. At these times, foreground is not detectableagainst background and, for example, pylons or cables become an extreme hazard. To overcome this, the IIT and TI may becombined. A HMD may be designed to allow the pilot to switch between IIT and TI at will, select both, or switch off the flightsymbology altogether. In twilight or dawn periods it might be better to present only one sensor at any one time. The IIT workson a different principle from the TI and is better suited to adverse weather conditions during night or twilight. Thus, a true IHSwill be configured with the day and night capabilities combined as shown in Fig 7. The TI and IIT images are integrated inCombiner 2 and the resultant image is superimposed on the direct view in
3-4-2-4 Fig 7 IHS Configuration
Combiner 1. There are drawbacks, however. High brightness is required because of the complicated optical train that HMDsuse whether the image is displayed on a combiner eyepiece or on the visor. Between source and projection, the pathway canattenuate both brightness and definition - affording a resolution of some 50% of that of the human eye. Moreover, oncesymbology is projected on to the eyepiece or visor, transmissivity to the real world is affected. The dichroic coatings necessaryfor image projection and the laser protection elements reduce real world transmissivity to about 70%. Clearly, some compromise
DO NOT DISTRIBUTE AP 3456
Page 217 : Wed Jan 02 02:29:26 2002 Displays 3- 4- 2- 4
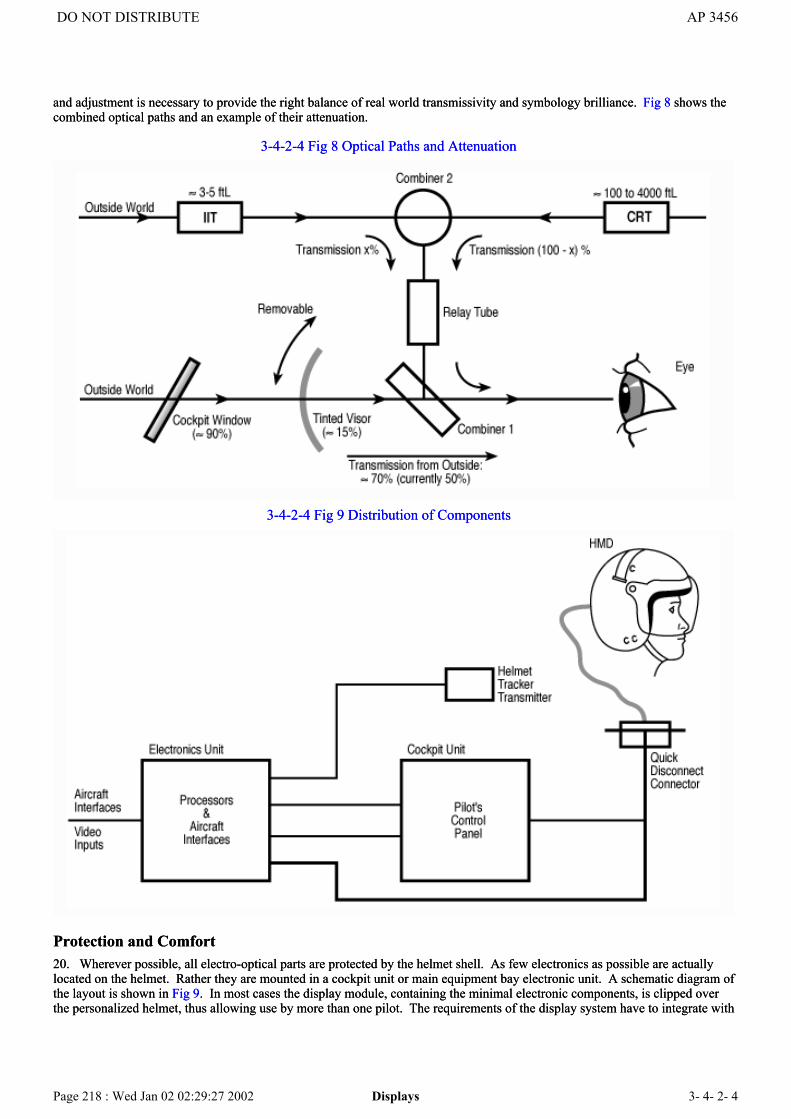
and adjustment is necessary to provide the right balance of real world transmissivity and symbology brilliance. Fig 8 shows thecombined optical paths and an example of their attenuation.
3-4-2-4 Fig 8 Optical Paths and Attenuation
3-4-2-4 Fig 9 Distribution of Components
Protection and Comfort20. Wherever possible, all electro-optical parts are protected by the helmet shell. As few electronics as possible are actuallylocated on the helmet. Rather they are mounted in a cockpit unit or main equipment bay electronic unit. A schematic diagram ofthe layout is shown in Fig 9. In most cases the display module, containing the minimal electronic components, is clipped overthe personalized helmet, thus allowing use by more than one pilot. The requirements of the display system have to integrate with
DO NOT DISTRIBUTE AP 3456
Page 218 : Wed Jan 02 02:29:27 2002 Displays 3- 4- 2- 4
the flying helmet in such a way that the fundamental properties of the flying helmet are not compromised. The aim is always toavoid an increase in weight whilst retaining helmet impact resistance. Therefore, equipment has to be positioned carefully tomaintain the optimum helmet C of G and keep the helmet moment of inertia within acceptable limits. This is essential to avoidan increase in tiredness leading to loss of concentration and for safety in conditions encountered during ejection or during forcedlandings. Optical surfaces are either made of glass or optical plastics, the latter having the advantage of lower weight. Thedesign must take into account the range of interpupillary distances and allow the eye to be positioned in the centre of the exitpupil with a correctly fitting helmet. The exit pupil is the optical ‘window’ through which the superimposed image is viewed.An exit pupil larger than 15 mm provides a very acceptable system in that if the helmet moves, the wearer does not suddenly losethe image. An increase in exit pupil necessitates an increase in weight so there has to be a sensible trade-off if comfort is to bemaintained. Whilst helmet comfort is of paramount importance, in general the fitting requirements of HMDs assume moresignificance. The helmet fit, and therefore its stability, must be such as to maintain the eye(s) within the exit pupil(s). A visor(or visors) to attenuate glare and prevent eye damage from lasers is part of the helmet.
Tracking21. A HMD will not function without a helmet tracking system to determine the pilot’s head position relative to the cockpit.Losses in the system which depend largely on processing power may result in the display lagging or jumping as the pilot moveshis head. This is reduced by increasing the image refresh rate and introducing predictive algorithms. The potential of eyepointing has yet to be determined but it could provide a more natural method of designating objects. Furthermore, the naturalstability of the eye could de-couple involuntary head motion (due to turbulence for example) from the aiming system.
Properties22. To give binocular advantage and to cover for failure, two CRTs (for the thermal or other imagery) and two IIT units areusually fitted. When respective units are being employed separately the single image is still viewed from two different sources.A binocular capability is preferred to retain depth perception although there are systems which project symbology to one eyeonly. Monocular systems are satisfactory for short term tasks or during daytime. For enduring tasks, especially at night, such asen-route navigation, a binocular device overcomes binocular rivalry problems. Brightness and contrast are adjustable - orautocontrast can be selected to counter extremes of ambient light. A diagram of a typical IHS is shown in Fig 10. Overall, theHMDS requires the following properties:
a. Parallelism of both IITs.
b. No obscuration of IIT and CRT-based images.
c. Low weight and correct CG for helmet.
d. Parallelism and stability of combiners.
e. Combiners preferably in one plane but must have high stability.
f. Exact and easy adjustment of interpupillary distance if exit pupil is restricted.
g. Large exit pupil for flexibility.
h. Optimum adjustment of combiners should not change on switching between IIT and CRT channels.
i. Field of view between 35° and 40°, although lower figures can be acceptable for specific tasks.
j. Helmet tracker system with low image lag rates.
3-4-2-4 Fig 10 A Typical IHS
DO NOT DISTRIBUTE AP 3456
Page 219 : Wed Jan 02 02:29:27 2002 Displays 3- 4- 2- 4

Autopilot and Flight Director SystemsChapter 1 - Autopilot and Flight Director Systems
Introduction1. Automatic flight control systems (AFCS) are discussed in Volume 2, Part 2, Section 2, Chapter 4. This chapter willexamine the practical applications of autopilots to show how the AFCS can be used to alleviate pilot work load and to carry outtasks which, without autopilot assistance, would impose a considerable work load upon the pilot and in some cases would beimpossible.
Autopilot Control of Aircraft Attitude2. The control of aircraft attitude is essential to the manoeuvring of the aircraft by autopilot. Long term attitude monitoring isusually provided by a displacement gyro system (see Fig 1). Aircraft attitude information is passed to a memory unit in theamplifier/processor where it is stored. When attitude hold is selected the input to the memory is disconnected so that therecorded attitude becomes a fixed datum. The attitude store output is compared with the direct attitude signal in a summingamplifier - the signal inputs are equal at the moment of engagement and the output of the amplifier is zero. If the aircraftdeviates from its set attitude the two signals are no longer equal and the summing amplifier produces an error signal. The errorsignal is passed to a demand actuator which moves the appropriate control to return the aircraft to its original attitude. Aposition feedback loop ensures that the control applied is proportional to the demand signal.
3-4-3-1 Fig 1 Attitude Hold Loop
DO NOT DISTRIBUTE AP 3456
Page 220 : Wed Jan 02 02:29:27 2002 Autopilot and Flight Director Systems 3- 4- 3- 1
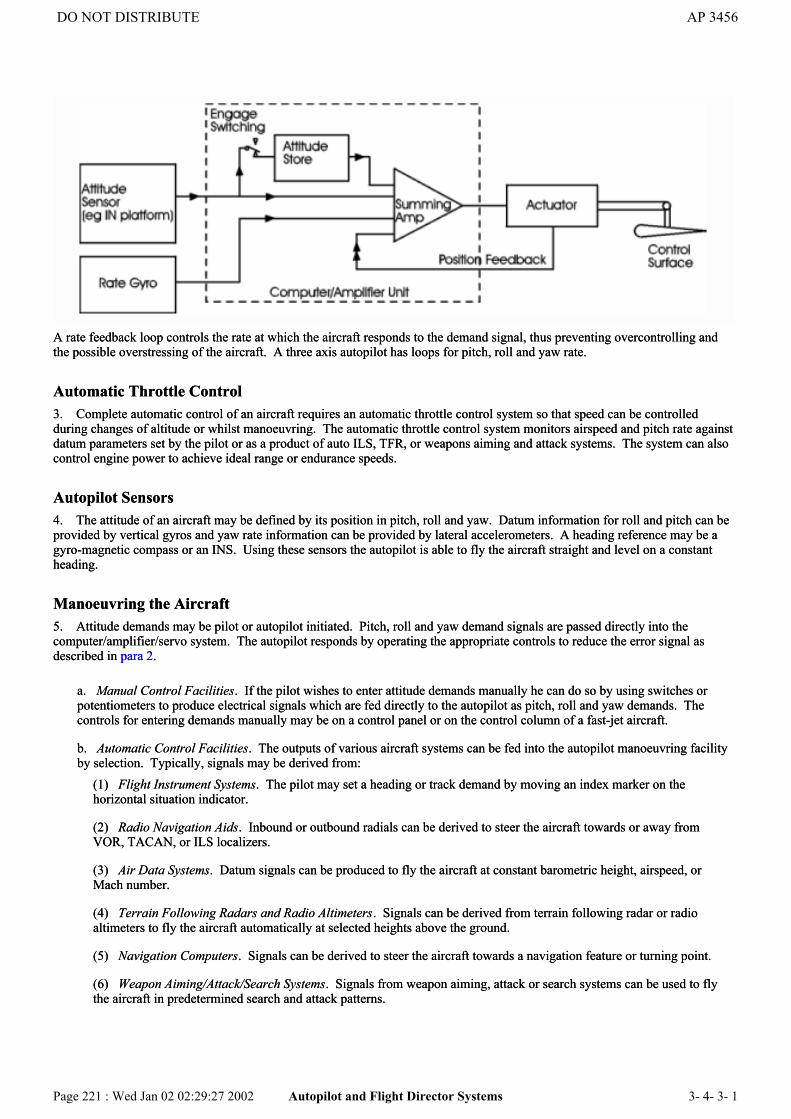
A rate feedback loop controls the rate at which the aircraft responds to the demand signal, thus preventing overcontrolling andthe possible overstressing of the aircraft. A three axis autopilot has loops for pitch, roll and yaw rate.
Automatic Throttle Control3. Complete automatic control of an aircraft requires an automatic throttle control system so that speed can be controlledduring changes of altitude or whilst manoeuvring. The automatic throttle control system monitors airspeed and pitch rate againstdatum parameters set by the pilot or as a product of auto ILS, TFR, or weapons aiming and attack systems. The system can alsocontrol engine power to achieve ideal range or endurance speeds.
Autopilot Sensors4. The attitude of an aircraft may be defined by its position in pitch, roll and yaw. Datum information for roll and pitch can beprovided by vertical gyros and yaw rate information can be provided by lateral accelerometers. A heading reference may be agyro-magnetic compass or an INS. Using these sensors the autopilot is able to fly the aircraft straight and level on a constantheading.
Manoeuvring the Aircraft5. Attitude demands may be pilot or autopilot initiated. Pitch, roll and yaw demand signals are passed directly into thecomputer/amplifier/servo system. The autopilot responds by operating the appropriate controls to reduce the error signal asdescribed in para 2.
a. Manual Control Facilities. If the pilot wishes to enter attitude demands manually he can do so by using switches orpotentiometers to produce electrical signals which are fed directly to the autopilot as pitch, roll and yaw demands. Thecontrols for entering demands manually may be on a control panel or on the control column of a fast-jet aircraft.
b. Automatic Control Facilities. The outputs of various aircraft systems can be fed into the autopilot manoeuvring facilityby selection. Typically, signals may be derived from:
(1) Flight Instrument Systems. The pilot may set a heading or track demand by moving an index marker on thehorizontal situation indicator.
(2) Radio Navigation Aids. Inbound or outbound radials can be derived to steer the aircraft towards or away fromVOR, TACAN, or ILS localizers.
(3) Air Data Systems. Datum signals can be produced to fly the aircraft at constant barometric height, airspeed, orMach number.
(4) Terrain Following Radars and Radio Altimeters. Signals can be derived from terrain following radar or radioaltimeters to fly the aircraft automatically at selected heights above the ground.
(5) Navigation Computers. Signals can be derived to steer the aircraft towards a navigation feature or turning point.
(6) Weapon Aiming/Attack/Search Systems. Signals from weapon aiming, attack or search systems can be used to flythe aircraft in predetermined search and attack patterns.
DO NOT DISTRIBUTE AP 3456
Page 221 : Wed Jan 02 02:29:27 2002 Autopilot and Flight Director Systems 3- 4- 3- 1

The ability to use these systems enables the pilot to select the appropriate inputs to the autopilot for a very wide range of flyingactivities from a relatively undemanding navigation task to very demanding low level navigation and attack mission, possibly atnight or in bad weather.
Autopilot Safety6. An autopilot must not be capable of endangering the aircraft or its crew. Autopilot safety is ensured by a variety of designfeatures and devices to ensure at least a 'fail-safe' capability. Features and devices vary greatly but typical examples are:
a. Design Features. Circuits are designed to be as simple as possible and components are used at a fraction of their ratedvalues to ensure high reliability. Additionally, switching circuits are given clearly defined priorities to avoid inadvertentselection of dangerous flight configurations and to avoid selection of incompatible flight control modes.
b. Safety Devices. The following safety devices are typical:(1) Pilot's Instinctive Cut-out. The instinctive cut-out is positioned on the control column and can be quickly and easilyoperated to disengage the autopilot giving full manual control authority to the pilot.
(2) Rate and Angle Limiters. The rate and angle limiters prevent the overstressing of the aircraft by limiting the rate ofresponse or angle achievable in any channel.
(3) Control Limit Switches. Control limit switches are microswitches which operate when a control reaches the end ofits allowable travel. These switches are able to prevent any damage from servo runaway.
(4) Excess Torque Devices. Excess torque devices are used either to prevent overstressing of the aircraft or to detectexcessive current demands such as might occur if an electrical servo was attempting to overcome a control restriction.
(5) Monitoring Facilities. Most autopilot functions are continuously monitored by a built-in test equipment systemwhich is able to generate warnings and initiate automatic reversionary modes. Commonly monitored functions are powersupplies, the accuracy of datum information on attitude and heading and the serviceability states of systems whichprovide inputs to the autopilot.
Flight Information System7. Autopilots include a flight information system which provides aircrew with an integrated presentation of:
a. Primary flight information showing attitude and heading.
b. Flight director information showing indices and markers which indicate the horizontal and vertical control required toregain a demanded flight path.
Flight information systems range from simple 2 instrument displays to fully processed electronic head-up or head-down displays.The system enables the pilot to fly the aircraft manually to meet the autopilot demands, or to check that the autopilot is followingthe demands correctly.
Engine and Miscellaneous InstrumentsChapter 1 - Engine Instruments
Introduction1. An aero-engine is an expensive item and its failure in flight could have serious safety implications. It is therefore mostimportant to have a comprehensive and accurate feedback to the crew of information relating to the performance of the engine.Indications of failures, or of excursions of engine parameters outside limits, are usually in the form of discrete displays, egwarning lights, flags, or audio signals. Routine monitoring information is usually displayed on analogue gauges - although insome modern systems these are digitally produced and shown on a CRT.
DO NOT DISTRIBUTE AP 3456
Page 222 : Wed Jan 02 02:29:27 2002 Engine and Miscellaneous Instruments 3- 4- 4- 1

Engine Spool Speed2. The most common method of measuring engine spool speed is by a tachogenerator driven from the external wheelcase.
3. A typical tachogenerator contains a three-phase stator and a two-pole permanent magnet rotor. Rotation of the magnetinduces a three-phase voltage in the stator windings, the frequency of this voltage being proportional to the engine speed. Thesignal is fed to an indicator which contains a synchronous motor, the speed of which is governed by the input frequency from thegenerator. An extension of the synchronous motor shaft carries a four-pole permanent magnet which revolves inside a copperalloy drag cup. The rotation of the permanent magnet produces eddy currents in the cup which in turn set up magnetic fields.These fields interact with the field of the permanent magnet causing a torque which turns the cup and its attached shaft. Thetorque is balanced by a hair spring and the shaft rotation is transmitted to the movement of a pointer over a dial through anappropriate gearing system. The complete arrangement is shown schematically in Fig 1. Engine speed is usually shown as apercentage of maximum rpm (Fig 2).
3-4-4-1 Fig 1 Tachometer Indicator Mechanism
3-4-4-1 Fig 2 Percentage rpm Indicator
DO NOT DISTRIBUTE AP 3456
Page 223 : Wed Jan 02 02:29:28 2002 Engine and Miscellaneous Instruments 3- 4- 4- 1

3-4-4-1 Fig 3 Variable Reluctance Speed Probe and Phonic Wheel
4. In some multi-spool engines without a gearbox driven from the LP or IP spool, a variable reluctance speed probe located onthe compressor or exhaust casing can be used with a phonic wheel machined into the spool to provide an electric current whichis proportional to spool rpm (Fig 3 illustrates such an arrangement). Multi-spool engines require gauges to indicate differentspool speeds and in some installations this is achieved by switching one gauge between separate spool speed generator signalsthus obviating the need for two or more rpm gauges per engine.
Exhaust Gas Temperature5. The operating temperature of a turbine has a direct effect on its life and it is therefore essential that the temperature is
DO NOT DISTRIBUTE AP 3456
Page 224 : Wed Jan 02 02:29:28 2002 Engine and Miscellaneous Instruments 3- 4- 4- 1

maintained within specified limits. Because of the high temperatures of the gas entering the turbine it is impractical to makedirect measurements. In practice the temperature of the gas is measured downstream of the turbine inlet either by thermocouplesat the exit to the turbine in the jet pipe, or by measuring the blade temperature using a pyrometer (See also Vol 8 Pt 2 Sect 1Chap 2). By knowing the behaviour of the gas through the turbine, the temperature loss can be calculated, and a suitable limitset for the measured value that will ensure that the turbine inlet temperature limit will not be exceeded.
6. When the exhaust gas temperature is measured using thermocouples, several are usually connected in series and positionedin the gas stream to give a representative average temperature. The thermocouple consists of two conductor wires, usually madeof nickel-chromium and nickel-aluminium respectively, mounted in a ceramic insulator which is housed in a protective metalsheath. This is known as the hot junction; a cold junction senses ambient air temperature as a reference point. There are twomain types of thermocouple in use; stagnation and rapid response:
a. Stagnation Type. In the stagnation type the sheath has a hole near its tip for the exhaust gas to enter and an exit holestaggered further away from the tip and of smaller diameter thus forcing the gas to flow through a Z-shaped passage past theelements of the thermocouple. This stagnation chamber reduces the gas velocity past the hot junction and avoids anadiabatic temperature rise on contact with the thermocouple.
b. Rapid Response Type. The rapid response type of thermocouple is used on turboprop engines where the exhaust gaseshave a comparatively low velocity. The gases follow a straight path past the hot junction.
7. To ensure that variations in the temperature of the cold junction do not affect the indicated temperature, an automaticcompensator is fitted either to the instrument or elsewhere in the circuit. A typical double element thermocouple installation isillustrated in Fig 4.
8. The optical radiation pyrometer develops an electro-motive force (EMF) proportional to the energy radiated from thesurface at which the pyrometer is directed, in this case the turbine blade (Fig 5). The radiated energy is focused onto aphoto-voltaic cell and the DC voltage produced is amplified and passed to control and indication circuits. Pyrometers are proneto ‘sooting’ and require cleaning and calibration at regular intervals. Engines fitted with pyrometers may also have a singlethermocouple to measure the exhaust gas temperature during engine start-up as the pyrometer is normally calibrated only for thenormal operating range of the engine, ie idle to maximum rpm.
3-4-4-1 Fig 4 A Typical Double Element Thermocouple System
DO NOT DISTRIBUTE AP 3456
Page 225 : Wed Jan 02 02:29:28 2002 Engine and Miscellaneous Instruments 3- 4- 4- 1
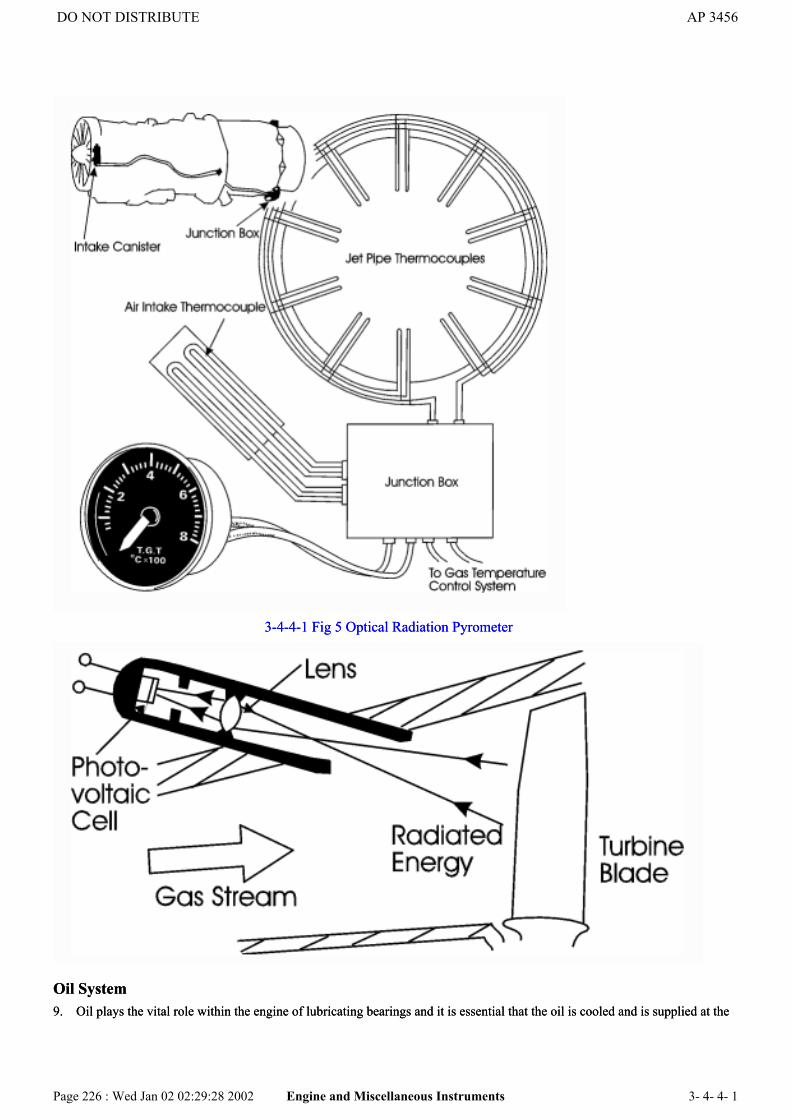
3-4-4-1 Fig 5 Optical Radiation Pyrometer
Oil System9. Oil plays the vital role within the engine of lubricating bearings and it is essential that the oil is cooled and is supplied at the
3-4-4-1 Fig 5 Optical Radiation Pyrometer
Oil System9. Oil plays the vital role within the engine of lubricating bearings and it is essential that the oil is cooled and is supplied at the
DO NOT DISTRIBUTE AP 3456
Page 226 : Wed Jan 02 02:29:28 2002 Engine and Miscellaneous Instruments 3- 4- 4- 1
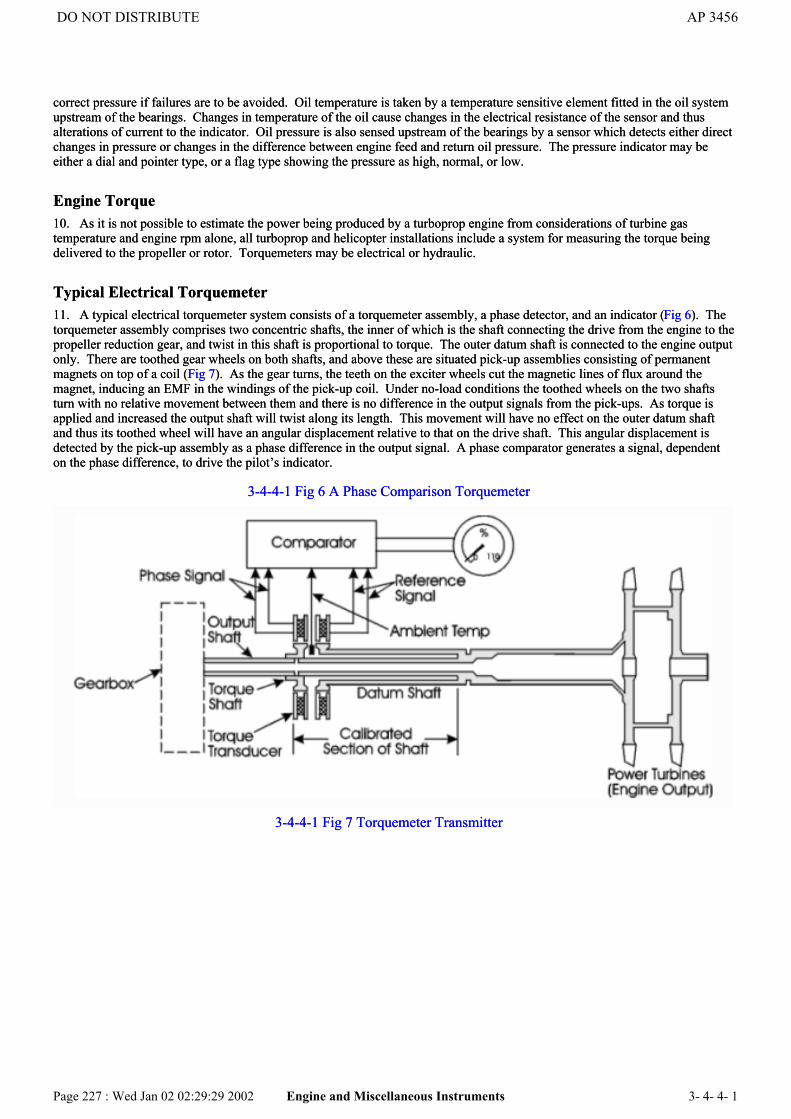
correct pressure if failures are to be avoided. Oil temperature is taken by a temperature sensitive element fitted in the oil systemupstream of the bearings. Changes in temperature of the oil cause changes in the electrical resistance of the sensor and thusalterations of current to the indicator. Oil pressure is also sensed upstream of the bearings by a sensor which detects either directchanges in pressure or changes in the difference between engine feed and return oil pressure. The pressure indicator may beeither a dial and pointer type, or a flag type showing the pressure as high, normal, or low.
Engine Torque10. As it is not possible to estimate the power being produced by a turboprop engine from considerations of turbine gastemperature and engine rpm alone, all turboprop and helicopter installations include a system for measuring the torque beingdelivered to the propeller or rotor. Torquemeters may be electrical or hydraulic.
Typical Electrical Torquemeter11. A typical electrical torquemeter system consists of a torquemeter assembly, a phase detector, and an indicator (Fig 6). Thetorquemeter assembly comprises two concentric shafts, the inner of which is the shaft connecting the drive from the engine to thepropeller reduction gear, and twist in this shaft is proportional to torque. The outer datum shaft is connected to the engine outputonly. There are toothed gear wheels on both shafts, and above these are situated pick-up assemblies consisting of permanentmagnets on top of a coil (Fig 7). As the gear turns, the teeth on the exciter wheels cut the magnetic lines of flux around themagnet, inducing an EMF in the windings of the pick-up coil. Under no-load conditions the toothed wheels on the two shaftsturn with no relative movement between them and there is no difference in the output signals from the pick-ups. As torque isapplied and increased the output shaft will twist along its length. This movement will have no effect on the outer datum shaftand thus its toothed wheel will have an angular displacement relative to that on the drive shaft. This angular displacement isdetected by the pick-up assembly as a phase difference in the output signal. A phase comparator generates a signal, dependenton the phase difference, to drive the pilot’s indicator.
3-4-4-1 Fig 6 A Phase Comparison Torquemeter
3-4-4-1 Fig 7 Torquemeter Transmitter
DO NOT DISTRIBUTE AP 3456
Page 227 : Wed Jan 02 02:29:29 2002 Engine and Miscellaneous Instruments 3- 4- 4- 1

Typical Hydraulic Torquemeter12. A hydraulic torquemeter mechanism is built into the main gear-box input section. The power turbine from the engine isconnected by way of a drive shaft to the input section of the main gear-box via a high speed input gear (see Fig 8). The highspeed input gear drives a spur gear on a free-wheel unit which in turn drives a helical gear. This gear meshes with the inputbevel gear helical drive. The meshing of these two gears can be compared to pushing two ramps together; the harder one pushesagainst the other, the further up the surface it slides. Thus the two gears tend to move apart in opposite linear motions. Theinput bevel gear is prevented from moving axially by means of tapered rollers, but movement is allowed on the free-wheel unithelical gear.
3-4-4-1 Fig 8 Hydraulic Torquemeter System
DO NOT DISTRIBUTE AP 3456
Page 228 : Wed Jan 02 02:29:29 2002 Engine and Miscellaneous Instruments 3- 4- 4- 1

13. The free-wheel unit assembly is mounted in straight roller bearings which allow the entire gear assembly to move linearly.Therefore all the gear reaction is taken up by the free-wheel unit assembly. As the unit moves forward (in the direction of thearrow) it carries with it a piston that is mounted on the outer race of a ball-bearing. This bearing allows the piston to remainrotationally fixed but allows the free-wheel unit to rotate. A torquemeter valve is spring loaded against this piston.
14. A pump supplies oil under pressure to the torquemeter valve. If no torque is being applied the torquemeter valve will beclosed, but as torque is applied the valve will start to open allowing some of the high pressure oil to enter the piston chamber.When the oil pressure acting upon the piston in the chamber is sufficient to overcome the movement of the free-wheel unit it willtend to close off the valve, thus retaining a specific oil pressure in the chamber. Increasing the torque will cause the valve toopen again thereby increasing the oil pressure in the chamber. This fine balance of shaft movement to oil pressure iscontinuously maintained, the oil pressure in the chamber being proportional to the valve movement which in turn is proportionalto the torque applied to the free-wheel unit. The piston chamber is connected to an external pressure transmitter which in turnoperates a cockpit torquemeter gauge indicating percentage of torque. This system often has input shafts from two engines andtwo torquemeter mechanisms making it possible to measure and match the torque applied by each engine so that each is carryingan equal load.
Vibration15. Compared to an internal combustion engine, a gas turbine is an extremely smooth running power generator, and a change invibration due to the impending failure of a component part may be so slight as to pass unnoticed by the crew. Experience hasshown that a vibration monitor installed on an engine is able to detect mechanical defects in rotating parts at a very early stage,thus permitting corrective action to be taken before extensive damage occurs.
16. Although vibration monitoring can be based on measuring acceleration or displacement, current practice tends towards themeasurement of velocity amplitude using a seismic accelerometer working on the piezo-electric principle. At least twoaccelerometers are required per engine so that radial and transverse vibrations can be measured. Cockpit indications may be inthe form of gauges, or as warning lights or audio signals triggered when a preset limit is exceeded.
DO NOT DISTRIBUTE AP 3456
Page 229 : Wed Jan 02 02:29:29 2002 Engine and Miscellaneous Instruments 3- 4- 4- 1

Engine and Miscellaneous InstrumentsChapter 2 - Miscellaneous Instruments
Fuel Content Gauges1. Fuel contents gauges indicate the amount of fuel contained in the aircraft tanks. The majority of gauges, and the only typedescribed here, are of the ‘pacitor’ type which rely on the change to the electrical impedance of a condenser when the substancebetween the plates is varied. Due to the design of the tanks, and other engineering considerations, not all of the indicated fuelmay be available for use; the characteristics of any particular aircraft type will be found in the Aircrew Manual. The currentpractice is for gauges to be calibrated in units of mass (kilograms), although in some older, and light piston aircraft gauges mayshow contents in volumetric terms, ie gallons.
2. Each tank unit contains a capacitor consisting of two vertical concentric tubes which are separated by a gap filled with fuel,air, or both. As the fuel level in the tank falls, the ratio of fuel to air in the gap decreases, thereby altering the impedance of thetank unit.
3. Fig 1 shows a diagram of a typical system electrical circuit. The tank unit varies the current flowing in the transformerprimary winding to which it is connected. The corresponding alternating current induced in the secondary winding is convertedto direct current by a rectifier and then fed to the deflection coil in the indicator. The same process takes place in the controlcircuit, except that, as the control condenser has a fixed value, the current in the coil remains constant. Variations in the supplyvoltage affect both circuits so that the ratio of control coil current to deflection coil current remains constant for a given tank unitimpedance.
3-4-4-2 Fig 1 Pacitor Fuel Gauge
4. Two units are fitted in each tank and connected in parallel. This ensures that accuracy is maintained despite aircraft attitudechanges - within specified limits - as the fall in fuel level at one end of the tank is compensated for by the rise at the other end
DO NOT DISTRIBUTE AP 3456
Page 230 : Wed Jan 02 02:29:29 2002 Engine and Miscellaneous Instruments 3- 4- 4- 2
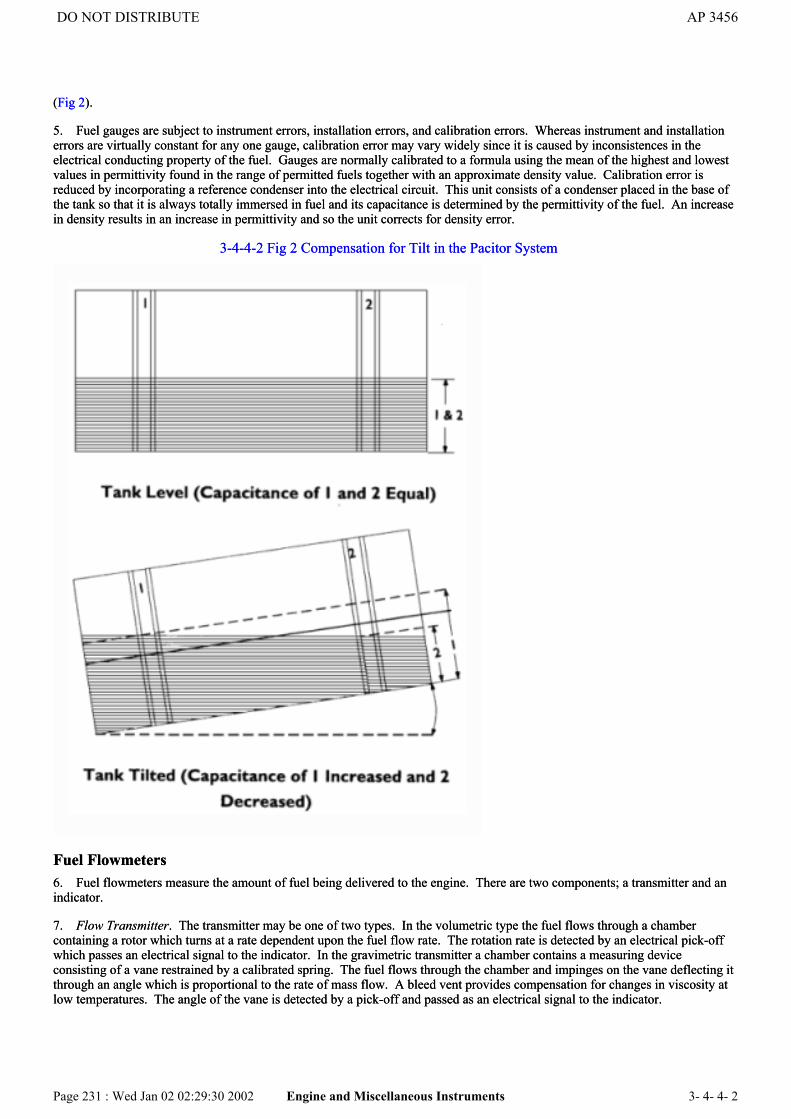
(Fig 2).
5. Fuel gauges are subject to instrument errors, installation errors, and calibration errors. Whereas instrument and installationerrors are virtually constant for any one gauge, calibration error may vary widely since it is caused by inconsistences in theelectrical conducting property of the fuel. Gauges are normally calibrated to a formula using the mean of the highest and lowestvalues in permittivity found in the range of permitted fuels together with an approximate density value. Calibration error isreduced by incorporating a reference condenser into the electrical circuit. This unit consists of a condenser placed in the base ofthe tank so that it is always totally immersed in fuel and its capacitance is determined by the permittivity of the fuel. An increasein density results in an increase in permittivity and so the unit corrects for density error.
3-4-4-2 Fig 2 Compensation for Tilt in the Pacitor System
Fuel Flowmeters6. Fuel flowmeters measure the amount of fuel being delivered to the engine. There are two components; a transmitter and anindicator.
7. Flow Transmitter. The transmitter may be one of two types. In the volumetric type the fuel flows through a chambercontaining a rotor which turns at a rate dependent upon the fuel flow rate. The rotation rate is detected by an electrical pick-offwhich passes an electrical signal to the indicator. In the gravimetric transmitter a chamber contains a measuring deviceconsisting of a vane restrained by a calibrated spring. The fuel flows through the chamber and impinges on the vane deflecting itthrough an angle which is proportional to the rate of mass flow. A bleed vent provides compensation for changes in viscosity atlow temperatures. The angle of the vane is detected by a pick-off and passed as an electrical signal to the indicator.
DO NOT DISTRIBUTE AP 3456
Page 231 : Wed Jan 02 02:29:30 2002 Engine and Miscellaneous Instruments 3- 4- 4- 2
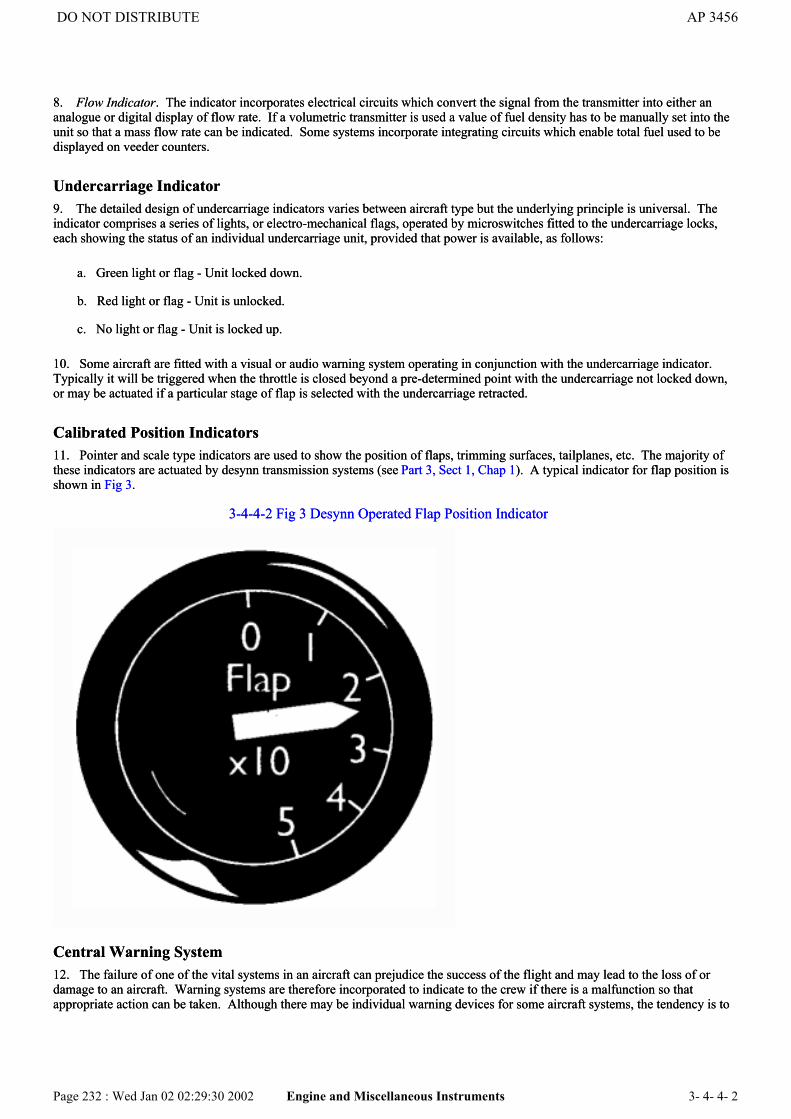
8. Flow Indicator. The indicator incorporates electrical circuits which convert the signal from the transmitter into either ananalogue or digital display of flow rate. If a volumetric transmitter is used a value of fuel density has to be manually set into theunit so that a mass flow rate can be indicated. Some systems incorporate integrating circuits which enable total fuel used to bedisplayed on veeder counters.
Undercarriage Indicator9. The detailed design of undercarriage indicators varies between aircraft type but the underlying principle is universal. Theindicator comprises a series of lights, or electro-mechanical flags, operated by microswitches fitted to the undercarriage locks,each showing the status of an individual undercarriage unit, provided that power is available, as follows:
a. Green light or flag - Unit locked down.
b. Red light or flag - Unit is unlocked.
c. No light or flag - Unit is locked up.
10. Some aircraft are fitted with a visual or audio warning system operating in conjunction with the undercarriage indicator.Typically it will be triggered when the throttle is closed beyond a pre-determined point with the undercarriage not locked down,or may be actuated if a particular stage of flap is selected with the undercarriage retracted.
Calibrated Position Indicators11. Pointer and scale type indicators are used to show the position of flaps, trimming surfaces, tailplanes, etc. The majority ofthese indicators are actuated by desynn transmission systems (see Part 3, Sect 1, Chap 1). A typical indicator for flap position isshown in Fig 3.
3-4-4-2 Fig 3 Desynn Operated Flap Position Indicator
Central Warning System12. The failure of one of the vital systems in an aircraft can prejudice the success of the flight and may lead to the loss of ordamage to an aircraft. Warning systems are therefore incorporated to indicate to the crew if there is a malfunction so thatappropriate action can be taken. Although there may be individual warning devices for some aircraft systems, the tendency is to
DO NOT DISTRIBUTE AP 3456
Page 232 : Wed Jan 02 02:29:30 2002 Engine and Miscellaneous Instruments 3- 4- 4- 2
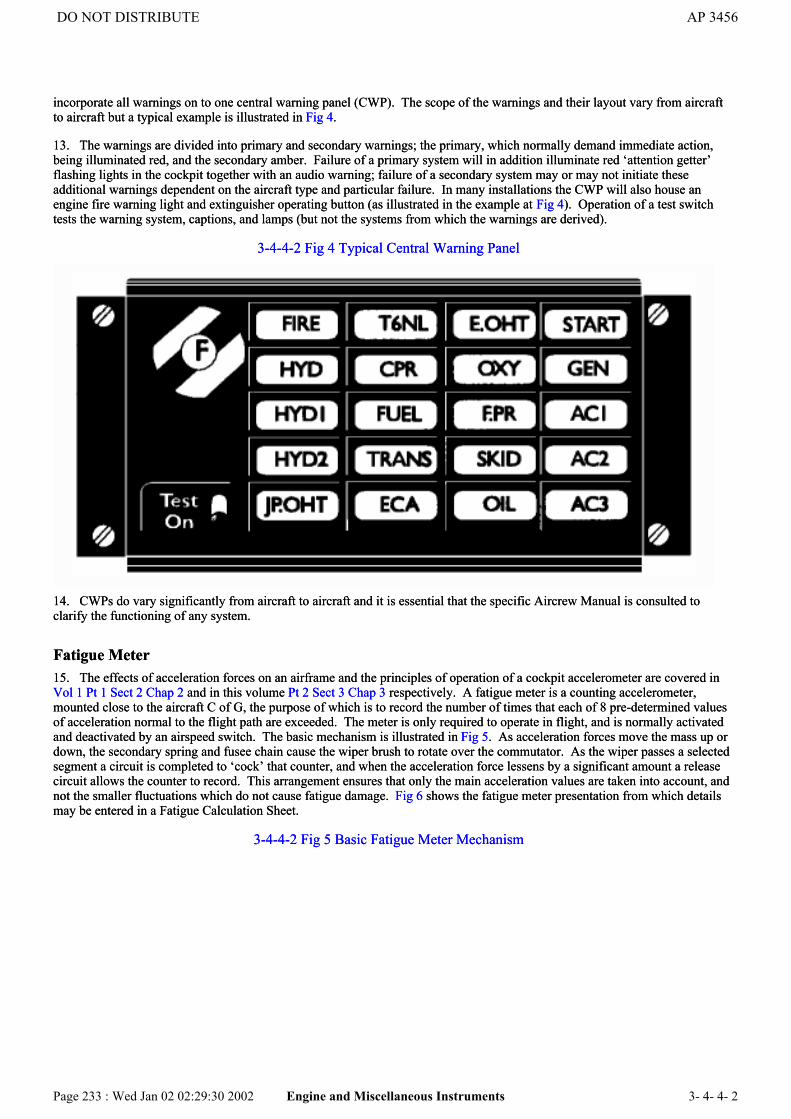
incorporate all warnings on to one central warning panel (CWP). The scope of the warnings and their layout vary from aircraftto aircraft but a typical example is illustrated in Fig 4.
13. The warnings are divided into primary and secondary warnings; the primary, which normally demand immediate action,being illuminated red, and the secondary amber. Failure of a primary system will in addition illuminate red ‘attention getter’flashing lights in the cockpit together with an audio warning; failure of a secondary system may or may not initiate theseadditional warnings dependent on the aircraft type and particular failure. In many installations the CWP will also house anengine fire warning light and extinguisher operating button (as illustrated in the example at Fig 4). Operation of a test switchtests the warning system, captions, and lamps (but not the systems from which the warnings are derived).
3-4-4-2 Fig 4 Typical Central Warning Panel
14. CWPs do vary significantly from aircraft to aircraft and it is essential that the specific Aircrew Manual is consulted toclarify the functioning of any system.
Fatigue Meter15. The effects of acceleration forces on an airframe and the principles of operation of a cockpit accelerometer are covered inVol 1 Pt 1 Sect 2 Chap 2 and in this volume Pt 2 Sect 3 Chap 3 respectively. A fatigue meter is a counting accelerometer,mounted close to the aircraft C of G, the purpose of which is to record the number of times that each of 8 pre-determined valuesof acceleration normal to the flight path are exceeded. The meter is only required to operate in flight, and is normally activatedand deactivated by an airspeed switch. The basic mechanism is illustrated in Fig 5. As acceleration forces move the mass up ordown, the secondary spring and fusee chain cause the wiper brush to rotate over the commutator. As the wiper passes a selectedsegment a circuit is completed to ‘cock’ that counter, and when the acceleration force lessens by a significant amount a releasecircuit allows the counter to record. This arrangement ensures that only the main acceleration values are taken into account, andnot the smaller fluctuations which do not cause fatigue damage. Fig 6 shows the fatigue meter presentation from which detailsmay be entered in a Fatigue Calculation Sheet.
3-4-4-2 Fig 5 Basic Fatigue Meter Mechanism
DO NOT DISTRIBUTE AP 3456
Page 233 : Wed Jan 02 02:29:30 2002 Engine and Miscellaneous Instruments 3- 4- 4- 2

3-4-4-2 Fig 6 Fatigue Meter Counter Unit3-4-4-2 Fig 6 Fatigue Meter Counter Unit
DO NOT DISTRIBUTE AP 3456
Page 234 : Wed Jan 02 02:29:30 2002 Engine and Miscellaneous Instruments 3- 4- 4- 2
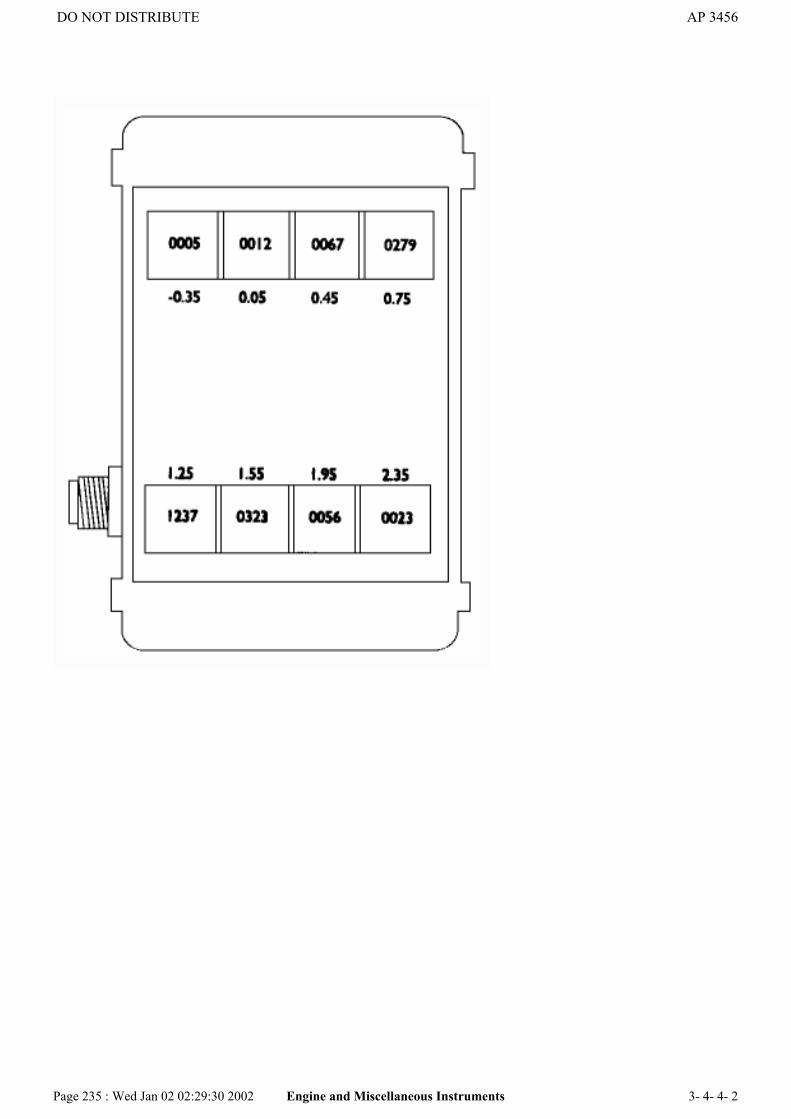
DO NOT DISTRIBUTE AP 3456
Page 235 : Wed Jan 02 02:29:30 2002 Engine and Miscellaneous Instruments 3- 4- 4- 2