complete business statistics
DESCRIPTION
COMPLETE BUSINESS STATISTICS. by AMIR D. ACZEL & JAYAVEL SOUNDERPANDIAN 6 th edition (SIE). Chapter 13. Quality Control and Improvements. Using Statistics W. Edwards Deming Instructs Statistics and Quality The x -bar Chart The R Chart and the s Chart The p Chart - PowerPoint PPT PresentationTRANSCRIPT
13-1
COMPLETE COMPLETE BUSINESS BUSINESS
STATISTICSSTATISTICSbyby
AMIR D. ACZELAMIR D. ACZEL
&&
JAYAVEL SOUNDERPANDIANJAYAVEL SOUNDERPANDIAN
66thth edition (SIE) edition (SIE)

13-2
Chapter 13 Chapter 13
Quality Control and Quality Control and ImprovementsImprovements
13-3
• Using Statistics• W. Edwards Deming Instructs• Statistics and Quality• The x-bar Chart• The R Chart and the s Chart• The p Chart• The c Chart• The x Chart
Quality Control and ImprovementsQuality Control and Improvements1313
13-4
• Determine when to use control charts• Create control charts for sample means, ranges and
standard deviations• Create control charts for sample proportions• Create control charts for the number of defectives• Draw Pareto charts using spreadsheet templates• Draw control charts using spreadsheet templates
LEARNING OBJECTIVESLEARNING OBJECTIVES 1313
After studying this chapter you will be able to:After studying this chapter you will be able to:

13-5
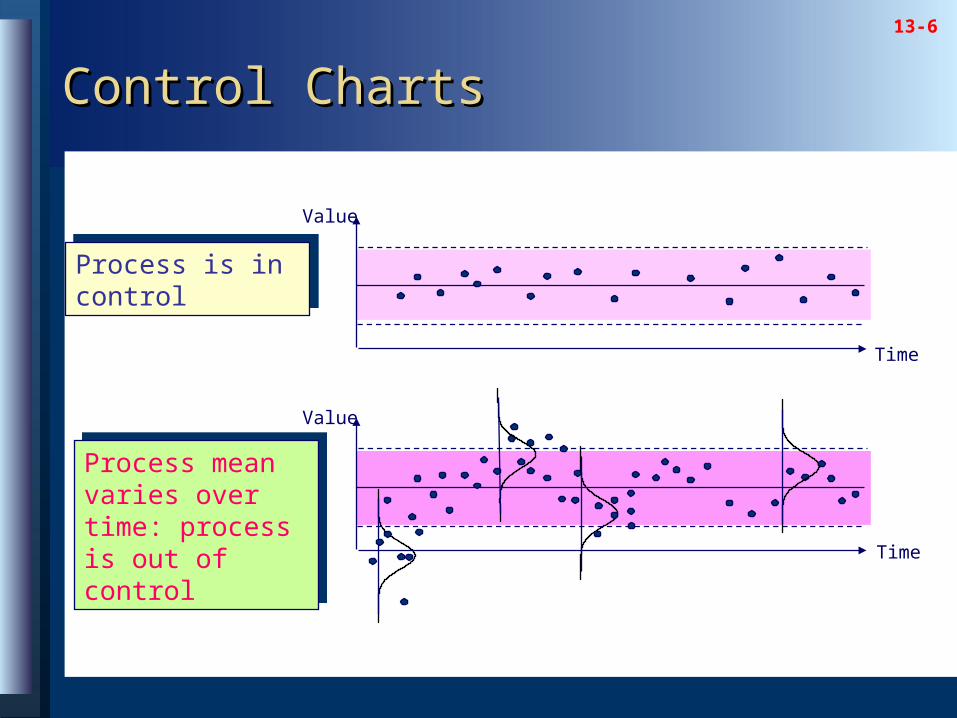
A control chart is a time plot of a statistic, such as a sample mean, range, standard deviation, or proportion, with a center line and upper and lower control limits. The limits give the desired range of values for the statistic. When the statistic is outside the bounds, or when its time plot reveals certain patterns, the process may be out of control.
A control chart is a time plot of a statistic, such as a sample mean, range, standard deviation, or proportion, with a center line and upper and lower control limits. The limits give the desired range of values for the statistic. When the statistic is outside the bounds, or when its time plot reveals certain patterns, the process may be out of control.
A process is considered in statistical control if it has no assignable causes, only natural variation.
A process is considered in statistical control if it has no assignable causes, only natural variation.
UCL
LCL
CenterLine
Time
ValueThis point is out of the control limitsThis point is out of the control limits
3
3
13-3 Statistics and Quality13-3 Statistics and Quality
13-6
Value
Time
Value
Time
Process is in controlProcess is in control
Process mean varies over time: process is out of control
Process mean varies over time: process is out of control
Control Charts Control Charts

13-7
Control Charts (Continued)Control Charts (Continued)
Time
ValueProcess variance changes over time: process is out of control.
Process variance changes over time: process is out of control.
Time
ValueProcess mean and variance change over time: process is out of control.
Process mean and variance change over time: process is out of control.

13-8
A Pareto diagramPareto diagram is a bar chart of the various problems in production and their percentages, which must add to 100%.
A Pareto diagramPareto diagram is a bar chart of the various problems in production and their percentages, which must add to 100%.
Pareto Diagrams – Using the Pareto Diagrams – Using the TemplateTemplate
A Pareto chart helps to identify the most significant problems and thus one can concentrate on their solutions rather than waste time and resources on unimportant causes.
A Pareto chart helps to identify the most significant problems and thus one can concentrate on their solutions rather than waste time and resources on unimportant causes.
13-9
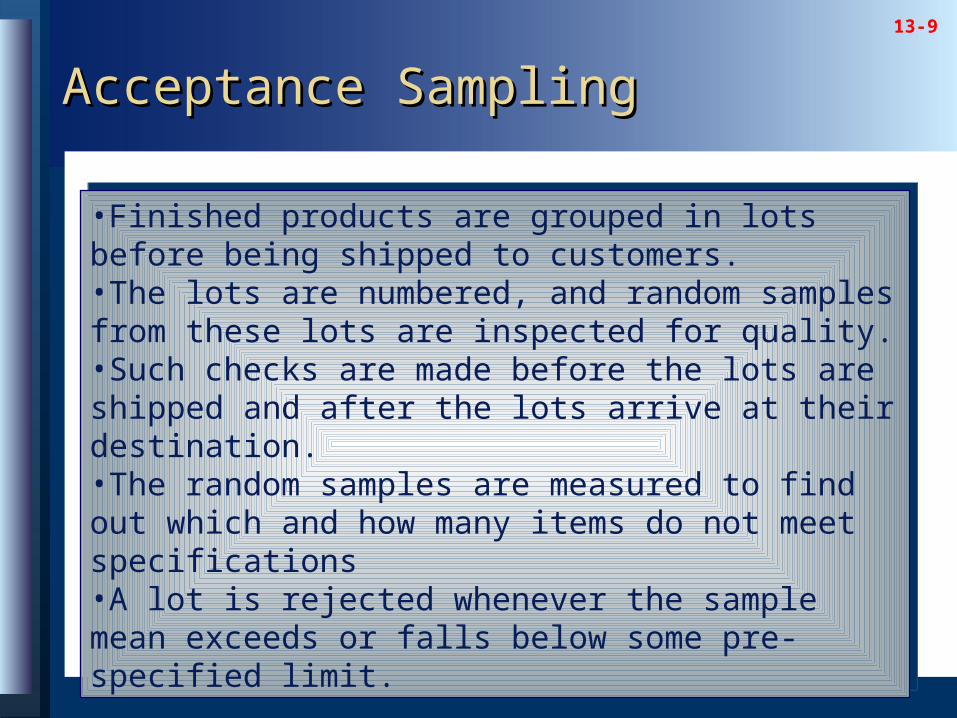
•Finished products are grouped in lots before being shipped to customers.•The lots are numbered, and random samples from these lots are inspected for quality.•Such checks are made before the lots are shipped and after the lots arrive at their destination.•The random samples are measured to find out which and how many items do not meet specifications•A lot is rejected whenever the sample mean exceeds or falls below some pre-specified limit.
•Finished products are grouped in lots before being shipped to customers.•The lots are numbered, and random samples from these lots are inspected for quality.•Such checks are made before the lots are shipped and after the lots arrive at their destination.•The random samples are measured to find out which and how many items do not meet specifications•A lot is rejected whenever the sample mean exceeds or falls below some pre-specified limit.
Acceptance SamplingAcceptance Sampling

13-10
• For attribute data, the lot is rejected when the number of defectives or non-conforming items in the sample exceeds a pre-specified limit.
• Acceptance sampling does not improve quality by itself.
• It simply removes bad lots.• To improve quality, it is necessary to control the
production process itself, removing any assignable causes and striving to reduce the variation in the process.
Acceptance SamplingAcceptance Sampling

13-11
Elements of a control chart for the process mean:
Center line:
LCL: UCL:
where: k = number of samples, each of size n = Sample mean for sample i
Ri Range of sample i
R =Rii=1
k
kIf the sample size in each group is more than 10:
LCL = x - 3s / c4
n UCL = x + 3
s / c4
nwhere s is the average of the standard deviations of all groups.
xxii
k
kx A R x A R
xi
1
2 2
n A2 c4
2 1.880 0.7979 3 1.023 0.8862 4 0.729 0.9213 5 0.577 0.9400 6 0.483 0.9515 7 0.419 0.9594 8 0.373 0.9650 9 0.337 0.969310 0.308 0.972715 0.223 0.982320 0.180 0.986925 0.153 0.9896
n A2 c4
2 1.880 0.7979 3 1.023 0.8862 4 0.729 0.9213 5 0.577 0.9400 6 0.483 0.9515 7 0.419 0.9594 8 0.373 0.9650 9 0.337 0.969310 0.308 0.972715 0.223 0.982320 0.180 0.986925 0.153 0.9896
13-4 The Chart: A Control Chart for 13-4 The Chart: A Control Chart for the Process Mean the Process Mean
X

13-12
• Tests for assignable causes: One point beyond 3 (3s) Nine points in a row on one side of the center line Six points in a row steadily increasing or decreasing Fourteen points in a row alternating up and down Two out of three points in a row beyond 2 (2s) Four out of five points in a row beyond 1 (1s) Fifteen points in a row within 1 (1s) of the center line Eight points in a row on both sides of the center line, all
beyond 1 (1s)
The Chart: A Control Chart for the The Chart: A Control Chart for the Process Mean (Continued)Process Mean (Continued)
X
13-13
Time
Value
112
2
3
3
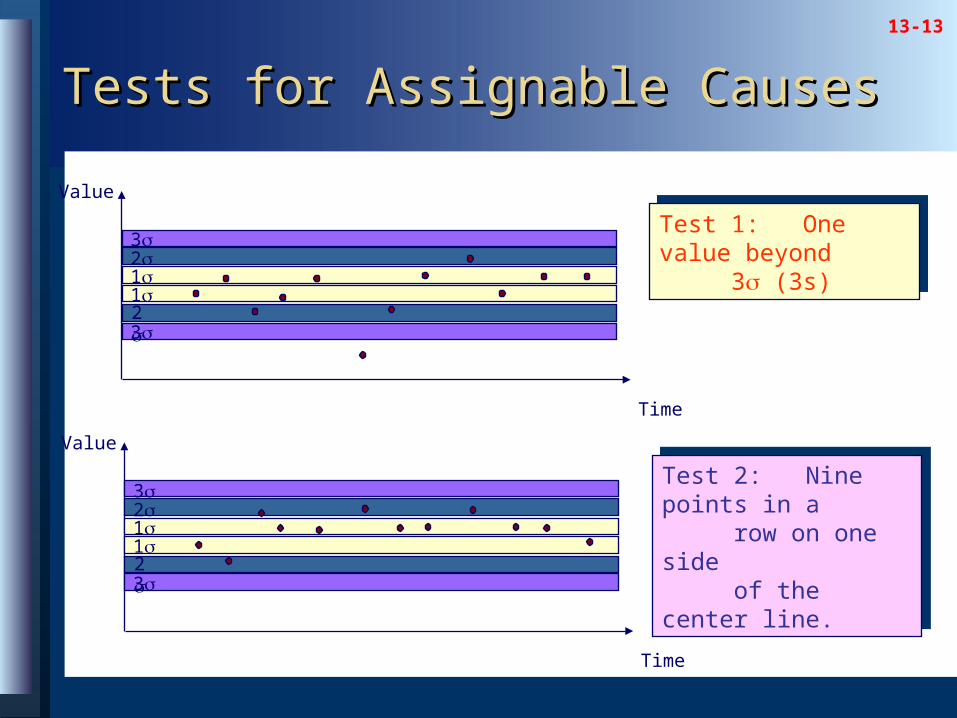
Test 1: One value beyond 3 (3s)
Test 1: One value beyond 3 (3s)
Time
Value
112
2
3
3
Test 2: Nine points in a row on one sideof the center line.
Test 2: Nine points in a row on one sideof the center line.
Tests for Assignable CausesTests for Assignable Causes

13-14
Time
Value
112
2
3
3
Test 3: Six points in arow steadilyincreasing ordecreasing.
Test 3: Six points in arow steadilyincreasing ordecreasing.
Time
Value
112
2
3
3
Test 4: Fourteen points ina row alternatingup and down.
Test 4: Fourteen points ina row alternatingup and down.
Tests for Assignable Causes Tests for Assignable Causes (Continued)(Continued)

13-15
Time
Value
112
2
3
3
Test 5: Two out of three points in a rowbeyond 2 (2s)
Test 5: Two out of three points in a rowbeyond 2 (2s)
Time
Value
112
2
3
3
Test 6: Four out of fivepoints in a rowbeyond 1 (1s)
Test 6: Four out of fivepoints in a rowbeyond 1 (1s)
Tests for Assignable Causes Tests for Assignable Causes (Continued)(Continued)
13-16
Time
Value
112
2
3
3
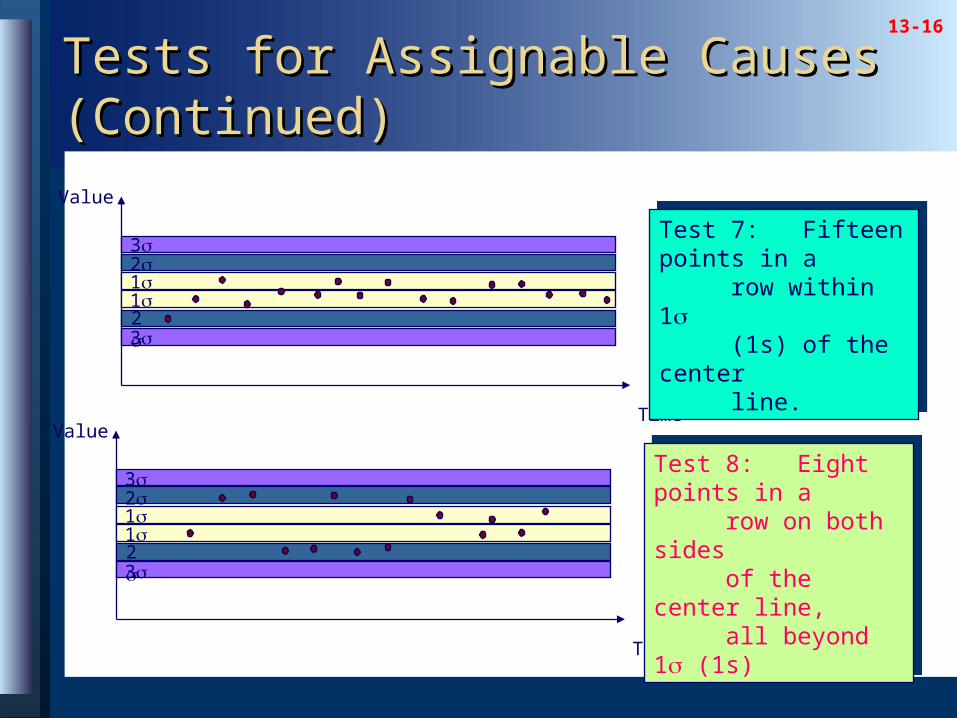
Test 7: Fifteen points in arow within 1(1s) of the centerline.
Test 7: Fifteen points in arow within 1(1s) of the centerline.
Time
Value
112
2
3
3
Test 8: Eight points in arow on both sidesof the center line,all beyond 1 (1s)
Test 8: Eight points in arow on both sidesof the center line,all beyond 1 (1s)
Tests for Assignable Causes Tests for Assignable Causes (Continued)(Continued)

13-17
XX-bar-bar Chart: Example 13-1 – Using Chart: Example 13-1 – Using the Templatethe Template

13-18
XX-bar-bar Chart: Example 13-1(continued) Chart: Example 13-1(continued) – Using the Template– Using the Template
Note:Note: The X-bar chart cannot be interpreted unless the The X-bar chart cannot be interpreted unless the R or s chart has been examined and is in control.R or s chart has been examined and is in control.
Note:Note: The X-bar chart cannot be interpreted unless the The X-bar chart cannot be interpreted unless the R or s chart has been examined and is in control.R or s chart has been examined and is in control.

13-19
n D3 D4 B3 B4
2 0 3.267 0 3.267 3 0 2.575 0 2.568 4 0 2.282 0 2.266 5 0 2.115 0 2.089 6 0 2.004 0.030 1.970 7 0.076 1.924 0.118 1.882 8 0.136 1.864 0.185 1.815 9 0.184 1.816 0.239 1.76110 0.223 1.777 0.284 1.71615 0.348 1.652 0.428 1.57220 0.414 1.586 0.510 1.49025 0.459 1.541 0.565 1.435
n D3 D4 B3 B4
2 0 3.267 0 3.267 3 0 2.575 0 2.568 4 0 2.282 0 2.266 5 0 2.115 0 2.089 6 0 2.004 0.030 1.970 7 0.076 1.924 0.118 1.882 8 0.136 1.864 0.185 1.815 9 0.184 1.816 0.239 1.76110 0.223 1.777 0.284 1.71615 0.348 1.652 0.428 1.57220 0.414 1.586 0.510 1.49025 0.459 1.541 0.565 1.435
Elements of a control chart for the process range:Center line: RLCL: UCL:
where: R =Rii=1
k
k
D R D R3 4
Elements of a control chart for the process standarddeviation:Center line: sLCL: UCL:
where: s =sii=1
k
k
B s B s3 4
13-5 The 13-5 The RR Chart and Chart and ss Chart Chart

13-20
RR Chart: Example 13-1 using the Chart: Example 13-1 using the TemplateTemplate
The process range seems to be in control.The process range seems to be in control.The process range seems to be in control.The process range seems to be in control.
13-21
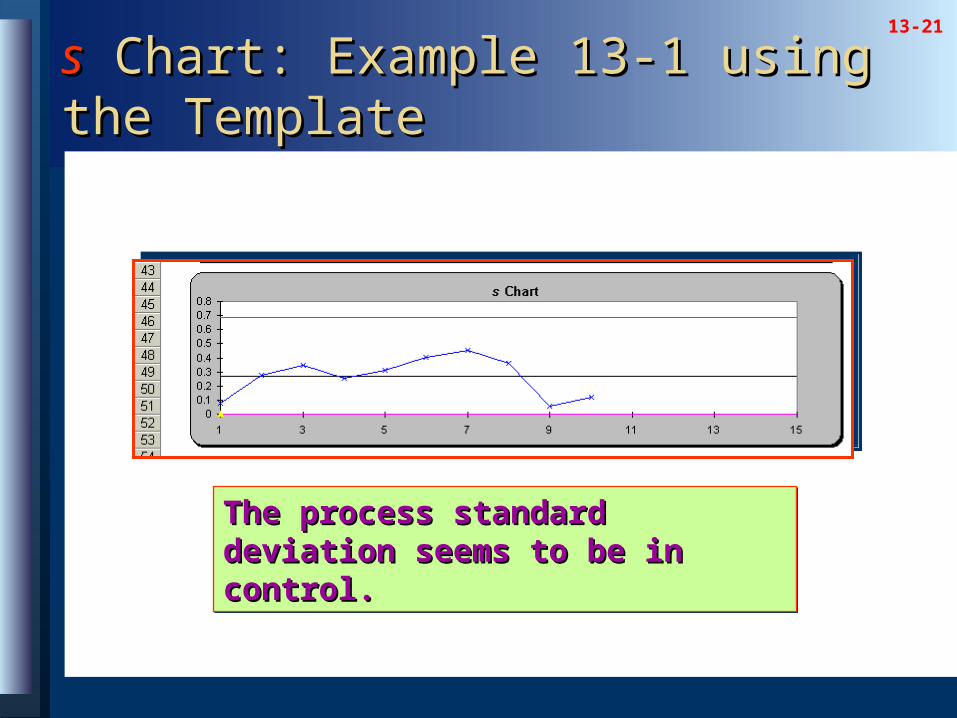
ss Chart: Example 13-1 using the Chart: Example 13-1 using the TemplateTemplate
The process standard deviation seems to The process standard deviation seems to be in control.be in control.The process standard deviation seems to The process standard deviation seems to be in control.be in control.
13-22
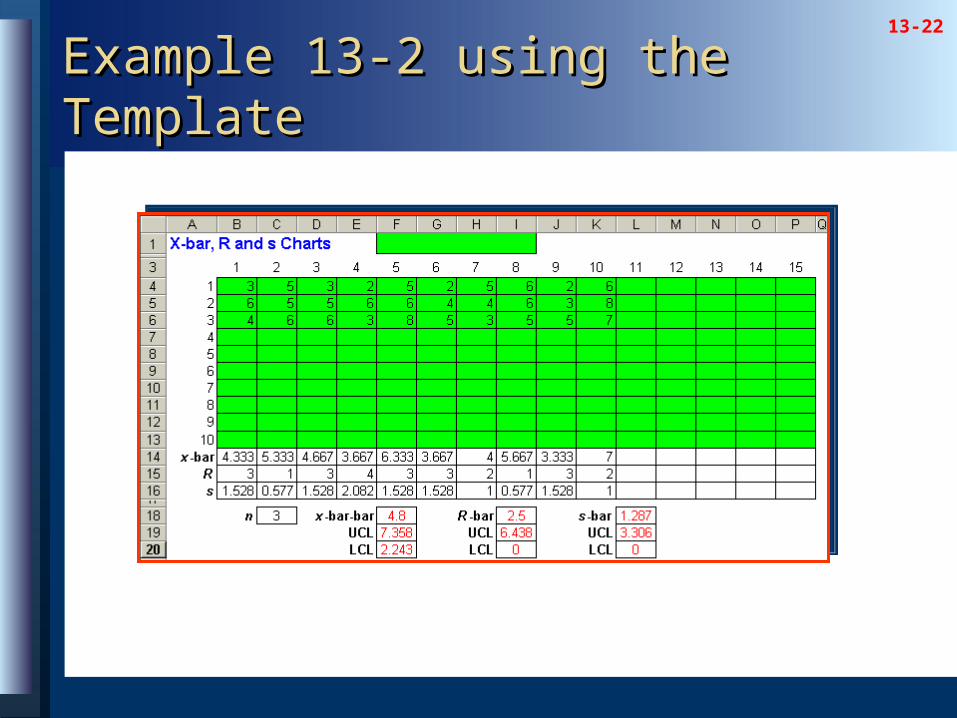
Example 13-2 using the TemplateExample 13-2 using the Template
13-23
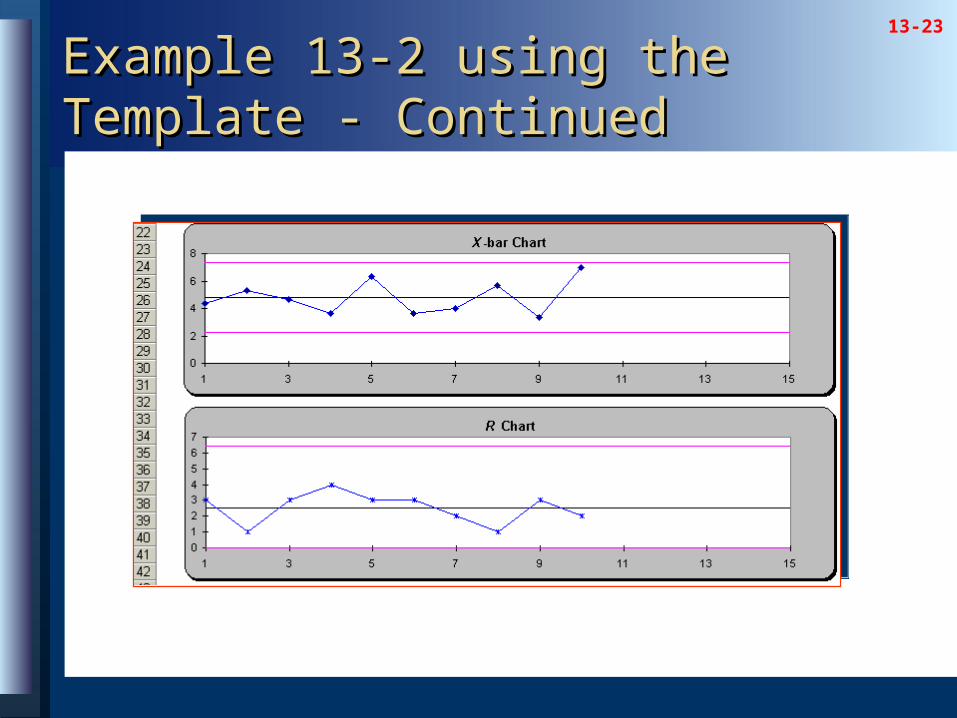
Example 13-2 using the Template - Example 13-2 using the Template - ContinuedContinued
13-24
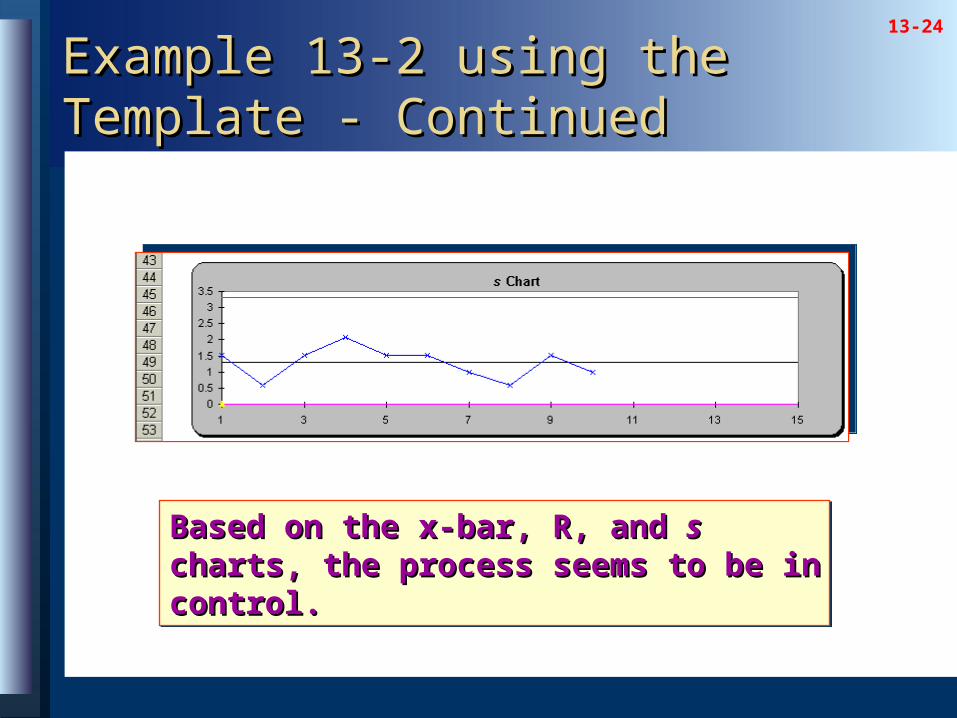
Example 13-2 using the Template - Example 13-2 using the Template - ContinuedContinued
Based on the x-bar, R, and Based on the x-bar, R, and ss charts, the process charts, the process seems to be in control.seems to be in control.Based on the x-bar, R, and Based on the x-bar, R, and ss charts, the process charts, the process seems to be in control.seems to be in control.
13-25
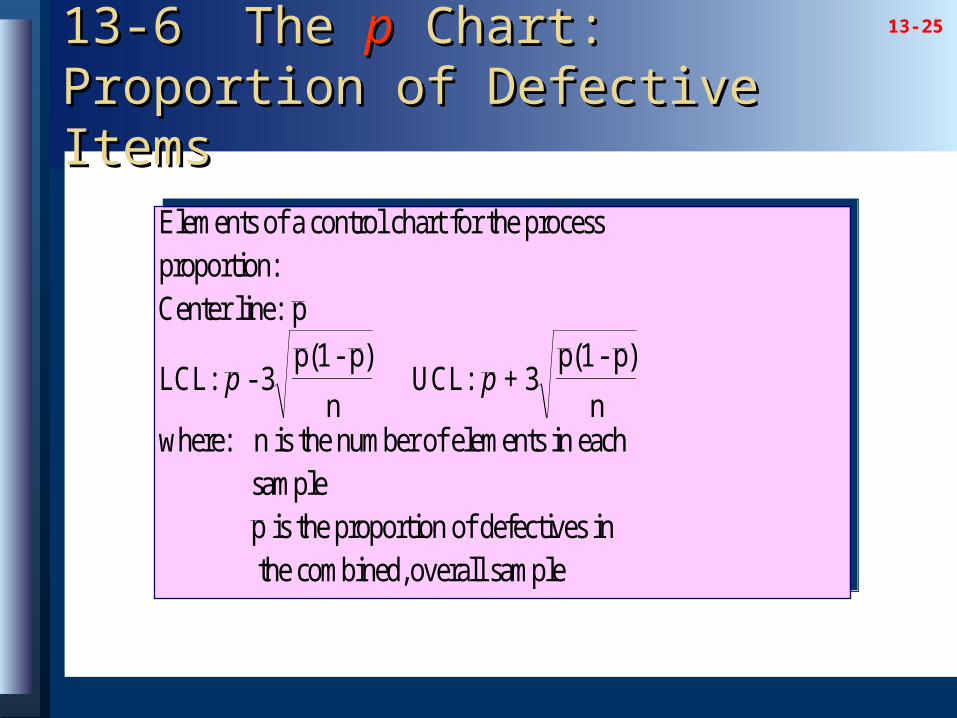
Elements of a control chart for the process proportion:Center line: p
LCL: - 3p(1 - p)
n UCL: + 3
p(1 - p)
n
where: n is the number of elements in each sample p is the proportion of defectives in the combined, overall sample
p p
Elements of a control chart for the process proportion:Center line: p
LCL: - 3p(1 - p)
n UCL: + 3
p(1 - p)
n
where: n is the number of elements in each sample p is the proportion of defectives in the combined, overall sample
p p
13-6 The 13-6 The pp Chart: Proportion of Chart: Proportion of Defective ItemsDefective Items

13-26
13-6 The 13-6 The pp Chart: Proportion of Defective Items Chart: Proportion of Defective Items – Using the Template for Example 13-3– Using the Template for Example 13-3
13-27
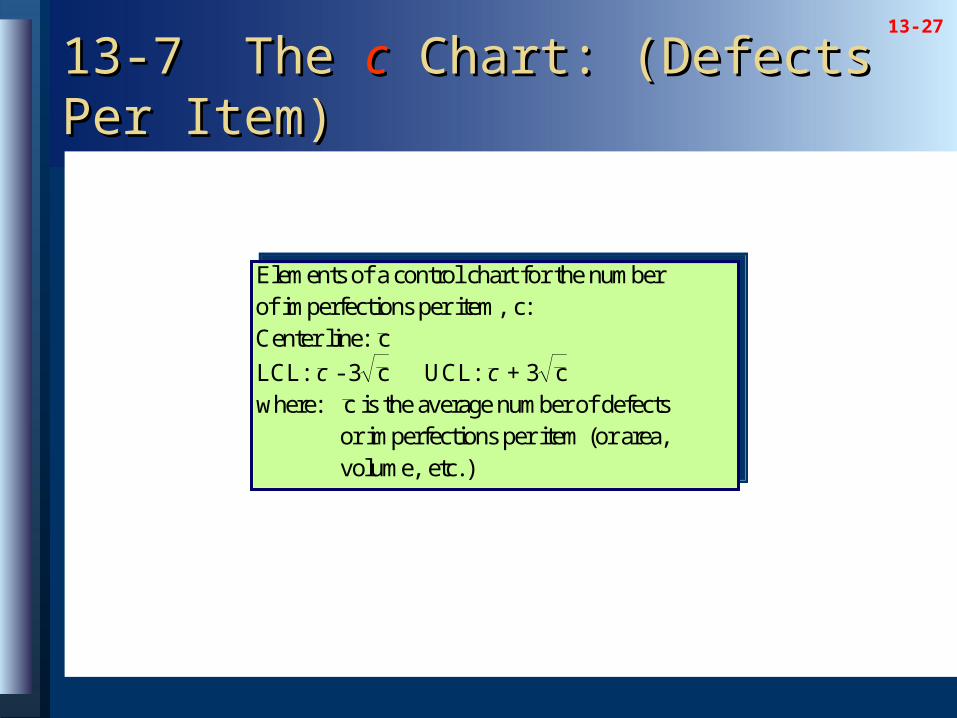
Elements of a control chart for the number of imperfections per item, c:Center line: c
LCL: - 3 c UCL: + 3 c where: c is the average number of defects or imperfections per item (or area, volume, etc. )
c c
Elements of a control chart for the number of imperfections per item, c:Center line: c
LCL: - 3 c UCL: + 3 c where: c is the average number of defects or imperfections per item (or area, volume, etc. )
c c
13-7 The 13-7 The cc Chart: (Defects Per Item) Chart: (Defects Per Item)
13-28
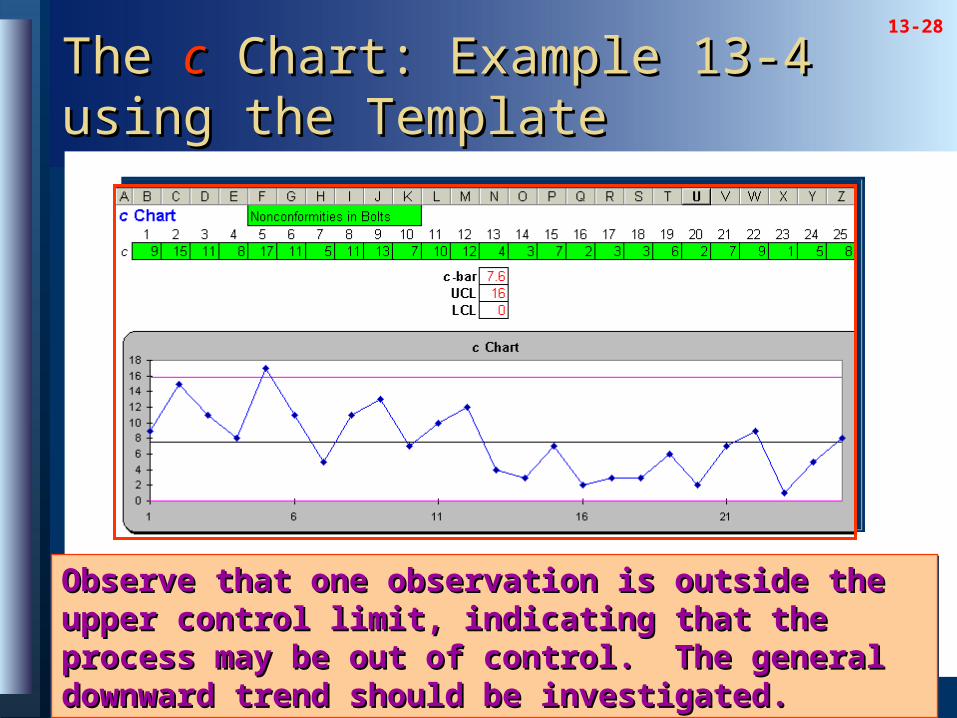
The The cc Chart: Example 13-4 using the Chart: Example 13-4 using the TemplateTemplate
Observe that one observation is outside the upper control limit, Observe that one observation is outside the upper control limit, indicating that the process may be out of control. The general indicating that the process may be out of control. The general downward trend should be investigated.downward trend should be investigated.
Observe that one observation is outside the upper control limit, Observe that one observation is outside the upper control limit, indicating that the process may be out of control. The general indicating that the process may be out of control. The general downward trend should be investigated.downward trend should be investigated.

13-29
13-8 The 13-8 The xx Chart Chart
Sometimes we are interested in controlling the process mean, but our observations come so slowly from the production process that we cannot aggregate them into groups. In such case we may consider an x chart. An x-chart is a chart for the raw values of the variable in question.
Sometimes we are interested in controlling the process mean, but our observations come so slowly from the production process that we cannot aggregate them into groups. In such case we may consider an x chart. An x-chart is a chart for the raw values of the variable in question.
The chart is effective if the variable has an approximate normal distribution. The bounds are 3 standard deviations from the mean of the process.
The chart is effective if the variable has an approximate normal distribution. The bounds are 3 standard deviations from the mean of the process.