complete curriculum - wyvern...
TRANSCRIPT

Higher GCSE Scheme of Work
mr-‐mathematics.com Dedicated to improving teaching
and learning in mathematics
Complete Curriculum
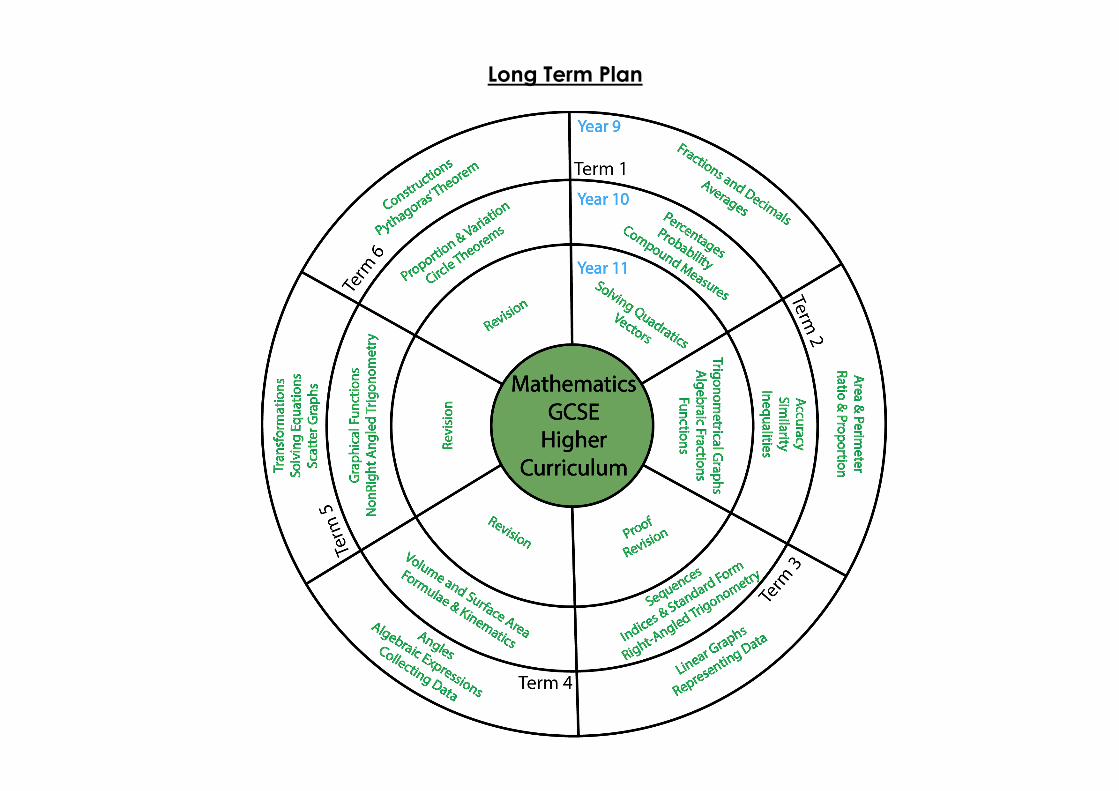
Long Term Plan
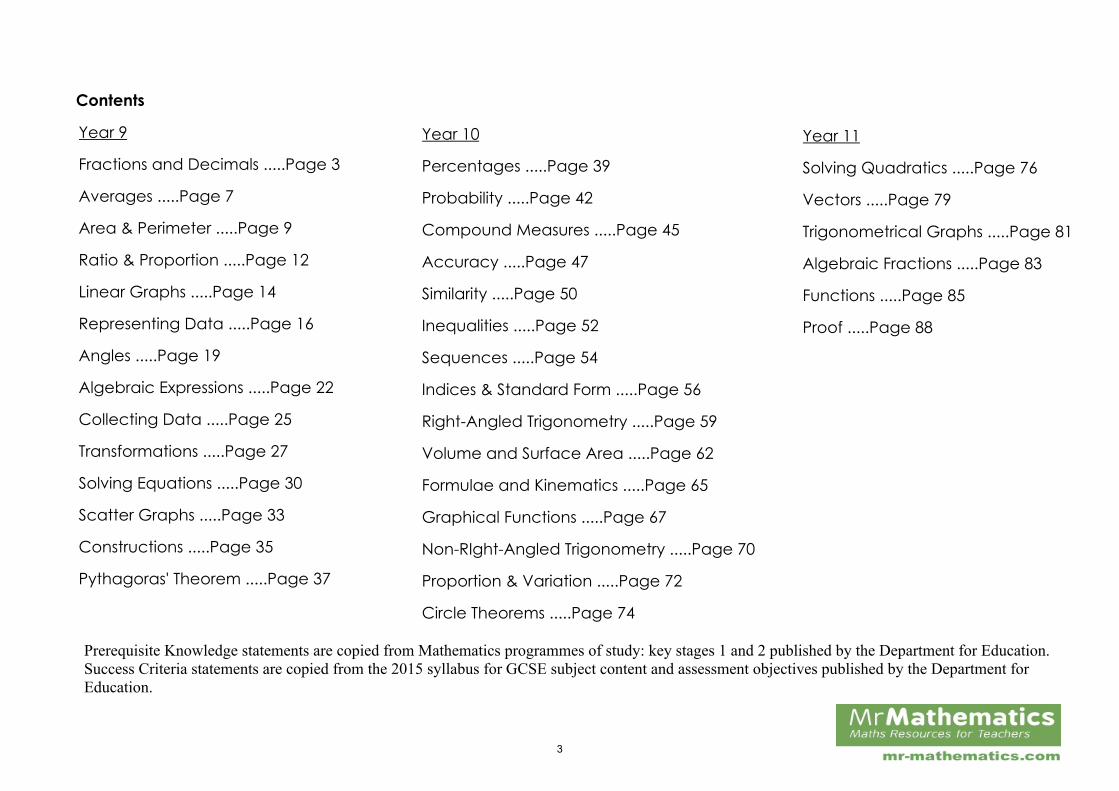
Prerequisite Knowledge statements are copied from Mathematics programmes of study: key stages 1 and 2 published by the Department for Education. Success Criteria statements are copied from the 2015 syllabus for GCSE subject content and assessment objectives published by the Department for Education.
Contents
Year 9
Fractions and Decimals .....Page 3
Averages .....Page 7
Area & Perimeter .....Page 9
Ratio & Proportion .....Page 12
Linear Graphs .....Page 14
Representing Data .....Page 16
Angles .....Page 19
Algebraic Expressions .....Page 22
Collecting Data .....Page 25
Transformations .....Page 27
Solving Equations .....Page 30
Scatter Graphs .....Page 33
Constructions .....Page 35
Pythagoras' Theorem .....Page 37
Year 10
Percentages .....Page 39
Probability .....Page 42
Compound Measures .....Page 45
Accuracy .....Page 47
Similarity .....Page 50
Inequalities .....Page 52
Sequences .....Page 54
Indices & Standard Form .....Page 56
Right-Angled Trigonometry .....Page 59
Volume and Surface Area .....Page 62
Formulae and Kinematics .....Page 65
Graphical Functions .....Page 67
Non-RIght-Angled Trigonometry .....Page 70
Proportion & Variation .....Page 72
Circle Theorems .....Page 74
Year 11
Solving Quadratics .....Page 76
Vectors .....Page 79
Trigonometrical Graphs .....Page 81
Algebraic Fractions .....Page 83
Functions .....Page 85
Proof .....Page 88
3
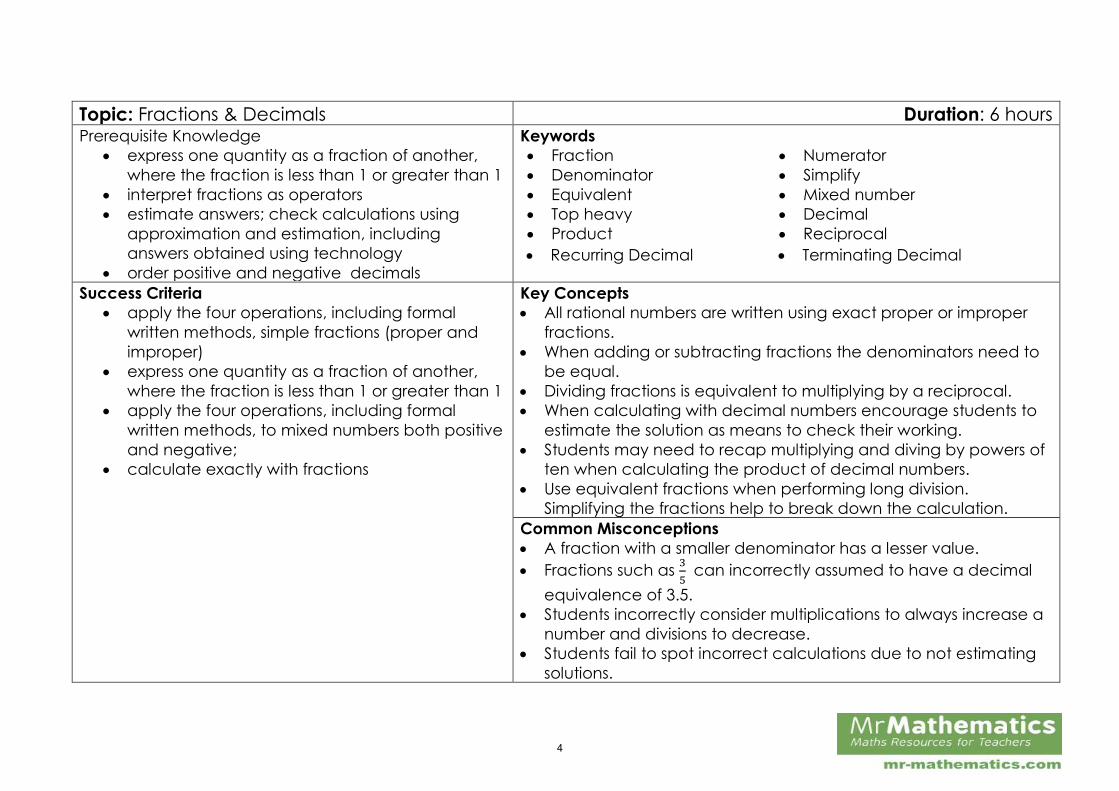
Topic: Fractions & Decimals Duration: 6 hours Prerequisite Knowledge
express one quantity as a fraction of another,
where the fraction is less than 1 or greater than 1
interpret fractions as operators
estimate answers; check calculations using
approximation and estimation, including
answers obtained using technology
order positive and negative decimals
Keywords
Fraction Numerator
Denominator Simplify
Equivalent Mixed number
Top heavy Decimal
Product Reciprocal
Success Criteria
apply the four operations, including formal
written methods, simple fractions (proper and
improper)
express one quantity as a fraction of another,
where the fraction is less than 1 or greater than 1
apply the four operations, including formal
written methods, to mixed numbers both positive
and negative;
calculate exactly with fractions
Key Concepts
All rational numbers are written using exact proper or improper
fractions.
When adding or subtracting fractions the denominators need to
be equal.
Dividing fractions is equivalent to multiplying by a reciprocal.
When calculating with decimal numbers encourage students to
estimate the solution as means to check their working.
Students may need to recap multiplying and diving by powers of
ten when calculating the product of decimal numbers.
Use equivalent fractions when performing long division.
Simplifying the fractions help to break down the calculation.
Common Misconceptions
A fraction with a smaller denominator has a lesser value.
Fractions such as 3
5 can incorrectly assumed to have a decimal
equivalence of 3.5.
Students incorrectly consider multiplications to always increase a
number and divisions to decrease.
Students fail to spot incorrect calculations due to not estimating
solutions.
Recurring Decimal Terminating Decimal
4
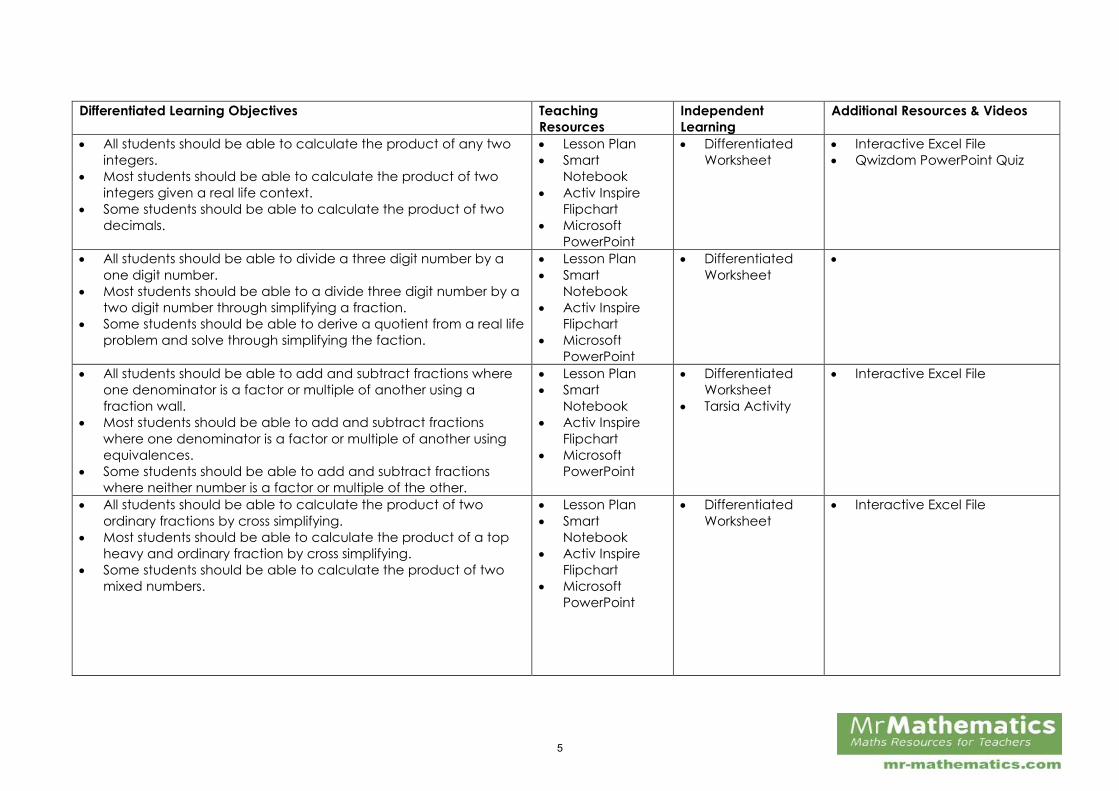
Differentiated Learning Objectives Teaching
Resources
Independent
Learning
Additional Resources & Videos
All students should be able to calculate the product of any two
integers.
Most students should be able to calculate the product of two
integers given a real life context.
Some students should be able to calculate the product of two
decimals.
Lesson Plan
Smart
Notebook
Activ Inspire
Flipchart
Microsoft
PowerPoint
Differentiated
Worksheet
Interactive Excel File
Qwizdom PowerPoint Quiz
All students should be able to divide a three digit number by a
one digit number.
Most students should be able to a divide three digit number by a
two digit number through simplifying a fraction.
Some students should be able to derive a quotient from a real life
problem and solve through simplifying the faction.
Lesson Plan
Smart
Notebook
Activ Inspire
Flipchart
Microsoft
PowerPoint
Differentiated
Worksheet
All students should be able to add and subtract fractions where
one denominator is a factor or multiple of another using a
fraction wall.
Most students should be able to add and subtract fractions
where one denominator is a factor or multiple of another using
equivalences.
Some students should be able to add and subtract fractions
where neither number is a factor or multiple of the other.
Lesson Plan
Smart
Notebook
Activ Inspire
Flipchart
Microsoft
PowerPoint
Differentiated
Worksheet
Tarsia Activity
Interactive Excel File
All students should be able to calculate the product of two
ordinary fractions by cross simplifying.
Most students should be able to calculate the product of a top
heavy and ordinary fraction by cross simplifying.
Some students should be able to calculate the product of two
mixed numbers.
Lesson Plan
Smart
Notebook
Activ Inspire
Flipchart
Microsoft
PowerPoint
Differentiated
Worksheet
Interactive Excel File
5
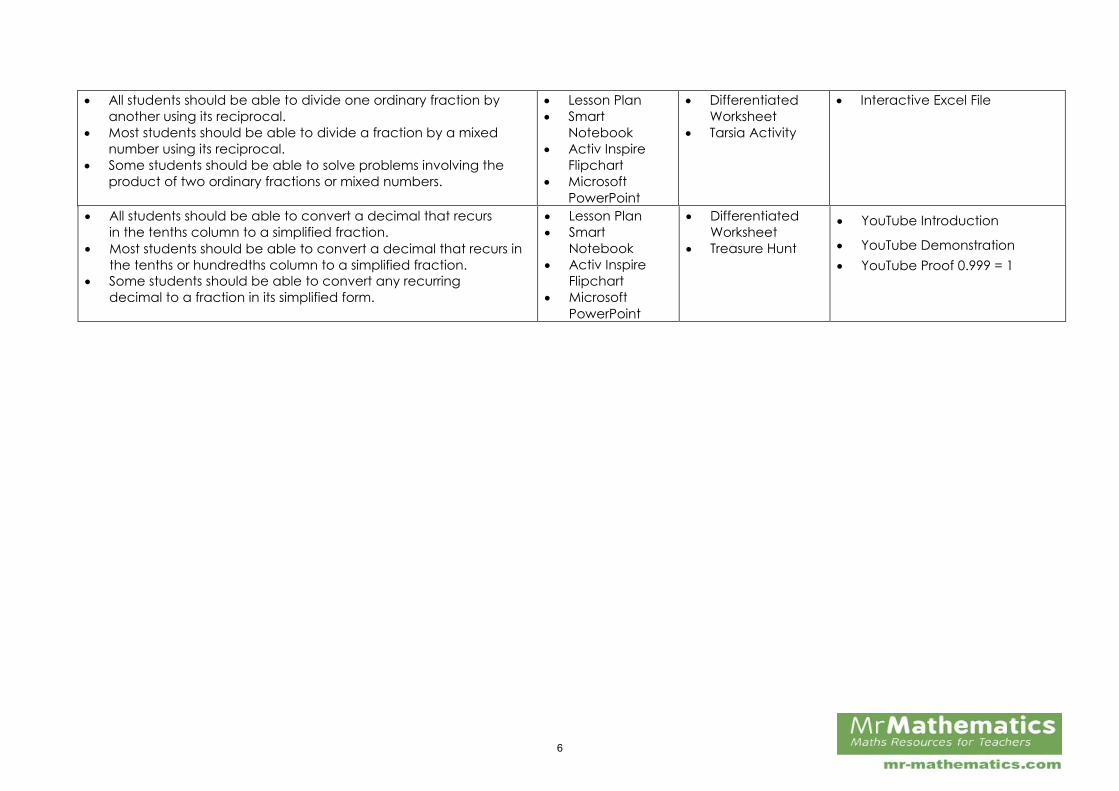
All students should be able to divide one ordinary fraction by
another using its reciprocal.
Most students should be able to divide a fraction by a mixed
number using its reciprocal.
Some students should be able to solve problems involving the
product of two ordinary fractions or mixed numbers.
Lesson Plan
Smart
Notebook
Activ Inspire
Flipchart
Microsoft
PowerPoint
Differentiated
Worksheet
Tarsia Activity
Interactive Excel File
All students should be able to convert a decimal that recursin the tenths column to a simplified fraction.
Most students should be able to convert a decimal that recurs inthe tenths or hundredths column to a simplified fraction.
Some students should be able to convert any recurringdecimal to a fraction in its simplified form.
Lesson Plan
Smart
Notebook
Activ Inspire
Flipchart
Microsoft
PowerPoint
Differentiated
Worksheet
Treasure Hunt YouTube Demonstration YouTube Proof 0.999 = 1
YouTube Introduction
6
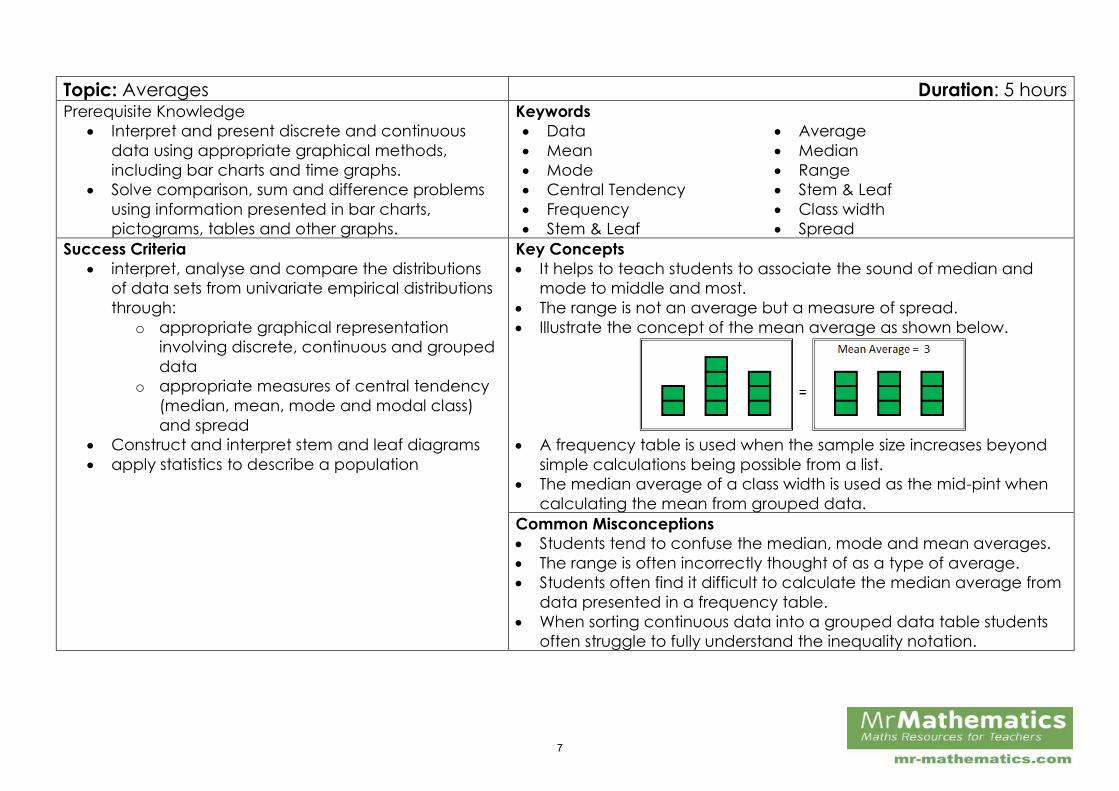
Topic: Averages Duration: 5 hours Prerequisite Knowledge
Interpret and present discrete and continuousdata using appropriate graphical methods, including bar charts and time graphs.
Solve comparison, sum and difference problemsusing information presented in bar charts, pictograms, tables and other graphs.
Keywords
Data Average Mean Median Mode Range Central Tendency Stem & Leaf Frequency Class width Stem & Leaf Spread
Success Criteria
interpret, analyse and compare the distributionsof data sets from univariate empirical distributions through:
o appropriate graphical representationinvolving discrete, continuous and grouped data
o appropriate measures of central tendency(median, mean, mode and modal class) and spread
Construct and interpret stem and leaf diagrams apply statistics to describe a population
Key Concepts
It helps to teach students to associate the sound of median andmode to middle and most.
The range is not an average but a measure of spread. Illustrate the concept of the mean average as shown below.
A frequency table is used when the sample size increases beyondsimple calculations being possible from a list.
The median average of a class width is used as the mid-pint whencalculating the mean from grouped data.
Common Misconceptions
Students tend to confuse the median, mode and mean averages. The range is often incorrectly thought of as a type of average. Students often find it difficult to calculate the median average from
data presented in a frequency table. When sorting continuous data into a grouped data table students
often struggle to fully understand the inequality notation.
7
Differentiated Learning Objectives Teaching Resources Independent Learning Additional Resources &
Videos
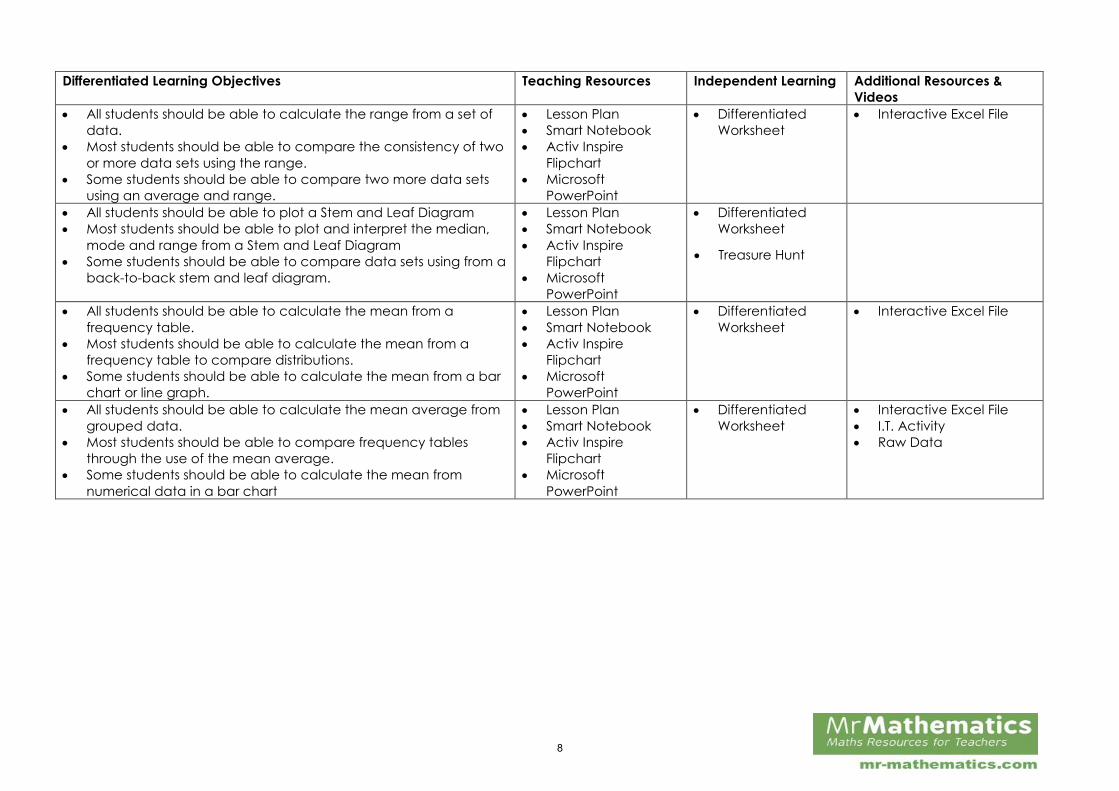
All students should be able to calculate the range from a set ofdata.
Most students should be able to compare the consistency of twoor more data sets using the range.
Some students should be able to compare two more data setsusing an average and range.
Lesson Plan Smart Notebook Activ Inspire
Flipchart Microsoft
PowerPoint
DifferentiatedWorksheet
Interactive Excel File
All students should be able to plot a Stem and Leaf Diagram Most students should be able to plot and interpret the median,
mode and range from a Stem and Leaf Diagram Some students should be able to compare data sets using from a
back-to-back stem and leaf diagram.
Lesson Plan Smart Notebook Activ Inspire
Flipchart Microsoft
PowerPoint
DifferentiatedWorksheet
All students should be able to calculate the mean from afrequency table.
Most students should be able to calculate the mean from afrequency table to compare distributions.
Some students should be able to calculate the mean from a barchart or line graph.
Lesson Plan Smart Notebook Activ Inspire
Flipchart Microsoft
PowerPoint
DifferentiatedWorksheet
Interactive Excel File
All students should be able to calculate the mean average fromgrouped data.
Most students should be able to compare frequency tablesthrough the use of the mean average.
Some students should be able to calculate the mean fromnumerical data in a bar chart
Lesson Plan Smart Notebook Activ Inspire
Flipchart Microsoft
PowerPoint
DifferentiatedWorksheet
Interactive Excel File I.T. Activity Raw Data
Treasure Hunt
8
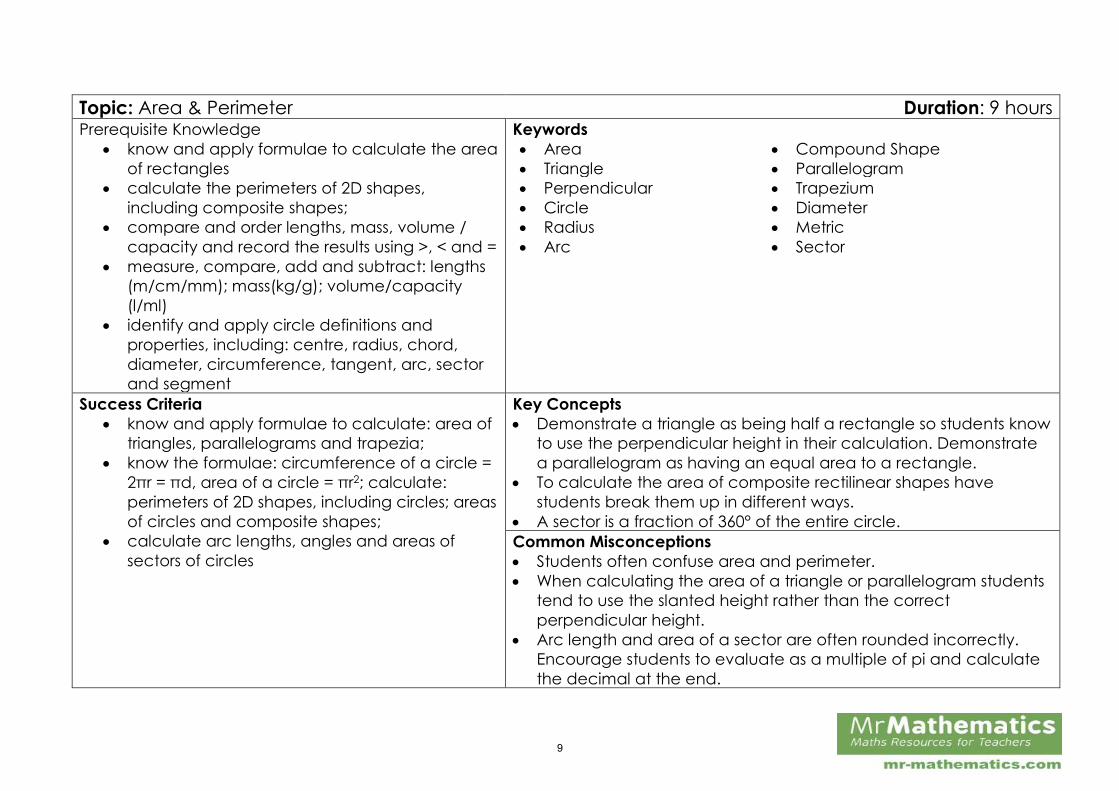
Topic: Area & Perimeter Duration: 9 hours Prerequisite Knowledge
know and apply formulae to calculate the area
of rectangles
calculate the perimeters of 2D shapes,
including composite shapes;
compare and order lengths, mass, volume /
capacity and record the results using >, < and =
measure, compare, add and subtract: lengths
(m/cm/mm); mass(kg/g); volume/capacity
(l/ml)
identify and apply circle definitions and
properties, including: centre, radius, chord,
diameter, circumference, tangent, arc, sector
and segment
Keywords
Area Compound Shape
Triangle Parallelogram
Perpendicular Trapezium
Circle Diameter
Radius Metric
Arc Sector
Success Criteria
know and apply formulae to calculate: area of
triangles, parallelograms and trapezia;
know the formulae: circumference of a circle = 2πr = πd, area of a circle = πr2; calculate: perimeters of 2D shapes, including circles; areas of circles and composite shapes;
calculate arc lengths, angles and areas of
sectors of circles
Key Concepts
Demonstrate a triangle as being half a rectangle so students know
to use the perpendicular height in their calculation. Demonstrate
a parallelogram as having an equal area to a rectangle.
To calculate the area of composite rectilinear shapes have
students break them up in different ways.
A sector is a fraction of 360° of the entire circle.
Common Misconceptions
Students often confuse area and perimeter.
When calculating the area of a triangle or parallelogram students
tend to use the slanted height rather than the correct
perpendicular height.
Arc length and area of a sector are often rounded incorrectly.
Encourage students to evaluate as a multiple of pi and calculate
the decimal at the end.
9
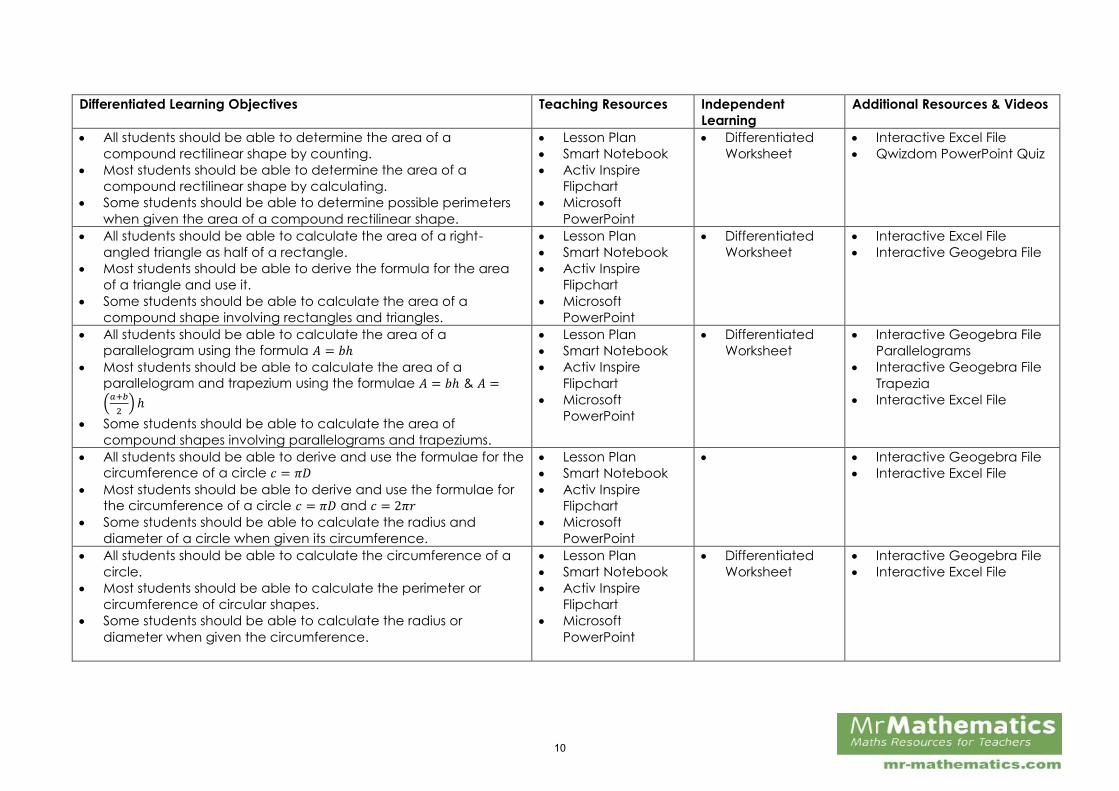
Differentiated Learning Objectives Teaching Resources Independent
Learning
Additional Resources & Videos
All students should be able to determine the area of a
compound rectilinear shape by counting.
Most students should be able to determine the area of a
compound rectilinear shape by calculating.
Some students should be able to determine possible perimeters
when given the area of a compound rectilinear shape.
Lesson Plan
Smart Notebook
Activ Inspire
Flipchart
Microsoft
PowerPoint
Differentiated
Worksheet
Interactive Excel File
Qwizdom PowerPoint Quiz
All students should be able to calculate the area of a right-
angled triangle as half of a rectangle.
Most students should be able to derive the formula for the area
of a triangle and use it.
Some students should be able to calculate the area of a
compound shape involving rectangles and triangles.
Lesson Plan
Smart Notebook
Activ Inspire
Flipchart
Microsoft
PowerPoint
Differentiated
Worksheet
Interactive Excel File
Interactive Geogebra File
All students should be able to calculate the area of a
parallelogram using the formula 𝐴 = 𝑏ℎ
Most students should be able to calculate the area of a
parallelogram and trapezium using the formulae 𝐴 = 𝑏ℎ & 𝐴 =
(𝑎+𝑏
2) ℎ
Some students should be able to calculate the area of
compound shapes involving parallelograms and trapeziums.
Lesson Plan
Smart Notebook
Activ Inspire
Flipchart
Microsoft
PowerPoint
Differentiated
Worksheet
Interactive Geogebra File
Parallelograms
Interactive Geogebra File
Trapezia
Interactive Excel File
All students should be able to derive and use the formulae for the
circumference of a circle 𝑐 = 𝜋𝐷
Most students should be able to derive and use the formulae for
the circumference of a circle 𝑐 = 𝜋𝐷 and 𝑐 = 2𝜋𝑟
Some students should be able to calculate the radius and
diameter of a circle when given its circumference.
Lesson Plan
Smart Notebook
Activ Inspire
Flipchart
Microsoft
PowerPoint
Interactive Geogebra File
Interactive Excel File
All students should be able to calculate the circumference of a
circle.
Most students should be able to calculate the perimeter or
circumference of circular shapes.
Some students should be able to calculate the radius or
diameter when given the circumference.
Lesson Plan
Smart Notebook
Activ Inspire
Flipchart
Microsoft
PowerPoint
Differentiated
Worksheet
Interactive Geogebra File
Interactive Excel File
10
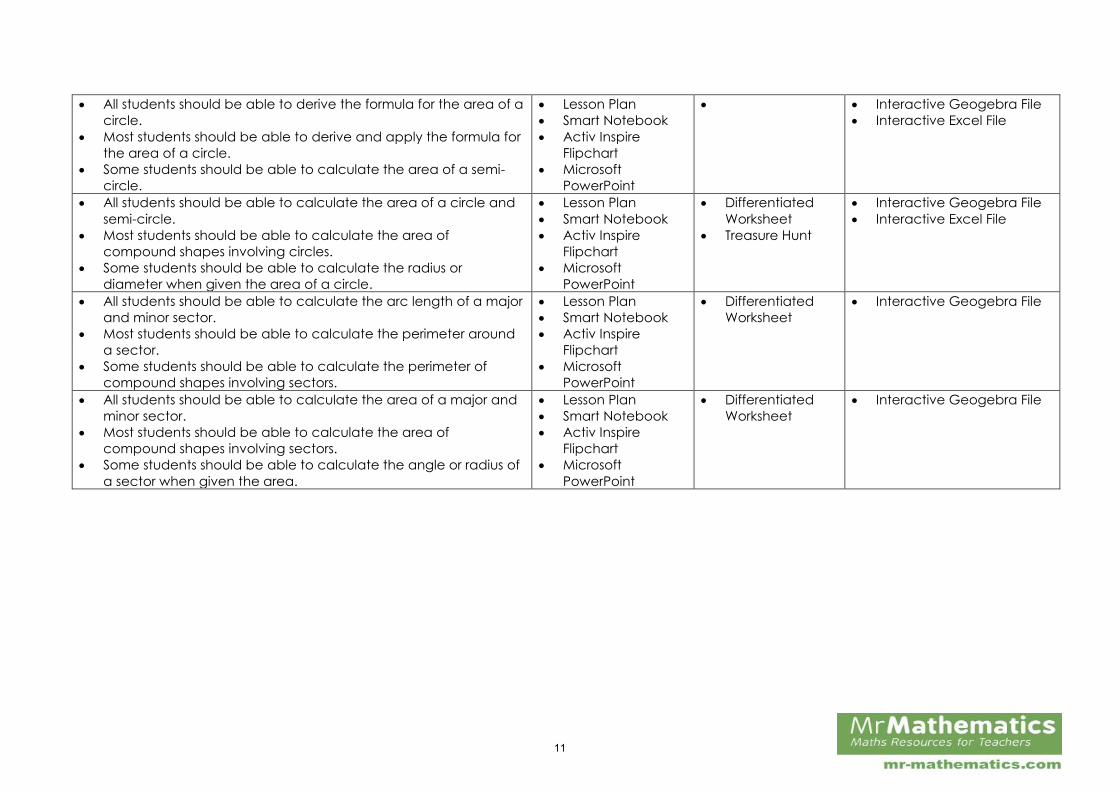
All students should be able to derive the formula for the area of a
circle.
Most students should be able to derive and apply the formula for
the area of a circle.
Some students should be able to calculate the area of a semi-
circle.
Lesson Plan
Smart Notebook
Activ Inspire
Flipchart
Microsoft
PowerPoint
Interactive Geogebra File
Interactive Excel File
All students should be able to calculate the area of a circle and
semi-circle.
Most students should be able to calculate the area of
compound shapes involving circles.
Some students should be able to calculate the radius or
diameter when given the area of a circle.
Lesson Plan
Smart Notebook
Activ Inspire
Flipchart
Microsoft
PowerPoint
Differentiated
Worksheet
Treasure Hunt
Interactive Geogebra File
Interactive Excel File
All students should be able to calculate the arc length of a major
and minor sector.
Most students should be able to calculate the perimeter around
a sector.
Some students should be able to calculate the perimeter of
compound shapes involving sectors.
Lesson Plan
Smart Notebook
Activ Inspire
Flipchart
Microsoft
PowerPoint
Differentiated
Worksheet
Interactive Geogebra File
All students should be able to calculate the area of a major and
minor sector.
Most students should be able to calculate the area of
compound shapes involving sectors.
Some students should be able to calculate the angle or radius of
a sector when given the area.
Lesson Plan
Smart Notebook
Activ Inspire
Flipchart
Microsoft
PowerPoint
Differentiated
Worksheet
Interactive Geogebra File
11
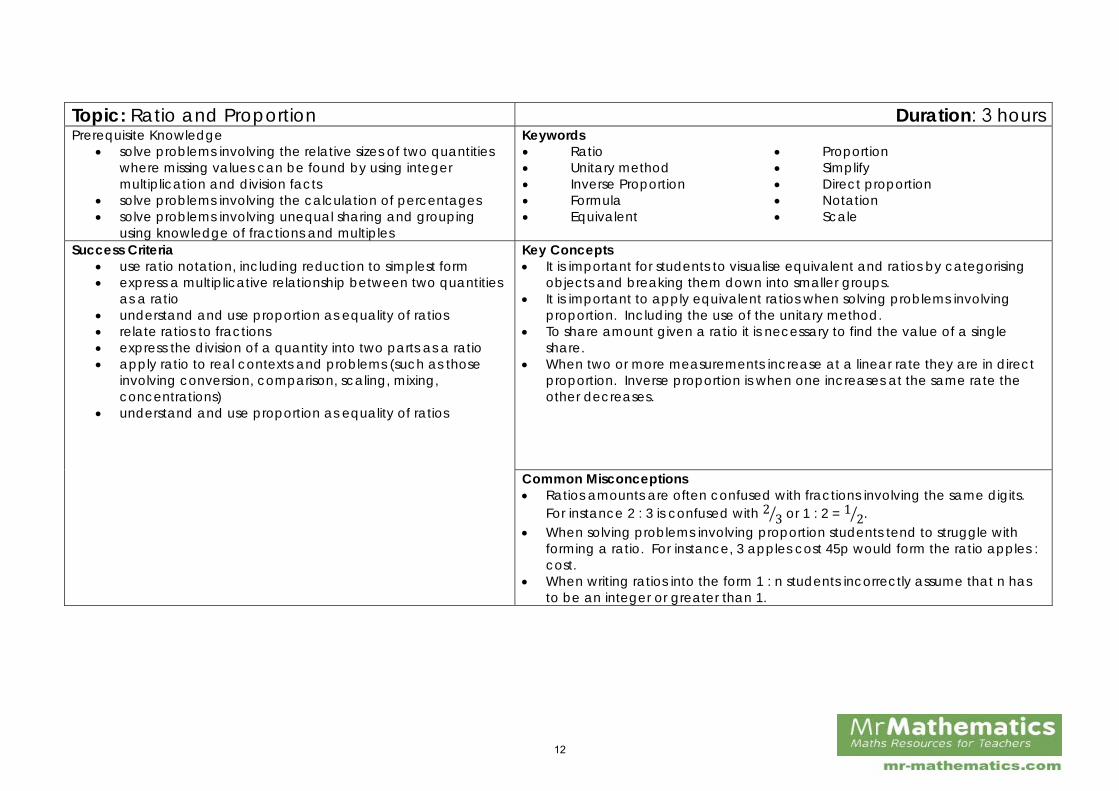
Topic: Ratio and Proportion Duration: 3 hours Prerequisite Knowledge
solve problems involving the relative sizes of two quantitieswhere missing values can be found by using integermultiplication and division facts
solve problems involving the calculation of percentages solve problems involving unequal sharing and grouping
using knowledge of fractions and multiples
Keywords Ratio Proportion Unitary method Simplify Inverse Proportion Direct proportion Formula Notation Equivalent Scale
Success Criteria use ratio notation, including reduction to simplest form express a multiplicative relationship between two quantities
as a ratio understand and use proportion as equality of ratios relate ratios to fractions express the division of a quantity into two parts as a ratio apply ratio to real contexts and problems (such as those
involving conversion, comparison, scaling, mixing,concentrations)
understand and use proportion as equality of ratios
Key Concepts It is important for students to visualise equivalent and ratios by categorising
objects and breaking them down into smaller groups. It is important to apply equivalent ratios when solving problems involving
proportion. Including the use of the unitary method. To share amount given a ratio it is necessary to find the value of a single
share. When two or more measurements increase at a linear rate they are in direct
proportion. Inverse proportion is when one increases at the same rate theother decreases.
Common Misconceptions Ratios amounts are often confused with fractions involving the same digits.
For instance 2 : 3 is confused with 2 3 or 1 : 2 = 1 2. When solving problems involving proportion students tend to struggle with
forming a ratio. For instance, 3 apples cost 45p would form the ratio apples :cost.
When writing ratios into the form 1 : n students incorrectly assume that n hasto be an integer or greater than 1.
12
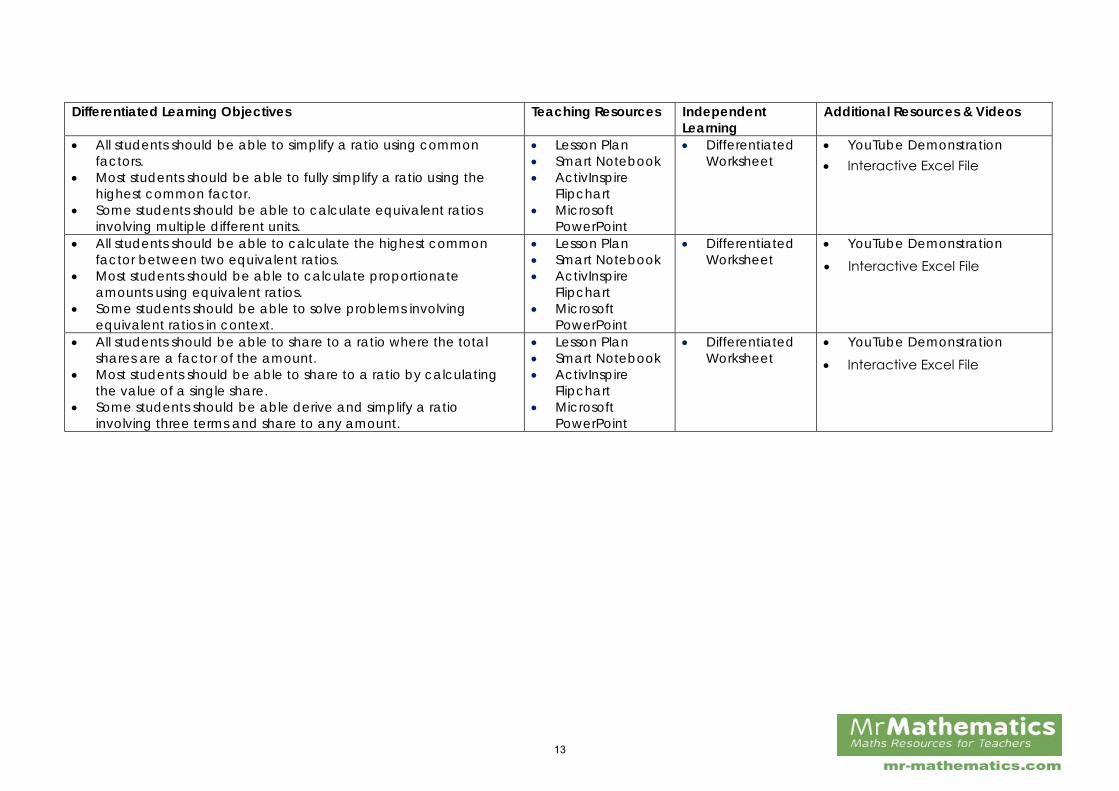
Differentiated Learning Objectives Teaching Resources Independent Learning
Additional Resources & Videos
All students should be able to simplify a ratio using commonfactors.
Most students should be able to fully simplify a ratio using thehighest common factor.
Some students should be able to calculate equivalent ratiosinvolving multiple different units.
Lesson Plan Smart Notebook ActivInspire
Flipchart Microsoft
PowerPoint
Differentiated Worksheet
YouTube Demonstration
All students should be able to calculate the highest commonfactor between two equivalent ratios.
Most students should be able to calculate proportionateamounts using equivalent ratios.
Some students should be able to solve problems involvingequivalent ratios in context.
Lesson Plan Smart Notebook ActivInspire
Flipchart Microsoft
PowerPoint
Differentiated Worksheet
YouTube Demonstration
All students should be able to share to a ratio where the totalshares are a factor of the amount.
Most students should be able to share to a ratio by calculatingthe value of a single share.
Some students should be able derive and simplify a ratioinvolving three terms and share to any amount.
Lesson Plan Smart Notebook ActivInspire
Flipchart Microsoft
PowerPoint
Differentiated Worksheet
YouTube Demonstration
Interactive Excel File
Interactive Excel File
Interactive Excel File
13
Topic: Linear Graphs Duration: 5 hours Prerequisite Knowledge
Interpret simple expressions as functions with
inputs and outputs;
Work with coordinates in all four quadrants
Keywords
Function Linear
Axes Graph
Gradient Intercept
Plot Scale
Continuous Table of Results
Parallel Perpendicular
Success Criteria
Plot graphs of equations that correspond to
straight-line graphs in the coordinate plane;
Find the equation of the line through two given
points, or through one point with a given
gradient
Identify and interpret gradients and intercepts of
linear functions graphically and algebraically
use the form y = mx + c to identify parallel and
perpendicular lines;
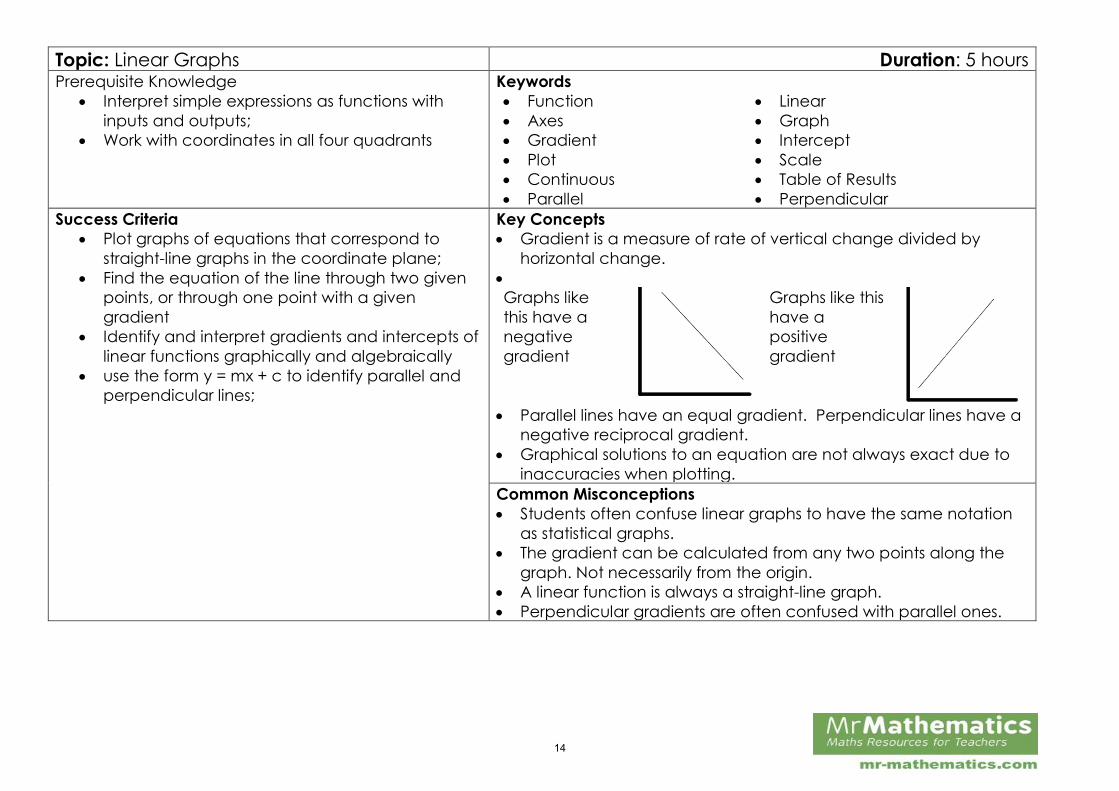
Key Concepts
Gradient is a measure of rate of vertical change divided by
horizontal change.
Graphs like
this have a
negative
gradient
Graphs like this
have a
positive
gradient
Parallel lines have an equal gradient. Perpendicular lines have a
negative reciprocal gradient.
Graphical solutions to an equation are not always exact due to
inaccuracies when plotting.
Common Misconceptions
Students often confuse linear graphs to have the same notation
as statistical graphs.
The gradient can be calculated from any two points along the
graph. Not necessarily from the origin.
A linear function is always a straight-line graph.
Perpendicular gradients are often confused with parallel ones.
14
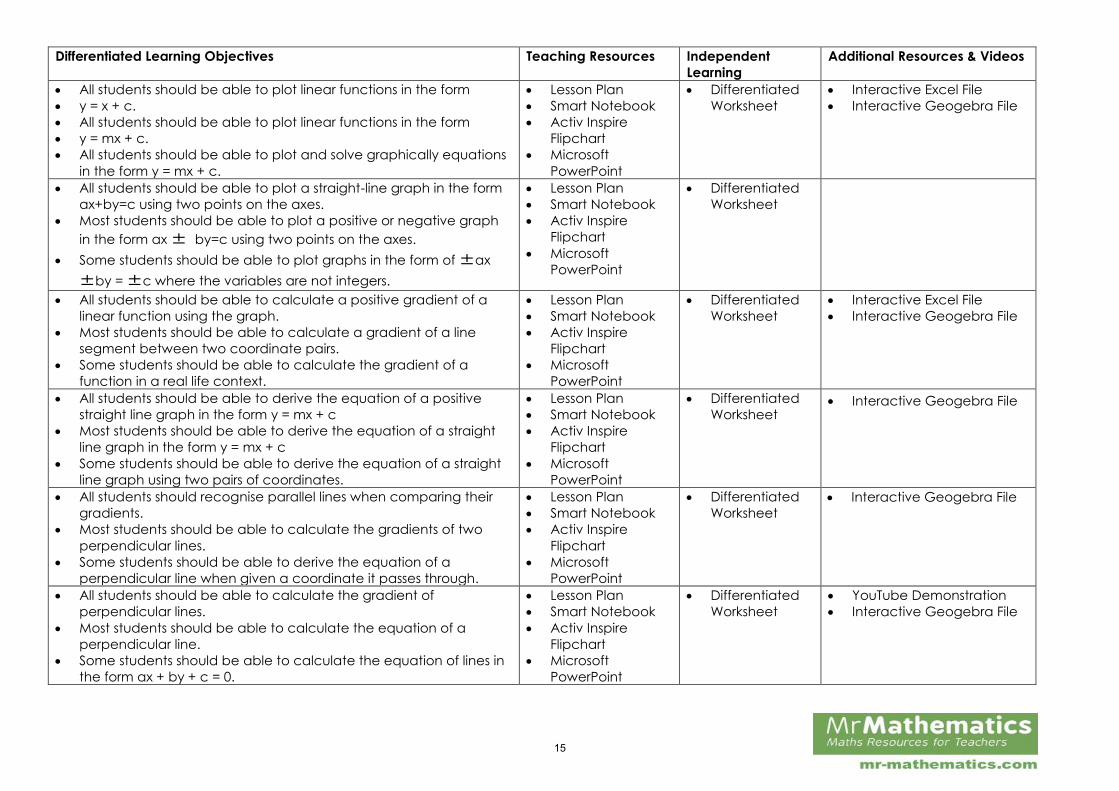
Differentiated Learning Objectives Teaching Resources Independent
Learning
Additional Resources & Videos
All students should be able to plot linear functions in the form
y = x + c.
All students should be able to plot linear functions in the form
y = mx + c.
All students should be able to plot and solve graphically equations
in the form y = mx + c.
Lesson Plan
Smart Notebook
Activ Inspire
Flipchart
Microsoft
PowerPoint
Differentiated
Worksheet
Interactive Excel File
Interactive Geogebra File
All students should be able to plot a straight-line graph in the form
ax+by=c using two points on the axes.
Most students should be able to plot a positive or negative graph
in the form ax ± by=c using two points on the axes.
Some students should be able to plot graphs in the form of ±ax
±by = ±c where the variables are not integers.
Lesson Plan
Smart Notebook
Activ Inspire
Flipchart
Microsoft
PowerPoint
Differentiated
Worksheet
All students should be able to calculate a positive gradient of a
linear function using the graph.
Most students should be able to calculate a gradient of a line
segment between two coordinate pairs.
Some students should be able to calculate the gradient of a
function in a real life context.
Lesson Plan
Smart Notebook
Activ Inspire
Flipchart
Microsoft
PowerPoint
Differentiated
Worksheet
Interactive Excel File
Interactive Geogebra File
All students should be able to derive the equation of a positive
straight line graph in the form y = mx + c
Most students should be able to derive the equation of a straight
line graph in the form y = mx + c
Some students should be able to derive the equation of a straight
line graph using two pairs of coordinates.
Lesson Plan
Smart Notebook
Activ Inspire
Flipchart
Microsoft
PowerPoint
Differentiated
Worksheet Interactive Geogebra File
All students should recognise parallel lines when comparing their
gradients.
Most students should be able to calculate the gradients of two
perpendicular lines.
Some students should be able to derive the equation of a
perpendicular line when given a coordinate it passes through.
Lesson Plan
Smart Notebook
Activ Inspire
Flipchart
Microsoft
PowerPoint
Differentiated
Worksheet
Interactive Geogebra File
All students should be able to calculate the gradient of
perpendicular lines.
Most students should be able to calculate the equation of a
perpendicular line.
Some students should be able to calculate the equation of lines in
the form ax + by + c = 0.
Lesson Plan
Smart Notebook
Activ Inspire
Flipchart
Microsoft
PowerPoint
Differentiated
Worksheet
YouTube Demonstration
Interactive Geogebra File
15
Topic: Representing Data Duration:7 hours Prerequisite Knowledge
interpret and construct:
o frequency tables
o bar charts
o pictograms
for categorical data.
Construct and interpret stem and leaf diagrams
Apply statistics to describe a population
Keywords
Statistical Diagram Histogram
Frequency Density Frequency
Class Width Cumulative Frequency
Box Plot Interquartile Range
Upper Quartile Lower Quartile
Trend Time Series
Spread Skew
Success Criteria
infer properties of populations or distributions
from a sample, whilst knowing the limitations of
sampling
interpret and construct tables and line graphs for
time series data and know their appropriate use
construct and interpret diagrams for grouped
discrete data and continuous data, i.e.
histograms with equal and unequal class
intervals and cumulative frequency graphs, and
know their appropriate use
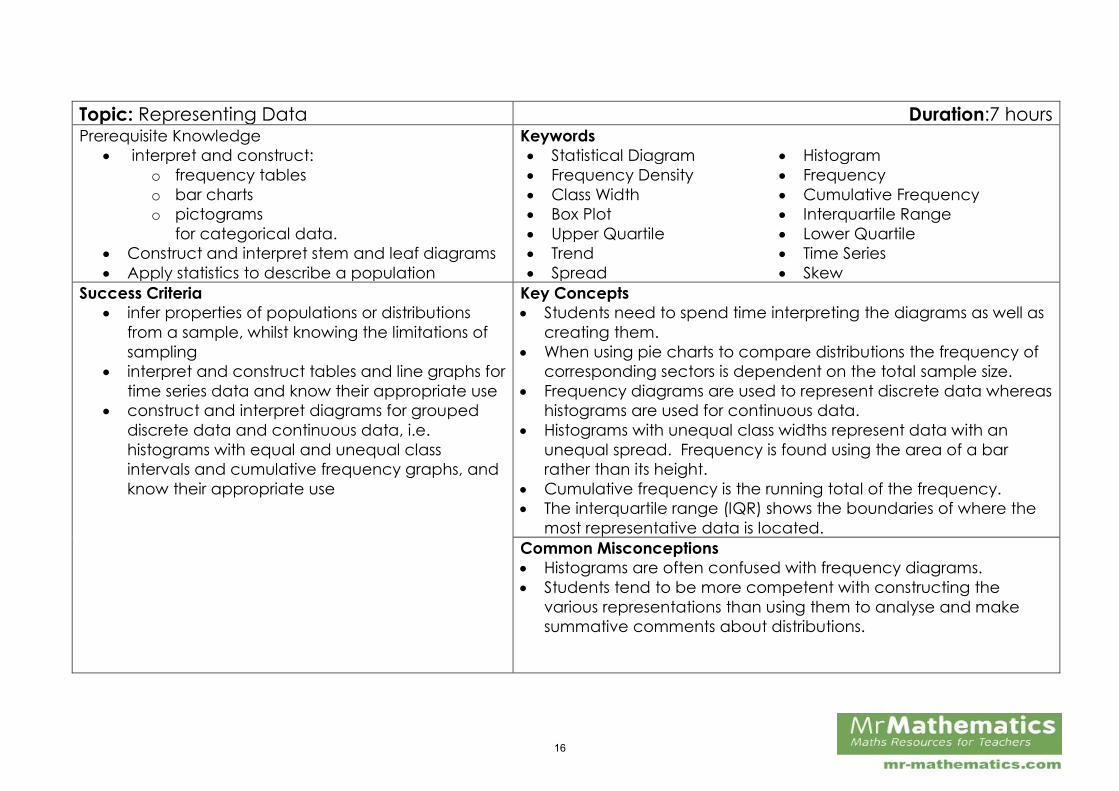
Key Concepts
Students need to spend time interpreting the diagrams as well as
creating them.
When using pie charts to compare distributions the frequency of
corresponding sectors is dependent on the total sample size.
Frequency diagrams are used to represent discrete data whereas
histograms are used for continuous data.
Histograms with unequal class widths represent data with an
unequal spread. Frequency is found using the area of a bar
rather than its height.
Cumulative frequency is the running total of the frequency.
The interquartile range (IQR) shows the boundaries of where the
most representative data is located.
Common Misconceptions
Histograms are often confused with frequency diagrams.
Students tend to be more competent with constructing the
various representations than using them to analyse and make
summative comments about distributions.
16
17
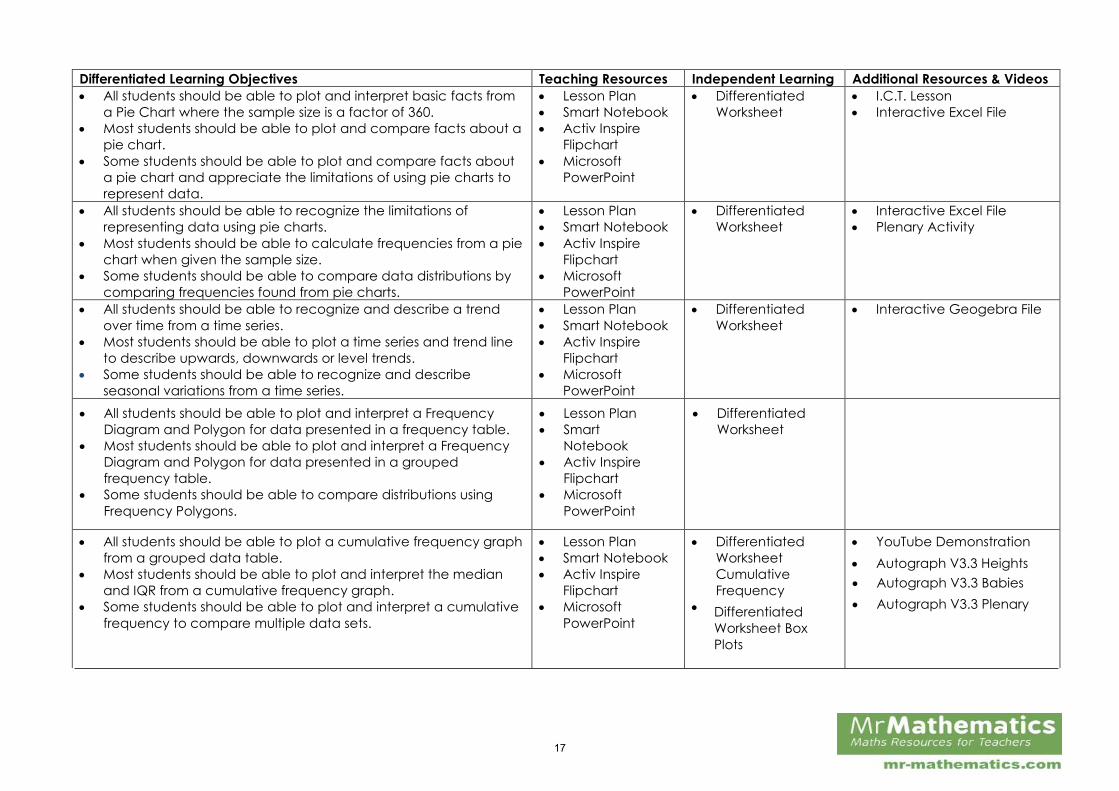
Differentiated Learning Objectives Teaching Resources Independent Learning Additional Resources & Videos
All students should be able to plot and interpret basic facts from
a Pie Chart where the sample size is a factor of 360.
Most students should be able to plot and compare facts about a
pie chart.
Some students should be able to plot and compare facts about
a pie chart and appreciate the limitations of using pie charts to
represent data.
Lesson Plan
Smart Notebook
Activ Inspire
Flipchart
Microsoft
PowerPoint
Differentiated
Worksheet
I.C.T. Lesson
Interactive Excel File
All students should be able to recognize the limitations of
representing data using pie charts.
Most students should be able to calculate frequencies from a pie
chart when given the sample size.
Some students should be able to compare data distributions by
comparing frequencies found from pie charts.
Lesson Plan
Smart Notebook
Activ Inspire
Flipchart
Microsoft
PowerPoint
Differentiated
Worksheet
Interactive Excel File
Plenary Activity
All students should be able to recognize and describe a trend
over time from a time series.
Most students should be able to plot a time series and trend line
to describe upwards, downwards or level trends.
Some students should be able to recognize and describe
seasonal variations from a time series.
Lesson Plan
Smart Notebook
Activ Inspire
Flipchart
Microsoft
PowerPoint
Differentiated
Worksheet
Interactive Geogebra File
All students should be able to plot a cumulative frequency graph
from a grouped data table.
Most students should be able to plot and interpret the median
and IQR from a cumulative frequency graph.
Some students should be able to plot and interpret a cumulative
frequency to compare multiple data sets.
Lesson Plan
Smart Notebook
Activ Inspire
Flipchart
Microsoft
PowerPoint
Differentiated
Worksheet
Cumulative
Frequency
Differentiated
Worksheet Box
Plots
YouTube Demonstration
Autograph V3.3 Heights Autograph V3.3 Babies Autograph V3.3 Plenary
All students should be able to plot and interpret a Frequency
Diagram and Polygon for data presented in a frequency table.
Most students should be able to plot and interpret a Frequency
Diagram and Polygon for data presented in a grouped
frequency table.
Some students should be able to compare distributions using
Frequency Polygons.
Lesson Plan
Smart
Notebook
Activ Inspire
Flipchart
Microsoft
PowerPoint
Differentiated
Worksheet
18
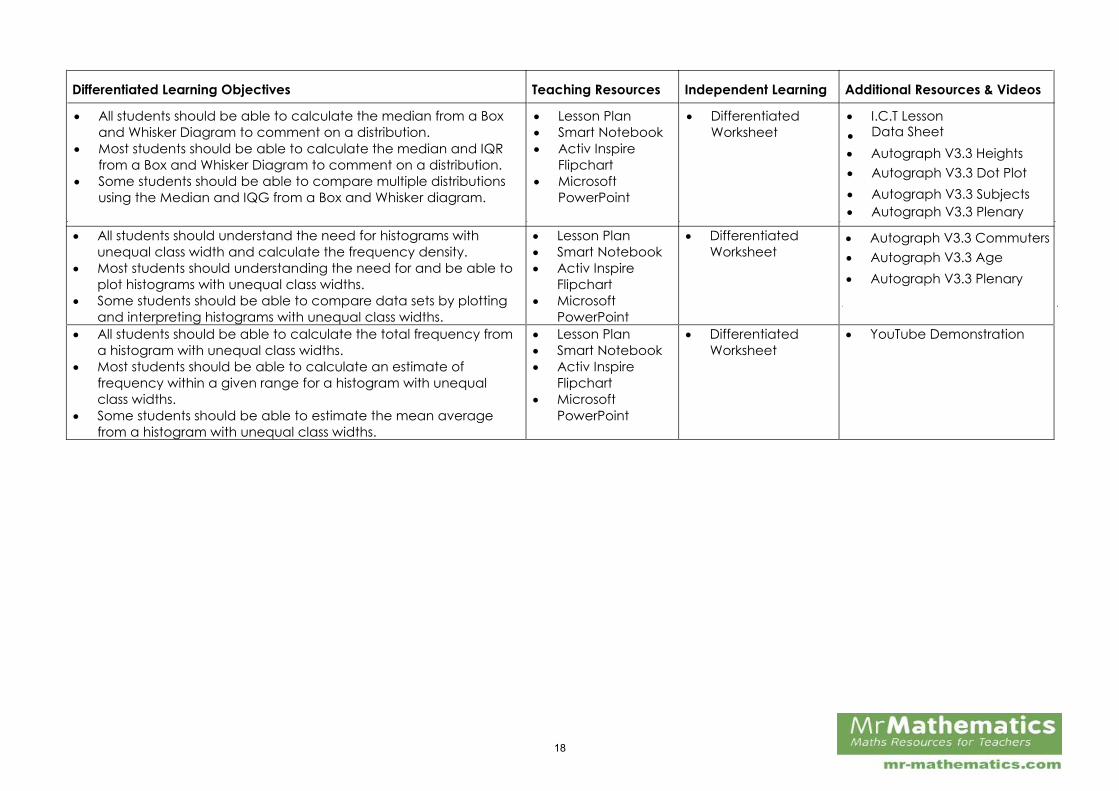
All students should understand the need for histograms with
unequal class width and calculate the frequency density.
Most students should understanding the need for and be able to
plot histograms with unequal class widths.
Some students should be able to compare data sets by plotting
and interpreting histograms with unequal class widths.
Lesson Plan
Smart Notebook
Activ Inspire
Flipchart
Microsoft
PowerPoint
Differentiated
Worksheet
All students should be able to calculate the total frequency from
a histogram with unequal class widths.
Most students should be able to calculate an estimate of
frequency within a given range for a histogram with unequal
class widths.
Some students should be able to estimate the mean average
from a histogram with unequal class widths.
Lesson Plan
Smart Notebook
Activ Inspire
Flipchart
Microsoft
PowerPoint
Differentiated
Worksheet
YouTube Demonstration
Autograph V3.3 Commuters Autograph V3.3 Age Autograph V3.3 Plenary
All students should be able to calculate the median from a Box
and Whisker Diagram to comment on a distribution.
Most students should be able to calculate the median and IQR
from a Box and Whisker Diagram to comment on a distribution.
Some students should be able to compare multiple distributions
using the Median and IQG from a Box and Whisker diagram.
Lesson Plan
Smart Notebook
Activ Inspire
Flipchart
Microsoft
PowerPoint
Differentiated
Worksheet
I.C.T Lesson
Data Sheet Autograph V3.3 Heights Autograph V3.3 Dot Plot Autograph V3.3 Subjects Autograph V3.3 Plenary
Differentiated Learning Objectives Teaching Resources Independent Learning Additional Resources & Videos
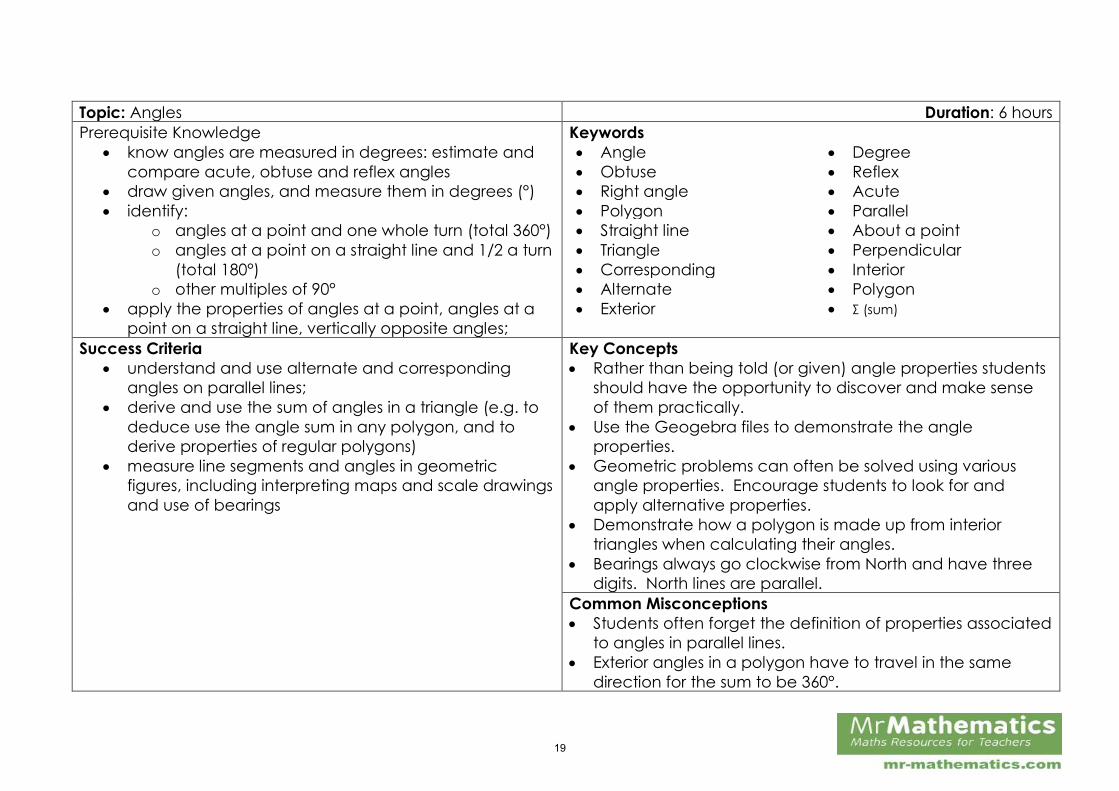
Topic: Angles Duration: 6 hours
Prerequisite Knowledge
know angles are measured in degrees: estimate and
compare acute, obtuse and reflex angles
draw given angles, and measure them in degrees (°)
identify:
o angles at a point and one whole turn (total 360°)
o angles at a point on a straight line and 1/2 a turn
(total 180°)
o other multiples of 90°
apply the properties of angles at a point, angles at a
point on a straight line, vertically opposite angles;
Keywords
Angle Degree
Obtuse Reflex
Right angle Acute
Polygon Parallel
Straight line About a point
Triangle Perpendicular
Corresponding Interior
Alternate Polygon
Exterior Σ (sum)
Success Criteria
understand and use alternate and corresponding
angles on parallel lines;
derive and use the sum of angles in a triangle (e.g. to
deduce use the angle sum in any polygon, and to
derive properties of regular polygons)
measure line segments and angles in geometric
figures, including interpreting maps and scale drawings
and use of bearings
Key Concepts
Rather than being told (or given) angle properties students
should have the opportunity to discover and make sense
of them practically.
Use the Geogebra files to demonstrate the angle
properties.
Geometric problems can often be solved using various
angle properties. Encourage students to look for and
apply alternative properties.
Demonstrate how a polygon is made up from interior
triangles when calculating their angles.
Bearings always go clockwise from North and have three
digits. North lines are parallel.
Common Misconceptions
Students often forget the definition of properties associated
to angles in parallel lines.
Exterior angles in a polygon have to travel in the same
direction for the sum to be 360°.
19
Differentiated Learning Objectives Teaching Resources Independent
Learning
Additional Resources &
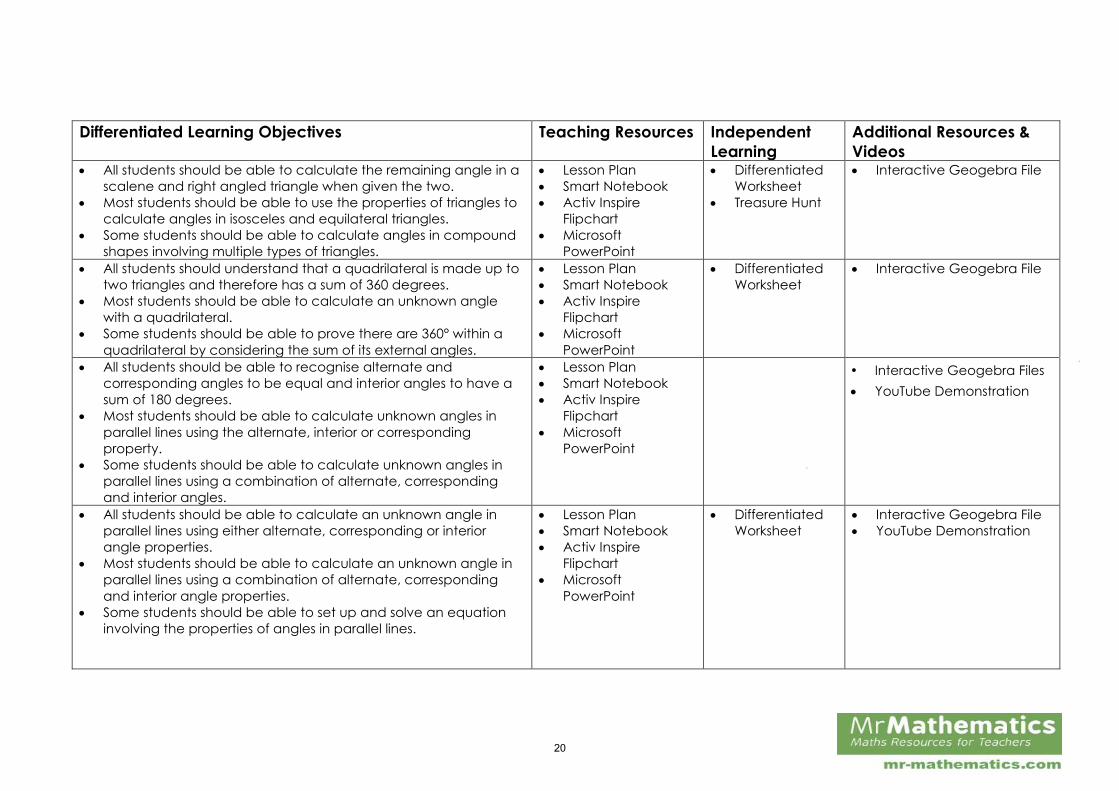
Videos All students should be able to calculate the remaining angle in a
scalene and right angled triangle when given the two.
Most students should be able to use the properties of triangles to
calculate angles in isosceles and equilateral triangles.
Some students should be able to calculate angles in compound
shapes involving multiple types of triangles.
Lesson Plan
Smart Notebook
Activ Inspire
Flipchart
Microsoft
PowerPoint
Differentiated
Worksheet
Treasure Hunt
Interactive Geogebra File
All students should understand that a quadrilateral is made up to
two triangles and therefore has a sum of 360 degrees.
Most students should be able to calculate an unknown angle
with a quadrilateral.
Some students should be able to prove there are 360° within a
quadrilateral by considering the sum of its external angles.
Lesson Plan
Smart Notebook
Activ Inspire
Flipchart
Microsoft
PowerPoint
Differentiated
Worksheet
Interactive Geogebra File
All students should be able to recognise alternate and
corresponding angles to be equal and interior angles to have a
sum of 180 degrees.
Most students should be able to calculate unknown angles in
parallel lines using the alternate, interior or corresponding
property.
Some students should be able to calculate unknown angles in
parallel lines using a combination of alternate, corresponding
and interior angles.
Lesson Plan
Smart Notebook
Activ Inspire
Flipchart
Microsoft
PowerPoint
YouTube Demonstration
All students should be able to calculate an unknown angle in
parallel lines using either alternate, corresponding or interior
angle properties.
Most students should be able to calculate an unknown angle in
parallel lines using a combination of alternate, corresponding
and interior angle properties.
Some students should be able to set up and solve an equation
involving the properties of angles in parallel lines.
Lesson Plan
Smart Notebook
Activ Inspire
Flipchart
Microsoft
PowerPoint
Differentiated
Worksheet
Interactive Geogebra File
YouTube Demonstration
• Interactive Geogebra Files
20
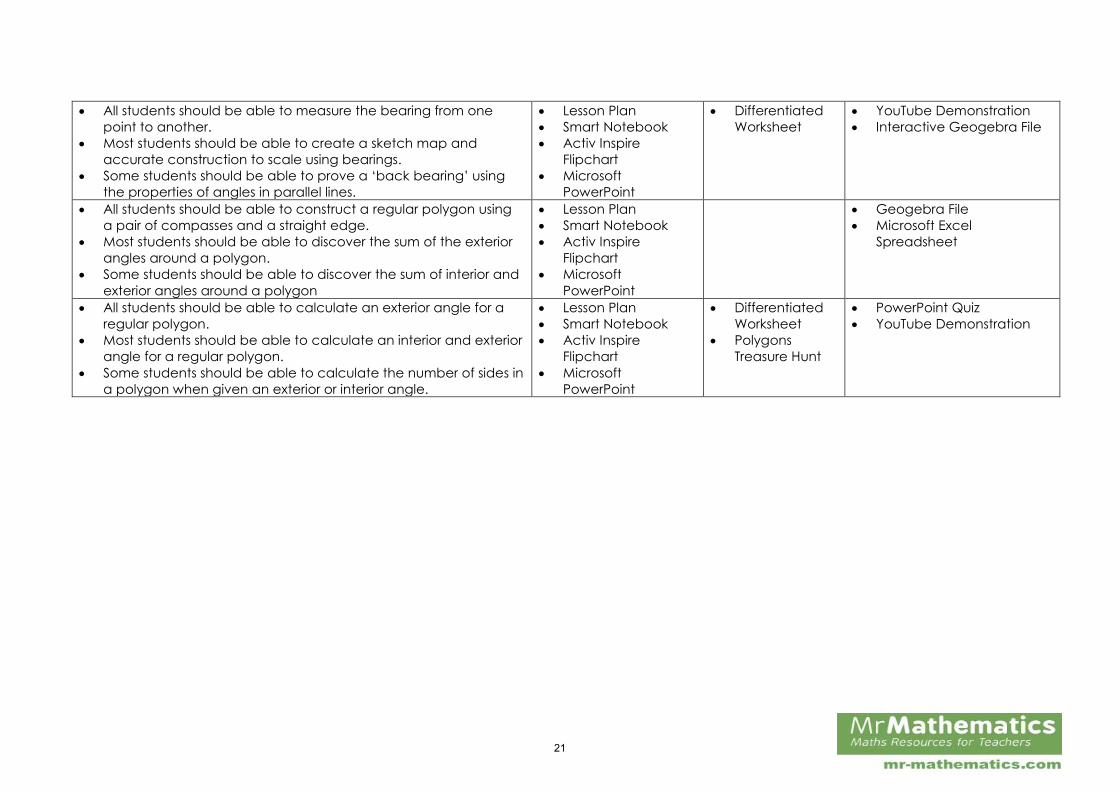
All students should be able to measure the bearing from one
point to another.
Most students should be able to create a sketch map and
accurate construction to scale using bearings.
Some students should be able to prove a ‘back bearing’ using
the properties of angles in parallel lines.
Lesson Plan
Smart Notebook
Activ Inspire
Flipchart
Microsoft
PowerPoint
Differentiated
Worksheet
YouTube Demonstration
Interactive Geogebra File
All students should be able to construct a regular polygon using
a pair of compasses and a straight edge.
Most students should be able to discover the sum of the exterior
angles around a polygon.
Some students should be able to discover the sum of interior and
exterior angles around a polygon
Lesson Plan
Smart Notebook
Activ Inspire
Flipchart
Microsoft
PowerPoint
Geogebra File
Microsoft Excel
Spreadsheet
All students should be able to calculate an exterior angle for a
regular polygon.
Most students should be able to calculate an interior and exterior
angle for a regular polygon.
Some students should be able to calculate the number of sides in
a polygon when given an exterior or interior angle.
Lesson Plan
Smart Notebook
Activ Inspire
Flipchart
Microsoft
PowerPoint
Differentiated
Worksheet
Polygons
Treasure Hunt
PowerPoint Quiz
YouTube Demonstration
21
Topic: Algebraic Expressions Duration:8 Hours Prerequisite Knowledge
• use simple formulae• generate and describe linear number sequences• express missing number problems algebraically• find pairs of numbers that satisfy an equation with two unknowns
Keywords • Algebra • Unknown• Expression • Substitute• Expand • Factorise• Product • Sum• Simplify • Like Terms• Binomial • Quadratic• Coefficient • Index Notation
Success Criteria • use and interpret algebraic notation, including:
o 𝑎𝑏 in place of 𝑎 + 𝑏o 3𝑦 in place of 3×𝑦o 𝑎2 in place of 𝑎×𝑎, 𝑎3 in place of 𝑎×𝑎×𝑎, 𝑎2𝑏 in place of
𝑎×𝑎×𝑏o
�b
in place of 𝑎 ÷ 𝑏
o coefficients written as fractions rather than decimalso brackets
• simplify and manipulate algebraic expressions by:o collecting like termso multiplying a single term over a bracketo taking out common factorso expanding products of two or more binomialso factorising quadratic expressions of the form 𝑥2 + 𝑏𝑥 + 𝑐,
including the difference of two squareso simplifying expressions involving sums, products and powers,
including the laws of indices
Key Concepts • Students need to appreciate that writing with algebra applies the
rules of arithmetic to unknown numbers which are represented as letters.
• It is important to define the difference between an expression,equation and formula.
• The multiplication symbol is omitted when using algebraic notation toavoid confusion between 𝑥 and ×. Quotients are written as using simplified fractions.
• Linear (𝑥), quadratic (𝑥2) and cube terms (𝑥3)cannot be collectedtogether.
• Understanding quadratics in the general form (𝑥2 + 𝑏𝑥 + 𝑐) helps tofactorise and expand expressions.
Common Misconceptions • Students often forget 𝑎𝑏 = 𝑏𝑎 = 𝑎 ×𝑏 and 𝑏 + 𝑎 = 𝑎 + 𝑎 = 𝑎 + 𝑏 when
collecting like terms. • When multiplying out brackets students incorrect forget to multiply the
second term especially with negative products. E.g., 2 𝑥 + 5 = 2𝑥 + 5 and −2 𝑥 − 5 = −2𝑥 + 5.
• When factorising expressions a common misconception is to not fullyfactorise. E.g., 18𝑥 + 24𝑦 = 9𝑥 + 12𝑦
• When expanding the product of two or more brackets students oftenincorrectly collect the like terms associated to the linear unknown.
• Students often struggle to factorise quadratics when 'a' is not one.Encourage them to expand their solution to double check correctfactorisation.
o factorising quadratic expressions of the form ax2 + bx + c.
22
Differentiated Learning Objectives Teaching Resources
Independent Learning
Additional Resources & Videos
• All students should be able to simplify like terms involving one • Lesson Plan • • Interactive Excel Fileunknown. • Smart
Differentiated Worksheet
• Most students should be able to simplify like terms involving Notebook • Tarsia Activitymultiple unknowns and constants. • Activ Inspire
• Some students should be able to simplify like terms using addition Flipchartand subtractions involving multiple unknowns and constants. • Microsoft
PowerPoint
• All students should be able to simplify the product and quotient • Lesson Plan •of an unknown and number. • Smart
Differentiated Worksheet
• Most students should be able to simplify a product and quotient Notebookinvolving powers. • Activ Inspire
• Some students should be able to calculate the area of a Flipchartrectangle with algebraic lengths. • Microsoft
PowerPoint
• All students should be able to substitute a known value into an • Lesson Plan • • Interactive Excel Filealgebraic expression in the form 𝑎𝑥 + 𝑏 • Smart
Differentiated Worksheet
• Most students should be able to substitute a known value into analgebraic expression in the form 5
X + 𝑏
• Some students should be able to substitute a known value into
Notebook• Activ Inspire
Flipchart
an algebraic expression in the form a +b-
• MicrosoftPowerPoint
• All students should be able to expand a pair of brackets with a • Lesson Plan • • Interactive Excel Fileconstant on the outside. • Smart
Differentiated Worksheet
• Most students should be able to expand two pairs of brackets Notebook • Tarsia Activityand simplify the result. • Activ Inspire
• Some students should be able to expand two pairs of brackets Flipchartone with a negative on the outside. • Microsoft
PowerPoint
23
• Most students should be able to fully factorise an algebraicexpression in the form ax2+bx where a and b are both constants.
• Some students should be able to fully factorise an algebraicexpression the form ax2y + bxy2 where a and b are bothconstants.
Notebook• Activ Inspire
Flipchart• Microsoft
PowerPoint
• All students should be able to expand and simplify two bracketsin the form (x+a)(x+b).
• Most students should be able to expand and simplify twobrackets in the form (x±a)(x±b).
• Some students should be able to expand and simplify twobrackets in the form (ax±c)(bx±d).
• Lesson Plan• Smart
Notebook• Activ Inspire
Flipchart• Microsoft
PowerPoint
• DifferentiatedWorksheet
• Interactive Excel File
• All students should be able to factorise quadratics in the formax2+bx+c where a = 1 and both factors are positive.
• Most students should be able to factorise quadratics in the formax2+bx+c where a = 1 and either or both factors are negative.
• Some students should be able to factorise quadratics using thedifference of two squares.
• Lesson Plan• Smart
Notebook• Activ Inspire
Flipchart• Microsoft
PowerPoint
• DifferentiatedWorksheet
• Tarsia Activity
• Interactive Excel File
•
•
•
• Lesson Plan• Smart
Notebook• Activ Inspire
Flipchart• Microsoft
PowerPoint
• DifferentiatedWorksheet
• Interactive Excel FileAll students should be able to factorise a quadratic where the coefficient of x2 is a prime number and the constant is a positive integer.Most students should be able to factorise a quadratic where the coefficient of x2 is a prime number and the constant is a positive or negative integer.Some students should be able to factorise a quadratic where the coefficient of x2 is a non prime number and the constant is a positive or negative integer.
• All students should be able to fully factorise an algebraicexpression in the form ax+b where a and b are both constants.
• Lesson Plan• Smart
• DifferentiatedWorksheet
• Interactive Excel File
24
Topic: Collecting Data Duration: 4 hours Prerequisite Knowledge
Interpret and construct statistical diagrams for discrete and
continuous data and know their appropriate use.
interpret, analyse and compare the distributions of data sets from
univariate empirical distributions through:
o appropriate graphical representation involving discrete,
continuous and grouped data
o appropriate measures of central tendency (median,
mean, mode and modal class) and spread
Keywords
Sample Handling Data Cycle
Survey Questionnaire
Discrete Continuous
Quantitative Qualitative
Two-way table Bias
Stratified Strata
Proportion Stratum
Success Criteria
Infer properties of populations or distributions from a sample, whilst
knowing the limitations of sampling.
apply statistics to describe a population
Interpret, analyse and compare the distributions of data sets from
univariate empirical distributions through appropriate graphical
representation involving discrete, continuous and grouped data.
Key Concepts
Students need to understand the benefits of using two-way tables as a
means to exhaustively cover each outcome for multiple events and
use them to calculate probabilities.
When designing questionnaires students need to consider time periods,
multiple check boxes which do not overlap and the need to collect a
wide ranging sample to reduce bias.
It is important to recognise the different statistical techniques that are
used to analyse and represent qualitative, quantitative, discrete and
continuous data.
Stratified sampling takes an equal proportion of the data from each
category quota sampling takes an equal number of samples.
Common Misconceptions
Students often have difficulty designing two-way tables.
When designing questionnaires common errors include:
o No time period
o Overlapping responses
o Lack of ‘none’ or ‘other’ option.
o Check boxes with unequal widths.
o Double negative questions.
Students often try to represent continuous data using methods that are
only applicable for discrete sets.
25
Differentiated Learning Objectives Teaching
Resources
Independent
Learning
Additional Resources & Videos
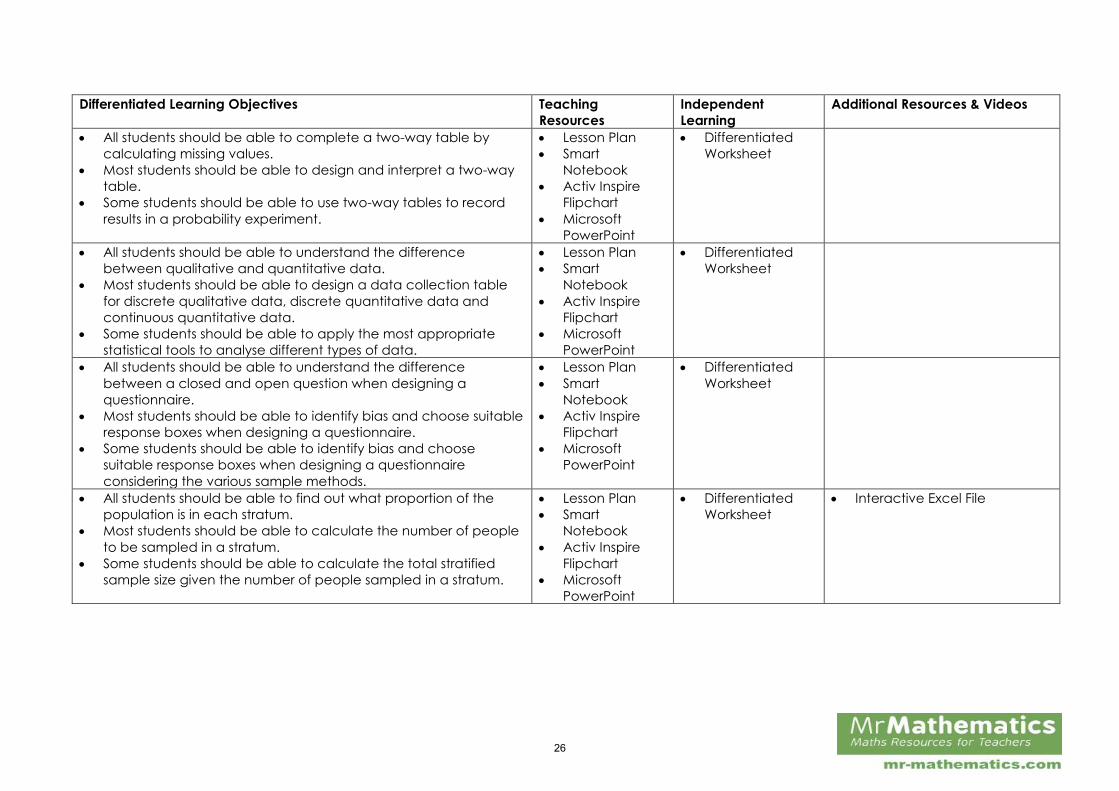
All students should be able to complete a two-way table by
calculating missing values.
Most students should be able to design and interpret a two-way
table.
Some students should be able to use two-way tables to record
results in a probability experiment.
Lesson Plan
Smart
Notebook
Activ Inspire
Flipchart
Microsoft
PowerPoint
Differentiated
Worksheet
All students should be able to understand the difference
between qualitative and quantitative data.
Most students should be able to design a data collection table
for discrete qualitative data, discrete quantitative data and
continuous quantitative data.
Some students should be able to apply the most appropriate
statistical tools to analyse different types of data.
Lesson Plan
Smart
Notebook
Activ Inspire
Flipchart
Microsoft
PowerPoint
Differentiated
Worksheet
All students should be able to understand the difference
between a closed and open question when designing a
questionnaire.
Most students should be able to identify bias and choose suitable
response boxes when designing a questionnaire.
Some students should be able to identify bias and choose
suitable response boxes when designing a questionnaire
considering the various sample methods.
Lesson Plan
Smart
Notebook
Activ Inspire
Flipchart
Microsoft
PowerPoint
Differentiated
Worksheet
All students should be able to find out what proportion of the
population is in each stratum.
Most students should be able to calculate the number of people
to be sampled in a stratum.
Some students should be able to calculate the total stratified
sample size given the number of people sampled in a stratum.
Lesson Plan
Smart
Notebook
Activ Inspire
Flipchart
Microsoft
PowerPoint
Differentiated
Worksheet
Interactive Excel File
26
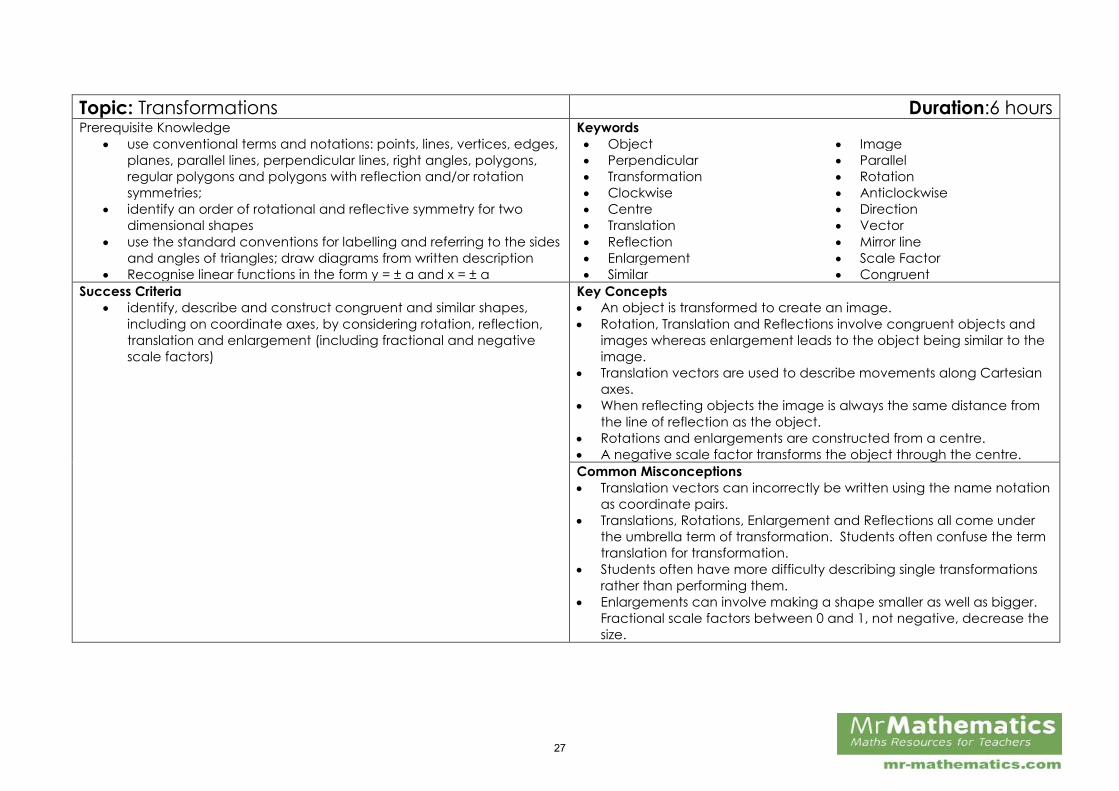
Topic: Transformations Duration:6 hours Prerequisite Knowledge
use conventional terms and notations: points, lines, vertices, edges,
planes, parallel lines, perpendicular lines, right angles, polygons,
regular polygons and polygons with reflection and/or rotation
symmetries;
identify an order of rotational and reflective symmetry for two
dimensional shapes
use the standard conventions for labelling and referring to the sides
and angles of triangles; draw diagrams from written description
Recognise linear functions in the form y = ± a and x = ± a
Keywords
Object Image
Perpendicular Parallel
Transformation Rotation
Clockwise Anticlockwise
Centre Direction
Translation Vector
Reflection Mirror line
Enlargement Scale Factor
Similar Congruent
Success Criteria
identify, describe and construct congruent and similar shapes,
including on coordinate axes, by considering rotation, reflection,
translation and enlargement (including fractional and negative
scale factors)
Key Concepts
An object is transformed to create an image.
Rotation, Translation and Reflections involve congruent objects and
images whereas enlargement leads to the object being similar to the
image.
Translation vectors are used to describe movements along Cartesian
axes.
When reflecting objects the image is always the same distance from
the line of reflection as the object.
Rotations and enlargements are constructed from a centre.
A negative scale factor transforms the object through the centre.
Common Misconceptions
Translation vectors can incorrectly be written using the name notation
as coordinate pairs.
Translations, Rotations, Enlargement and Reflections all come under
the umbrella term of transformation. Students often confuse the term
translation for transformation.
Students often have more difficulty describing single transformations
rather than performing them.
Enlargements can involve making a shape smaller as well as bigger.
Fractional scale factors between 0 and 1, not negative, decrease the
size.
27
Differentiated Learning Objectives Teaching Resources Independent
Learning
Additional Resources & Videos
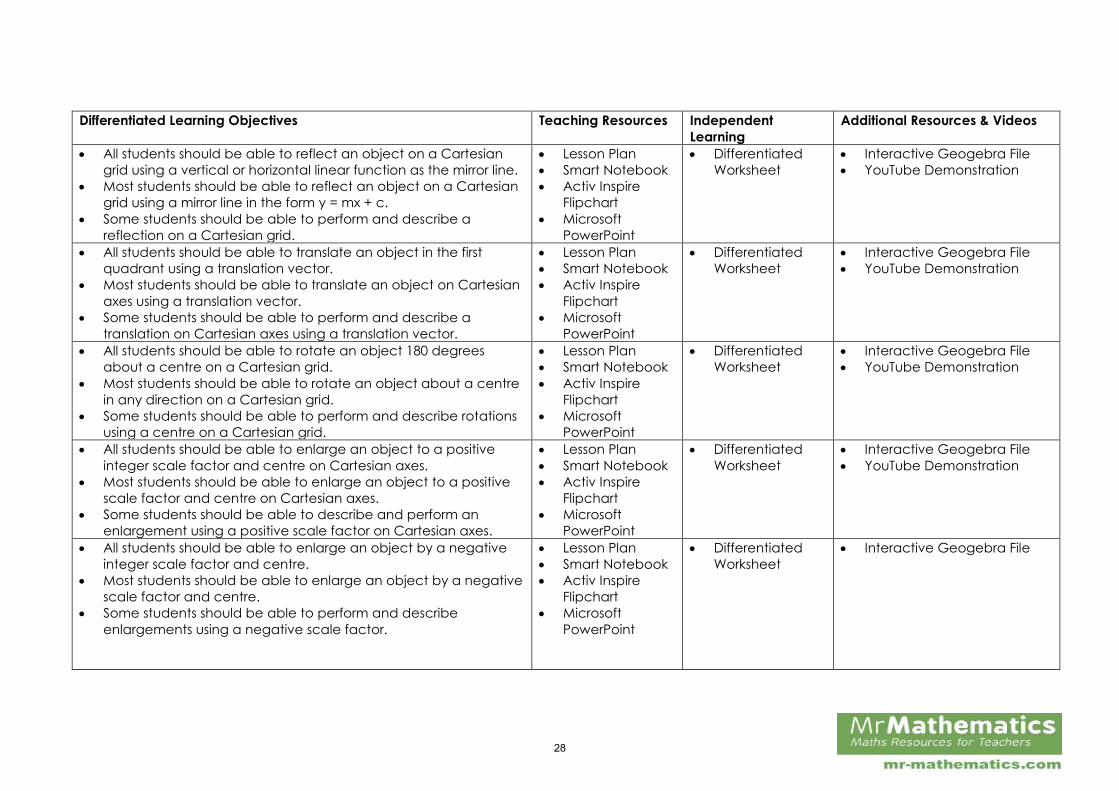
All students should be able to reflect an object on a Cartesian
grid using a vertical or horizontal linear function as the mirror line.
Most students should be able to reflect an object on a Cartesian
grid using a mirror line in the form y = mx + c.
Some students should be able to perform and describe a
reflection on a Cartesian grid.
Lesson Plan
Smart Notebook
Activ Inspire
Flipchart
Microsoft
PowerPoint
Differentiated
Worksheet
Interactive Geogebra File
YouTube Demonstration
All students should be able to translate an object in the first
quadrant using a translation vector.
Most students should be able to translate an object on Cartesian
axes using a translation vector.
Some students should be able to perform and describe a
translation on Cartesian axes using a translation vector.
Lesson Plan
Smart Notebook
Activ Inspire
Flipchart
Microsoft
PowerPoint
Differentiated
Worksheet
Interactive Geogebra File
YouTube Demonstration
All students should be able to rotate an object 180 degrees
about a centre on a Cartesian grid.
Most students should be able to rotate an object about a centre
in any direction on a Cartesian grid.
Some students should be able to perform and describe rotations
using a centre on a Cartesian grid.
Lesson Plan
Smart Notebook
Activ Inspire
Flipchart
Microsoft
PowerPoint
Differentiated
Worksheet
Interactive Geogebra File
YouTube Demonstration
All students should be able to enlarge an object to a positive
integer scale factor and centre on Cartesian axes.
Most students should be able to enlarge an object to a positive
scale factor and centre on Cartesian axes.
Some students should be able to describe and perform an
enlargement using a positive scale factor on Cartesian axes.
Lesson Plan
Smart Notebook
Activ Inspire
Flipchart
Microsoft
PowerPoint
Differentiated
Worksheet
Interactive Geogebra File
YouTube Demonstration
All students should be able to enlarge an object by a negative
integer scale factor and centre.
Most students should be able to enlarge an object by a negative
scale factor and centre.
Some students should be able to perform and describe
enlargements using a negative scale factor.
Lesson Plan
Smart Notebook
Activ Inspire
Flipchart
Microsoft
PowerPoint
Differentiated
Worksheet
Interactive Geogebra File
28
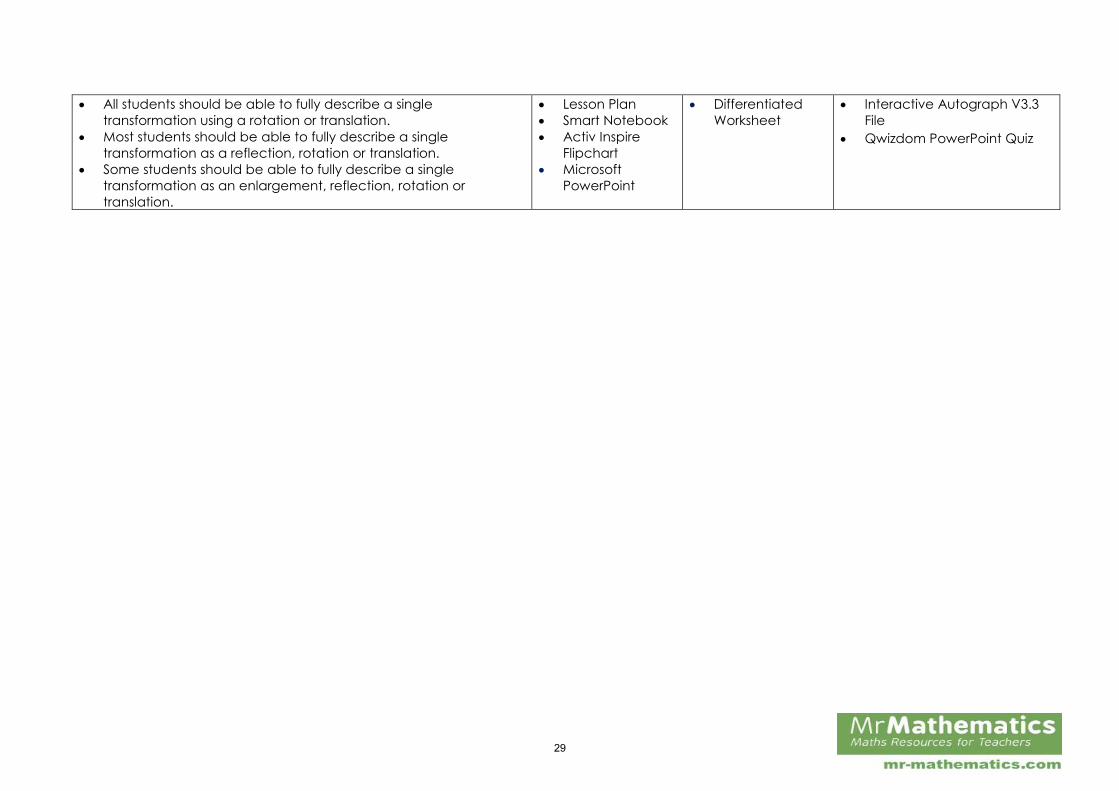
All students should be able to fully describe a single
transformation using a rotation or translation.
Most students should be able to fully describe a single
transformation as a reflection, rotation or translation.
Some students should be able to fully describe a single
transformation as an enlargement, reflection, rotation or
translation.
Lesson Plan
Smart Notebook
Activ Inspire
Flipchart
Microsoft
PowerPoint
Differentiated
Worksheet
Interactive Autograph V3.3
File
Qwizdom PowerPoint Quiz
29
Topic: Equations Duration: 7 hoursPrerequisite Knowledge
use simple formulae
generate and describe linear number sequences
express missing number problems algebraically
find pairs of numbers that satisfy an equation with two
unknowns
use and interpret algebraic notation
simplify and manipulate algebraic expressions by:
o collecting like terms
o multiplying a single term over a bracket
Keywords
Algebra Equation
Brackets Expression
Solve Solution
Equals (=) Symbol
Unknown Variable
verify Elimination Method
Simultaneous Equation Linear Equation
Coefficient Substitution
Lowest Common Multiple
Success Criteria
solve linear equations in one unknown algebraically
(including those with the unknown on both sides of the
equation)
solve two simultaneous equations in two variables
algebraically;
find approximate solutions to simultaneous equations in two
variables using a graph;
Translate simple situations or procedures into algebraic
expressions or formulae; derive an equation (or two
simultaneous equations), solve the equation(s) and interpret
the solution.
Key Concepts
To solve an equation is to find the only value (or values) of the
unknown that make the mathematical sentence correct.
For every unknown an equation is needed.
Students need to have a secure understanding of adding and
subtracting with negatives when eliminating an unknown.
Coefficients need to be equal in magnitude to eliminate an
unknown.
Common Misconceptions
Students can forget to apply the same operation to both sides
of the equation therefore leaving it unbalanced.
Students often struggle knowing when to add or subtract the
equations to eliminate the unknown. Review addition with
negatives to address this.
Equations need to be aligned so that unknowns can be easily
added or subtracted. If equations are not aligned students
may add or subtract with non like variables.
Students often try to eliminate variables with their coefficients
being equal
30
Differentiated Learning Objectives Teaching Resources Independent
Learning
Additional Resources &
Videos All students should be able to solve a two-step linear equation
where the unknown appears on one side.
Most students should be able to solve a linear equation involving
a fraction where the unknown appears on one side.
Some students should be able to derive and solve a two-step
linear equation where the unknown appears on one side.
Lesson Plan
Smart Notebook
Activ Inspire Flipchart
Microsoft PowerPoint
Differentiated
Worksheet
Interactive Excel File
All students should be able to solve equations with the unknown
on both sides
Most students should be able to solve equations with the
unknown on both sides involving brackets.
Some students should be able to solve equations with the
unknown on both sides involving fractions and brackets.
Lesson Plan
Smart Notebook
Activ Inspire Flipchart
Microsoft PowerPoint
Differentiated
Worksheet
Interactive Excel File
YouTube Demonstration
All students should be able to solve a quadratic equation in the
form x2+ab=c using trial and improvement.
Most students should be able to solve a quadratic and cubic
equation using trial and improvement.
Some students should be able to solve any none linear equation
using trial and improvements as well as derive the equation using
known facts.
Lesson Plan
Smart Notebook
Activ Inspire Flipchart
Microsoft PowerPoint
Differentiated
Worksheet
Interactive Excel File
All students should be able to solve equations involving fractions
using the balance method.
Most students should be able to solve equations involving
addition and subtraction of fractions.
Some students should be able to recognise equations that will
lead to quadratics.
Lesson Plan
Smart Notebook
Activ Inspire Flipchart
Microsoft PowerPoint
Differentiated
Worksheet
YouTube Demonstration
All students should be able to plot a linear function.
Most students should be able to solve a pair of simultaneous
equations with integer solutions graphically.
Some students should be able to generate and solve a pair of
simultaneous equations graphically.
Lesson Plan
Smart Notebook
Activ Inspire Flipchart
Microsoft PowerPoint
Differentiated
Worksheet
Treasure Hunt
Tarsia Activity
31
All students should be able to solve a pair of equations
simultaneously using the method of elimination given equal
coefficients of one unknown.
Most students should be able to solve a pair of equations
simultaneously using the method of elimination where one
coefficient is a factor of the other.
Some students should be able to derive and solve a pair of
equations simultaneously using the method of elimination where
one coefficient is a factor of the other.
Lesson Plan
Smart Notebook
Activ Inspire Flipchart
Microsoft PowerPoint
Differentiated
Worksheet
Interactive Excel File
All students should be able to solve a pair of simultaneous
equations with different coefficients using the elimination method
Most students should be able to derive and solve a pair of
simultaneous equations by equating two unknowns.
Some students should be able to equate two unknowns from a
diagram and solve using the method of elimination.
Lesson Plan
Smart Notebook
Activ Inspire Flipchart
Microsoft PowerPoint
Differentiated
Worksheet
Interactive Excel File
YouTube Demonstration
32
Duration: 4 hours Topic: Scatter GraphsPrerequisite Knowledge
• solve comparison, sum and difference problems usinginformation presented in a line graph
• Interpret and present discrete and continuous data usingappropriate graphical methods, including bar charts and timegraphs.
• work with coordinates in all four quadrants
Keywords • Scatter Graph • Line of best Fit• Scale • Axes• Axis • Correlation• Positive Correlation • Negative Correlation• No Correlation • Strong• Week • Association• Causal Relationship • Linear Relationship
Success Criteria • apply statistics to describe a population• use and interpret scatter graphs of bivariate data; recognise
correlation and know that it does not indicate causation;• draw estimated lines of best fit; make predictions; interpolate and
extrapolate apparent trends whilst knowing the dangers of sodoing
Key Concepts • Scatter graphs need to be drawn on graph paper or using I.C.T to
ensure accuracy and help identify the line of best fit.• Two measurements are ‘associated’ if the points lie approximately
along a straight line. This shows a linear relationship. However, anassociation between two variables can exist in a non-linearrelationship.
• Correlation is used to describe the strength of a linear relationshipbetween two variables. If no correlation exists (the points do notappear to follow a trend of direction) the two variables areconsidered to have no linear relationship.
Common Misconceptions • Students often have difficulty choosing a suitable scale to use for
each axis. Encourage the use of graph paper to ensure the graph isappropriately scaled.
• When drawing the line of best fit by eye it should represent thedirectional trend of the data. It does not have to intersect the origin ortravel through every point.
• Correlation does not always imply a causal relationship since otherfactors could contribute.
33
Differentiated Learning Objectives Teaching Resources Independent Learning
Additional Resources & Videos
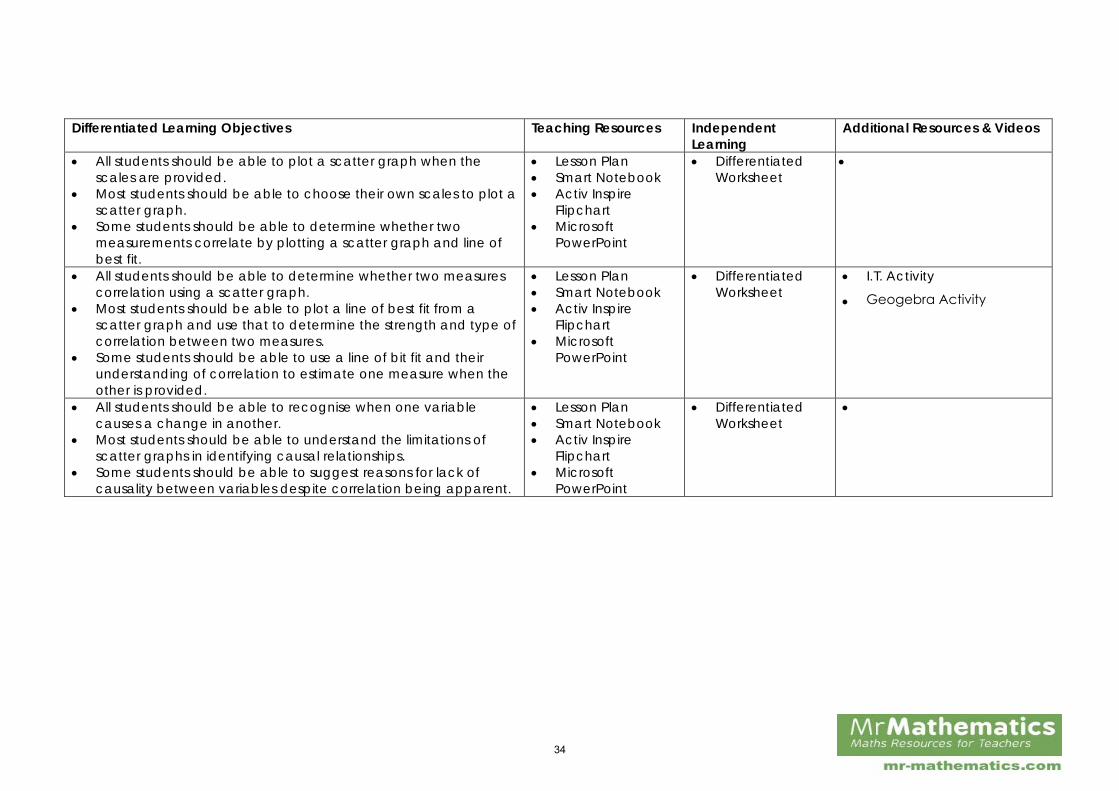
All students should be able to plot a scatter graph when thescales are provided.
Most students should be able to choose their own scales to plot ascatter graph.
Some students should be able to determine whether twomeasurements correlate by plotting a scatter graph and line ofbest fit.
• Lesson Plan• Smart Notebook• Activ Inspire
Flipchart• Microsoft
PowerPoint
• DifferentiatedWorksheet
•
All students should be able to determine whether two measurescorrelation using a scatter graph.
Most students should be able to plot a line of best fit from ascatter graph and use that to determine the strength and type ofcorrelation between two measures.
Some students should be able to use a line of bit fit and theirunderstanding of correlation to estimate one measure when theother is provided.
• Lesson Plan• Smart Notebook• Activ Inspire
Flipchart• Microsoft
PowerPoint
• DifferentiatedWorksheet
• I.T. Activity
All students should be able to recognise when one variablecauses a change in another.
Most students should be able to understand the limitations ofscatter graphs in identifying causal relationships.
Some students should be able to suggest reasons for lack ofcausality between variables despite correlation being apparent.
• Lesson Plan• Smart Notebook• Activ Inspire
Flipchart• Microsoft
PowerPoint
• DifferentiatedWorksheet
•
• Geogebra Activity
34
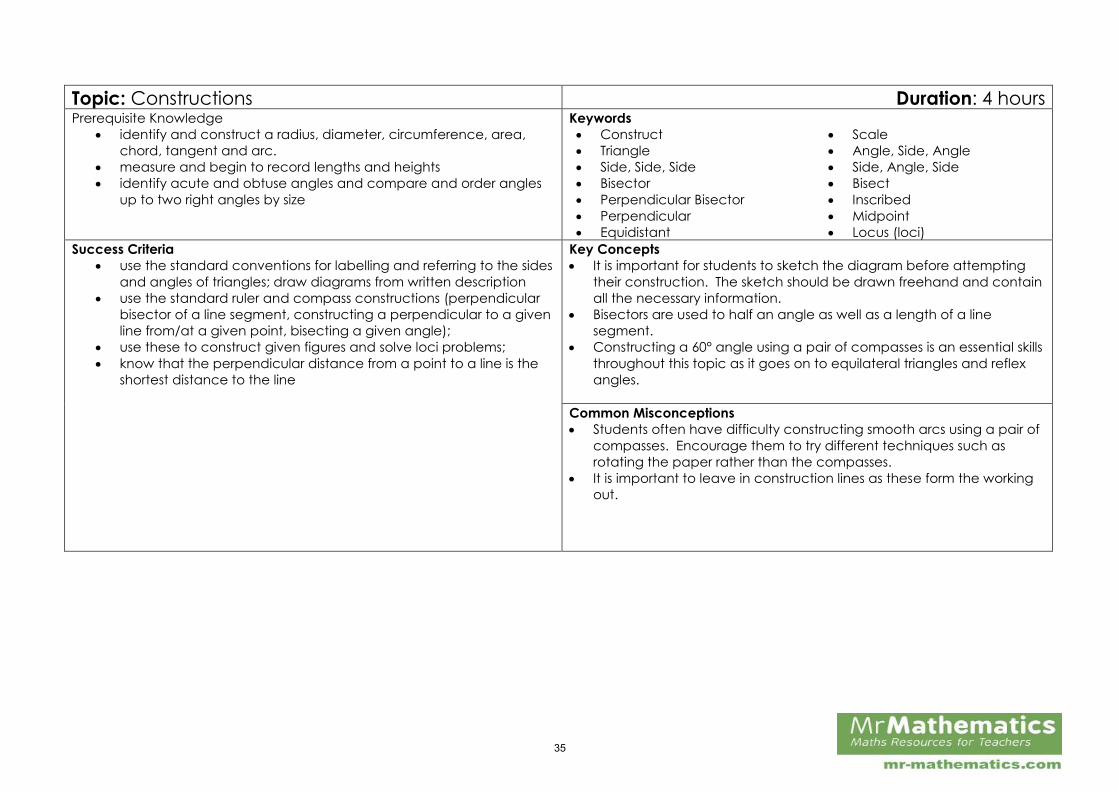
Topic: Constructions Duration: 4 hoursPrerequisite Knowledge
identify and construct a radius, diameter, circumference, area,
chord, tangent and arc.
measure and begin to record lengths and heights
identify acute and obtuse angles and compare and order angles
up to two right angles by size
Keywords
Construct Scale
Triangle Angle, Side, Angle
Side, Side, Side Side, Angle, Side
Bisector Bisect
Perpendicular Bisector Inscribed
Perpendicular Midpoint
Equidistant Locus (loci)
Success Criteria
use the standard conventions for labelling and referring to the sides
and angles of triangles; draw diagrams from written description
use the standard ruler and compass constructions (perpendicular
bisector of a line segment, constructing a perpendicular to a given
line from/at a given point, bisecting a given angle);
use these to construct given figures and solve loci problems;
know that the perpendicular distance from a point to a line is the
shortest distance to the line
Key Concepts
It is important for students to sketch the diagram before attempting
their construction. The sketch should be drawn freehand and contain
all the necessary information.
Bisectors are used to half an angle as well as a length of a line
segment.
Constructing a 60° angle using a pair of compasses is an essential skills
throughout this topic as it goes on to equilateral triangles and reflex
angles.
Common Misconceptions
Students often have difficulty constructing smooth arcs using a pair of
compasses. Encourage them to try different techniques such as
rotating the paper rather than the compasses.
It is important to leave in construction lines as these form the working
out.
35
Differentiated Learning Objectives Teaching Resources Independent Learning Additional Resources &
Videos
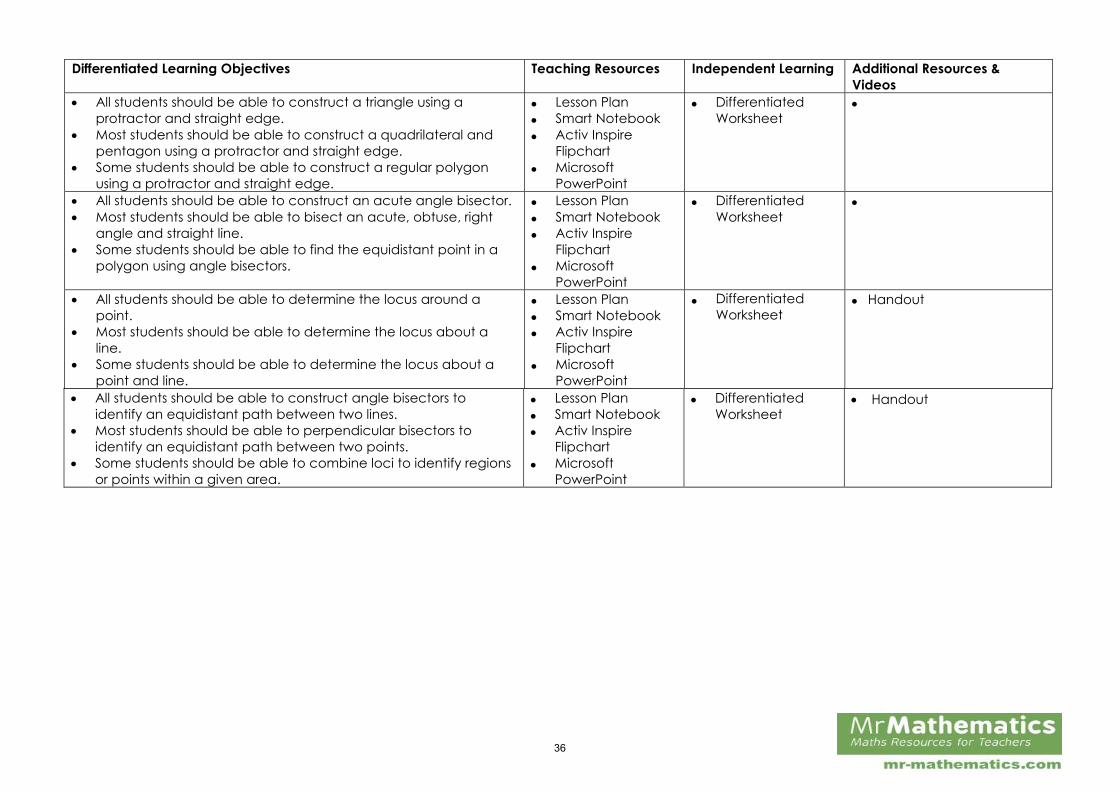
All students should be able to construct a triangle using a
protractor and straight edge.
Most students should be able to construct a quadrilateral and
pentagon using a protractor and straight edge.
Some students should be able to construct a regular polygon
using a protractor and straight edge.
Lesson Plan
Smart Notebook
Activ Inspire
Flipchart
Microsoft
PowerPoint
Differentiated Worksheet
All students should be able to construct an acute angle bisector.
Most students should be able to bisect an acute, obtuse, right
angle and straight line.
Some students should be able to find the equidistant point in a
polygon using angle bisectors.
Lesson Plan
Smart Notebook
Activ Inspire
Flipchart
Microsoft
PowerPoint
Differentiated
Worksheet
All students should be able to determine the locus around a
point.
Most students should be able to determine the locus about a
line.
Some students should be able to determine the locus about a
point and line.
Lesson Plan
Smart Notebook
Activ Inspire
Flipchart
Microsoft
PowerPoint
Differentiated
Worksheet Handout
All students should be able to construct angle bisectors to
identify an equidistant path between two lines.
Most students should be able to perpendicular bisectors to
identify an equidistant path between two points.
Some students should be able to combine loci to identify regions
or points within a given area.
Lesson Plan
Smart Notebook
Activ Inspire
Flipchart
Microsoft
PowerPoint
Differentiated
Worksheet Handout
36
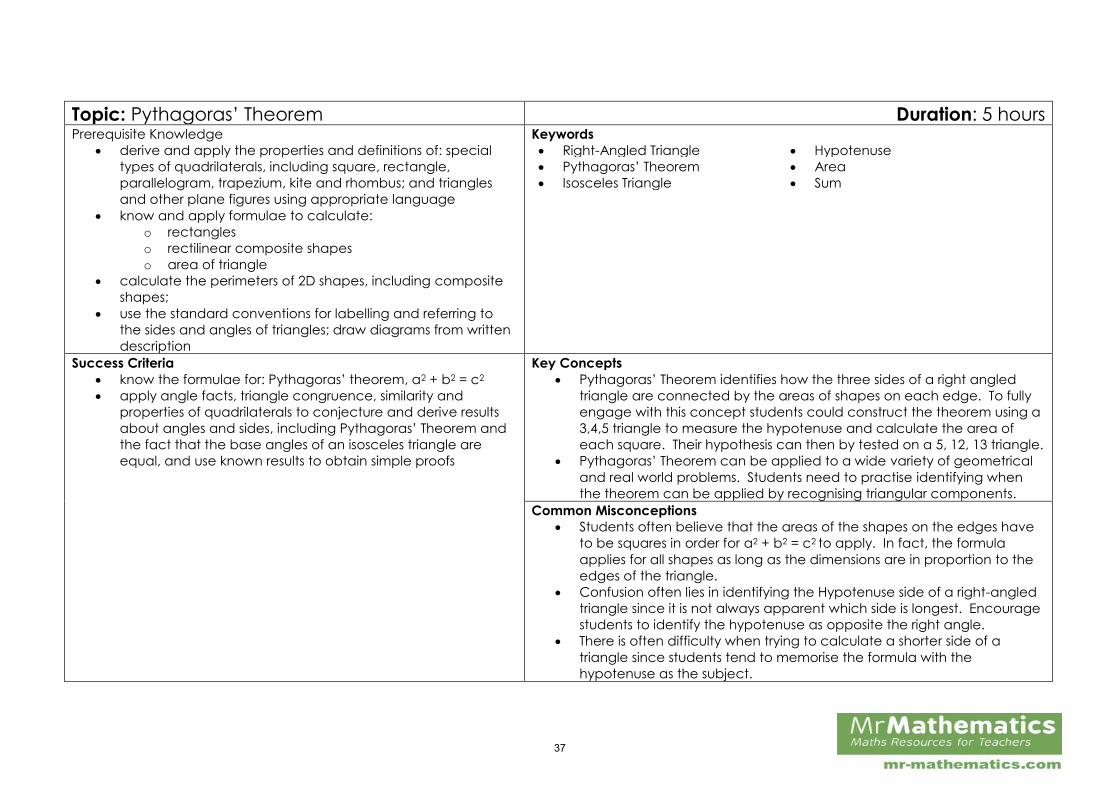
Topic: Pythagoras’ Theorem Duration: 5 hours Prerequisite Knowledge
derive and apply the properties and definitions of: special
types of quadrilaterals, including square, rectangle,
parallelogram, trapezium, kite and rhombus; and triangles
and other plane figures using appropriate language
know and apply formulae to calculate:
o rectangles
o rectilinear composite shapes
o area of triangle
calculate the perimeters of 2D shapes, including composite
shapes;
use the standard conventions for labelling and referring to
the sides and angles of triangles; draw diagrams from written
description
Keywords
Right-Angled Triangle Hypotenuse
Pythagoras’ Theorem Area
Isosceles Triangle Sum
Success Criteria
know the formulae for: Pythagoras’ theorem, a2 + b2 = c2
apply angle facts, triangle congruence, similarity and
properties of quadrilaterals to conjecture and derive results
about angles and sides, including Pythagoras’ Theorem and
the fact that the base angles of an isosceles triangle are
equal, and use known results to obtain simple proofs
Key Concepts
Pythagoras’ Theorem identifies how the three sides of a right angled
triangle are connected by the areas of shapes on each edge. To fully
engage with this concept students could construct the theorem using a
3,4,5 triangle to measure the hypotenuse and calculate the area of
each square. Their hypothesis can then by tested on a 5, 12, 13 triangle.
Pythagoras’ Theorem can be applied to a wide variety of geometrical
and real world problems. Students need to practise identifying when
the theorem can be applied by recognising triangular components.
Common Misconceptions
Students often believe that the areas of the shapes on the edges have
to be squares in order for a2 + b2 = c2 to apply. In fact, the formula
applies for all shapes as long as the dimensions are in proportion to the
edges of the triangle.
Confusion often lies in identifying the Hypotenuse side of a right-angled
triangle since it is not always apparent which side is longest. Encourage
students to identify the hypotenuse as opposite the right angle.
There is often difficulty when trying to calculate a shorter side of a
triangle since students tend to memorise the formula with the
hypotenuse as the subject.
37
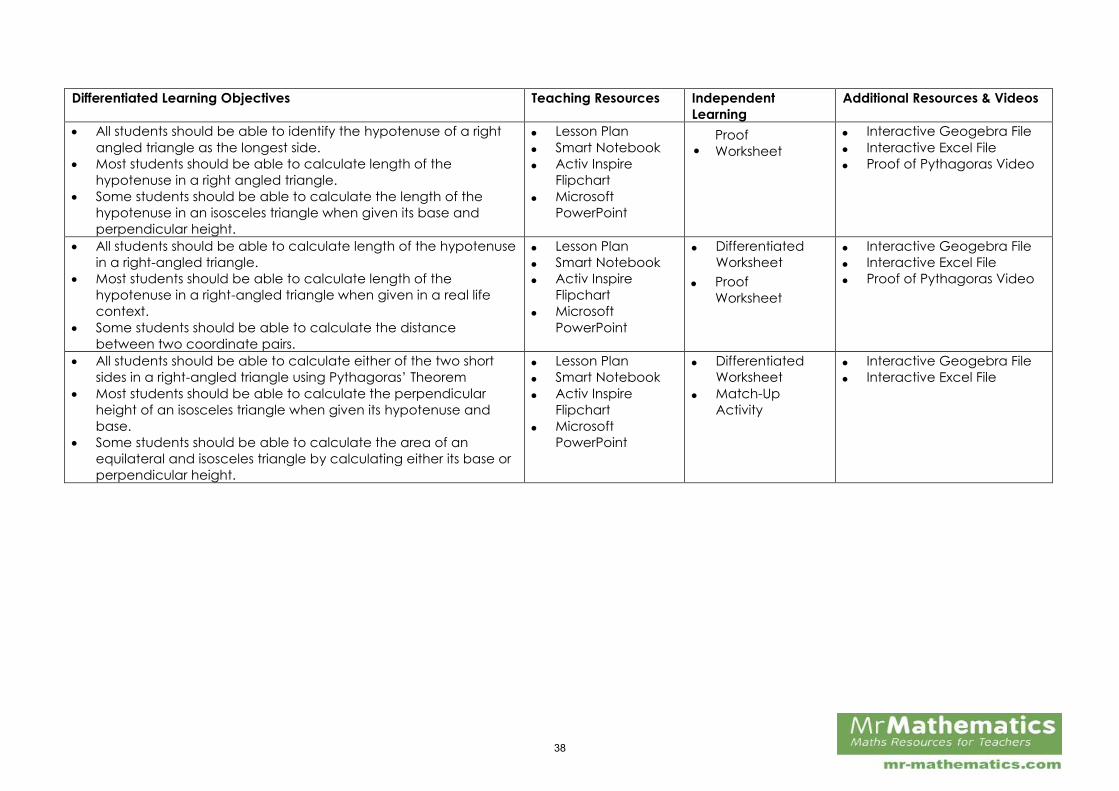
Differentiated Learning Objectives Teaching Resources Independent
Learning
Additional Resources & Videos
All students should be able to identify the hypotenuse of a right
angled triangle as the longest side.
Most students should be able to calculate length of the
hypotenuse in a right angled triangle.
Some students should be able to calculate the length of the
hypotenuse in an isosceles triangle when given its base and
perpendicular height.
Lesson Plan
Smart Notebook
Activ Inspire
Flipchart
Microsoft
PowerPoint
Interactive Geogebra File
Interactive Excel File
Proof of Pythagoras Video
All students should be able to calculate length of the hypotenuse
in a right-angled triangle.
Most students should be able to calculate length of the
hypotenuse in a right-angled triangle when given in a real life
context.
Some students should be able to calculate the distance
between two coordinate pairs.
Lesson Plan
Smart Notebook
Activ Inspire
Flipchart
Microsoft
PowerPoint
Differentiated
Worksheet Interactive Geogebra File
Interactive Excel File
Proof of Pythagoras Video
All students should be able to calculate either of the two short
sides in a right-angled triangle using Pythagoras’ Theorem
Most students should be able to calculate the perpendicular
height of an isosceles triangle when given its hypotenuse and
base.
Some students should be able to calculate the area of an
equilateral and isosceles triangle by calculating either its base or
perpendicular height.
Lesson Plan
Smart Notebook
Activ Inspire
Flipchart
Microsoft
PowerPoint
Differentiated
Worksheet
Match-Up
Activity
Interactive Geogebra File
Interactive Excel File
ProofWorksheet
Proof Worksheet
38
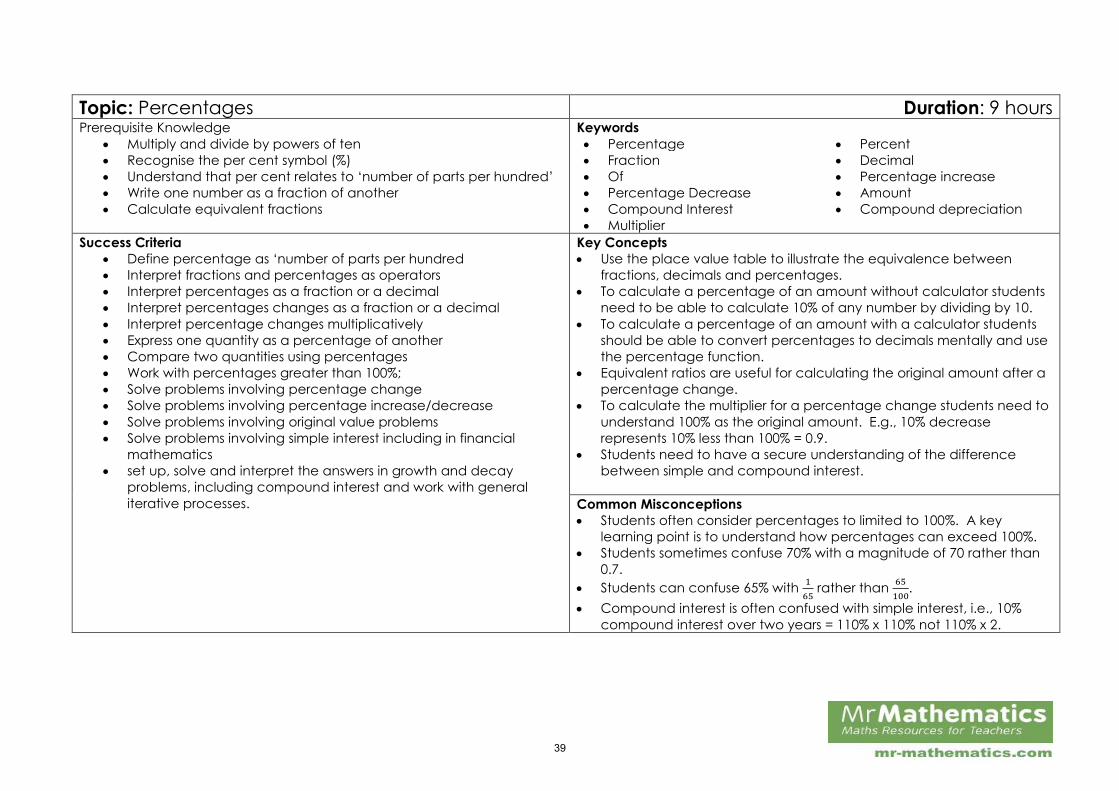
Topic: Percentages Duration: 9 hoursPrerequisite Knowledge
Multiply and divide by powers of ten
Recognise the per cent symbol (%)
Understand that per cent relates to ‘number of parts per hundred’
Write one number as a fraction of another
Calculate equivalent fractions
Keywords
Percentage Percent
Fraction Decimal
Of Percentage increase
Percentage Decrease Amount
Compound Interest Compound depreciation
Multiplier
Success Criteria
Define percentage as ‘number of parts per hundred
Interpret fractions and percentages as operators
Interpret percentages as a fraction or a decimal
Interpret percentages changes as a fraction or a decimal
Interpret percentage changes multiplicatively
Express one quantity as a percentage of another
Compare two quantities using percentages
Work with percentages greater than 100%;
Solve problems involving percentage change
Solve problems involving percentage increase/decrease
Solve problems involving original value problems
Solve problems involving simple interest including in financial
mathematics
set up, solve and interpret the answers in growth and decay
problems, including compound interest and work with general
iterative processes.
Key Concepts
Use the place value table to illustrate the equivalence between
fractions, decimals and percentages.
To calculate a percentage of an amount without calculator students
need to be able to calculate 10% of any number by dividing by 10.
To calculate a percentage of an amount with a calculator students
should be able to convert percentages to decimals mentally and use
the percentage function.
Equivalent ratios are useful for calculating the original amount after a
percentage change.
To calculate the multiplier for a percentage change students need to
understand 100% as the original amount. E.g., 10% decrease
represents 10% less than 100% = 0.9.
Students need to have a secure understanding of the difference
between simple and compound interest.
Common Misconceptions
Students often consider percentages to limited to 100%. A key
learning point is to understand how percentages can exceed 100%.
Students sometimes confuse 70% with a magnitude of 70 rather than
0.7.
Students can confuse 65% with1
65rather than
65
100.
Compound interest is often confused with simple interest, i.e., 10%
compound interest over two years = 110% x 110% not 110% x 2.
39
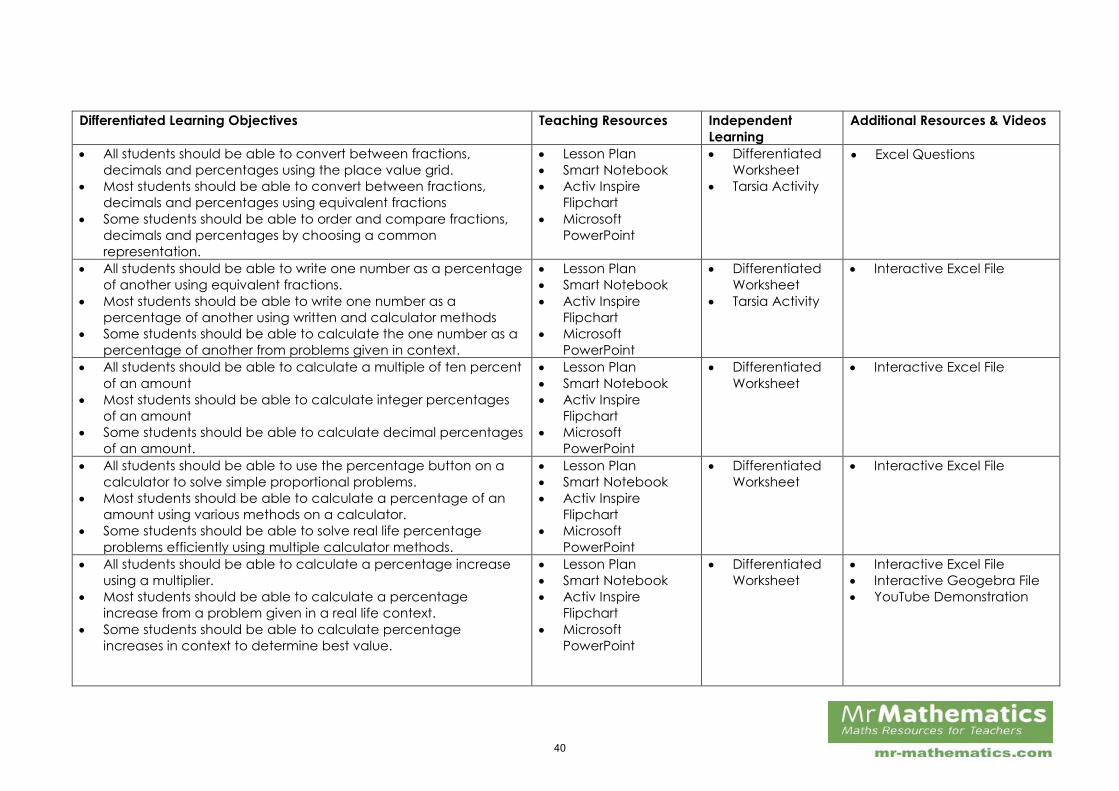
Differentiated Learning Objectives Teaching Resources Independent
Learning
Additional Resources & Videos
All students should be able to convert between fractions,
decimals and percentages using the place value grid.
Most students should be able to convert between fractions,
decimals and percentages using equivalent fractions
Some students should be able to order and compare fractions,
decimals and percentages by choosing a common
representation.
Lesson Plan
Smart Notebook
Activ Inspire
Flipchart
Microsoft
PowerPoint
Differentiated
Worksheet
Tarsia Activity
Excel Questions
All students should be able to write one number as a percentage
of another using equivalent fractions.
Most students should be able to write one number as a
percentage of another using written and calculator methods
Some students should be able to calculate the one number as a
percentage of another from problems given in context.
Lesson Plan
Smart Notebook
Activ Inspire
Flipchart
Microsoft
PowerPoint
Differentiated
Worksheet
Tarsia Activity
Interactive Excel File
All students should be able to calculate a multiple of ten percent
of an amount
Most students should be able to calculate integer percentages
of an amount
Some students should be able to calculate decimal percentages
of an amount.
Lesson Plan
Smart Notebook
Activ Inspire
Flipchart
Microsoft
PowerPoint
Differentiated
Worksheet
Interactive Excel File
All students should be able to use the percentage button on a
calculator to solve simple proportional problems.
Most students should be able to calculate a percentage of an
amount using various methods on a calculator.
Some students should be able to solve real life percentage
problems efficiently using multiple calculator methods.
Lesson Plan
Smart Notebook
Activ Inspire
Flipchart
Microsoft
PowerPoint
Differentiated
Worksheet
Interactive Excel File
All students should be able to calculate a percentage increase
using a multiplier.
Most students should be able to calculate a percentage
increase from a problem given in a real life context.
Some students should be able to calculate percentage
increases in context to determine best value.
Lesson Plan
Smart Notebook
Activ Inspire
Flipchart
Microsoft
PowerPoint
Differentiated
Worksheet
Interactive Excel File
Interactive Geogebra File
YouTube Demonstration
40
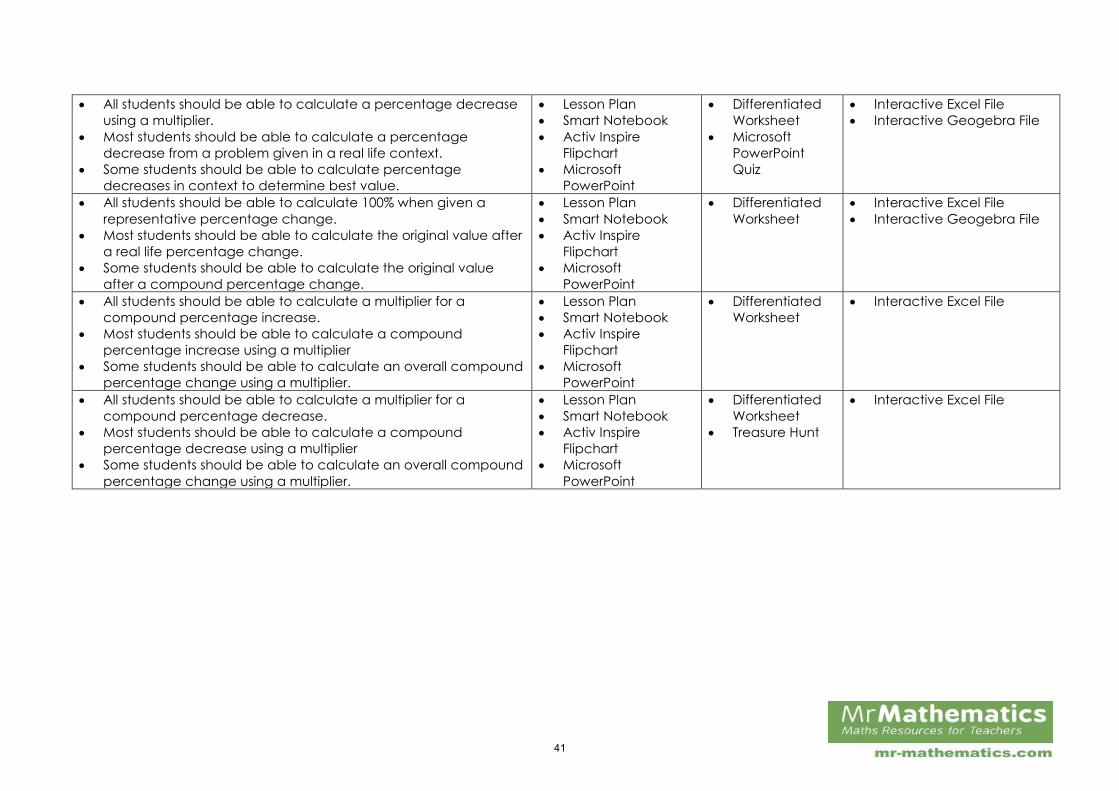
All students should be able to calculate a percentage decrease
using a multiplier.
Most students should be able to calculate a percentage
decrease from a problem given in a real life context.
Some students should be able to calculate percentage
decreases in context to determine best value.
Lesson Plan
Smart Notebook
Activ Inspire
Flipchart
Microsoft
PowerPoint
Differentiated
Worksheet
Microsoft
PowerPoint
Quiz
Interactive Excel File
Interactive Geogebra File
All students should be able to calculate 100% when given a
representative percentage change.
Most students should be able to calculate the original value after
a real life percentage change.
Some students should be able to calculate the original value
after a compound percentage change.
Lesson Plan
Smart Notebook
Activ Inspire
Flipchart
Microsoft
PowerPoint
Differentiated
Worksheet
Interactive Excel File
Interactive Geogebra File
All students should be able to calculate a multiplier for a
compound percentage increase.
Most students should be able to calculate a compound
percentage increase using a multiplier
Some students should be able to calculate an overall compound
percentage change using a multiplier.
Lesson Plan
Smart Notebook
Activ Inspire
Flipchart
Microsoft
PowerPoint
Differentiated
Worksheet
Interactive Excel File
All students should be able to calculate a multiplier for a
compound percentage decrease.
Most students should be able to calculate a compound
percentage decrease using a multiplier
Some students should be able to calculate an overall compound
percentage change using a multiplier.
Lesson Plan
Smart Notebook
Activ Inspire
Flipchart
Microsoft
PowerPoint
Differentiated
Worksheet
Treasure Hunt
Interactive Excel File
41
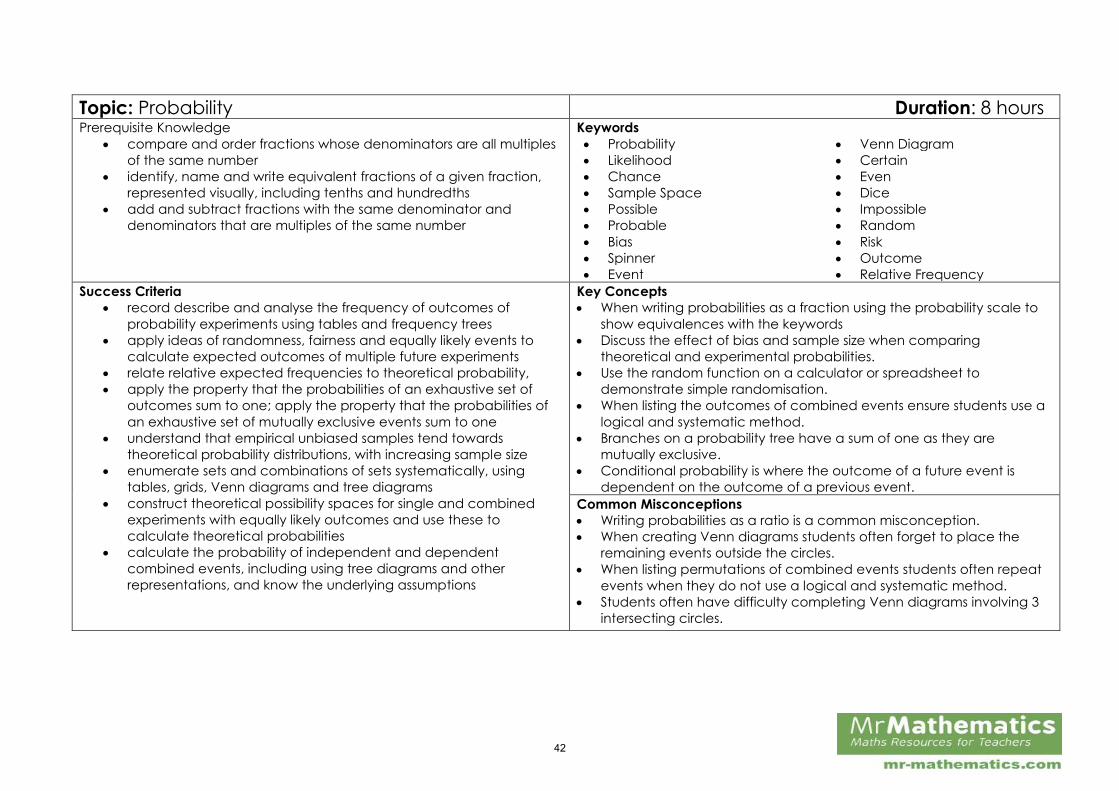
Topic: Probability Duration: 8 hoursPrerequisite Knowledge
compare and order fractions whose denominators are all multiples
of the same number
identify, name and write equivalent fractions of a given fraction,
represented visually, including tenths and hundredths
add and subtract fractions with the same denominator and
denominators that are multiples of the same number
Keywords
Probability Venn Diagram
Likelihood Certain
Chance Even
Sample Space Dice
Possible Impossible
Probable Random
Bias Risk
Spinner Outcome
Event Relative Frequency
Success Criteria
record describe and analyse the frequency of outcomes of
probability experiments using tables and frequency trees
apply ideas of randomness, fairness and equally likely events to
calculate expected outcomes of multiple future experiments
relate relative expected frequencies to theoretical probability,
apply the property that the probabilities of an exhaustive set of
outcomes sum to one; apply the property that the probabilities of
an exhaustive set of mutually exclusive events sum to one
understand that empirical unbiased samples tend towards
theoretical probability distributions, with increasing sample size
enumerate sets and combinations of sets systematically, using
tables, grids, Venn diagrams and tree diagrams
construct theoretical possibility spaces for single and combined
experiments with equally likely outcomes and use these to
calculate theoretical probabilities
calculate the probability of independent and dependent
combined events, including using tree diagrams and other
representations, and know the underlying assumptions
Key Concepts
When writing probabilities as a fraction using the probability scale to
show equivalences with the keywords
Discuss the effect of bias and sample size when comparing
theoretical and experimental probabilities.
Use the random function on a calculator or spreadsheet to
demonstrate simple randomisation.
When listing the outcomes of combined events ensure students use a
logical and systematic method.
Branches on a probability tree have a sum of one as they are
mutually exclusive.
Conditional probability is where the outcome of a future event is
dependent on the outcome of a previous event.
Common Misconceptions
Writing probabilities as a ratio is a common misconception.
When creating Venn diagrams students often forget to place the
remaining events outside the circles.
When listing permutations of combined events students often repeat
events when they do not use a logical and systematic method.
Students often have difficulty completing Venn diagrams involving 3
intersecting circles.
42
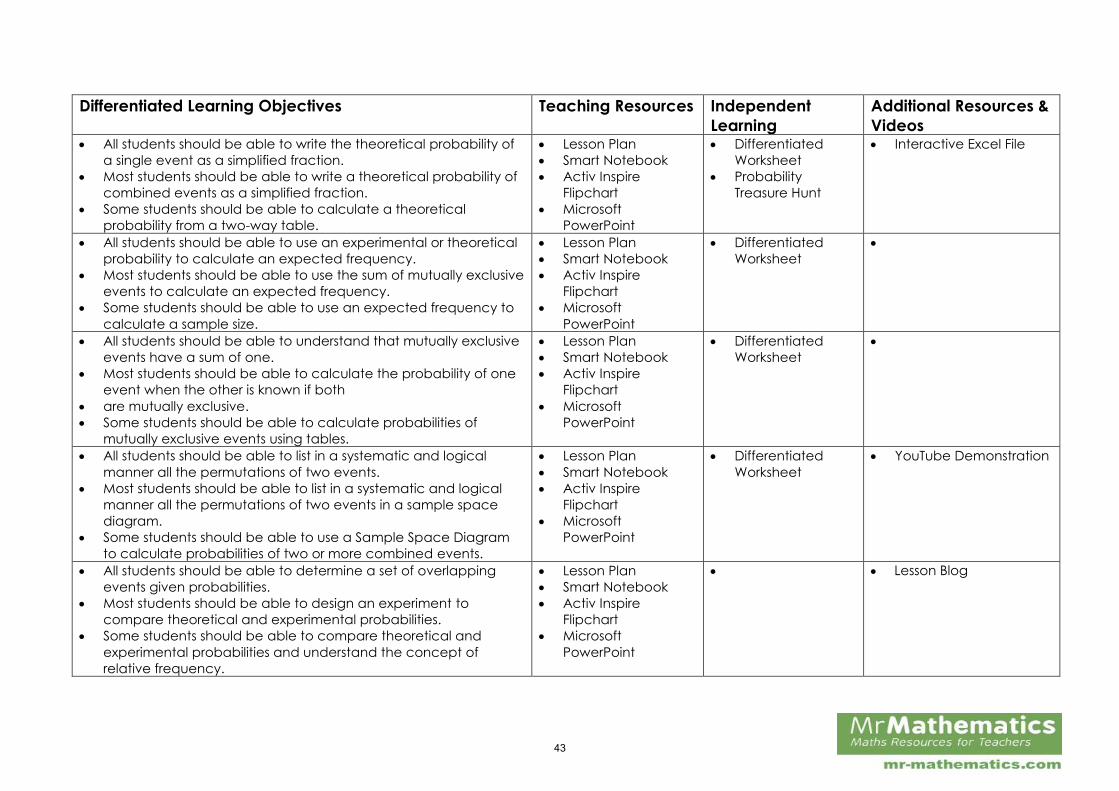
Differentiated Learning Objectives Teaching Resources Independent
Learning
Additional Resources &
Videos All students should be able to write the theoretical probability of
a single event as a simplified fraction.
Most students should be able to write a theoretical probability of
combined events as a simplified fraction.
Some students should be able to calculate a theoretical
probability from a two-way table.
Lesson Plan
Smart Notebook
Activ Inspire
Flipchart
Microsoft
PowerPoint
Differentiated
Worksheet
Probability
Treasure Hunt
Interactive Excel File
All students should be able to use an experimental or theoretical
probability to calculate an expected frequency.
Most students should be able to use the sum of mutually exclusive
events to calculate an expected frequency.
Some students should be able to use an expected frequency to
calculate a sample size.
Lesson Plan
Smart Notebook
Activ Inspire
Flipchart
Microsoft
PowerPoint
Differentiated
Worksheet
All students should be able to understand that mutually exclusive
events have a sum of one.
Most students should be able to calculate the probability of one
event when the other is known if both
are mutually exclusive.
Some students should be able to calculate probabilities of
mutually exclusive events using tables.
Lesson Plan
Smart Notebook
Activ Inspire
Flipchart
Microsoft
PowerPoint
Differentiated
Worksheet
All students should be able to list in a systematic and logical
manner all the permutations of two events.
Most students should be able to list in a systematic and logical
manner all the permutations of two events in a sample space
diagram.
Some students should be able to use a Sample Space Diagram
to calculate probabilities of two or more combined events.
Lesson Plan
Smart Notebook
Activ Inspire
Flipchart
Microsoft
PowerPoint
Differentiated
Worksheet
YouTube Demonstration
All students should be able to determine a set of overlapping
events given probabilities.
Most students should be able to design an experiment to
compare theoretical and experimental probabilities.
Some students should be able to compare theoretical and
experimental probabilities and understand the concept of
relative frequency.
Lesson Plan
Smart Notebook
Activ Inspire
Flipchart
Microsoft
PowerPoint
Lesson Blog
43
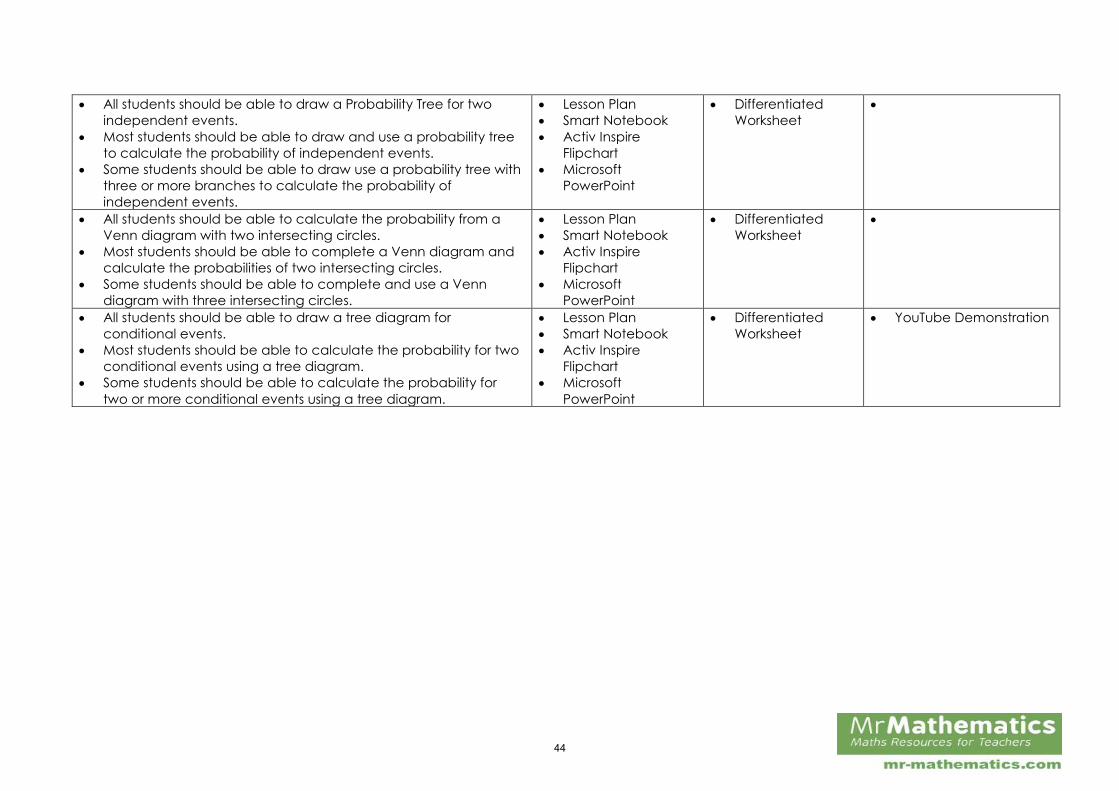
All students should be able to draw a Probability Tree for two
independent events.
Most students should be able to draw and use a probability tree
to calculate the probability of independent events.
Some students should be able to draw use a probability tree with
three or more branches to calculate the probability of
independent events.
Lesson Plan
Smart Notebook
Activ Inspire
Flipchart
Microsoft
PowerPoint
Differentiated
Worksheet
All students should be able to calculate the probability from a
Venn diagram with two intersecting circles.
Most students should be able to complete a Venn diagram and
calculate the probabilities of two intersecting circles.
Some students should be able to complete and use a Venn
diagram with three intersecting circles.
Lesson Plan
Smart Notebook
Activ Inspire
Flipchart
Microsoft
PowerPoint
Differentiated
Worksheet
All students should be able to draw a tree diagram for
conditional events.
Most students should be able to calculate the probability for two
conditional events using a tree diagram.
Some students should be able to calculate the probability for
two or more conditional events using a tree diagram.
Lesson Plan
Smart Notebook
Activ Inspire
Flipchart
Microsoft
PowerPoint
Differentiated
Worksheet
YouTube Demonstration
44
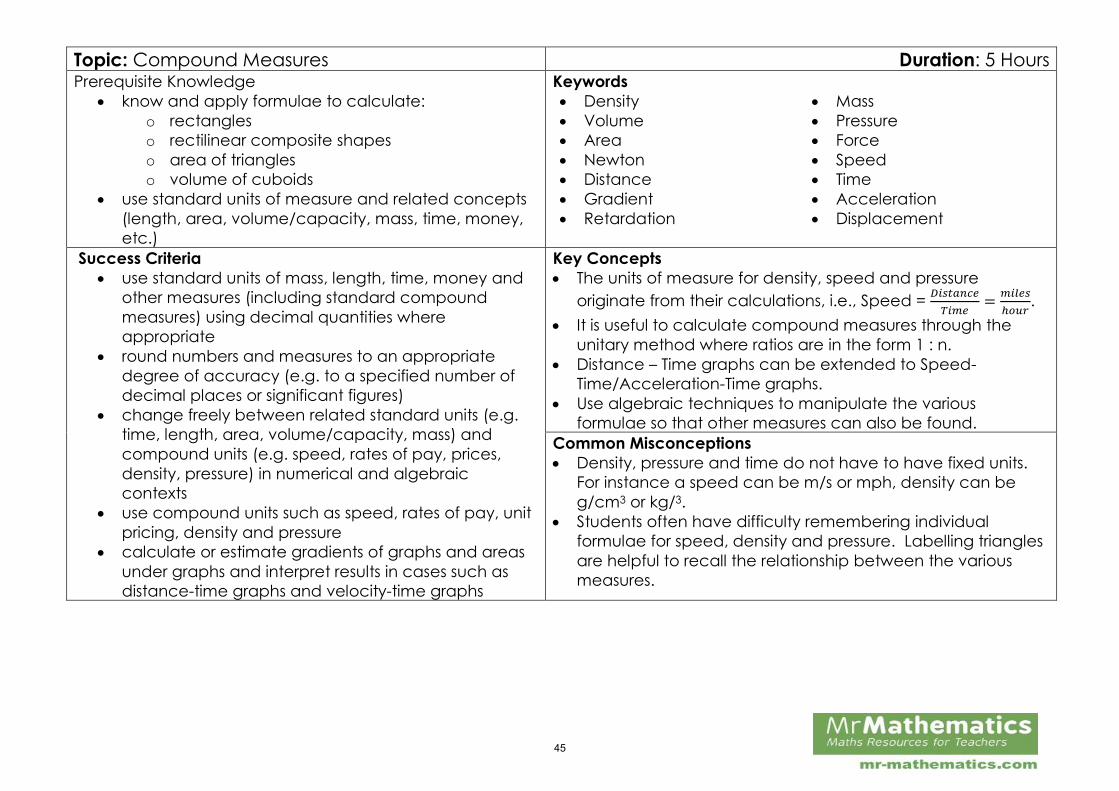
Topic: Compound Measures Duration: 5 Hours Prerequisite Knowledge
know and apply formulae to calculate:
o rectangles
o rectilinear composite shapes
o area of triangles
o volume of cuboids
use standard units of measure and related concepts
(length, area, volume/capacity, mass, time, money,
etc.)
Keywords
Density Mass
Volume Pressure
Area Force
Newton Speed
Distance Time
Gradient Acceleration
Retardation Displacement
Success Criteria
use standard units of mass, length, time, money and
other measures (including standard compound
measures) using decimal quantities where
appropriate
round numbers and measures to an appropriate
degree of accuracy (e.g. to a specified number of
decimal places or significant figures)
change freely between related standard units (e.g.
time, length, area, volume/capacity, mass) and
compound units (e.g. speed, rates of pay, prices,
density, pressure) in numerical and algebraic
contexts
use compound units such as speed, rates of pay, unit
pricing, density and pressure
calculate or estimate gradients of graphs and areas
under graphs and interpret results in cases such as
distance-time graphs and velocity-time graphs
Key Concepts
The units of measure for density, speed and pressure
originate from their calculations, i.e., Speed = 𝐷𝑖𝑠𝑡𝑎𝑛𝑐𝑒
𝑇𝑖𝑚𝑒=
𝑚𝑖𝑙𝑒𝑠
ℎ𝑜𝑢𝑟.
It is useful to calculate compound measures through the
unitary method where ratios are in the form 1 : n.
Distance – Time graphs can be extended to Speed-
Time/Acceleration-Time graphs.
Use algebraic techniques to manipulate the various
formulae so that other measures can also be found.
Common Misconceptions
Density, pressure and time do not have to have fixed units.
For instance a speed can be m/s or mph, density can be
g/cm3 or kg/3.
Students often have difficulty remembering individual
formulae for speed, density and pressure. Labelling triangles
are helpful to recall the relationship between the various
measures.
45
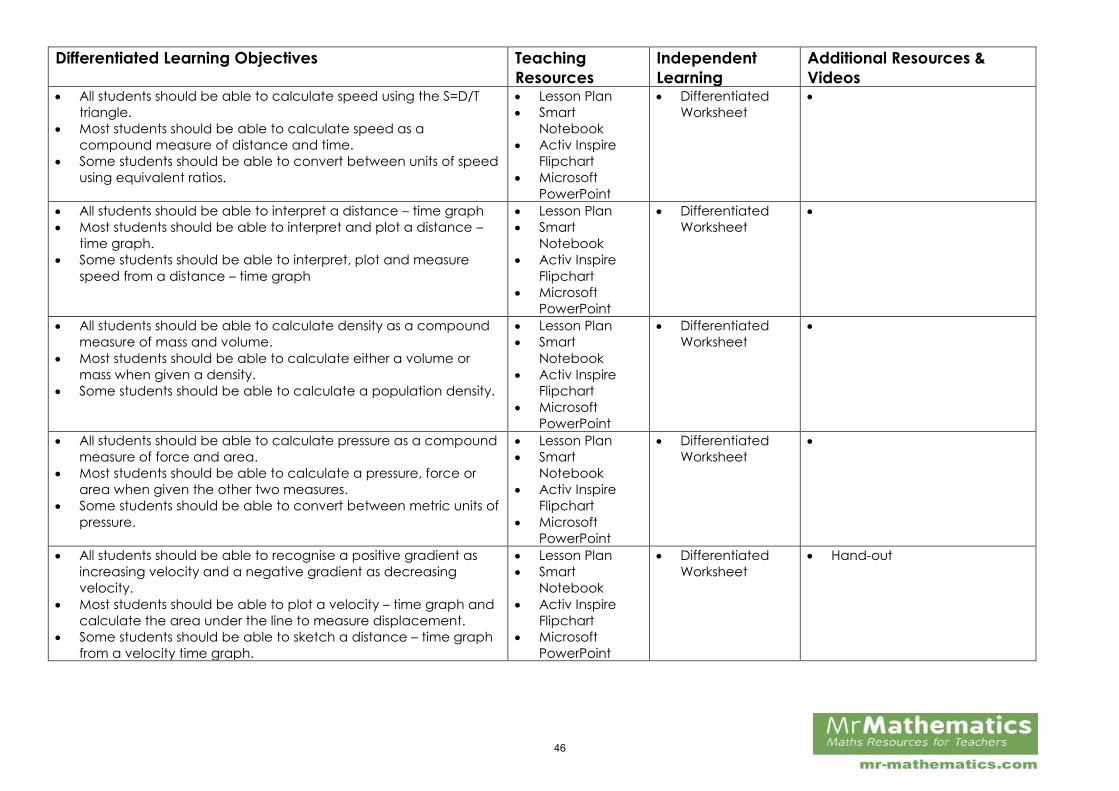
Differentiated Learning Objectives Teaching
Resources
Independent
Learning
Additional Resources &
Videos All students should be able to calculate speed using the S=D/T
triangle.
Most students should be able to calculate speed as a
compound measure of distance and time.
Some students should be able to convert between units of speed
using equivalent ratios.
Lesson Plan
Smart
Notebook
Activ Inspire
Flipchart
Microsoft
PowerPoint
Differentiated
Worksheet
All students should be able to interpret a distance – time graph
Most students should be able to interpret and plot a distance –
time graph.
Some students should be able to interpret, plot and measure
speed from a distance – time graph
Lesson Plan
Smart
Notebook
Activ Inspire
Flipchart
Microsoft
PowerPoint
Differentiated
Worksheet
All students should be able to calculate density as a compound
measure of mass and volume.
Most students should be able to calculate either a volume or
mass when given a density.
Some students should be able to calculate a population density.
Lesson Plan
Smart
Notebook
Activ Inspire
Flipchart
Microsoft
PowerPoint
Differentiated
Worksheet
All students should be able to calculate pressure as a compound
measure of force and area.
Most students should be able to calculate a pressure, force or
area when given the other two measures.
Some students should be able to convert between metric units of
pressure.
Lesson Plan
Smart
Notebook
Activ Inspire
Flipchart
Microsoft
PowerPoint
Differentiated
Worksheet
All students should be able to recognise a positive gradient as
increasing velocity and a negative gradient as decreasing
velocity.
Most students should be able to plot a velocity – time graph and
calculate the area under the line to measure displacement.
Some students should be able to sketch a distance – time graph
from a velocity time graph.
Lesson Plan
Smart
Notebook
Activ Inspire
Flipchart
Microsoft
PowerPoint
Differentiated
Worksheet
Hand-out
46
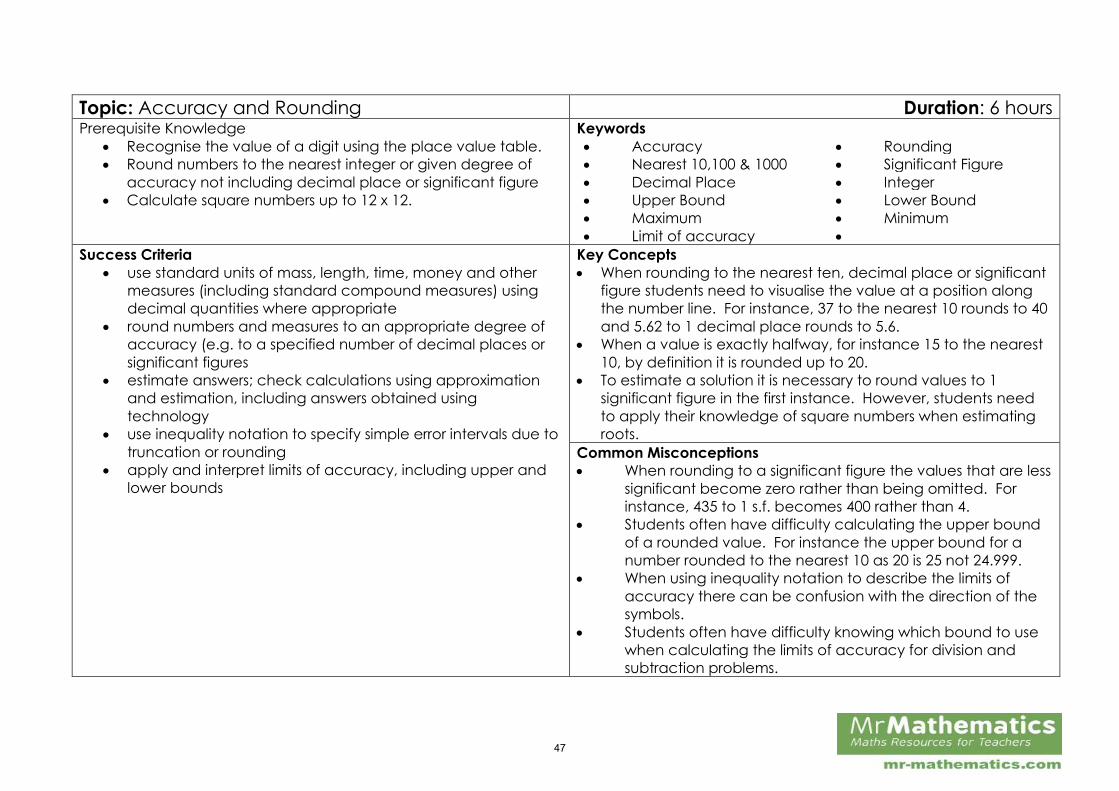
Topic: Accuracy and Rounding Duration: 6 hours Prerequisite Knowledge
Recognise the value of a digit using the place value table.
Round numbers to the nearest integer or given degree of
accuracy not including decimal place or significant figure
Calculate square numbers up to 12 x 12.
Keywords
Accuracy Rounding
Nearest 10,100 & 1000 Significant Figure
Decimal Place Integer
Upper Bound Lower Bound
Maximum Minimum
Limit of accuracy
Success Criteria
use standard units of mass, length, time, money and other
measures (including standard compound measures) using
decimal quantities where appropriate
round numbers and measures to an appropriate degree of
accuracy (e.g. to a specified number of decimal places or
significant figures
estimate answers; check calculations using approximation
and estimation, including answers obtained using
technology
use inequality notation to specify simple error intervals due to
truncation or rounding
apply and interpret limits of accuracy, including upper and
lower bounds
Key Concepts
When rounding to the nearest ten, decimal place or significant
figure students need to visualise the value at a position along
the number line. For instance, 37 to the nearest 10 rounds to 40
and 5.62 to 1 decimal place rounds to 5.6.
When a value is exactly halfway, for instance 15 to the nearest
10, by definition it is rounded up to 20.
To estimate a solution it is necessary to round values to 1
significant figure in the first instance. However, students need
to apply their knowledge of square numbers when estimating
roots.
Common Misconceptions
When rounding to a significant figure the values that are less
significant become zero rather than being omitted. For
instance, 435 to 1 s.f. becomes 400 rather than 4.
Students often have difficulty calculating the upper bound
of a rounded value. For instance the upper bound for a
number rounded to the nearest 10 as 20 is 25 not 24.999.
When using inequality notation to describe the limits of
accuracy there can be confusion with the direction of the
symbols.
Students often have difficulty knowing which bound to use
when calculating the limits of accuracy for division and
subtraction problems.
47
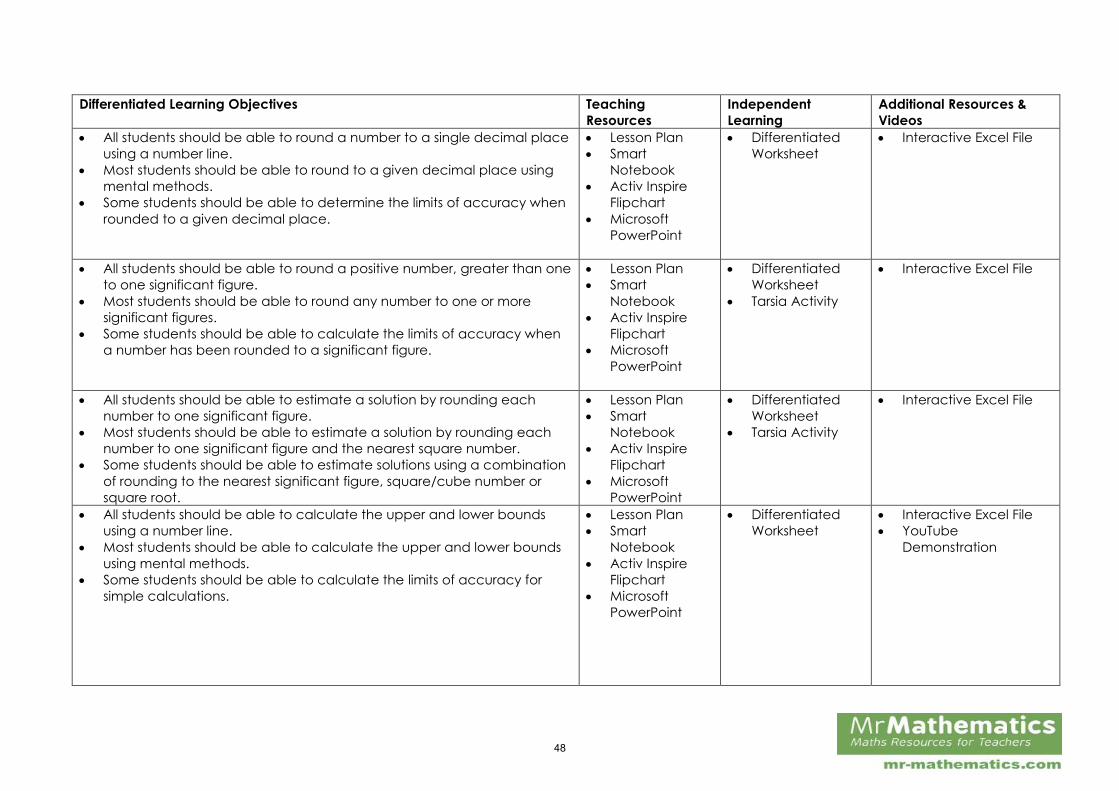
Differentiated Learning Objectives Teaching
Resources
Independent
Learning
Additional Resources &
Videos
All students should be able to round a number to a single decimal place
using a number line.
Most students should be able to round to a given decimal place using
mental methods.
Some students should be able to determine the limits of accuracy when
rounded to a given decimal place.
Lesson Plan
Smart
Notebook
Activ Inspire
Flipchart
Microsoft
PowerPoint
Differentiated
Worksheet
Interactive Excel File
All students should be able to round a positive number, greater than one
to one significant figure.
Most students should be able to round any number to one or more
significant figures.
Some students should be able to calculate the limits of accuracy when
a number has been rounded to a significant figure.
Lesson Plan
Smart
Notebook
Activ Inspire
Flipchart
Microsoft
PowerPoint
Differentiated
Worksheet
Tarsia Activity
Interactive Excel File
All students should be able to estimate a solution by rounding each
number to one significant figure.
Most students should be able to estimate a solution by rounding each
number to one significant figure and the nearest square number.
Some students should be able to estimate solutions using a combination
of rounding to the nearest significant figure, square/cube number or
square root.
Lesson Plan
Smart
Notebook
Activ Inspire
Flipchart
Microsoft
PowerPoint
Differentiated
Worksheet
Tarsia Activity
Interactive Excel File
All students should be able to calculate the upper and lower bounds
using a number line.
Most students should be able to calculate the upper and lower bounds
using mental methods.
Some students should be able to calculate the limits of accuracy for
simple calculations.
Lesson Plan
Smart
Notebook
Activ Inspire
Flipchart
Microsoft
PowerPoint
Differentiated
Worksheet
Interactive Excel File
YouTube
Demonstration
48
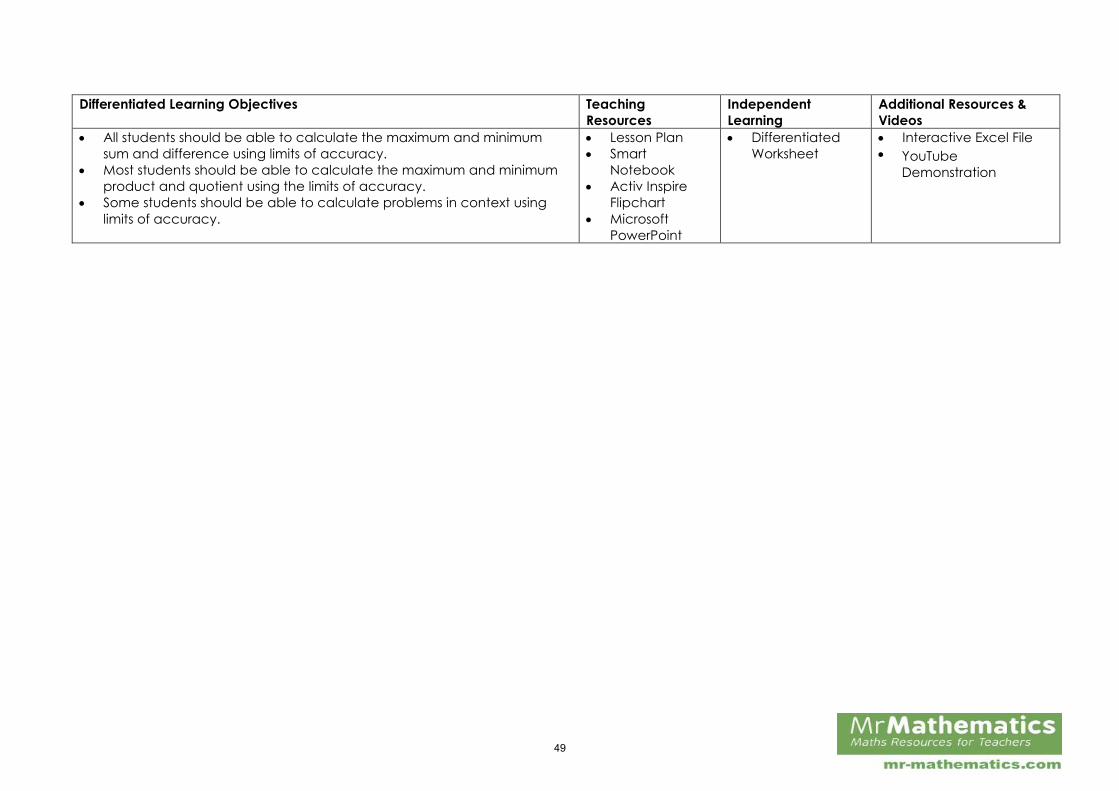
Differentiated Learning Objectives Teaching
Resources
Independent
Learning
Additional Resources &
Videos
All students should be able to calculate the maximum and minimum
sum and difference using limits of accuracy.
Most students should be able to calculate the maximum and minimum
product and quotient using the limits of accuracy.
Some students should be able to calculate problems in context using
limits of accuracy.
Lesson Plan
Smart
Notebook
Activ Inspire
Flipchart
Microsoft
PowerPoint
Differentiated
Worksheet
Interactive Excel File
YouTube
Demonstration
49
Topic: Similarity and Congruence Duration: 5 hours Prerequisite Knowledge
use standard units of measure and related concepts (length, area,
volume/capacity, mass, time, money, etc.)
know and apply formulae to calculate: area of triangles,
parallelograms, trapezia; volume of cuboids and other right prisms
(including cylinders)
identify, describe and construct congruent and similar shapes,
including on coordinate axes, by considering rotation, reflection,
translation and enlargement
Keywords
Similar Congruent
Length scale factor Volume scale factor
Area scale factor Ratio
Scale Enlargement
Success Criteria
apply the concepts of congruence and similarity, including the
relationships between lengths, areas and volumes in similar figures
compare lengths, areas and volumes using ratio notation; make
links to similarity and scale factors
Key Concepts
Similar shapes have equal angles whereas congruent shapes have
equal angles and lengths.
Students need to be able to use ratios in the form 1 : n to model the
length scale factor.
To calculate the correct scale factor students need to match
corresponding dimensions, e.g., Area 1 ÷ Area 2 or Length 1 ÷ Length
2
Area Scale Factor = (Length S.F.)2, Volume S.F. = (Length S.F.)3
Common Misconceptions
Students often struggle with proving congruence. Encourage them to
annotate sketch diagrams with clearly marked angles and state the
angle properties used.
Scale factors are can be incorrectly calculated using different
measures, e.g., Area ÷ Length
The incorrect scale factor can be applied to calculate an unknown
dimension. For instance, students may use the Area scale factor to
find a length.
50
Differentiated Learning Objectives Teaching Resources Independent
Learning
Additional Resources &
Videos
All students should be able to understand that congruent shapes have
equal angles and lengths.
Most students should be able to recognise SSS, SAS, ASA properties to
prove congruency.
Some students should be able to show congruency through reasoned
algebraic proof.
Lesson Plan
Smart Notebook
Activ Inspire
Flipchart
Microsoft
PowerPoint
Differentiated
Worksheet
All students should be able to calculate the length scale factor for two
similar shapes.
Most students should be able to calculate missing dimensions in similar
shapes using the length scale factor.
Some students should be able to calculate missing lengths in
compound shapes by considering their similar components.
Lesson Plan
Smart Notebook
Activ Inspire
Flipchart
Microsoft
PowerPoint
Differentiated
Worksheet
Interactive Excel File
Interactive Geogebra File
All students should be able to calculate the area scale factor as the
square of the length scale factor.
Most students should be able to determine and apply the area scale
factor to calculate unknown areas.
Some students should be able to determine and apply the area scale
factor to calculate unknown areas and lengths.
Lesson Plan
Smart Notebook
Activ Inspire
Flipchart
Microsoft
PowerPoint
Differentiated
Worksheet
Interactive Excel File
All students should be able to calculate the volume scale factor given
two corresponding lengths in similar solids.
Most students should be able to derive and apply the volume scale
factor to calculate unknown volumes in similar solids
Some students should be able to derive and apply the volume and
length scale factors to calculate unknown measurements in solid
shapes.
Lesson Plan
Smart Notebook
Activ Inspire
Flipchart
Microsoft
PowerPoint
Differentiated
Worksheet
Interactive Excel File
All students should be able to use the length and volume scale factors
in similar 3D shapes.
Most students should be able to use the length, area and volume scale
factors in any similar 2D or 3D shape.
Some students should be able to use the length, area and volume
scale factors in any similar 2D or 3D shape with algebraic dimensions.
Lesson Plan
Smart Notebook
Activ Inspire
Flipchart
Microsoft
PowerPoint
Differentiated
Worksheet
Interactive Excel File
51
Topic: Inequalities Duration: 5 hours Prerequisite Knowledge
solve linear equations in one unknown algebraically (including
those with the unknown on both sides of the equation)
Plot graphs of equations that correspond to straight-line graphs in
the coordinate plane;
Identify and interpret gradients and intercepts of linear functions
graphically and algebraically
Keywords
Inequality Set
Bounds Inequation
Variable Quadratic
Roots Linear
Success Criteria
solve linear inequalities in one or two variable(s), and quadratic
inequalities in one variable;
represent a solution set on a number line, using set notation and on
a graph
Key Concepts
When representing inequalities on a grid it is easier to plot the straight
line first and then decide which side to shade.
Students need to have a secure understanding of the <, >, ≥, and ≤
notation for defining inequalities.
When multiplying or dividing an inequality by -1 the sign changes.
Solid boundary lines do include the value on the line. Dashed
boundary lines do not.
Common Misconceptions
Students tend to not interpret the "≤" and "<" signs correctly
Confusion often lies in understanding the notation using empty and
full circles on a number line.
Inequations are solved as individual values rather than sets.
Students often find it difficult to identify the correct region for linear
and quadratic inequalities on a grid.
52
Differentiated Learning Objectives Teaching Resources Independent
Learning
Additional Resources & Videos
All students should be able to plot an inequality on a number
line.
Most students should be able to plot and derive an inequality
using a number line
Some students should be able to plot, derive and solve an
inequality using a number line.
Lesson Plan
Smart Notebook
Activ Inspire
Flipchart
Microsoft
PowerPoint
Differentiated
Worksheet
All students should be able to solve a two-step linear inequation
and represent the solutions on a number line.
Most students should be able to solve a linear inequation
involving brackets and represent the solutions on a number line.
Some students should be able to solve a linear inequation
between two boundaries and represent the solutions on a
number line.
Lesson Plan
Smart Notebook
Activ Inspire
Flipchart
Microsoft
PowerPoint
Differentiated
Worksheet
Tarsia Activity
All students should be able to use a number line to represent the
solutions to two inequalities.
Most students should be able to find a set of solutions for two
inequalities.
Some students should be able to identify a set of inequalities that
have no common number sets.
Lesson Plan
Smart Notebook
Activ Inspire
Flipchart
Microsoft
PowerPoint
Differentiated
Worksheet
All students should be able to plot an inequality on a number
line.
Most students should be able to plot and derive an inequality
using a number line
Some students should be able to plot, derive and solve an
inequality using a number line.
Lesson Plan
Smart Notebook
Activ Inspire
Flipchart
Microsoft
PowerPoint
Differentiated
Worksheet
Interactive Geogebra File
All students should be able to solve a quadratic inequality using
the balance method.
Most students should be able to solve a quadratic inequality in
the form 𝑥2 + 𝑏𝑥 + 𝑐 = 0 by factorising.
Some students should be able to solve a quadratic inequality
with non-integer roots using the formula.
Lesson Plan
Smart Notebook
Activ Inspire
Flipchart
Microsoft
PowerPoint
Differentiated
Worksheet
Interactive Geogebra File
53
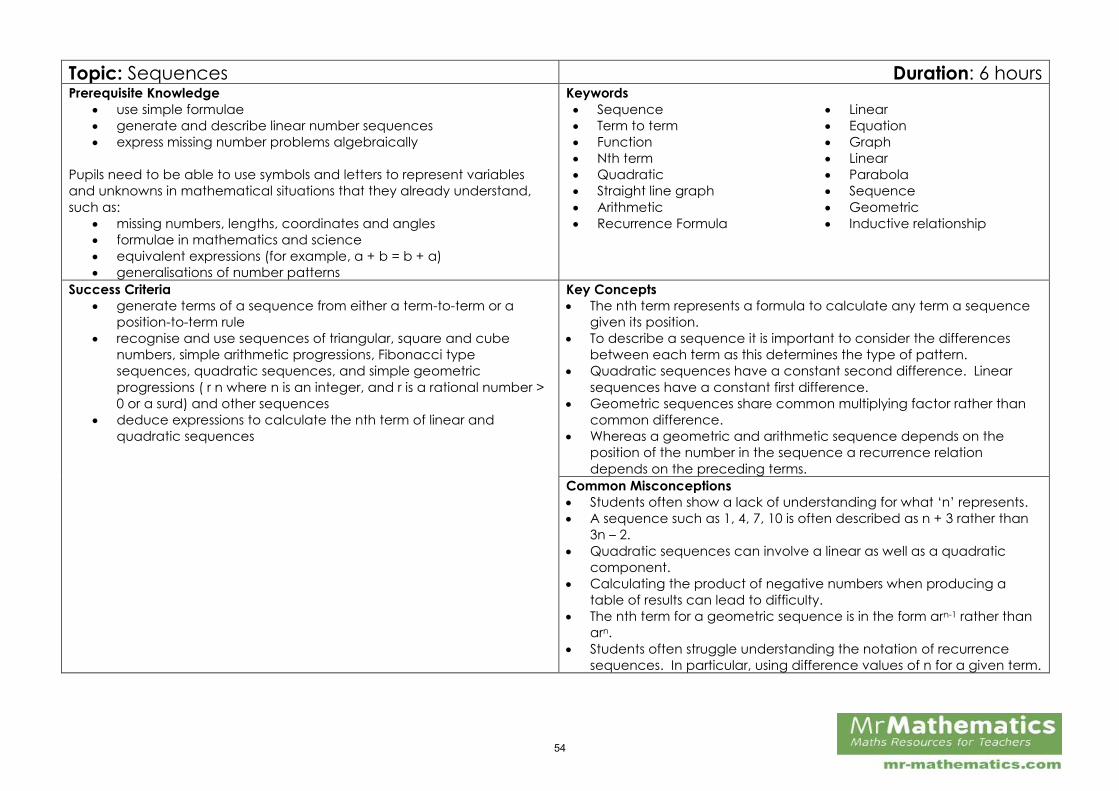
Topic: Sequences Duration: 6 hoursPrerequisite Knowledge
use simple formulae
generate and describe linear number sequences
express missing number problems algebraically
Pupils need to be able to use symbols and letters to represent variables
and unknowns in mathematical situations that they already understand,
such as:
missing numbers, lengths, coordinates and angles
formulae in mathematics and science
equivalent expressions (for example, a + b = b + a)
generalisations of number patterns
Keywords
Sequence Linear
Term to term Equation
Function Graph
Nth term Linear
Quadratic Parabola
Straight line graph Sequence
Arithmetic Geometric
Recurrence Formula Inductive relationship
Success Criteria
generate terms of a sequence from either a term-to-term or a
position-to-term rule
recognise and use sequences of triangular, square and cube
numbers, simple arithmetic progressions, Fibonacci type
sequences, quadratic sequences, and simple geometric
progressions ( r n where n is an integer, and r is a rational number >
0 or a surd) and other sequences
deduce expressions to calculate the nth term of linear and
quadratic sequences
Key Concepts
The nth term represents a formula to calculate any term a sequence
given its position.
To describe a sequence it is important to consider the differences
between each term as this determines the type of pattern.
Quadratic sequences have a constant second difference. Linear
sequences have a constant first difference.
Geometric sequences share common multiplying factor rather than
common difference.
Whereas a geometric and arithmetic sequence depends on the
position of the number in the sequence a recurrence relation
depends on the preceding terms.
Common Misconceptions
Students often show a lack of understanding for what ‘n’ represents.
A sequence such as 1, 4, 7, 10 is often described as n + 3 rather than
3n – 2.
Quadratic sequences can involve a linear as well as a quadratic
component.
Calculating the product of negative numbers when producing a
table of results can lead to difficulty.
The nth term for a geometric sequence is in the form arn-1 rather than
arn.
Students often struggle understanding the notation of recurrence
sequences. In particular, using difference values of n for a given term.
54
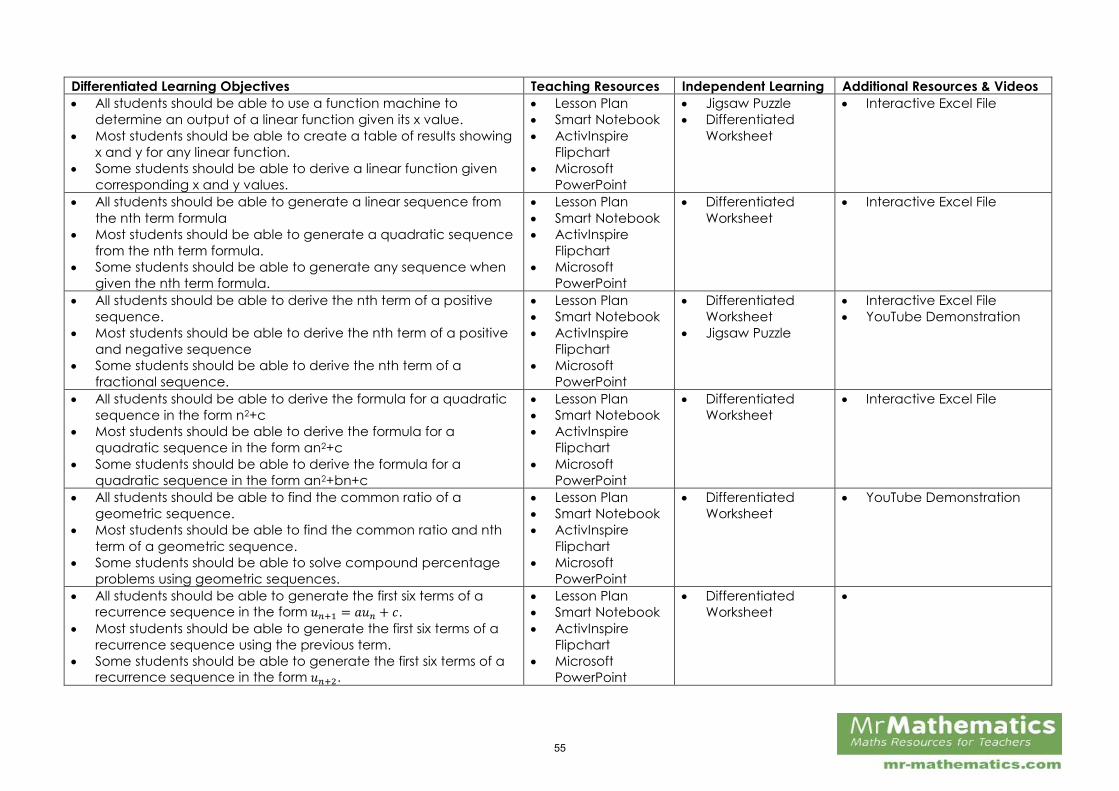
Differentiated Learning Objectives Teaching Resources Independent Learning Additional Resources & Videos
All students should be able to use a function machine to
determine an output of a linear function given its x value.
Most students should be able to create a table of results showing
x and y for any linear function.
Some students should be able to derive a linear function given
corresponding x and y values.
Lesson Plan
Smart Notebook
ActivInspire
Flipchart
Microsoft
PowerPoint
Jigsaw Puzzle
Differentiated
Worksheet
Interactive Excel File
All students should be able to generate a linear sequence from
the nth term formula
Most students should be able to generate a quadratic sequence
from the nth term formula.
Some students should be able to generate any sequence when
given the nth term formula.
Lesson Plan
Smart Notebook
ActivInspire
Flipchart
Microsoft
PowerPoint
Differentiated
Worksheet
Interactive Excel File
All students should be able to derive the nth term of a positive
sequence.
Most students should be able to derive the nth term of a positive
and negative sequence
Some students should be able to derive the nth term of a
fractional sequence.
Lesson Plan
Smart Notebook
ActivInspire
Flipchart
Microsoft
PowerPoint
Differentiated
Worksheet
Jigsaw Puzzle
Interactive Excel File
YouTube Demonstration
All students should be able to derive the formula for a quadratic
sequence in the form n2+c
Most students should be able to derive the formula for a
quadratic sequence in the form an2+c
Some students should be able to derive the formula for a
quadratic sequence in the form an2+bn+c
Lesson Plan
Smart Notebook
ActivInspire
Flipchart
Microsoft
PowerPoint
Differentiated
Worksheet
Interactive Excel File
All students should be able to find the common ratio of a
geometric sequence.
Most students should be able to find the common ratio and nth
term of a geometric sequence.
Some students should be able to solve compound percentage
problems using geometric sequences.
Lesson Plan
Smart Notebook
ActivInspire
Flipchart
Microsoft
PowerPoint
Differentiated
Worksheet
YouTube Demonstration
All students should be able to generate the first six terms of a
recurrence sequence in the form 𝑢𝑛+1 = 𝑎𝑢𝑛 + 𝑐.
Most students should be able to generate the first six terms of a
recurrence sequence using the previous term.
Some students should be able to generate the first six terms of a
recurrence sequence in the form 𝑢𝑛+2.
Lesson Plan
Smart Notebook
ActivInspire
Flipchart
Microsoft
PowerPoint
Differentiated
Worksheet
55
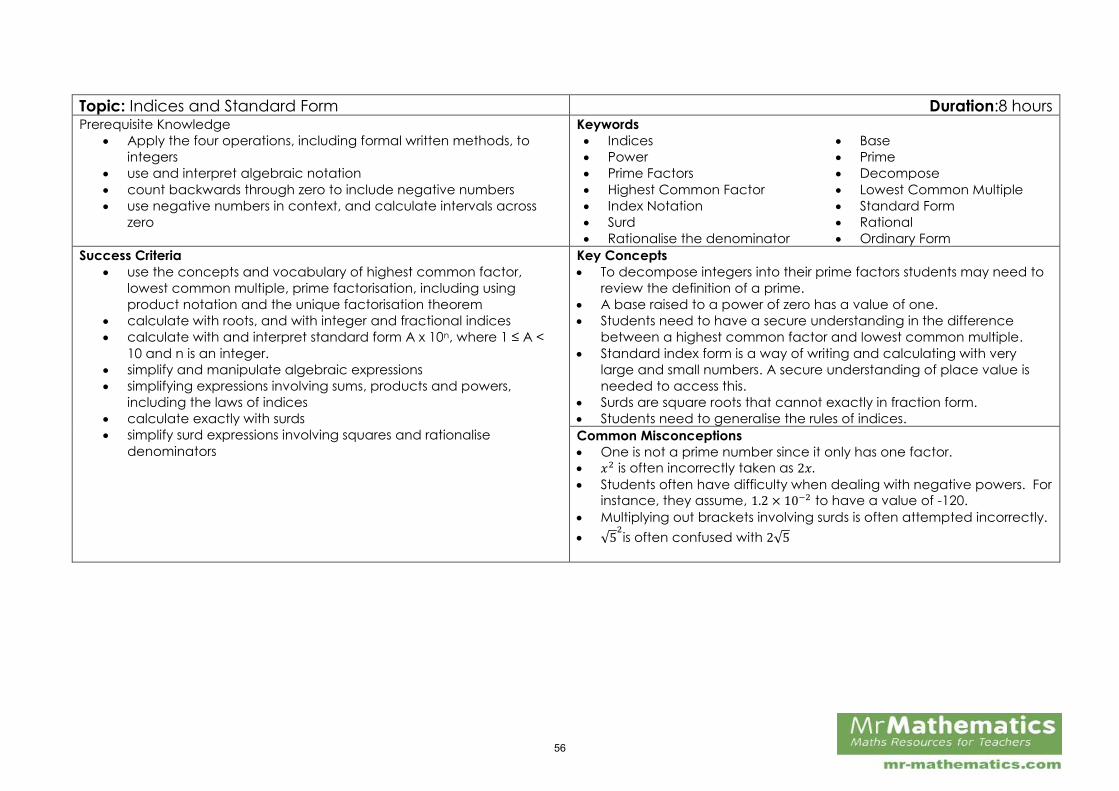
Topic: Indices and Standard Form Duration:8 hours Prerequisite Knowledge
Apply the four operations, including formal written methods, to
integers
use and interpret algebraic notation
count backwards through zero to include negative numbers
use negative numbers in context, and calculate intervals across
zero
Keywords
Indices Base
Power Prime
Prime Factors Decompose
Highest Common Factor Lowest Common Multiple
Index Notation Standard Form
Surd Rational
Rationalise the denominator Ordinary Form
Success Criteria
use the concepts and vocabulary of highest common factor,
lowest common multiple, prime factorisation, including using
product notation and the unique factorisation theorem
calculate with roots, and with integer and fractional indices
calculate with and interpret standard form A x 10n, where 1 ≤ A <
10 and n is an integer.
simplify and manipulate algebraic expressions
simplifying expressions involving sums, products and powers,
including the laws of indices
calculate exactly with surds
simplify surd expressions involving squares and rationalise
denominators
Key Concepts
To decompose integers into their prime factors students may need to
review the definition of a prime.
A base raised to a power of zero has a value of one.
Students need to have a secure understanding in the difference
between a highest common factor and lowest common multiple.
Standard index form is a way of writing and calculating with very
large and small numbers. A secure understanding of place value is
needed to access this.
Surds are square roots that cannot exactly in fraction form.
Students need to generalise the rules of indices.
Common Misconceptions
One is not a prime number since it only has one factor.
𝑥2 is often incorrectly taken as 2𝑥.
Students often have difficulty when dealing with negative powers. For
instance, they assume, 1.2 × 10⁻² to have a value of -120.
Multiplying out brackets involving surds is often attempted incorrectly.
√52is often confused with 2√5
56
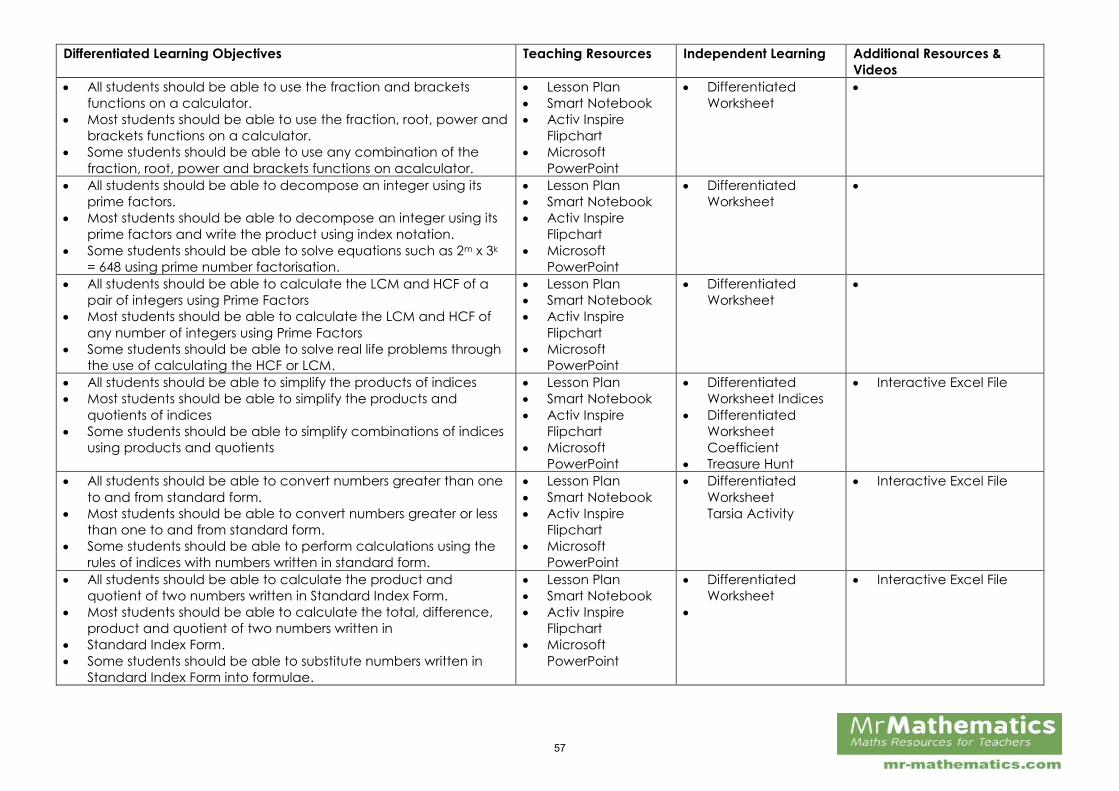
Differentiated Learning Objectives Teaching Resources Independent Learning Additional Resources &
Videos
All students should be able to use the fraction and brackets
functions on a calculator.
Most students should be able to use the fraction, root, power and
brackets functions on a calculator.
Some students should be able to use any combination of the
fraction, root, power and brackets functions on acalculator.
Lesson Plan
Smart Notebook
Activ Inspire
Flipchart
Microsoft
PowerPoint
Differentiated
Worksheet
All students should be able to decompose an integer using its
prime factors.
Most students should be able to decompose an integer using its
prime factors and write the product using index notation.
Some students should be able to solve equations such as 2m x 3k
= 648 using prime number factorisation.
Lesson Plan
Smart Notebook
Activ Inspire
Flipchart
Microsoft
PowerPoint
Differentiated
Worksheet
All students should be able to calculate the LCM and HCF of a
pair of integers using Prime Factors
Most students should be able to calculate the LCM and HCF of
any number of integers using Prime Factors
Some students should be able to solve real life problems through
the use of calculating the HCF or LCM.
Lesson Plan
Smart Notebook
Activ Inspire
Flipchart
Microsoft
PowerPoint
Differentiated
Worksheet
All students should be able to simplify the products of indices
Most students should be able to simplify the products and
quotients of indices
Some students should be able to simplify combinations of indices
using products and quotients
Lesson Plan
Smart Notebook
Activ Inspire
Flipchart
Microsoft
PowerPoint
Differentiated
Worksheet Indices
Differentiated
Worksheet
Coefficient
Treasure Hunt
Interactive Excel File
All students should be able to convert numbers greater than one
to and from standard form.
Most students should be able to convert numbers greater or less
than one to and from standard form.
Some students should be able to perform calculations using the
rules of indices with numbers written in standard form.
Lesson Plan
Smart Notebook
Activ Inspire
Flipchart
Microsoft
PowerPoint
Differentiated
Worksheet
Tarsia Activity
Interactive Excel File
All students should be able to calculate the product and
quotient of two numbers written in Standard Index Form.
Most students should be able to calculate the total, difference,
product and quotient of two numbers written in
Standard Index Form.
Some students should be able to substitute numbers written in
Standard Index Form into formulae.
Lesson Plan
Smart Notebook
Activ Inspire
Flipchart
Microsoft
PowerPoint
Differentiated
Worksheet
Interactive Excel File
57
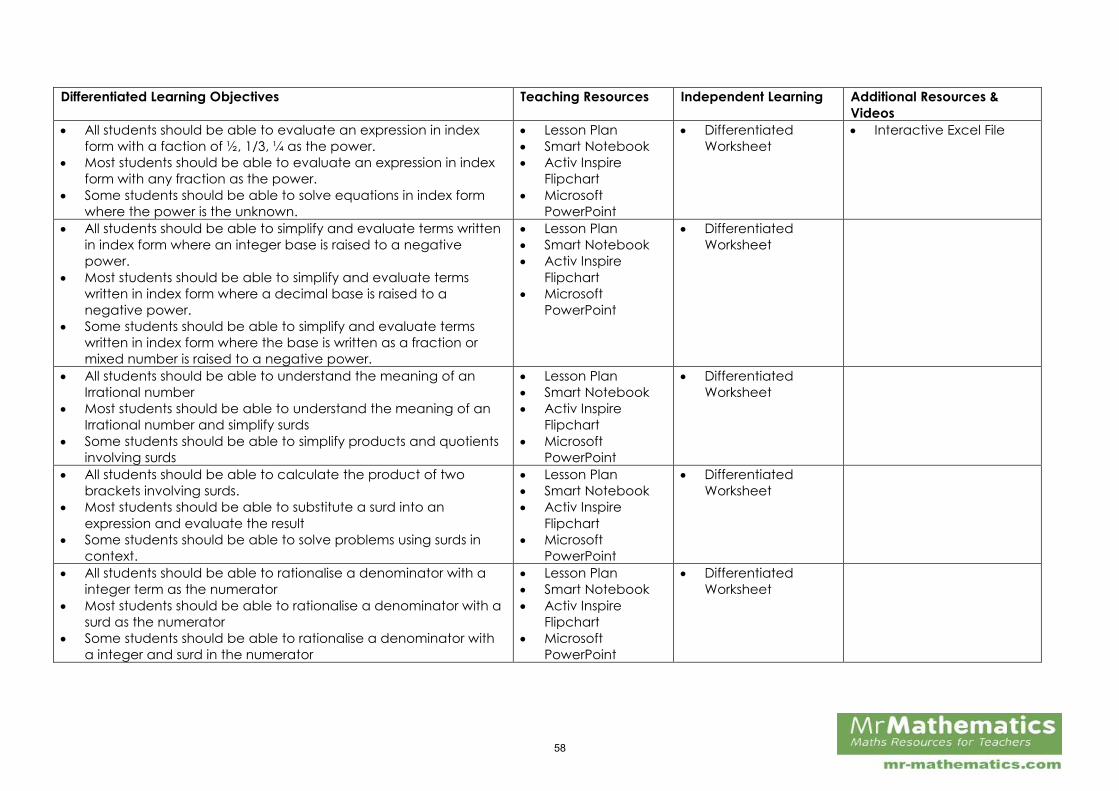
Differentiated Learning Objectives Teaching Resources Independent Learning Additional Resources &
Videos
All students should be able to evaluate an expression in index
form with a faction of ½, 1/3, ¼ as the power.
Most students should be able to evaluate an expression in index
form with any fraction as the power.
Some students should be able to solve equations in index form
where the power is the unknown.
Lesson Plan
Smart Notebook
Activ Inspire
Flipchart
Microsoft
PowerPoint
Differentiated
Worksheet
Interactive Excel File
All students should be able to simplify and evaluate terms written
in index form where an integer base is raised to a negative
power.
Most students should be able to simplify and evaluate terms
written in index form where a decimal base is raised to a
negative power.
Some students should be able to simplify and evaluate terms
written in index form where the base is written as a fraction or
mixed number is raised to a negative power.
Lesson Plan
Smart Notebook
Activ Inspire
Flipchart
Microsoft
PowerPoint
Differentiated
Worksheet
All students should be able to understand the meaning of an
Irrational number
Most students should be able to understand the meaning of an
Irrational number and simplify surds
Some students should be able to simplify products and quotients
involving surds
Lesson Plan
Smart Notebook
Activ Inspire
Flipchart
Microsoft
PowerPoint
Differentiated
Worksheet
All students should be able to calculate the product of two
brackets involving surds.
Most students should be able to substitute a surd into an
expression and evaluate the result
Some students should be able to solve problems using surds in
context.
Lesson Plan
Smart Notebook
Activ Inspire
Flipchart
Microsoft
PowerPoint
Differentiated
Worksheet
All students should be able to rationalise a denominator with a
integer term as the numerator
Most students should be able to rationalise a denominator with a
surd as the numerator
Some students should be able to rationalise a denominator with
a integer and surd in the numerator
Lesson Plan
Smart Notebook
Activ Inspire
Flipchart
Microsoft
PowerPoint
Differentiated
Worksheet
58
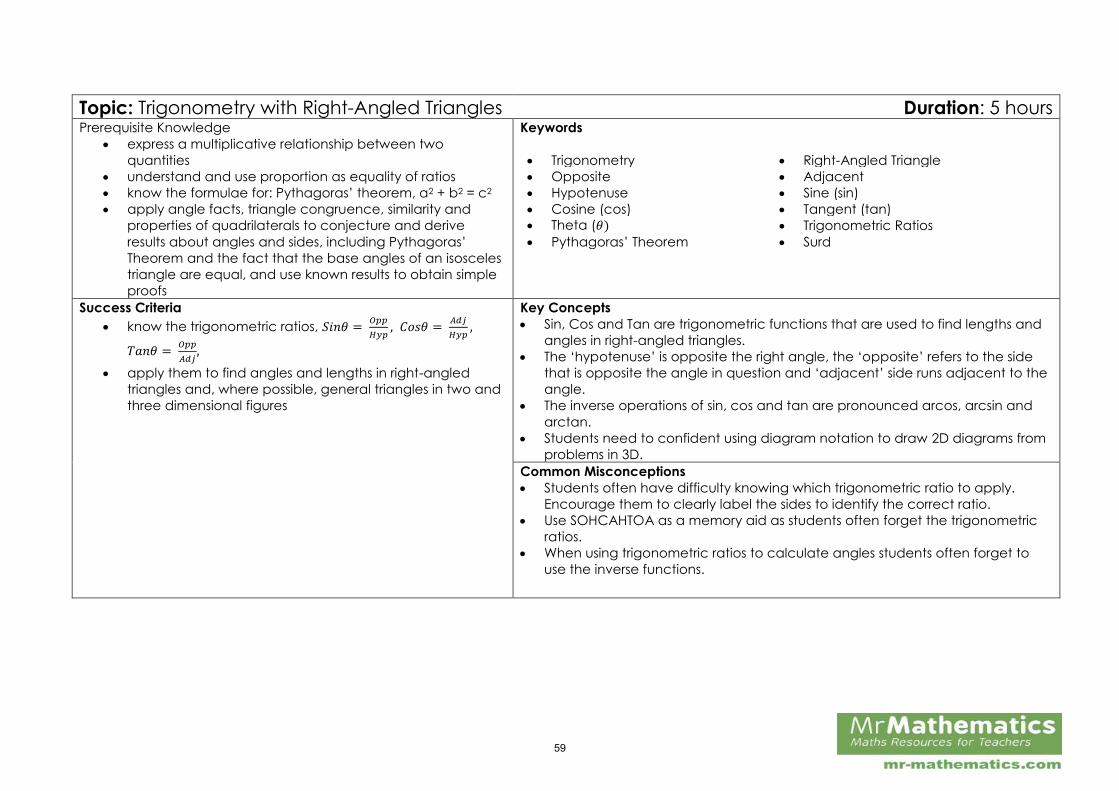
Topic: Trigonometry with Right-Angled Triangles Duration: 5 hours Prerequisite Knowledge
express a multiplicative relationship between two
quantities
understand and use proportion as equality of ratios
know the formulae for: Pythagoras’ theorem, a2 + b2 = c2
apply angle facts, triangle congruence, similarity and
properties of quadrilaterals to conjecture and derive
results about angles and sides, including Pythagoras’
Theorem and the fact that the base angles of an isosceles
triangle are equal, and use known results to obtain simple
proofs
Keywords
Trigonometry Right-Angled Triangle
Opposite Adjacent
Hypotenuse Sine (sin)
Cosine (cos) Tangent (tan)
Theta (𝜃) Trigonometric Ratios
Pythagoras’ Theorem Surd
Success Criteria
know the trigonometric ratios, 𝑆𝑖𝑛𝜃 =𝑂𝑝𝑝
𝐻𝑦𝑝, 𝐶𝑜𝑠𝜃 =
𝐴𝑑𝑗
𝐻𝑦𝑝,
𝑇𝑎𝑛𝜃 = 𝑂𝑝𝑝
𝐴𝑑𝑗,
apply them to find angles and lengths in right-angled
triangles and, where possible, general triangles in two and
three dimensional figures
Key Concepts
Sin, Cos and Tan are trigonometric functions that are used to find lengths and
angles in right-angled triangles.
The ‘hypotenuse’ is opposite the right angle, the ‘opposite’ refers to the side
that is opposite the angle in question and ‘adjacent’ side runs adjacent to the
angle.
The inverse operations of sin, cos and tan are pronounced arcos, arcsin and
arctan.
Students need to confident using diagram notation to draw 2D diagrams from
problems in 3D.
Common Misconceptions
Students often have difficulty knowing which trigonometric ratio to apply.
Encourage them to clearly label the sides to identify the correct ratio.
Use SOHCAHTOA as a memory aid as students often forget the trigonometric
ratios.
When using trigonometric ratios to calculate angles students often forget to
use the inverse functions.
59
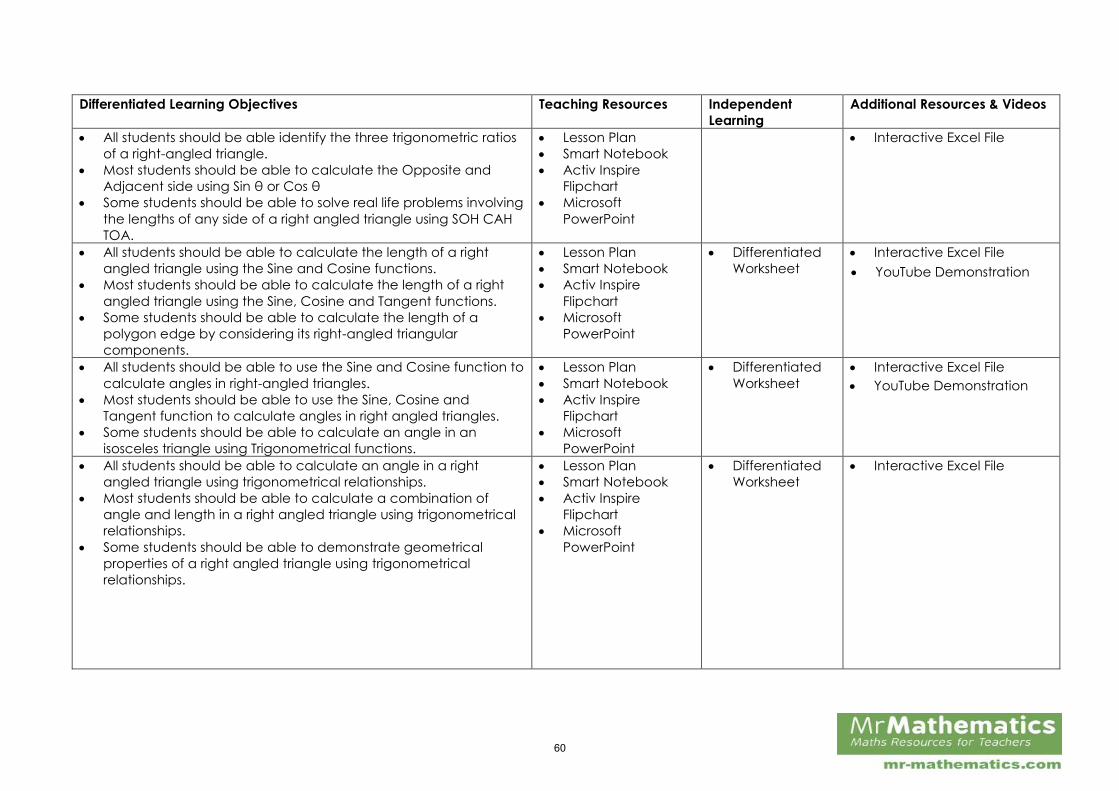
Differentiated Learning Objectives Teaching Resources Independent
Learning
Additional Resources & Videos
All students should be able identify the three trigonometric ratios
of a right-angled triangle.
Most students should be able to calculate the Opposite and
Adjacent side using Sin θ or Cos θ
Some students should be able to solve real life problems involving
the lengths of any side of a right angled triangle using SOH CAH
TOA.
Lesson Plan
Smart Notebook
Activ Inspire
Flipchart
Microsoft
PowerPoint
Interactive Excel File
All students should be able to calculate the length of a right
angled triangle using the Sine and Cosine functions.
Most students should be able to calculate the length of a right
angled triangle using the Sine, Cosine and Tangent functions.
Some students should be able to calculate the length of a
polygon edge by considering its right-angled triangular
components.
Lesson Plan
Smart Notebook
Activ Inspire
Flipchart
Microsoft
PowerPoint
Differentiated
Worksheet
Interactive Excel File
All students should be able to use the Sine and Cosine function to
calculate angles in right-angled triangles.
Most students should be able to use the Sine, Cosine and
Tangent function to calculate angles in right angled triangles.
Some students should be able to calculate an angle in an
isosceles triangle using Trigonometrical functions.
Lesson Plan
Smart Notebook
Activ Inspire
Flipchart
Microsoft
PowerPoint
Differentiated
Worksheet
Interactive Excel File
All students should be able to calculate an angle in a right
angled triangle using trigonometrical relationships.
Most students should be able to calculate a combination of
angle and length in a right angled triangle using trigonometrical
relationships.
Some students should be able to demonstrate geometrical
properties of a right angled triangle using trigonometrical
relationships.
Lesson Plan
Smart Notebook
Activ Inspire
Flipchart
Microsoft
PowerPoint
Differentiated
Worksheet
Interactive Excel File
YouTube Demonstration
YouTube Demonstration
60
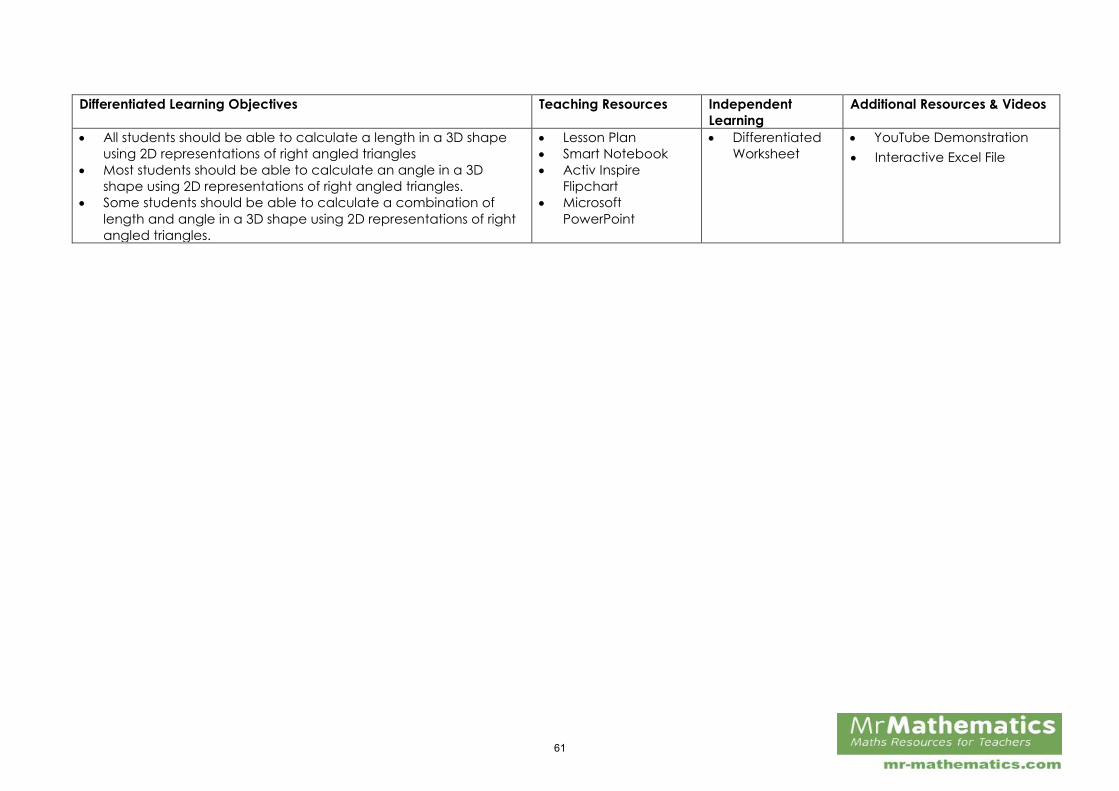
Differentiated Learning Objectives Teaching Resources Independent
Learning
Additional Resources & Videos
All students should be able to calculate a length in a 3D shape
using 2D representations of right angled triangles
Most students should be able to calculate an angle in a 3D
shape using 2D representations of right angled triangles.
Some students should be able to calculate a combination of
length and angle in a 3D shape using 2D representations of right
angled triangles.
Lesson Plan
Smart Notebook
Activ Inspire
Flipchart
Microsoft
PowerPoint
Differentiated
Worksheet
YouTube Demonstration
Interactive Excel File
61

Topic: Volume and Surface Area Duration: 8 hoursPrerequisite Knowledge
use standard units of measure and related concepts (length, area,
volume/capacity
know and apply formulae to calculate: area of triangles,
parallelograms, trapezia;
know the formulae: circumference of a circle = 2πr = πd, area of a
circle = πr2; calculate: perimeters of 2D shapes, including circles;
areas of circles and composite shapes
Keywords
Volume Surface Area
Capacity Cylinder
Cuboid Prism
Prism Cross-Section
Compound Shape
Success Criteria
know and apply formulae to calculate the volume of cuboids and
other right prisms (including cylinders)
know the formulae to calculate the surface area and volume of
spheres, pyramids, cones and composite solids
Key Concepts
To calculate the volume of a prism identify the cross-section and
calculate its area. The volume is a product this area and its depth.
When calculating surface areas encourage students to illustrate their
working by either writing the area on the faces of the 3D
representation or create the net diagram so all individual faces can
be seen.
While students are not necessarily required to derive the formulae for
the volume and surface area of complex shapes they do need to be
proficient with substituting in known values.
Common Misconceptions
Students often forget to include units when calculating volumes and
areas.
It is important to differentiate between those which are prisms and
those which are not. Encourage students to identify the cross-section
whenever possible.
Pyramid
62

Differentiated Learning Objectives Teaching Resources Independent Learning Additional Resources &
Videos
All students should be able to calculate the volume of a cuboid
using the cross sectional area and depth
Most students should be able to calculate the volume of a
cylinder and triangular prism using the cross sectional area and
depth.
Some students should be able to calculate the volume of any
prism by identifying the area of the cross section.
Lesson Plan
Smart Notebook
Activ Inspire
Flipchart
Microsoft
PowerPoint
Differentiated
Worksheet
Interactive Geogebra
File
All students should be able to calculate a Total Surface Area
when given a cuboid’s volume.
Most students should be able to calculate multiple Total Surface
Areas when given a fixed volume.
Some students should be able to calculate the multiple total
surface areas when given a fixed volume of a compound prism.
Lesson Plan
Smart Notebook
Activ Inspire
Flipchart
Microsoft
PowerPoint
Interactive Geogebra
File
All students should be able to calculate the volume of a cylinder.
Most students should be able to calculate the volume and total
surface area of a cylinder.
Some students should be able to calculate the volume and total
surface area of compound shapes involving cylinders.
Lesson Plan
Smart Notebook
Activ Inspire
Flipchart
Microsoft
PowerPoint
Differentiated
Worksheet
Interactive Geogebra
File
YouTube Demonstration
All students should be able to calculate the volume and total
surface area of a sphere.
Most students should be able to calculate the volume and total
surface area of a hemisphere.
Some students should be able to calculate the volume and total
surface area of compound shapes involving spheres.
Lesson Plan
Smart Notebook
Activ Inspire
Flipchart
Microsoft
PowerPoint
Differentiated
Worksheet
Interactive Excel File
YouTube Demonstration
Spheres
YouTube Demonstration
Hemispheres.
Interactive Excel File
Interactive Excel File
Interactive Excel File
Interactive Excel File
Interactive Geogebra File
63
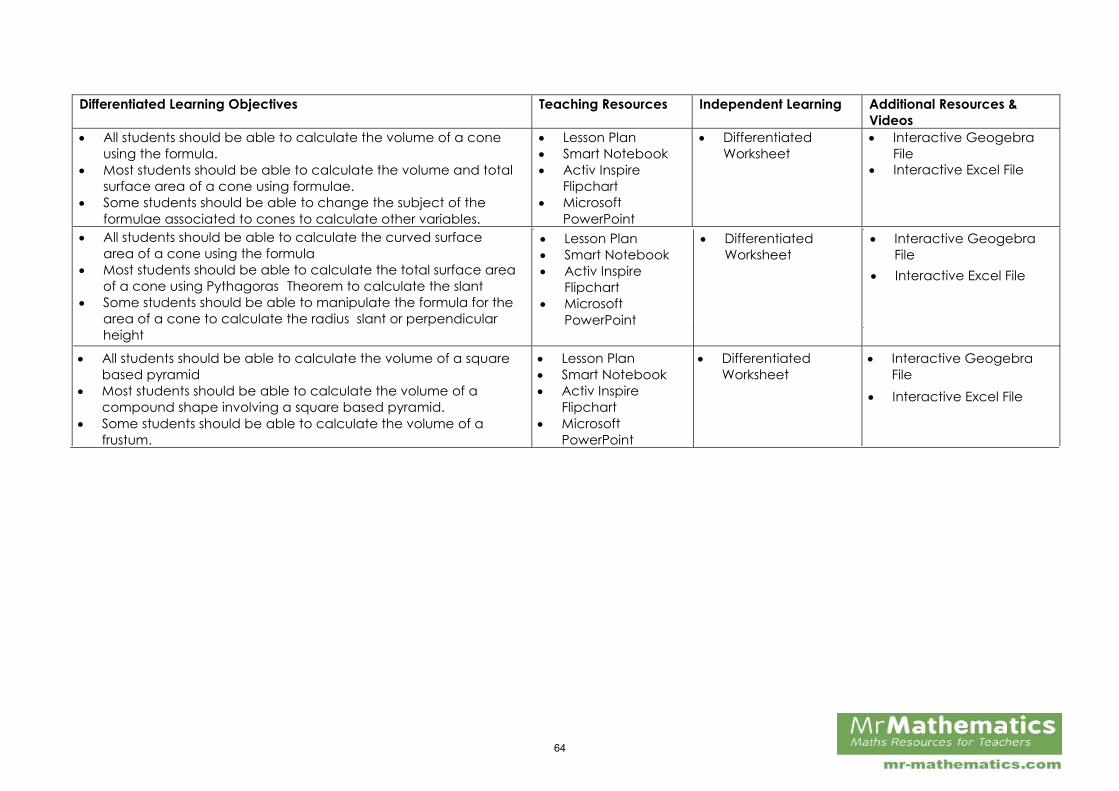
Differentiated Learning Objectives Teaching Resources Independent Learning Additional Resources &
Videos
All students should be able to calculate the volume of a cone
using the formula.
Most students should be able to calculate the volume and total
surface area of a cone using formulae.
Some students should be able to change the subject of the
formulae associated to cones to calculate other variables.
Lesson Plan
Smart Notebook
Activ Inspire
Flipchart
Microsoft
PowerPoint
Differentiated
Worksheet
Interactive Geogebra
File
All students should be able to calculate the volume of a square
based pyramid
Most students should be able to calculate the volume of a
compound shape involving a square based pyramid.
Some students should be able to calculate the volume of a
frustum.
Lesson Plan
Smart Notebook
Activ Inspire
Flipchart
Microsoft
PowerPoint
Differentiated
Worksheet
Interactive Geogebra
File
All students should be able to calculate the curved surface area of a cone using the formula.
Most students should be able to calculate the total surface area of a cone using Pythagoras’ Theorem to calculate the slant.
Some students should be able to manipulate the formula for the area of a cone to calculate the radius, slant or perpendicular height.
Lesson Plan
Smart Notebook
Activ Inspire
Flipchart
Microsoft
PowerPoint
Differentiated
Worksheet
Interactive Geogebra
File
Interactive Excel File
Interactive Excel File
Interactive Excel File
64
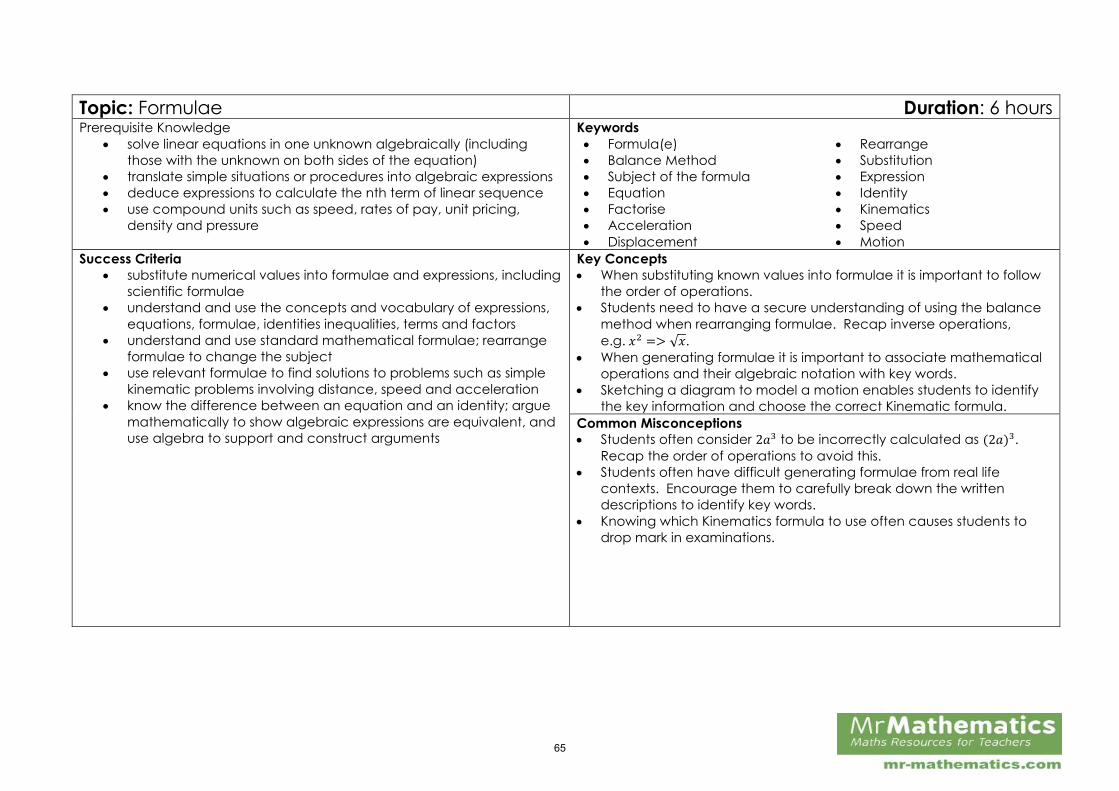
Topic: Formulae Duration: 6 hours Prerequisite Knowledge
solve linear equations in one unknown algebraically (including
those with the unknown on both sides of the equation)
translate simple situations or procedures into algebraic expressions
deduce expressions to calculate the nth term of linear sequence
use compound units such as speed, rates of pay, unit pricing,
density and pressure
Keywords
Formula(e) Rearrange
Balance Method Substitution
Subject of the formula Expression
Equation Identity
Factorise Kinematics
Acceleration Speed
Displacement MotionSuccess Criteria
substitute numerical values into formulae and expressions, including
scientific formulae
understand and use the concepts and vocabulary of expressions,
equations, formulae, identities inequalities, terms and factors
understand and use standard mathematical formulae; rearrange
formulae to change the subject
use relevant formulae to find solutions to problems such as simple
kinematic problems involving distance, speed and acceleration
know the difference between an equation and an identity; argue
mathematically to show algebraic expressions are equivalent, and
use algebra to support and construct arguments
Key Concepts
When substituting known values into formulae it is important to follow
the order of operations.
Students need to have a secure understanding of using the balance
method when rearranging formulae. Recap inverse operations,
e.g. 𝑥2 => √𝑥.
When generating formulae it is important to associate mathematical
operations and their algebraic notation with key words.
Sketching a diagram to model a motion enables students to identify
the key information and choose the correct Kinematic formula.
Common Misconceptions
Students often consider 2𝑎3 to be incorrectly calculated as (2𝑎)3.
Recap the order of operations to avoid this.
Students often have difficult generating formulae from real life
contexts. Encourage them to carefully break down the written
descriptions to identify key words.
Knowing which Kinematics formula to use often causes students to
drop mark in examinations.
65
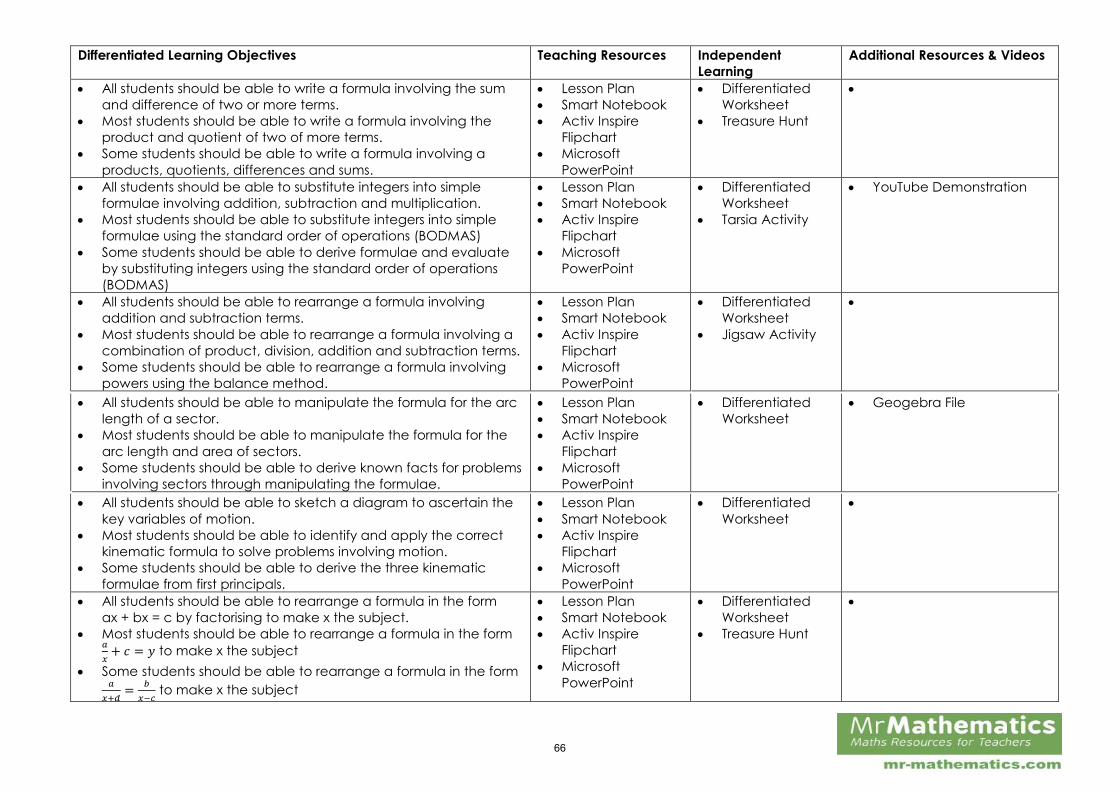
Differentiated Learning Objectives Teaching Resources Independent
Learning
Additional Resources & Videos
All students should be able to write a formula involving the sum
and difference of two or more terms.
Most students should be able to write a formula involving the
product and quotient of two of more terms.
Some students should be able to write a formula involving a
products, quotients, differences and sums.
Lesson Plan
Smart Notebook
Activ Inspire
Flipchart
Microsoft
PowerPoint
Differentiated
Worksheet
Treasure Hunt
All students should be able to substitute integers into simple
formulae involving addition, subtraction and multiplication.
Most students should be able to substitute integers into simple
formulae using the standard order of operations (BODMAS)
Some students should be able to derive formulae and evaluate
by substituting integers using the standard order of operations
(BODMAS)
Lesson Plan
Smart Notebook
Activ Inspire
Flipchart
Microsoft
PowerPoint
Differentiated
Worksheet
Tarsia Activity
YouTube Demonstration
All students should be able to rearrange a formula involving
addition and subtraction terms.
Most students should be able to rearrange a formula involving a
combination of product, division, addition and subtraction terms.
Some students should be able to rearrange a formula involving
powers using the balance method.
Lesson Plan
Smart Notebook
Activ Inspire
Flipchart
Microsoft
PowerPoint
Differentiated
Worksheet
Jigsaw Activity
All students should be able to sketch a diagram to ascertain the
key variables of motion.
Most students should be able to identify and apply the correct
kinematic formula to solve problems involving motion.
Some students should be able to derive the three kinematic
formulae from first principals.
Lesson Plan
Smart Notebook
Activ Inspire
Flipchart
Microsoft
PowerPoint
Differentiated
Worksheet
All students should be able to rearrange a formula in the form
ax + bx = c by factorising to make x the subject.
Most students should be able to rearrange a formula in the form𝑎
𝑥+ 𝑐 = 𝑦 to make x the subject
Some students should be able to rearrange a formula in the form𝑎
𝑥+𝑑=
𝑏
𝑥−𝑐 to make x the subject
Lesson Plan
Smart Notebook
Activ Inspire
Flipchart
Microsoft
PowerPoint
Differentiated
Worksheet
Treasure Hunt
66
All students should be able to manipulate the formula for the arc
length of a sector.
Most students should be able to manipulate the formula for the
arc length and area of sectors.
Some students should be able to derive known facts for problems
involving sectors through manipulating the formulae.
Lesson Plan
Smart Notebook
Activ Inspire
Flipchart
Microsoft
PowerPoint
Differentiated
Worksheet
Geogebra File
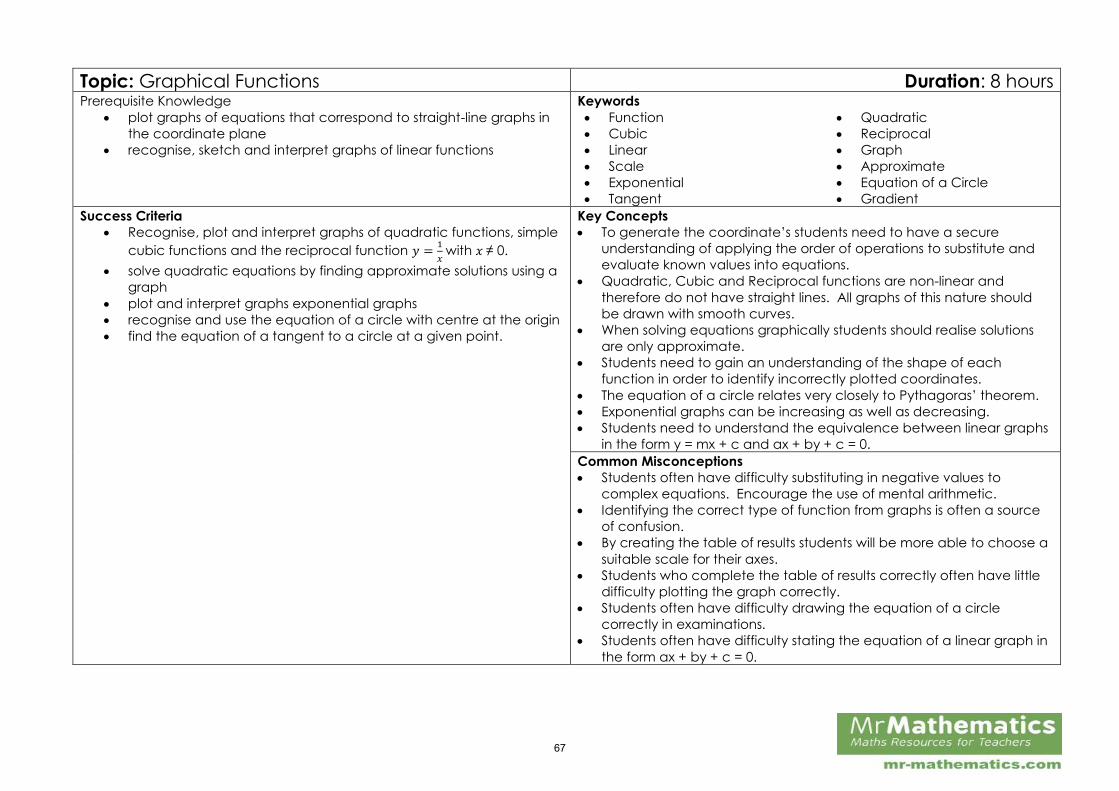
Topic: Graphical Functions Duration: 8 hours Prerequisite Knowledge
plot graphs of equations that correspond to straight-line graphs inthe coordinate plane
recognise, sketch and interpret graphs of linear functions
Keywords Function Quadratic Cubic Reciprocal Linear Graph Scale Approximate Exponential Equation of a Circle Tangent Gradient
Success Criteria Recognise, plot and interpret graphs of quadratic functions, simple
cubic functions and the reciprocal function 𝑦 =1
𝑥with 𝑥 ≠ 0.
solve quadratic equations by finding approximate solutions using agraph
plot and interpret graphs exponential graphs recognise and use the equation of a circle with centre at the origin find the equation of a tangent to a circle at a given point.
Key Concepts To generate the coordinate’s students need to have a secure
understanding of applying the order of operations to substitute andevaluate known values into equations.
Quadratic, Cubic and Reciprocal functions are non-linear andtherefore do not have straight lines. All graphs of this nature shouldbe drawn with smooth curves.
When solving equations graphically students should realise solutionsare only approximate.
Students need to gain an understanding of the shape of eachfunction in order to identify incorrectly plotted coordinates.
The equation of a circle relates very closely to Pythagoras’ theorem.
Exponential graphs can be increasing as well as decreasing. Students need to understand the equivalence between linear graphs
in the form y = mx + c and ax + by + c = 0.Common Misconceptions Students often have difficulty substituting in negative values to
complex equations. Encourage the use of mental arithmetic. Identifying the correct type of function from graphs is often a source
of confusion. By creating the table of results students will be more able to choose a
suitable scale for their axes. Students who complete the table of results correctly often have little
difficulty plotting the graph correctly. Students often have difficulty drawing the equation of a circle
correctly in examinations. Students often have difficulty stating the equation of a linear graph in
the form ax + by + c = 0.
67
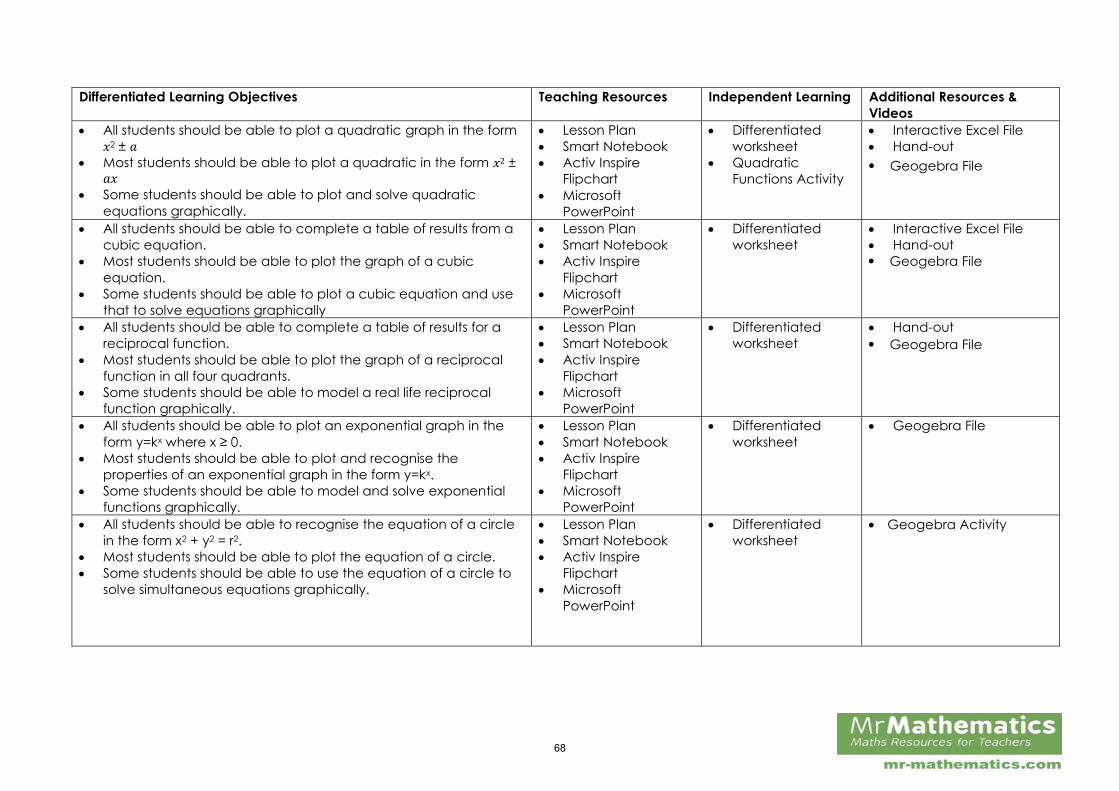
Differentiated Learning Objectives Teaching Resources Independent Learning Additional Resources & Videos
All students should be able to plot a quadratic graph in the form𝑥2 ± 𝑎
Most students should be able to plot a quadratic in the form 𝑥2 ±𝑎𝑥
Some students should be able to plot and solve quadraticequations graphically.
Lesson Plan Smart Notebook Activ Inspire
Flipchart Microsoft
PowerPoint
Differentiatedworksheet
QuadraticFunctions Activity
Interactive Excel File Hand-out
All students should be able to complete a table of results from acubic equation.
Most students should be able to plot the graph of a cubicequation.
Some students should be able to plot a cubic equation and usethat to solve equations graphically
Lesson Plan Smart Notebook Activ Inspire
Flipchart Microsoft
PowerPoint
Differentiatedworksheet
Interactive Excel File Hand-out
All students should be able to complete a table of results for areciprocal function.
Most students should be able to plot the graph of a reciprocalfunction in all four quadrants.
Some students should be able to model a real life reciprocalfunction graphically.
Lesson Plan Smart Notebook Activ Inspire
Flipchart Microsoft
PowerPoint
Differentiatedworksheet
Hand-out
All students should be able to plot an exponential graph in theform y=kx where x ≥ 0.
Most students should be able to plot and recognise theproperties of an exponential graph in the form y=kx.
Some students should be able to model and solve exponentialfunctions graphically.
Lesson Plan Smart Notebook Activ Inspire
Flipchart Microsoft
PowerPoint
Differentiatedworksheet
Geogebra File
All students should be able to recognise the equation of a circlein the form x2 + y2 = r2.
Most students should be able to plot the equation of a circle. Some students should be able to use the equation of a circle to
solve simultaneous equations graphically.
Lesson Plan Smart Notebook Activ Inspire
Flipchart Microsoft
PowerPoint
Differentiatedworksheet
68
Geogebra Activity
Geogebra File
Geogebra File
Geogebra File
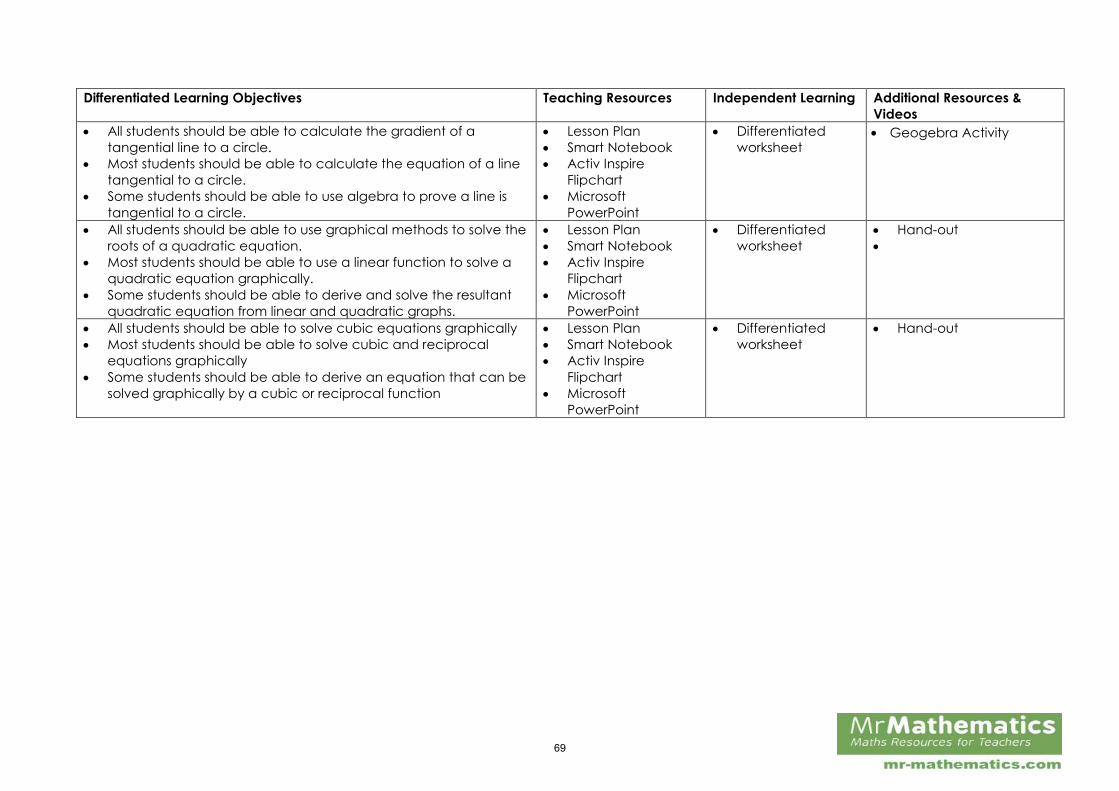
Differentiated Learning Objectives Teaching Resources Independent Learning Additional Resources & Videos
All students should be able to calculate the gradient of atangential line to a circle.
Most students should be able to calculate the equation of a linetangential to a circle.
Some students should be able to use algebra to prove a line istangential to a circle.
Lesson Plan Smart Notebook Activ Inspire
Flipchart Microsoft
PowerPoint
Differentiatedworksheet
All students should be able to use graphical methods to solve theroots of a quadratic equation.
Most students should be able to use a linear function to solve aquadratic equation graphically.
Some students should be able to derive and solve the resultantquadratic equation from linear and quadratic graphs.
Lesson Plan Smart Notebook Activ Inspire
Flipchart Microsoft
PowerPoint
Differentiatedworksheet
Hand-out
All students should be able to solve cubic equations graphically Most students should be able to solve cubic and reciprocal
equations graphically Some students should be able to derive an equation that can be
solved graphically by a cubic or reciprocal function
Lesson Plan Smart Notebook Activ Inspire
Flipchart Microsoft
PowerPoint
Differentiatedworksheet
Hand-out
69
Geogebra Activity
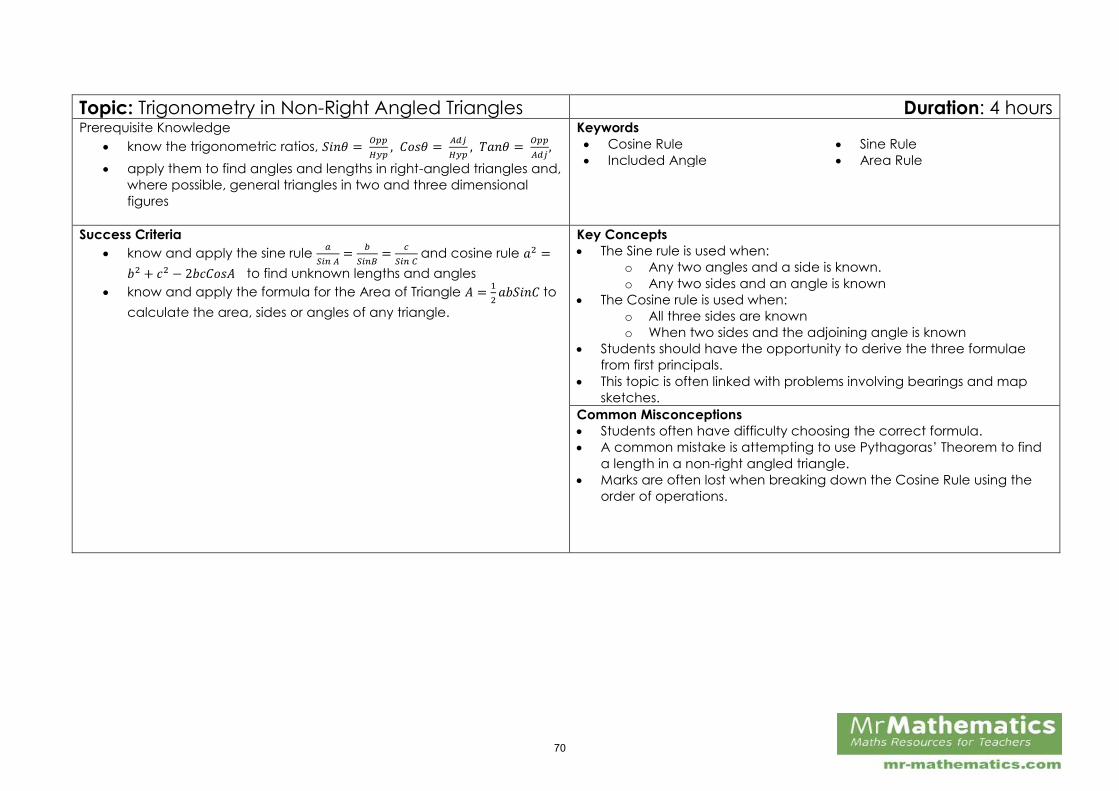
Topic: Trigonometry in Non-Right Angled Triangles Duration: 4 hours Prerequisite Knowledge
know the trigonometric ratios, 𝑆𝑖𝑛𝜃 = 𝑂𝑝𝑝
𝐻𝑦𝑝, 𝐶𝑜𝑠𝜃 =
𝐴𝑑𝑗
𝐻𝑦𝑝, 𝑇𝑎𝑛𝜃 =
𝑂𝑝𝑝
𝐴𝑑𝑗,
apply them to find angles and lengths in right-angled triangles and,
where possible, general triangles in two and three dimensional
figures
Keywords
Cosine Rule Sine Rule
Included Angle Area Rule
Success Criteria
know and apply the sine rule 𝑎
𝑆𝑖𝑛 𝐴=
𝑏
𝑆𝑖𝑛𝐵=
𝑐
𝑆𝑖𝑛 𝐶 and cosine rule 𝑎2 =
𝑏2 + 𝑐2 − 2𝑏𝑐𝐶𝑜𝑠𝐴 to find unknown lengths and angles
know and apply the formula for the Area of Triangle 𝐴 =1
2𝑎𝑏𝑆𝑖𝑛𝐶 to
calculate the area, sides or angles of any triangle.
Key Concepts
The Sine rule is used when:
o Any two angles and a side is known.
o Any two sides and an angle is known
The Cosine rule is used when:
o All three sides are known
o When two sides and the adjoining angle is known
Students should have the opportunity to derive the three formulae
from first principals.
This topic is often linked with problems involving bearings and map
sketches.
Common Misconceptions
Students often have difficulty choosing the correct formula.
A common mistake is attempting to use Pythagoras’ Theorem to find
a length in a non-right angled triangle.
Marks are often lost when breaking down the Cosine Rule using the
order of operations.
70
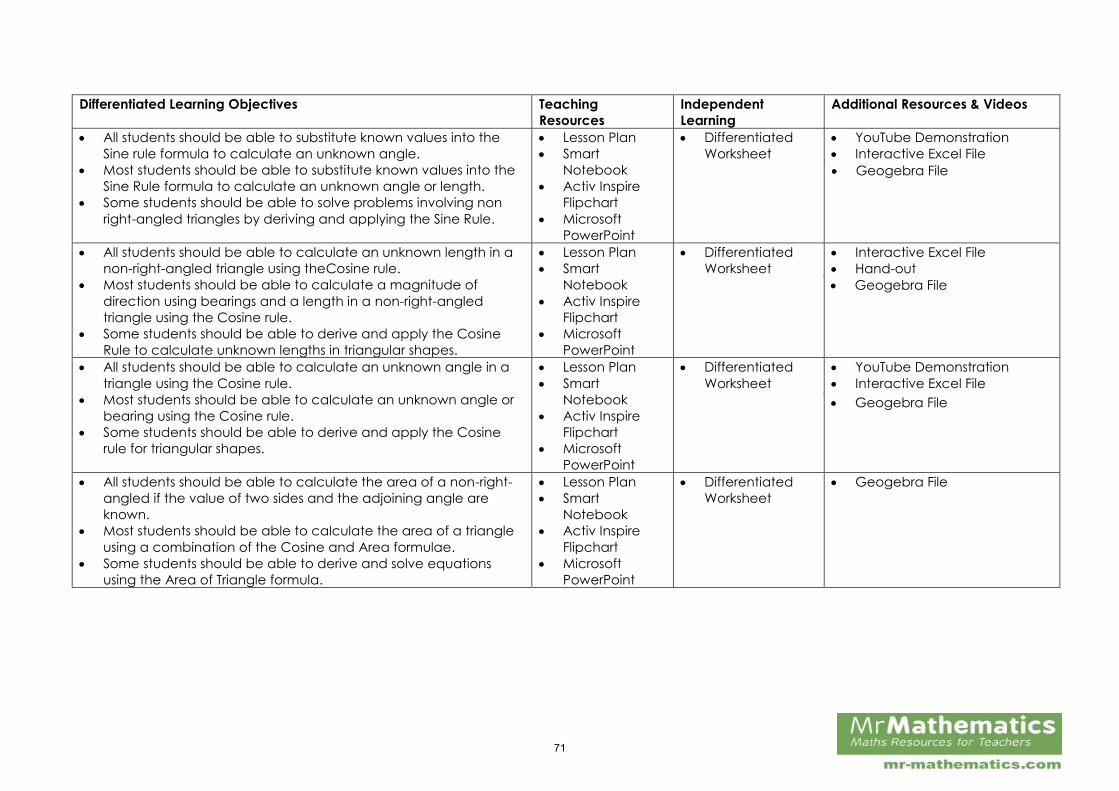
Differentiated Learning Objectives Teaching
Resources
Independent
Learning
Additional Resources & Videos
All students should be able to substitute known values into the
Sine rule formula to calculate an unknown angle.
Most students should be able to substitute known values into the
Sine Rule formula to calculate an unknown angle or length.
Some students should be able to solve problems involving non
right-angled triangles by deriving and applying the Sine Rule.
Lesson Plan
Smart
Notebook
Activ Inspire
Flipchart
Microsoft
PowerPoint
Differentiated
Worksheet
YouTube Demonstration
Interactive Excel File
All students should be able to calculate an unknown length in a
non-right-angled triangle using theCosine rule.
Most students should be able to calculate a magnitude of
direction using bearings and a length in a non-right-angled
triangle using the Cosine rule.
Some students should be able to derive and apply the Cosine
Rule to calculate unknown lengths in triangular shapes.
Lesson Plan
Smart
Notebook
Activ Inspire
Flipchart
Microsoft
PowerPoint
Differentiated
Worksheet
Interactive Excel File
All students should be able to calculate an unknown angle in a
triangle using the Cosine rule.
Most students should be able to calculate an unknown angle or
bearing using the Cosine rule.
Some students should be able to derive and apply the Cosine
rule for triangular shapes.
Lesson Plan
Smart
Notebook
Activ Inspire
Flipchart
Microsoft
PowerPoint
Differentiated
Worksheet
YouTube Demonstration
Interactive Excel File
All students should be able to calculate the area of a non-right-
angled if the value of two sides and the adjoining angle are
known.
Most students should be able to calculate the area of a triangle
using a combination of the Cosine and Area formulae.
Some students should be able to derive and solve equations
using the Area of Triangle formula.
Lesson Plan
Smart
Notebook
Activ Inspire
Flipchart
Microsoft
PowerPoint
Differentiated
Worksheet
Geogebra File
Hand-out
71
Geogebra File
Geogebra File
Geogebra File
Topic: Proportion and Variation Duration: 3 Hours Prerequisite Knowledge
use ratio notation, including reduction to simplest form
express a multiplicative relationship between two quantities
as a ratio
understand and use proportion as equality of ratios
relate ratios to fractions
express the division of a quantity into two parts as a ratio
apply ratio to real contexts and problems (such as those
involving conversion, comparison, scaling, mixing,
concentrations)
understand and use proportion as equality of ratios
Keywords
Variation Direct
Indirect Proportion
Varies Formula
Constant of proportionality Squared
Cube Square root
Cube root Inverse(ly)
Success Criteria
understand that X is inversely proportional to Y is equivalent to X is
proportional to 1/Y;
construct and interpret equations that describe direct and inverse
proportion.
Key Concepts
The symbol ∝ is used to represent ‘is proportional to’.
Direct proportion and varies directly both include 𝑦 ∝ 𝑥, 𝑦 ∝ 𝑥2 and 𝑦 ∝𝑥3.
Indirect proportion and varies inversely both include 𝑦 ∝1
𝑥 and 𝑦 ∝
1
𝑥2.
k is used as the constant of proportionality.
Students need to be able to associate the graphical representations
with the various proportions.
Common Misconceptions
Students often struggle with writing the correct proportional formula
from the written description. Writing indirect proportions is particularly
difficult for most students.
Modelling the variation as a formula with the correct value of k is key
to accessing this topic.
When students do write the correct formula they are often unable to
correctly manipulate it to calculate unknown values.
72

Differentiated Learning Objectives Teaching
Resources
Independent
Learning
Additional Resources & Videos
All students should be able to derive a formula using the constant
of proportionality to describe how two measurements are in
proportion.
Most students should be able to derive and use a formula with
the constant of proportionality to calculate measurements that
are in direct proportion.
Some students should be able to solve problems in context by
deriving and using the constant of proportionality.
Lesson Plan
Smart
Notebook
Activ Inspire
Flipchart
Microsoft
PowerPoint
Differentiated
Worksheet
Interactive Excel File
All students should be able to calculate the constant of variation
that models how two measurements are in direct proportion.
Most students should be able to derive and use the formula that
models how two measurements are in direct proportion.
Some students should be able to model how two measurements
are in nonlinear direct proportion using a formula and graph.
Lesson Plan
Smart
Notebook
Activ Inspire
Flipchart
Microsoft
PowerPoint
Differentiated
Worksheet
Interactive Excel File
All students should be able to derive a formula in the form 1/x to
model inverse proportion.
Most students should be able to derive a formula to model
inverse proportion and use it to calculate unknown values.
Some students should be able to derive and use a formula to
model when one unit is inversely proportion to the square or
cube of another.
Lesson Plan
Smart
Notebook
Activ Inspire
Flipchart
Microsoft
PowerPoint
Differentiated
Worksheet
Jigsaw Activity
Interactive Excel File
73
Topic: Circle Theorems Duration: 3 hours Prerequisite Knowledge
understand and use alternate and corresponding angles on
parallel lines;
derive and use the sum of angles in a triangle (e.g. to deduce use
the angle sum in any polygon, and to derive properties of regular
polygons)
measure line segments and angles in geometric figures, including
interpreting maps and scale drawings and use of bearings
Keywords
Circle Sector
Angle Radius
Radii Tangent
Diameter Circumference
Proof Chord
Segment Alternate segments
Success Criteria
identify and apply circle definitions and properties, including:
centre, radius, chord, diameter, circumference, tangent, arc,
sector and segment
apply and prove the standard circle theorems concerning angles,
radii, tangents and chords, and use them to prove related results
Key Concepts
Students need a solid understanding of the properties for angles in
parallel lines, vertically opposite, angles in a polygon and on a
straight line.
Understanding the various parts of a circle is critical to fully defining
the various circle theorems.
Students need to spend time breaking down the problem by
considering the various angle properties that may be relevant.
Taking time to prove the various theorems illustrates how
interconnected all the properties are.
Encourage students to annotate and draw on the diagrams.
Common Misconceptions
Students often struggle with precisely defining the various angle the
appropriate angle properties.
Incomplete angle properties are a common source for losing marks in
examinations.
Angle and line notation often confuses students to an extent they
may calculate an angle that was not asked for.
Students need to relate their written work with the relevant angle
rather than writing detached paragraphs.
74
Differentiated Learning Objectives Teaching
Resources
Independent
Learning
Additional Resources & Videos
All students should be able to discover the relationships between
the angles at the centre and circumference of a circle, opposite
angles in cyclic quadrilaterals and angles at the circumference
in the same segment.
Most students should be able to discover the three theorems and
apply them individually to calculate missing angles.
Some students should be able to discover and apply the three
properties and apply them to calculate angles involving multiple
theorems.
Lesson Plan
Smart
Notebook
Activ Inspire
Flipchart
Microsoft
PowerPoint
Differentiated
Worksheet
YouTube Demonstration
Proof – Angle at the centre & angle at the circumference
Proof – Cyclic quadrilaterals
Proof – Angles in the same segment
All students should be able to discover that a tangent and radius
intersecting at the circumference of a circle and perpendicular.
Most students should be able to discover that a tangent and
radius intersecting at the circumference of a circle are
perpendicular and that angles in alternate segments are equal.
Some students should be able to derive both theorems relating
to tangents at the circumference of a circle and apply them to
solve complex problems involving multiple circle theorems.
Lesson Plan
Smart
Notebook
Activ Inspire
Flipchart
Microsoft
PowerPoint
Differentiated
Worksheet
Geogebra - Alternate segment YouTube Demonstration
Proof – Angles is alternate segments
Geogebra 2 - Cyclic QuadsGeogebra 1 - Same segment
75
Topic: Quadratics Duration: 6 hours Prerequisite Knowledge
Simplify and manipulate algebraic expressions by:
expanding products of two or more binomials
factorising quadratic expressions of the form x2 + bx + c,
including the difference of two squares
simplifying expressions involving sums, products and
powers, including the laws of indices
factorising quadratic expressions of the form ax2 + bx + c.
Keywords
Quadratic Root
Completing the square Factorise
Quadratic Formula Expressions
Identity Equation
Turning point Parabola
Intersection Coefficient
Success Criteria
know the difference between an equation and an
identity; argue mathematically to show algebraic
expressions are equivalent, and use algebra to support
and construct arguments and proofs
simplify and manipulate algebraic expressions by
factorising quadratic expressions of the form ax2 + bx + c
understand and use standard mathematical formulae;
rearrange formulae to change the subject
identify and interpret roots, intercepts, turning points of
quadratic functions graphically
deduce roots algebraically and turning points by
completing the square
recognise, sketch and interpret graphs of quadratic
functions
solve quadratic equations (including those that require
rearrangement) algebraically by factorising, by
completing the square and by using the quadratic
formula; find approximate solutions using a graph
solve two simultaneous equations in two variables
linear/quadratic algebraically; find approximate solutions
using a graph
Key Concepts
Check brackets have been factorised correctly by multiplying them back out.
To solve quadratics by factorising students need to identify two numbers that
have a product of c and a sum of b. Roots are found when each bracket is
made to equal zero and are solved for x.
When a quadratic cannot be solved by factorising students should use
completing the square or the quadratic formula.
Students should be able to derive the quadratic formula from the method of
completing the square.
A sketched graph is drawn freehand and includes the roots, turning point and
intercept values.
Quadratic identities in the form (𝑥 + 𝑎)2 + 𝑏 ≡ 𝑎𝑥2 + 𝑏𝑥 + 𝑐 can be solved either
through completing the square to RHS = LHS or by expanding the brackets to
LHS = RHS and equating the unknowns.
Quadratic and linear simultaneous equations should be sketched before
solved algebraically to ensure students know to find and the x and y values.
Common Misconceptions
The method of trial and improvement is often incorrectly used to try and solve
quadratics.
When solving quadratic and linear simultaneous equations students often
forget to find the y values as well the x.
When using the formula to solve quadratics students often forget to evaluate
the negative solution. Some students also incorrectly apply the division by
reducing the terms it covers.
Students tend to struggle deriving quadratic equations from geometrical facts.
76
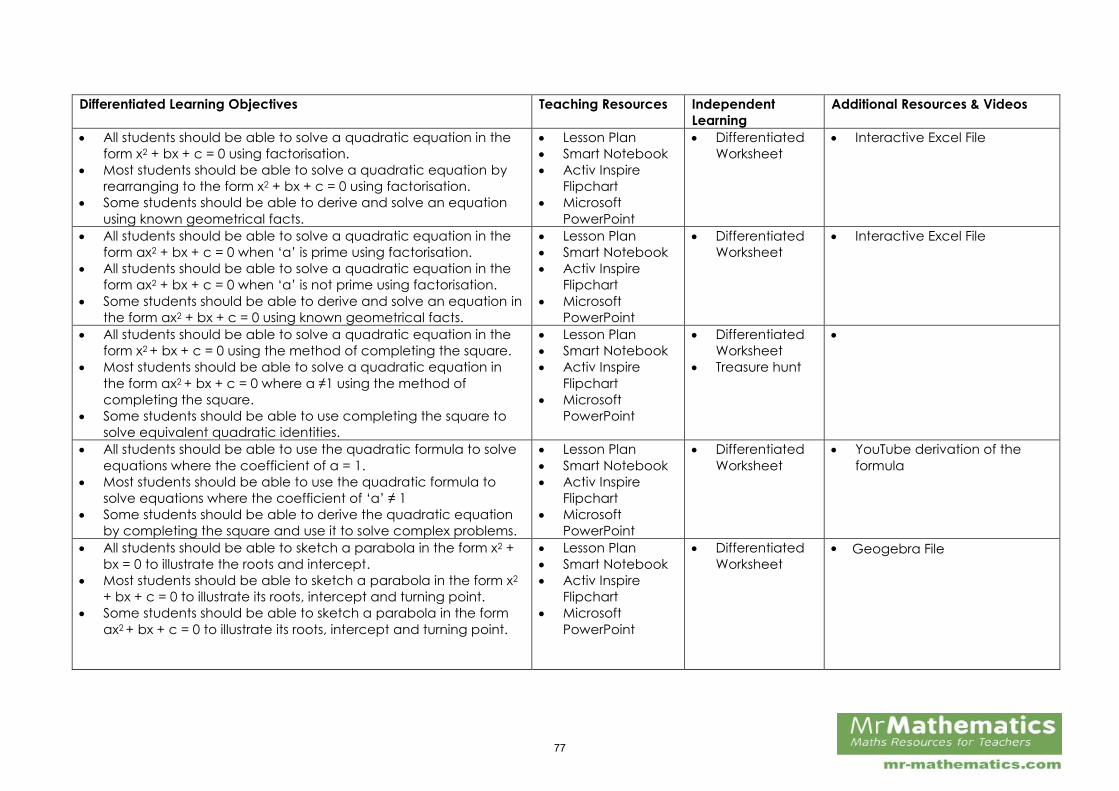
Differentiated Learning Objectives Teaching Resources Independent
Learning
Additional Resources & Videos
All students should be able to solve a quadratic equation in the
form x2 + bx + c = 0 using factorisation.
Most students should be able to solve a quadratic equation by
rearranging to the form x2 + bx + c = 0 using factorisation.
Some students should be able to derive and solve an equation
using known geometrical facts.
Lesson Plan
Smart Notebook
Activ Inspire
Flipchart
Microsoft
PowerPoint
Differentiated
Worksheet
Interactive Excel File
All students should be able to solve a quadratic equation in the
form ax2 + bx + c = 0 when ‘a’ is prime using factorisation.
All students should be able to solve a quadratic equation in the
form ax2 + bx + c = 0 when ‘a’ is not prime using factorisation.
Some students should be able to derive and solve an equation in
the form ax2 + bx + c = 0 using known geometrical facts.
Lesson Plan
Smart Notebook
Activ Inspire
Flipchart
Microsoft
PowerPoint
Differentiated
Worksheet
Interactive Excel File
All students should be able to solve a quadratic equation in the
form x2 + bx + c = 0 using the method of completing the square.
Most students should be able to solve a quadratic equation in
the form ax2 + bx + c = 0 where a ≠1 using the method of
completing the square.
Some students should be able to use completing the square to
solve equivalent quadratic identities.
Lesson Plan
Smart Notebook
Activ Inspire
Flipchart
Microsoft
PowerPoint
Differentiated
Worksheet
Treasure hunt
All students should be able to use the quadratic formula to solve
equations where the coefficient of a = 1.
Most students should be able to use the quadratic formula to
solve equations where the coefficient of ‘a’ ≠ 1
Some students should be able to derive the quadratic equation
by completing the square and use it to solve complex problems.
Lesson Plan
Smart Notebook
Activ Inspire
Flipchart
Microsoft
PowerPoint
Differentiated
Worksheet
YouTube derivation of the
formula
All students should be able to sketch a parabola in the form x2 +
bx = 0 to illustrate the roots and intercept.
Most students should be able to sketch a parabola in the form x2
+ bx + c = 0 to illustrate its roots, intercept and turning point.
Some students should be able to sketch a parabola in the form
ax2 + bx + c = 0 to illustrate its roots, intercept and turning point.
Lesson Plan
Smart Notebook
Activ Inspire
Flipchart
Microsoft
PowerPoint
Differentiated
Worksheet
Geogebra File
77
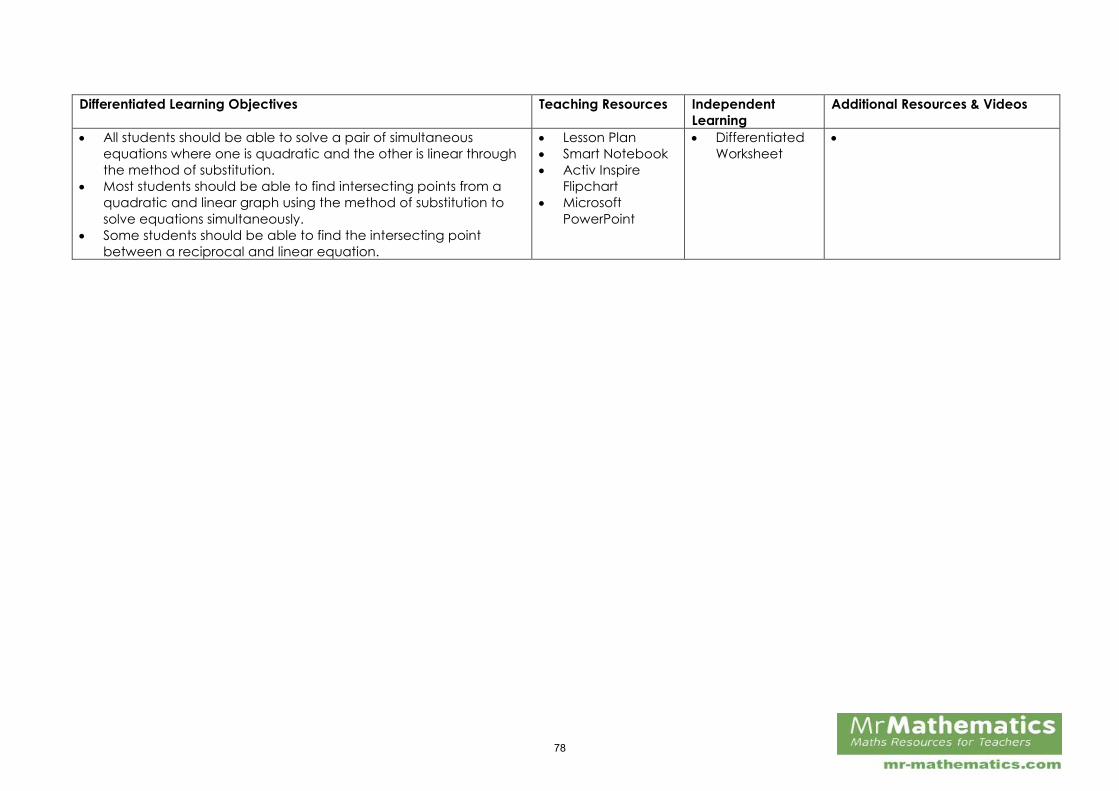
Differentiated Learning Objectives Teaching Resources Independent
Learning
Additional Resources & Videos
All students should be able to solve a pair of simultaneous
equations where one is quadratic and the other is linear through
the method of substitution.
Most students should be able to find intersecting points from a
quadratic and linear graph using the method of substitution to
solve equations simultaneously.
Some students should be able to find the intersecting point
between a reciprocal and linear equation.
Lesson Plan
Smart Notebook
Activ Inspire
Flipchart
Microsoft
PowerPoint
Differentiated
Worksheet
78
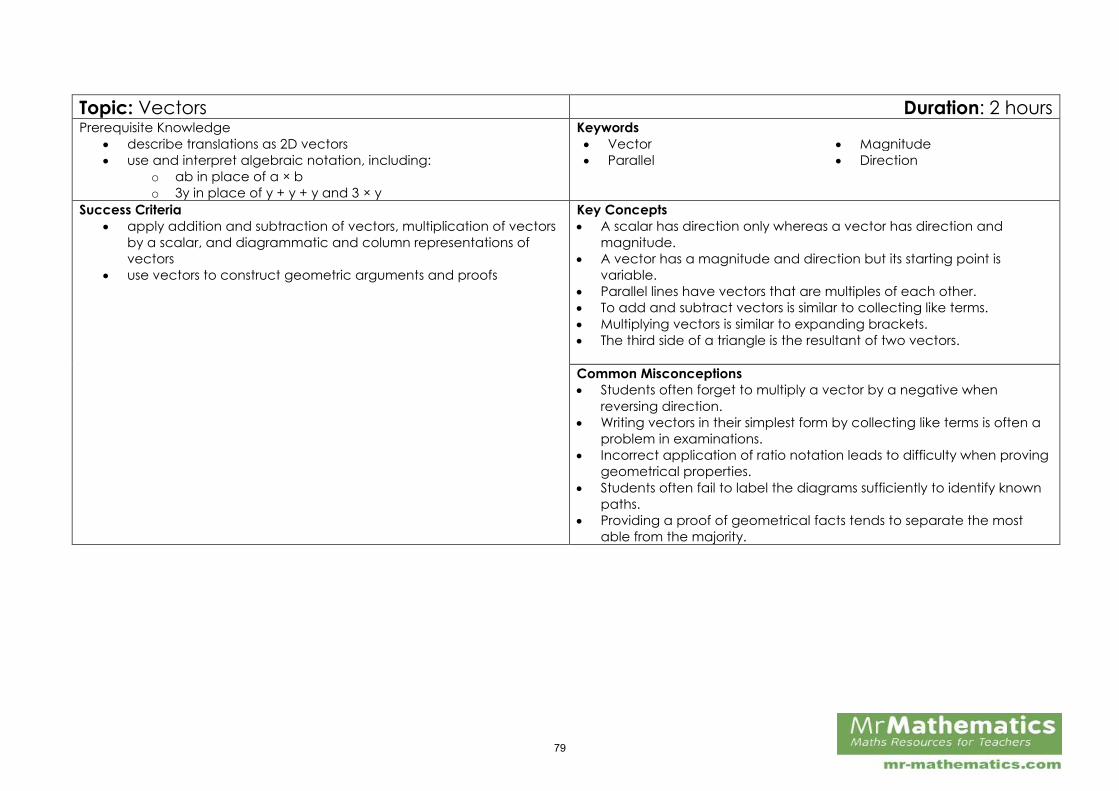
Topic: Vectors Duration: 2 hours Prerequisite Knowledge
describe translations as 2D vectors
use and interpret algebraic notation, including:
o ab in place of a × b
o 3y in place of y + y + y and 3 × y
Keywords
Vector Magnitude
Parallel Direction
Success Criteria
apply addition and subtraction of vectors, multiplication of vectors
by a scalar, and diagrammatic and column representations of
vectors
use vectors to construct geometric arguments and proofs
Key Concepts
A scalar has direction only whereas a vector has direction and
magnitude.
A vector has a magnitude and direction but its starting point is
variable.
Parallel lines have vectors that are multiples of each other.
To add and subtract vectors is similar to collecting like terms.
Multiplying vectors is similar to expanding brackets.
The third side of a triangle is the resultant of two vectors.
Common Misconceptions
Students often forget to multiply a vector by a negative when
reversing direction.
Writing vectors in their simplest form by collecting like terms is often a
problem in examinations.
Incorrect application of ratio notation leads to difficulty when proving
geometrical properties.
Students often fail to label the diagrams sufficiently to identify known
paths.
Providing a proof of geometrical facts tends to separate the most
able from the majority.
79
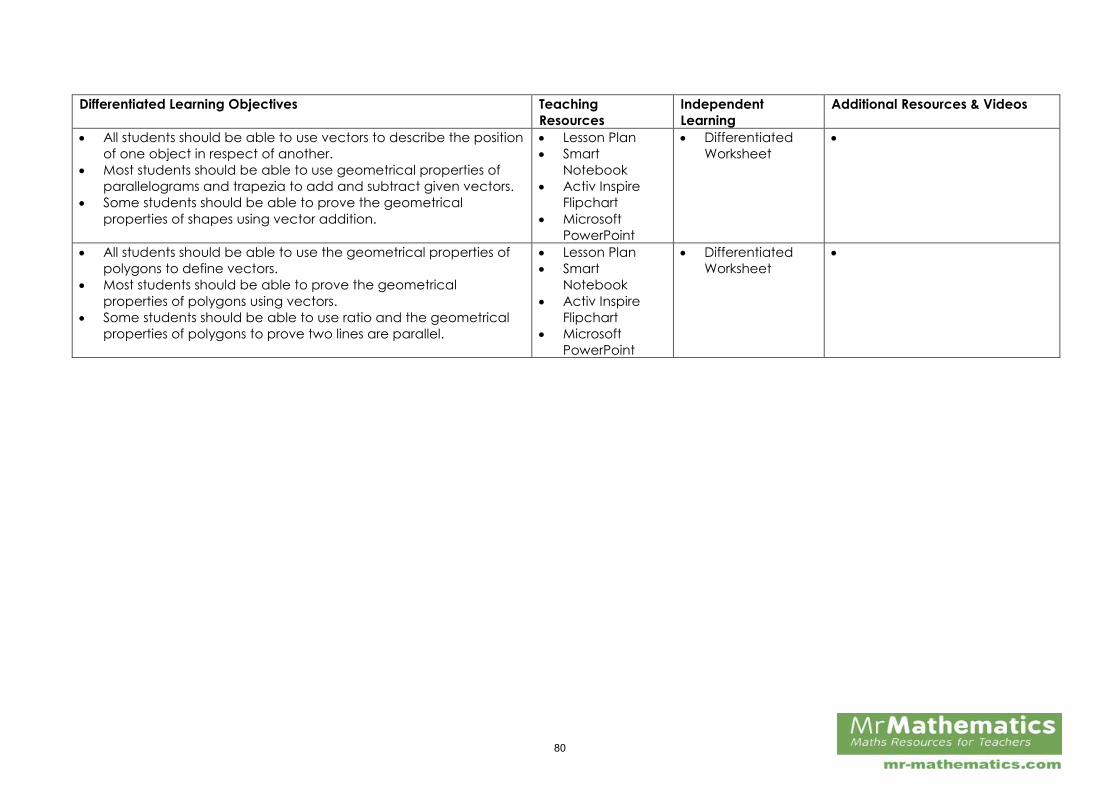
Differentiated Learning Objectives Teaching
Resources
Independent
Learning
Additional Resources & Videos
All students should be able to use vectors to describe the position
of one object in respect of another.
Most students should be able to use geometrical properties of
parallelograms and trapezia to add and subtract given vectors.
Some students should be able to prove the geometrical
properties of shapes using vector addition.
Lesson Plan
Smart
Notebook
Activ Inspire
Flipchart
Microsoft
PowerPoint
Differentiated
Worksheet
All students should be able to use the geometrical properties of
polygons to define vectors.
Most students should be able to prove the geometrical
properties of polygons using vectors.
Some students should be able to use ratio and the geometrical
properties of polygons to prove two lines are parallel.
Lesson Plan
Smart
Notebook
Activ Inspire
Flipchart
Microsoft
PowerPoint
Differentiated
Worksheet
80

Topic: Trigonometrical Graphs Duration: 2 hours Prerequisite Knowledge
know the trigonometric ratios, 𝑆𝑖𝑛𝜃 = 𝑂𝑝𝑝
𝐻𝑦𝑝, 𝐶𝑜𝑠𝜃 =
𝐴𝑑𝑗
𝐻𝑦𝑝, 𝑇𝑎𝑛𝜃 =
𝑂𝑝𝑝
𝐴𝑑𝑗,
apply them to find angles and lengths in right-angled triangles and,
where possible, general triangles in two and three dimensional
figures
Keywords
Asymptotes Amplitude
Period Frequency
Success Criteria
know the exact values of 𝑆𝑖𝑛𝜃 and 𝐶𝑜𝑠𝜃 for 𝜃 = 0°, 30°, 45°, 60° and
90°; know the exact value of 𝑇𝑎𝑛𝜃 for = 0°, 30°, 45°, 60°
recognise, sketch and interpret graphs of trigonometric functions
(with arguments in degrees) y = sin x , y = cos x and y = tan x for
angles of any size
Key Concepts
Trigonometric graphs have lines of symmetry at that can be used to
find additional solutions equations.
Trigonometric ratios of 30°, 45° and 60° have exact forms that can be
calculated using the special triangles.
The relationship 𝑇𝑎𝑛𝜃 =𝑆𝑖𝑛𝜃
𝐶𝑜𝑠𝜃 can be seen from the asymptotes in the
tan graph.
Common Misconceptions
Students often forget to rationalise Sin45° and Cos45°.
When solving trigonometric equations students often forget to use the
graphs to include all solutions.
In examinations students often confuse the coordinates, e.g., (0,180)
with (180,0)
81
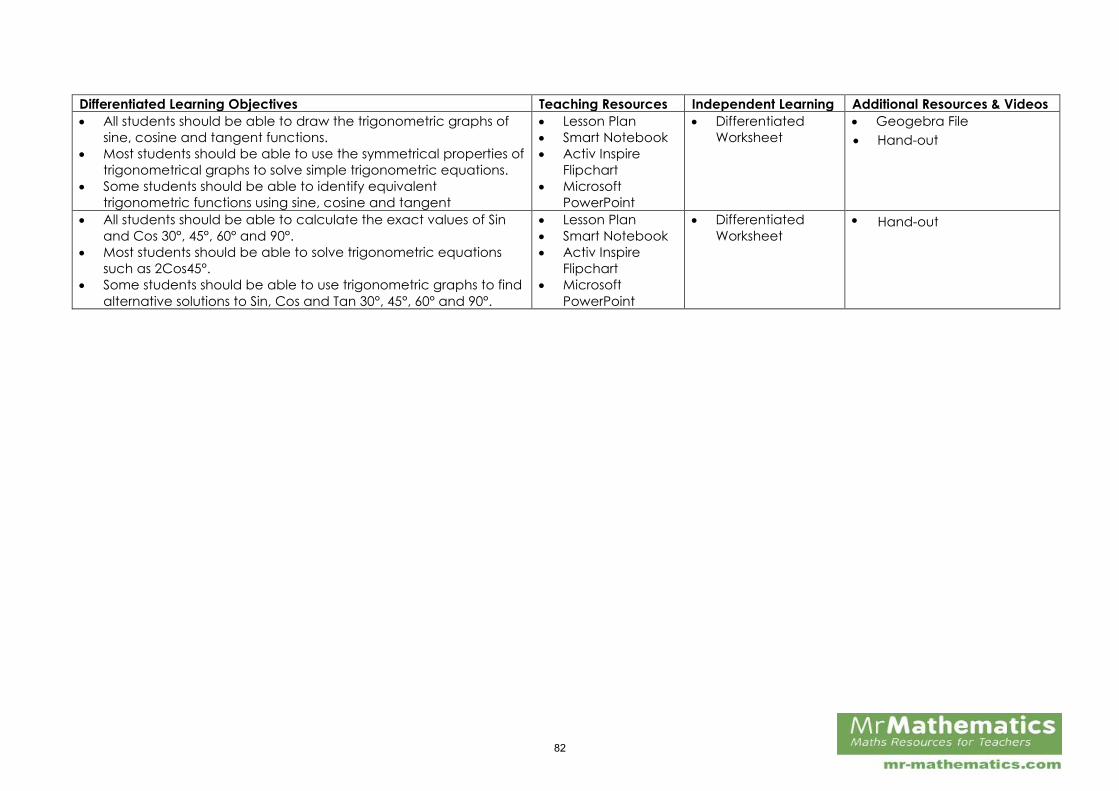
Differentiated Learning Objectives Teaching Resources Independent Learning Additional Resources & Videos
All students should be able to draw the trigonometric graphs of
sine, cosine and tangent functions.
Most students should be able to use the symmetrical properties of
trigonometrical graphs to solve simple trigonometric equations.
Some students should be able to identify equivalent
trigonometric functions using sine, cosine and tangent
Lesson Plan
Smart Notebook
Activ Inspire
Flipchart
Microsoft
PowerPoint
Differentiated
Worksheet
Geogebra File
All students should be able to calculate the exact values of Sin
and Cos 30°, 45°, 60° and 90°.
Most students should be able to solve trigonometric equations
such as 2Cos45°.
Some students should be able to use trigonometric graphs to find
alternative solutions to Sin, Cos and Tan 30°, 45°, 60° and 90°.
Lesson Plan
Smart Notebook
Activ Inspire
Flipchart
Microsoft
PowerPoint
Differentiated
Worksheet
Hand-out
Hand-out
82
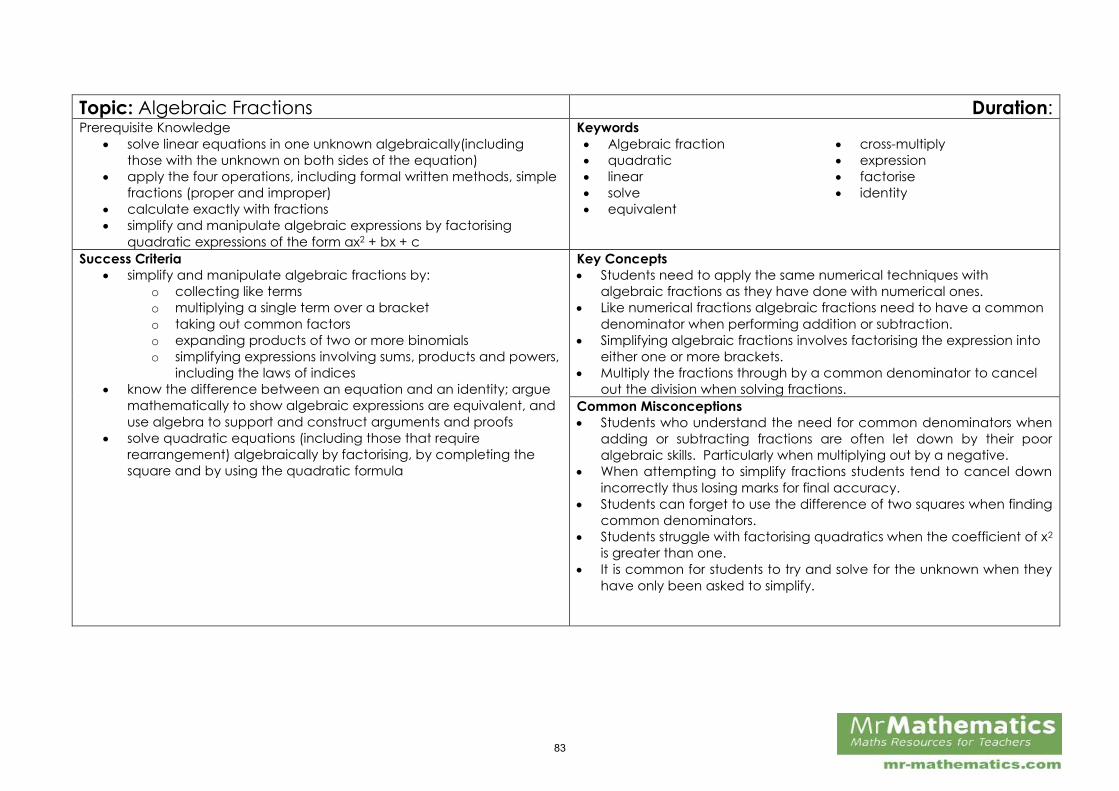
Topic: Algebraic Fractions Duration: Prerequisite Knowledge
solve linear equations in one unknown algebraically(including
those with the unknown on both sides of the equation)
apply the four operations, including formal written methods, simple
fractions (proper and improper)
calculate exactly with fractions
simplify and manipulate algebraic expressions by factorising quadratic expressions of the form ax2 + bx + c
Keywords
Algebraic fraction cross-multiply
quadratic expression
linear factorise
solve identity
equivalent
Success Criteria
simplify and manipulate algebraic fractions by:
o collecting like terms
o multiplying a single term over a bracket
o taking out common factors
o expanding products of two or more binomials
o simplifying expressions involving sums, products and powers,
including the laws of indices
know the difference between an equation and an identity; argue
mathematically to show algebraic expressions are equivalent, and
use algebra to support and construct arguments and proofs
solve quadratic equations (including those that require
rearrangement) algebraically by factorising, by completing the
square and by using the quadratic formula
Key Concepts
Students need to apply the same numerical techniques with
algebraic fractions as they have done with numerical ones.
Like numerical fractions algebraic fractions need to have a common
denominator when performing addition or subtraction.
Simplifying algebraic fractions involves factorising the expression into
either one or more brackets.
Multiply the fractions through by a common denominator to cancel
out the division when solving fractions.
Common Misconceptions
Students who understand the need for common denominators when
adding or subtracting fractions are often let down by their poor
algebraic skills. Particularly when multiplying out by a negative.
When attempting to simplify fractions students tend to cancel down
incorrectly thus losing marks for final accuracy.
Students can forget to use the difference of two squares when finding
common denominators.
Students struggle with factorising quadratics when the coefficient of x2
is greater than one.
It is common for students to try and solve for the unknown when they
have only been asked to simplify.
83

Differentiated Learning Objectives Teaching
Resources
Independent
Learning
Additional Resources & Videos
All students should be able to simplify an algebraic fraction
involving linear terms.
Most students should be able to simplify algebraic fractions
involving linear and quadratic terms in the form 𝑎𝑥2 + 𝑏𝑥 +𝑐 where 𝑎 = 1 by factorising.
Some students should be able to simplify algebraic fractions
involving quadratics in the form 𝑎𝑥2 + 𝑏𝑥 + 𝑐 where 𝑎 ≠ 1.
Lesson Plan
Smart
Notebook
Activ Inspire
Flipchart
Microsoft
PowerPoint
Differentiated
Worksheet
All students should be able to add and subtract a pair of
algebraic fractions with numerical denominators.
Most students should be able to add and subtract a pair of
algebraic fractions in the form 2
𝑥+
3
𝑦.
Some students should be able to add and subtract a pair of
algebraic fractions in the form 2
𝑥+1+
3
𝑥−2.
Lesson Plan
Smart
Notebook
Activ Inspire
Flipchart
Microsoft
PowerPoint
Differentiated
Worksheet
All students should be able to calculate the product of two
algebraic fractions.
Most students should be able to calculate the product and
quotient of two or more algebraic fractions,
Some students should be able to calculate the product and
quotients of algebraic fractions and mixed numbers.
Lesson Plan
Smart
Notebook
Activ Inspire
Flipchart
Microsoft
PowerPoint
Differentiated
Worksheet
All students should be able calculate the difference and total of
algebraic fractions.
Most students should be able to solve an equation involving a
linear algebraic fraction.
Some students should be able to solve an equation involving a
quadratic algebraic fraction.
Lesson Plan
Smart
Notebook
Activ Inspire
Flipchart
Microsoft
PowerPoint
Differentiated
Worksheet
84
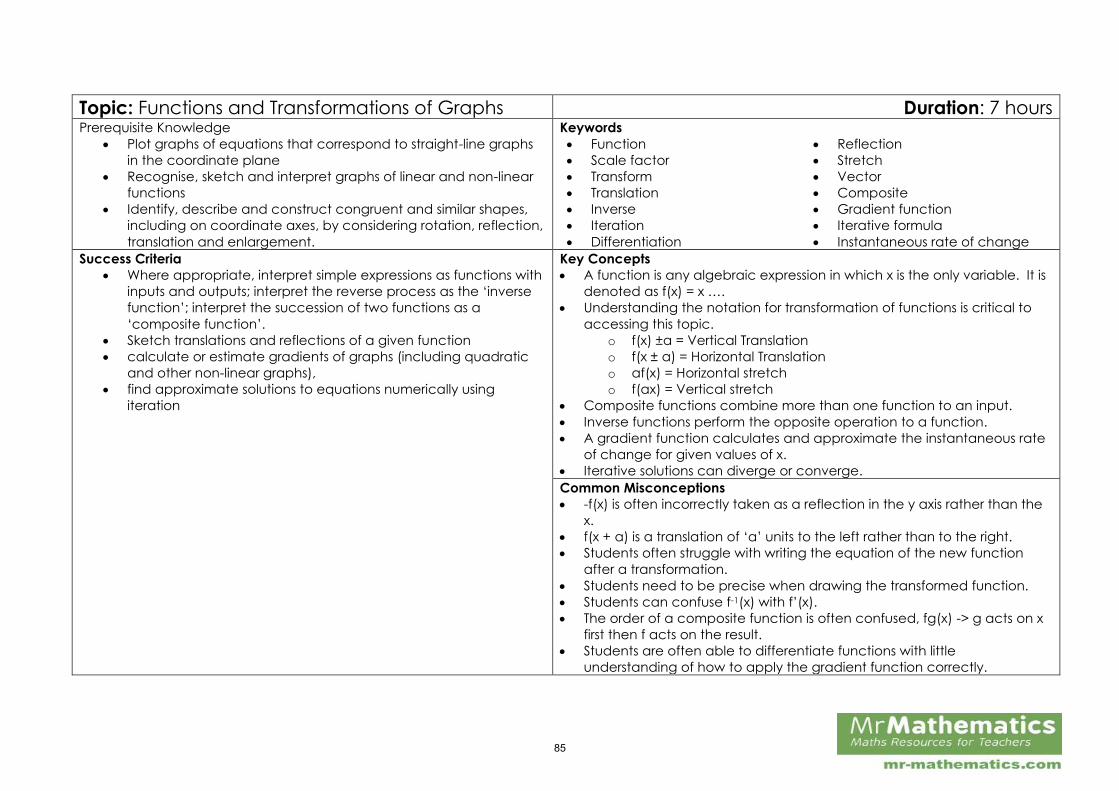
Topic: Functions and Transformations of Graphs Duration: 7 hours Prerequisite Knowledge
Plot graphs of equations that correspond to straight-line graphs
in the coordinate plane
Recognise, sketch and interpret graphs of linear and non-linear
functions
Identify, describe and construct congruent and similar shapes,
including on coordinate axes, by considering rotation, reflection,
translation and enlargement.
Keywords
Function Reflection
Scale factor Stretch
Transform Vector
Translation Composite
Inverse Gradient function
Iteration Iterative formula
Differentiation Instantaneous rate of change
Success Criteria
Where appropriate, interpret simple expressions as functions with
inputs and outputs; interpret the reverse process as the ‘inverse
function’; interpret the succession of two functions as a
‘composite function’.
Sketch translations and reflections of a given function
calculate or estimate gradients of graphs (including quadratic
and other non-linear graphs),
find approximate solutions to equations numerically using
iteration
Key Concepts
A function is any algebraic expression in which x is the only variable. It is
denoted as f(x) = x ….
Understanding the notation for transformation of functions is critical to
accessing this topic.
o f(x) ±a = Vertical Translation
o f(x ± a) = Horizontal Translation
o af(x) = Horizontal stretch
o f(ax) = Vertical stretch
Composite functions combine more than one function to an input.
Inverse functions perform the opposite operation to a function.
A gradient function calculates and approximate the instantaneous rate
of change for given values of x.
Iterative solutions can diverge or converge.
Common Misconceptions
-f(x) is often incorrectly taken as a reflection in the y axis rather than the
x.
f(x + a) is a translation of ‘a’ units to the left rather than to the right.
Students often struggle with writing the equation of the new function
after a transformation.
Students need to be precise when drawing the transformed function.
Students can confuse f-1(x) with f’(x).
The order of a composite function is often confused, fg(x) -> g acts on x
first then f acts on the result.
Students are often able to differentiate functions with little
understanding of how to apply the gradient function correctly.
85
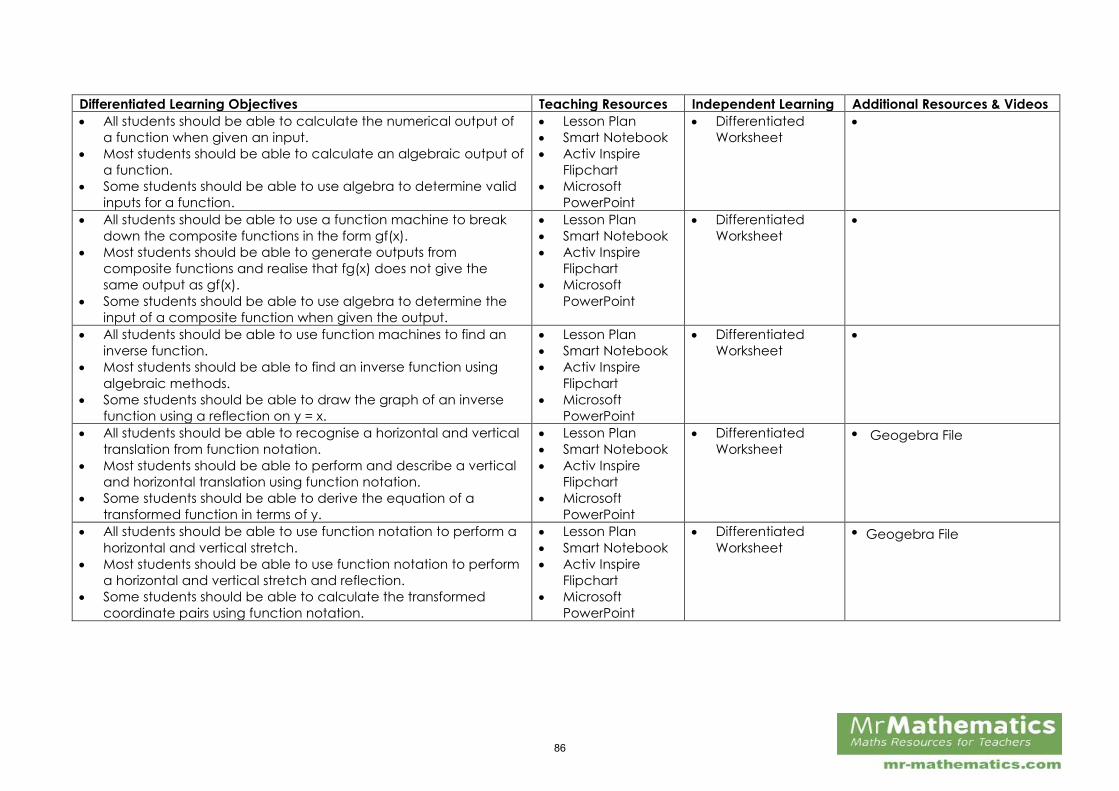
Differentiated Learning Objectives Teaching Resources Independent Learning Additional Resources & Videos
All students should be able to calculate the numerical output of
a function when given an input.
Most students should be able to calculate an algebraic output of
a function.
Some students should be able to use algebra to determine valid
inputs for a function.
Lesson Plan
Smart Notebook
Activ Inspire
Flipchart
Microsoft
PowerPoint
Differentiated
Worksheet
All students should be able to use a function machine to break
down the composite functions in the form gf(x).
Most students should be able to generate outputs from
composite functions and realise that fg(x) does not give the
same output as gf(x).
Some students should be able to use algebra to determine the
input of a composite function when given the output.
Lesson Plan
Smart Notebook
Activ Inspire
Flipchart
Microsoft
PowerPoint
Differentiated
Worksheet
All students should be able to use function machines to find an
inverse function.
Most students should be able to find an inverse function using
algebraic methods.
Some students should be able to draw the graph of an inverse
function using a reflection on y = x.
Lesson Plan
Smart Notebook
Activ Inspire
Flipchart
Microsoft
PowerPoint
Differentiated
Worksheet
All students should be able to recognise a horizontal and vertical
translation from function notation.
Most students should be able to perform and describe a vertical
and horizontal translation using function notation.
Some students should be able to derive the equation of a
transformed function in terms of y.
Lesson Plan
Smart Notebook
Activ Inspire
Flipchart
Microsoft
PowerPoint
Differentiated
Worksheet
All students should be able to use function notation to perform a
horizontal and vertical stretch.
Most students should be able to use function notation to perform
a horizontal and vertical stretch and reflection.
Some students should be able to calculate the transformed
coordinate pairs using function notation.
Lesson Plan
Smart Notebook
Activ Inspire
Flipchart
Microsoft
PowerPoint
Differentiated
Worksheet
86
Geogebra File
Geogebra File
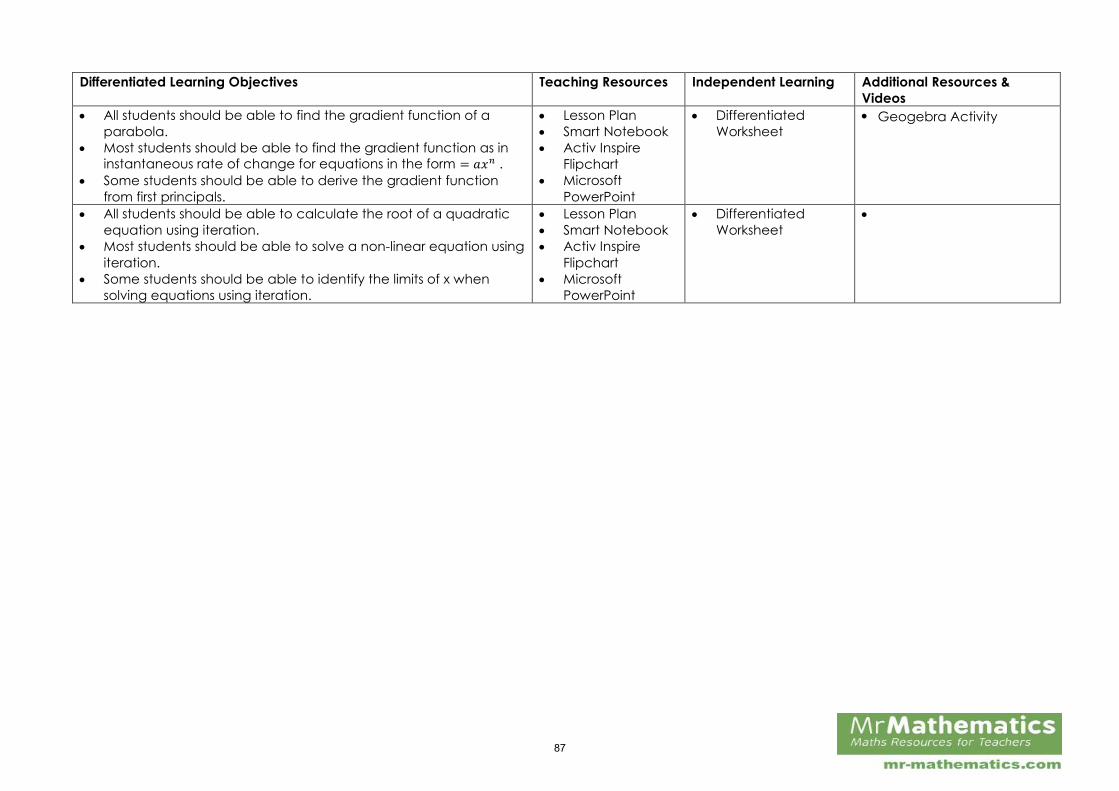
Differentiated Learning Objectives Teaching Resources Independent Learning Additional Resources &
Videos
All students should be able to find the gradient function of a
parabola.
Most students should be able to find the gradient function as in
instantaneous rate of change for equations in the form = 𝑎𝑥𝑛 .
Some students should be able to derive the gradient function
from first principals.
Lesson Plan
Smart Notebook
Activ Inspire
Flipchart
Microsoft
PowerPoint
Differentiated
Worksheet
All students should be able to calculate the root of a quadratic
equation using iteration.
Most students should be able to solve a non-linear equation using
iteration.
Some students should be able to identify the limits of x when
solving equations using iteration.
Lesson Plan
Smart Notebook
Activ Inspire
Flipchart
Microsoft
PowerPoint
Differentiated
Worksheet
87
Geogebra Activity
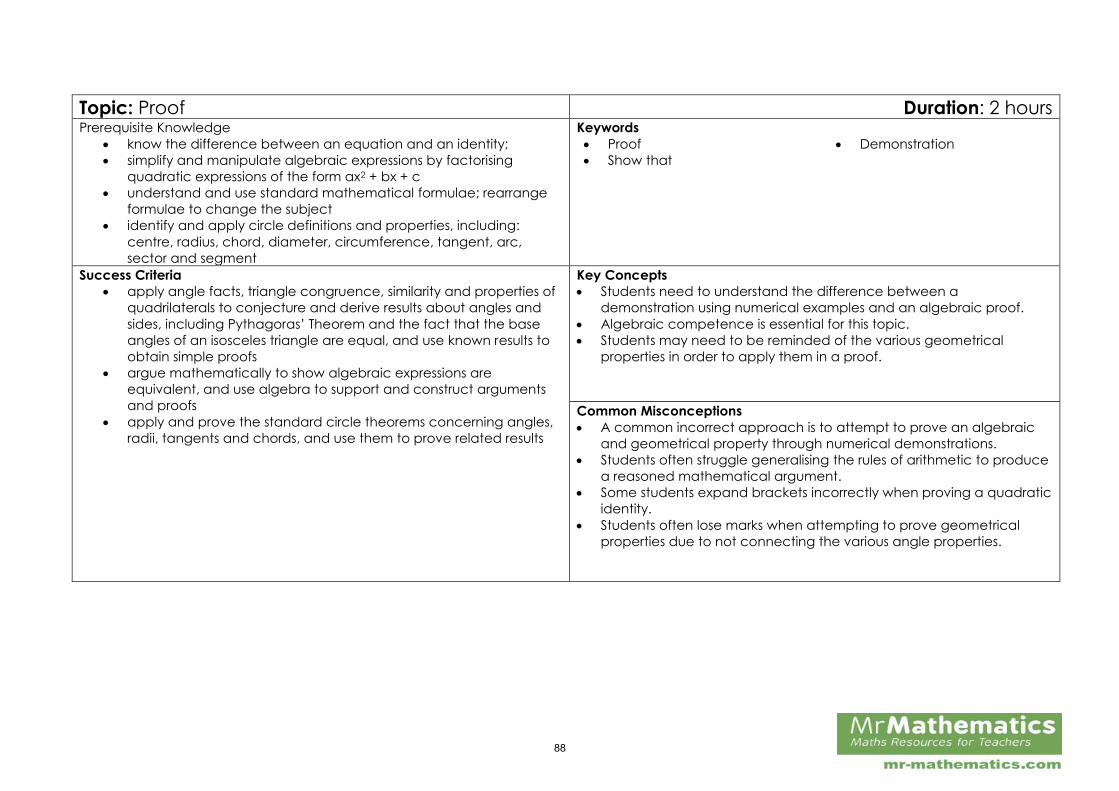
Topic: Proof Duration: 2 hours Prerequisite Knowledge
know the difference between an equation and an identity;
simplify and manipulate algebraic expressions by factorising
quadratic expressions of the form ax2 + bx + c
understand and use standard mathematical formulae; rearrange
formulae to change the subject
identify and apply circle definitions and properties, including:
centre, radius, chord, diameter, circumference, tangent, arc,
sector and segment
Keywords
Proof Demonstration
Show that
Success Criteria
apply angle facts, triangle congruence, similarity and properties of
quadrilaterals to conjecture and derive results about angles and
sides, including Pythagoras’ Theorem and the fact that the base
angles of an isosceles triangle are equal, and use known results to
obtain simple proofs
argue mathematically to show algebraic expressions are
equivalent, and use algebra to support and construct arguments
and proofs
apply and prove the standard circle theorems concerning angles,
radii, tangents and chords, and use them to prove related results
Key Concepts
Students need to understand the difference between a
demonstration using numerical examples and an algebraic proof.
Algebraic competence is essential for this topic.
Students may need to be reminded of the various geometrical
properties in order to apply them in a proof.
Common Misconceptions
A common incorrect approach is to attempt to prove an algebraic
and geometrical property through numerical demonstrations.
Students often struggle generalising the rules of arithmetic to produce
a reasoned mathematical argument.
Some students expand brackets incorrectly when proving a quadratic
identity.
Students often lose marks when attempting to prove geometrical
properties due to not connecting the various angle properties.
88
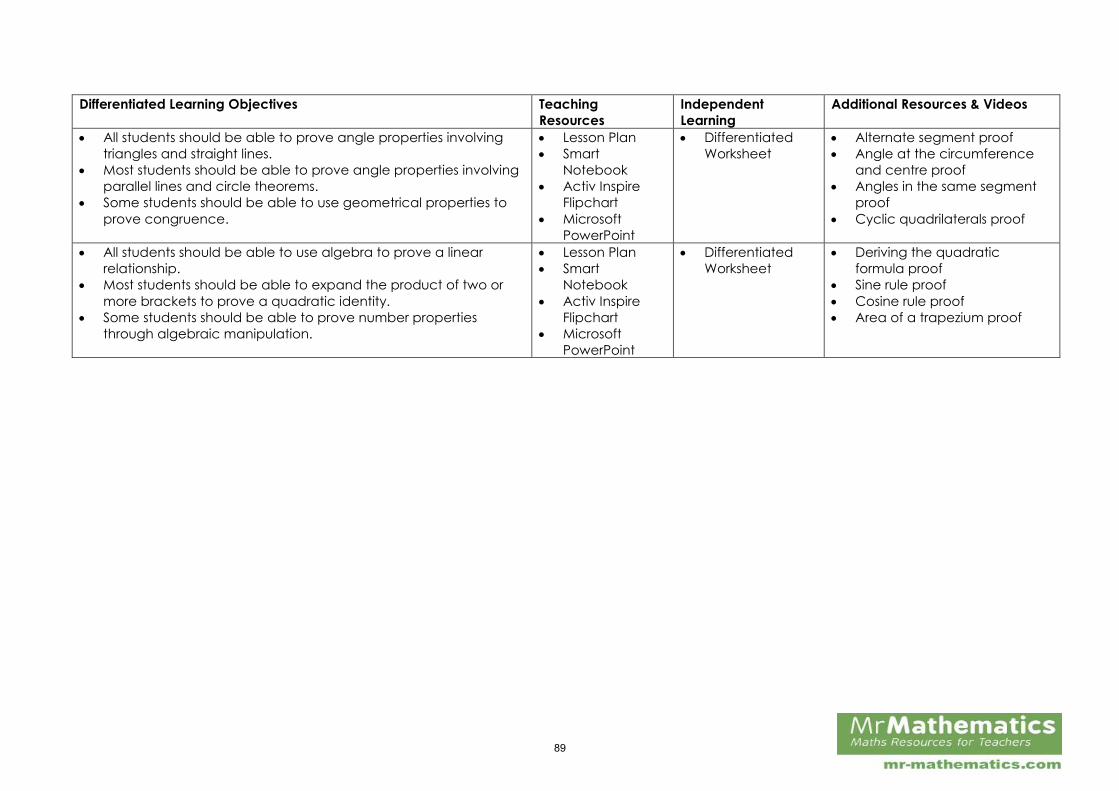
Differentiated Learning Objectives Teaching
Resources
Independent
Learning
Additional Resources & Videos
All students should be able to prove angle properties involving
triangles and straight lines.
Most students should be able to prove angle properties involving
parallel lines and circle theorems.
Some students should be able to use geometrical properties to
prove congruence.
Lesson Plan
Smart
Notebook
Activ Inspire
Flipchart
Microsoft
PowerPoint
Differentiated
Worksheet
Alternate segment proof
Angle at the circumference and centre proof
Angles in the same segment proof
Cyclic quadrilaterals proof
All students should be able to use algebra to prove a linear
relationship.
Most students should be able to expand the product of two or
more brackets to prove a quadratic identity.
Some students should be able to prove number properties
through algebraic manipulation.
Lesson Plan
Smart
Notebook
Activ Inspire
Flipchart
Microsoft
PowerPoint
Differentiated
Worksheet
Deriving the quadratic formula proof
Sine rule proof
Cosine rule proof
Area of a trapezium proof
89