complete findings survey on public opinions and attitudes ... spoa... · the 2009 survey on public...
TRANSCRIPT

COMPLETE FINDINGSSurvey on Public
Opinions and Attitudes on Outdoor
Recreation in California
2009
An Element of the California
Outdoor Recreation
Planning Program
State of CaliforniaNatural Resources
Agency

The preparation of this study was financed in part through a planning grant from the National Park Service, United States Department of the Interior, under the provisions of the Land and Water Conservation Fund Act of 1965 (Public Law 88-578, as amended). This report is an element of the California Outdoor Recreation Planning Program, formulated under the provisions of Chapter 5099.2 of the California Public Resources Code. © 2009 by California State Parks. All rights reserved. Printed in Sacramento, California For more information or additional copies contact: California State Parks Planning Division P.O. Box 942896 Sacramento, CA 94296-0001 (916) 653-9901, FAX (16) 653-4458, 711, TTY relay service California State Parks does not discriminate against people with disabilities. To use the California Relay Service with TYY, call (888) 877-5378 or, without TYY, call (888) 877-5379. This publication is available in alternate formats by contacting the Planning Division at (916) 653-9901 or visiting www.parks.ca.gov/planning.
Printed on recycled paper

Complete Findings for the Survey on Public Opinions and
Attitudes on Outdoor Recreation in California
An Element of the California Outdoor Recreation
Planning Program
September 2009
Arnold Schwarzenegger Governor
Mike Chrisman Secretary for Natural Resources
Ruth Coleman Director of Parks and Recreation

This page intentionally left blank.

i
EXECUTIVE SUMMARY A Statewide Comprehensive Outdoor Recreation Plan (SCORP) is required of every state in order to be eligible for grants from the Land and Water Conservation Fund Act. The LWCF Act requires the SCORP to include the following: a) the name of the state agency with authority to act for California in dealing with the Secretary of the Interior for the purposes of the LWCF Act, b) an evaluation of the demand for and supply of the outdoor recreation resources and facilities in the state, c) a program for the implementation of the Plan, d) certification by the governor that ample opportunity for public participation has taken place in Plan development, e) other necessary information as may be determined by the Secretary. The 2009 Survey on Public Opinions and Attitudes on Outdoor Recreation in California included a telephone survey, an adult mail survey, youth focus groups, and a youth mail survey in order to provide a comprehensive view of the outdoor recreation patterns and preferences of Californians. The measurement of various items on the surveys was changed substantially from earlier surveys (2002, 1997, etc.) in order to attempt to increase response rates, improve the readability of the survey instruments, and to provide a contemporary view of outdoor recreation in California. For example, the 2008 telephone survey focused on physical activity that occurs in parks. Similarly, the adult mail survey added components on leisure constraints, issues regarding global warming, and enhanced measures of latent demand for recreation activities. Finally, the youth survey addressed issues important to California’s youth and included items regarding the recently developed and Governor endorsed California Children’s Outdoor Bill of Rights (COBR). The sampling procedures resulted in a telephone survey of 2,780 Californians of which, 1,227 also completed a mail/online survey. In addition, 397 youth participated in the youth mail survey.
Findings from the 2008 Adult Surveys Activity Participation
• More than two-thirds (67.8%) of Californians reported spending the same or more
time in outdoor recreation activities compared to five years ago (Table 13). • The majority participated in moderate (41%) to light (36%) levels of physical
activity during park visits. Seventy percent of respondents spent over 30 minutes being physically active in parks (Tables 19, 20).
• Most Californians participated in walking for fitness or pleasure (74%). Other
activities with high percentages of participants included picnicking in picnic areas; driving for pleasure, sightseeing, driving through natural scenery; beach activities; and visiting outdoor nature museums, zoos, gardens or arboretums (Table 25).

ii
• Walking for fitness or pleasure; camping in developed sites; bicycling on paved surfaces; and day hiking on trails were the four top activities that Californians would like to participate in more often (Table 28).
• Most (77%) Californians had been physically active in the past month. Eighty-
seven percent reported participated in moderate physical activity and 52% reported participated in vigorous physical activity for at least 10 minutes at a time (Table 16).
• Respondents were asked to rate the level of importance for each recreational
activity. For Californians, having fun; being with family and friends; relaxing; and viewing scenic beauty were the four most important factors. (Table 41).
• Park companions under the age of 18 most frequently participated in playing
(73%); sports (37%); walking (22%); and picnicking (21%) (Table 32). • More than half of Californians used community/facility buildings (64%); open
spaces to play (59%); picnic tables/pavilions (58%); unpaved multipurpose trails (53%); and paved trails during their last park visit (Table 33).
• Respondents on average went to parks with five other companions over the age of
18 who were primarily family (56%) or both family and friends (31%) (Tables 11, 12).
Preferences and Priorities • More than two-thirds of Californians thought that more governmental agency
emphasis should be placed on cleaning up pollution of the ocean, lakes, rivers, and streams in park and recreation areas and protecting historic resources (Table 40).
• The park facilities and services that Californians thought were most important to
them were play areas for young children; wilderness type areas where no vehicles or development are allowed; environmental and outdoor education programs; multi-use turf areas for field sports; picnic sites for large groups; trails for multiple, non-motorized activities; and hard surface trails (Table 34).
• The majority of Californians agreed that (87.5%) recreation programs help
improve people’s health; (81.5%) fees collected at each park, wildlife and recreation area should be spent on that area; and (83.4%) rules and regulations in parks and outdoor recreation areas should be enforced (Table 43).
Frequency of Park Visits • Most Californians (73.7%) had visited a park within the last month (Table 8). • The majority of Californians visited highly developed parks and recreation areas;
developed nature-oriented parks and recreation areas; historical or cultural

iii
buildings, sites, or areas; and natural and undeveloped areas 1 to 5 days during the past 12 months (Table 9).
Climate Change Preferences • The majority of Californians agreed that reducing climate-changing gases;
anticipating the effects of climate change; and educating visitors are management actions that park agencies should adopt to assist with reducing and adapting to climate change and global warming (Table 47).
Satisfaction with Park Facilities • Overall, Californians were satisfied with the public outdoor recreation areas,
facilities, and services currently available and perceived their overall condition to be the same as they were five years ago. In addition, about one-third (34%) thought their condition had improved (Tables 35-38).
Park Fees • When Californians were asked which three recreational activities they were
willing to pay more for, their response were camping; hunting; fishing;, target shooting; horseback riding; sailing; and off-road vehicle use (Tables 29-31).
Privatization Preferences • When Californians were asked which activity or service would be appropriate for
private businesses to provide in public parks and recreation areas, responses includes the rental of recreational equipment (75.3%); the sale of ready-to-eat food and beverages (73.0%);, and the sponsorship of special events (72.5%). Most did not favor privatization of law enforcement (43.2%) or total operation and management of areas (27.9%) (Table 45).
Constraints to Park Use • Gang activity; alcohol and drug use in parks; and poorly maintained parks were
perceived as the factors most limiting participants' physical activity in parks (Tables 21, 22).
Travel Times • Californians were asked how many minutes they spent traveling to their favorite
recreation area and the majority of respondents spent 5 minutes or less driving (30%) or walking (37.6%) (Table 10).
Findings from the 2008 Youth Survey
Activities Participation • The most common outdoor activities for youth were swimming; soccer; and
basketball. When asked why, more than two-thirds of youth responded because it was fun or enjoyable (83.9%) and it allowed them to do something with their friends and family (67.8%) (Tables 68, 69).

iv
• The majority of youth (64%) participated in their favorite activity in areas or parks in their neighborhood (32%) or outside their neighborhood but within their town or city (32%) (Table 70).
• Youth participated in their favorite activities primarily with friends (86%) and
immediate family members (57%). Just over one-third (35%) of youth participated in their favorite activity by themselves (Table 71).
• Walking on streets/sidewalks/paths/trails in their community (85.9%); swimming in
a pool (82.9%); and jogging or running (79.8%) were the outdoor recreation activities with the largest percentage of youth participation during the past 12 months (Table 73).
• The activities California youth would like to do more often include horseback
riding; sledding/ice-skating/snow play; snowboarding; swimming in a pool; and using jet skis or wave runners (Table 74).
• At least 80% of youth had participated in six of the 10 activities from the
California Children’s Outdoor Bill of Rights before the age of 14. These activities included playing in the water; playing in a safe place; hiking/biking/riding on a trail; exploring nature outdoors; visiting a California historic site/museum; and learning to swim (Table 76).
• The most common responses given when youth were asked why they did not
participate in these 10 activities before the age of 14 were they don’t know/don’t remember, the activity was boring, or they had no reason (odd numbered Tables 77-95).
• The most common reasons given for why youth participate in these 10 activities
are to be with family or friends; it is fun or enjoyable; and the activity is part of an organized or educational trip (even numbered Tables 78-96).
• More than half of the youth respondents found it difficult to participate in outdoor
activities because sometimes they are too busy (91%); they would rather be on the internet (68%), and it is too hot or cold outside (68%) (Tables 97, 98).
• The most common actions that could help California youth participate in outdoor
activities more often would be providing more recreation areas closer to their home; providing areas for activities that are just for kids their age; and providing recreation equipment (Tables 99,100).

v
Table of Contents
EXECUTIVE SUMMARY.................................................................................................. i Findings from the 2008 Adult Surveys ...................................................................... i Findings from the 2008 Youth Survey ......................................................................iii
List of Tables ............................................................................................................. viii List of Charts .............................................................................................................xvi List of Charts .............................................................................................................xvi
INTRODUCTION............................................................................................................. 1 Background ................................................................................................................. 1 Purpose of the Study ................................................................................................... 2 Changes in the 2008 Survey ....................................................................................... 3
Telephone Survey .................................................................................................... 3 Adult Mail/Online Survey.......................................................................................... 3 Youth Surveys.......................................................................................................... 3
METHODOLOGY............................................................................................................ 5 Telephone Survey Methodology .................................................................................. 5 Adult Mail/Online Survey Methodology........................................................................ 6 Youth Focus Groups Methodology .............................................................................. 7 Youth Mail/Online Survey Methodology....................................................................... 8
SURVEY OF CALIFORNIA ADULTS.............................................................................. 9 Adult Socio-Demographics .......................................................................................... 9 Adult Outdoor Recreation Behavior ........................................................................... 13
Adult Frequency of Outdoor Recreation Area Visitation......................................... 13 Adult Distances Traveled to Park and Recreation Areas ....................................... 18 Adult Visitor Group Characteristics ........................................................................ 19
Adult Level of Activity and Time Spent in Outdoor Recreation .................................. 21 Adult Time Spent in Outdoor Recreation................................................................ 21 Adult Time Spent in Physical Activity ..................................................................... 24 Activities of Adult Californians................................................................................ 30 Activity Participation and Latent Demand for Adult Californians ............................ 31 Willingness to Pay for Activities.............................................................................. 39 Activity Types for Companions Under 18 Years of Age ......................................... 49
Facilities and Amenities ............................................................................................. 51 Facilities and Amenities Utilized During Adult's Last Park Visit.............................. 51 Outdoor Recreation Facilities and Services ........................................................... 52
Adult Attitudes and Beliefs Regarding Outdoor Recreation ....................................... 57 Adult Opinions on State and Federal Agency Emphasis........................................ 57 Adult Opinions on Outdoor Recreation in California............................................... 59 Adult Respondent Preferences for Privatization..................................................... 63 California Adults’ Opinions on Park Agencies’ Role in Addressing Climate Change............................................................................................................................... 65

vi
ADULT HISPANIC RECREATION PATTERNS ............................................................ 71 Adult Hispanic Outdoor Recreation Behavior ............................................................ 73
Adult Hispanic Frequency of Outdoor Recreation Area Visitation .......................... 73 Adult Hispanic Distances Traveled to Park and Recreation Areas......................... 74 Adult Hispanic Types of Recreation Areas Visited ................................................. 75 Adult Hispanic Visitor Group Characteristics.......................................................... 76
Adult Hispanic Levels of Activity and Time Spent in Outdoor Recreation.................. 79 Adult Hispanic Time Spent in Physical Activity ...................................................... 79 Activities of Adult Hispanic Respondents ............................................................... 81 Activity Participation and Latent Demand for Adult Hispanic Respondents............ 83 Facilities and Amenities Utilized During Last Adult Hispanic Park Visit.................. 87 Adult Hispanic Outdoor Recreation Facilities and Services ................................... 89
Adult Hispanic Attitudes and Beliefs Regarding Outdoor Recreation ........................ 91 Adult Hispanic Opinions on State and Federal Agency Emphasis ......................... 91 Adult Hispanic Opinions on Outdoor Recreation in California ................................ 93
SURVEY OF CALIFORNIA YOUTH.............................................................................. 97 Youth Socio-Demographics ....................................................................................... 97 Characteristics of Youth Respondents’ Favorite Outdoor Activities........................... 99
Youths' Favorite Outdoor Activities ........................................................................ 99 Youths' Favorite Activity Location ........................................................................ 102 Youth Group Characteristics ................................................................................ 103
Youth Respondent Activity Participation and Latent Demand.................................. 105 Children’s Outdoor Bill of Rights.............................................................................. 113
Youth Participation in the 10 Children’s Outdoor Bill of Rights Activities.............. 113 Why Youth Did and Did Not Participate in the 10 Children's Outdoor Bill of Rights Activities............................................................................................................... 114
Constraints to Youth Participation in Outdoor Recreation........................................ 121
REGIONAL RECREATION PATTERNS ..................................................................... 125 Regional Socio-Demographics ................................................................................ 125 Regional Outdoor Recreation Behavior ................................................................... 131
Frequency of Outdoor Recreation Area Visitation................................................ 131 Regional Distances Traveled to Park and Recreation Areas ............................... 137 Regional Visitor Group Characteristics ................................................................ 140
Regional Level of Activity and Time Spent in Outdoor Recreation .......................... 141 Regional Time Spent in Outdoor Recreation........................................................ 141 Regional Time Spent in Physical Activity ............................................................. 142 Activities of Regional Adult Respondents............................................................. 154 Activity Participation and Latent Demand for Regional Adult Respondents ......... 156 Activity Types for Regional Companions Under 18 Years of Age ........................ 162
Facilities and Amenities ........................................................................................... 163 Facilities and Amenities Utilized During Last Regional Adult Park Visit ............... 163 Outdoor Recreation Facilities and Services ......................................................... 164
Regional Adult Attitudes and Beliefs Regarding Outdoor Recreation ...................... 167 Regional Adult Opinions on State and Federal Agency Emphasis....................... 167 Regional Adult Opinions on Outdoor Recreation in California.............................. 172

vii
Regional Adult Respondent Preferences for Privatization.................................... 185 Regional Adult Respondents' Opinions on Park Agencies'’ Role in Addressing Climate Change ................................................................................................... 186
FINAL OVERALL RECOMMENDATIONS .................................................................. 191
REFERENCES............................................................................................................ 195 Appendix A: Open-Ended Responses - Adult Respondents.................................... 197 Appendix B: Open-Ended Responses – Youth Respondents.................................. 225 Appendix C: Youth Focus Groups ........................................................................... 253 Appendix D: Public Opinions and Attitudes Telephone Survey ............................... 255 Appendix E: Public Opinions and Attitudes Adult Mail-Back Survey........................ 263 Appendix F: Public Opinions and Attitudes Youth Mail-Back Survey....................... 273

viii
List of Tables
Table 1. Socio-Demographic Characteristics of Respondents. ....................................... 9 Table 2. Socio-Economic Characteristics of Respondents............................................ 10 Table 4. Respondent Residence Characteristics. ......................................................... 12 Table 5. Respondents’ Last Park Visit........................................................................... 13 Table 6. Respondents’ Last Park Visit If More than One Year Ago............................... 13 Table 7. Respondent Park Visitation Characteristics. ................................................... 14 Table 8. Frequency of Park Visitation in Past 12 Months. ............................................. 14 Table 9. The Number of Days Respondents Visited Outdoor Recreation Areas During the Past 12 Months. ...................................................................................................... 15 Table 10. Travel Time from Respondent’s Residence to Place They Most Often Go for Recreation..................................................................................................................... 18 Table 11. Companions Who Accompany Respondents to a Park................................. 19 Table 12. Number of Companions Respondents Visited a Park With. .......................... 19 Table 13. Amount of Time Respondents Currently Spend in Outdoor Recreation Activities Compared to 5 Years Ago.............................................................................. 22 Table 14. Amount of Time Respondents Spend in Outdoor Recreation Activities Compared to 5 Years Ago, 1997 to 2008. ..................................................................... 22 Table 15. Reasons Respondents Spend Less Time in Outdoor Activities Than They Did 5 Years Ago- Open-Ended Responses (n = 869).......................................................... 22 Table 16. Respondents Participation in Other Physical Recreation Activities or Exercises....................................................................................................................... 24 Table 17. Respondents Participation in Moderate Physical Activity. ............................. 25 Table 18. Respondents Participation in Vigorous Physical Activity. .............................. 25 Table 19. Respondents’ Level of Activity When Visiting Parks...................................... 26 Table 20. Respondents’ Time Spent Physically Active in Parks.................................... 26 Table 21. How Respondents Perceive Certain Factors Might Limit Their Level of Physical Activity in Parks............................................................................................... 27 Table 22. How Respondents Perceive Certain Factors Might Limit Their Level of Physical Activity in Parks............................................................................................... 28 Table 23. Other Factors Respondents Perceive Might Limit Their Level of Physical Activity-Open-Ended Responses. ................................................................................. 29 Table 24. Activities Respondents Participated in During Their Last Park Visit. ............. 30 Table 25. Recreation Activity Participation of Respondents During the Past 12 Months....................................................................................................................................... 31 Table 26. Recreation Activity Participation of Respondents During the Past 12 Months, 2002 vs. 2008................................................................................................................ 33 Table 27. Mean Recreation Activity Participation of Respondents During the Past 12 Months, 2002 vs. 2008. ................................................................................................. 34 Table 28. Recreation Activities Respondents Would Like to Participate in More Often. 36 Table 29. Favorite Activity of Respondents and How Much They Would Pay to Participate. .................................................................................................................... 39 Table 30. Second Favorite Activities of Respondents and How Much They Would Pay to Participate. .................................................................................................................... 42

ix
Table 31. Third Favorite Activity of Respondents and How Much They Would Pay to Participate. .................................................................................................................... 46 Table 32. Park Activities of Companions Who Were Less Than 18 Years of Age......... 49 Table 33. Facilities or Amenities Used During Their Last Park Visit.............................. 51 Table 34. Importance of California Park and Recreation Facilities and Services. ......... 52 Table 35. Respondent Satisfaction with Public Outdoor Recreation Areas, Facilities, and Services Currently Available. .......................................................................................... 53 Table 36. Percent Respondent Satisfaction with Public Outdoor Recreation Areas, Facilities and Services Currently Available, 1987 to 2008. ............................................... 54 Table 37. Respondents’ Perception of Overall Condition and Operation of Public Outdoor Recreation Areas and Facilities....................................................................................... 54 Table 38. Percent of Respondents’ Perception of Overall Condition and Operation of Public Outdoor Recreation Areas and Facilities, 1987 to 2008......................................... 55 Table 39. Emphasis of State and Federal Government Outdoor Recreation Agencies in California Should Place on Aspects of Outdoor Recreation. ......................................... 57 Table 40. Amount of Emphasis Respondents Think that State and Federal Government Outdoor Recreation Agencies in California Should Place on Certain Ideas, 2002 vs. 2008. ............................................................................................................................. 58 Table 41. Importance of Items to Respondents’ Favorite Activities. .............................. 59 Table 42. Importance of Items to Respondents’ Favorite Activities. .............................. 60 Table 43. Respondents’ Level of Agreement with Statements Concerning Outdoor Recreation Lands and Facilities in California. ............................................................... 61 Table 44. Respondents’ Level of Agreement with Statements Concerning Outdoor Recreation Lands and Facilities in California. ............................................................... 62 Table 45. Activities or Services Respondents Think are Appropriate for a Private Firm to Provide in Public Park and Recreation Areas................................................................ 63 Table 46. Activities or Services Respondents Think are Appropriate for a Private Firm to Provide in Public Park and Recreation Areas, 2002 vs. 2008. ...................................... 63 Table 47. Respondents’ Level of Agreement with Statements Concerning California Park Agencies’ Efforts to Reduce and Adapt to Climate Change and Global Warming.65 Table 48. Respondents’ Level of Agreement with Statements Concerning California Park Agencies’ Efforts to Reduce and Adapt to Climate Change and Global Warming.66 Table 49. Other Open-Ended Responses Concerning Management Actions that California Park Agencies Could Adopt to Reduce and Adapt to Climate Change and Global Warming ............................................................................................................ 69 Hispanic Growth in California 2000-2004 ...................................................................... 71 Hispanic and Non-Hispanic Confidence Level, Confidence Intervals............................ 71 Table 50. A Comparison of Hispanics and Non-Hispanics on Frequency of Park Visitation in Past 12 Months. ......................................................................................... 73 Table 51. A Comparison of Hispanics (H) and Non-Hispanics (NH) on Travel Time from Residence to Place Most Often Go for Recreation........................................................ 74 Table 52. A Comparison of Hispanics and Non-Hispanics on The Number of Days Respondents Visited Outdoor Recreation Areas During the Past 12 Months................ 75 Table 53. A Comparison of Hispanics (H) and Non-Hispanics (NH) on Companions Who Accompany Respondents to a Park. ............................................................................. 76

x
Table 54. A Comparison of Hispanics (H) and Non-Hispanics (NH) on Number of Companions Respondents Visited a Park With............................................................. 77 Table 55. A Comparison of Hispanics and Non-Hispanics on How Respondents Perceive Certain Factors Might Limit Their Level of Physical Activity in Parks. ............ 79 Table 56. A Comparison of Hispanics (H) and Non-Hispanics (NH) on Activities Participated in During Their Last Park Visit. .................................................................. 81 Table 57. A Comparison of Hispanics and Non-Hispanics on Recreation Activity Participation During the Past 12 Months. ...................................................................... 83 Table 58. A Comparison of Hispanics and Non-Hispanics on Recreation Activities Respondents Would Like to Participate in More Often. ................................................. 85 Table 60. A Comparison of Hispanics (H) and Non-Hispanics (NH) on How Much Respondents Would Pay to Participate in Their Top Three Favorite Activities.............. 86 Table 61. A Comparison of Hispanics (H) and Non-Hispanics (NH) on Facilities or Amenities Used During Their Last Park Visit................................................................. 87 Table 62. A Comparison of Hispanics and Non-Hispanics on Importance of California Park and Recreation Facilities and Services. ................................................................ 89 Table 63. A Comparison of Hispanics (H) and Non-Hispanics (NH) on How Much Emphasis State and Federal Government Outdoor Recreation Agencies in California Should Place on Aspects of Outdoor Recreation. ......................................................... 91 Table 64. A Comparison of Hispanics (H) and Non-Hispanics (NH) on Importance of Items to Respondents’ Favorite Activities...................................................................... 93 Table 65. A Comparison of Hispanics (H) and Non-Hispanics (NH) on Respondents’ Level of Agreement with Statements Concerning Outdoor Recreation Lands and Facilities in California. ................................................................................................... 94 Table 66. Socio-Demographic Characteristics of Youth Respondents. ......................... 97 Table 67. Youth Respondents’ County of Residence. ................................................... 98 Table 68. Favorite Outdoor Activity of Youth Respondents........................................... 99 Table 69. Reason Why Youth Respondents’ Outdoor Activities Are Their Favorites. . 101 Table 70. Places Where Youth Respondents Participate in Their Favorite Outdoor Activities. ..................................................................................................................... 102 Table 71. People Youth Respondents Participate With in Their Favorite Outdoor Activities. ..................................................................................................................... 103 Table 72. Recreation Activity Participation of Youth Respondents During the Past 12 Months. ....................................................................................................................... 105 Table 73. Recreation Activity Participation of Youth Respondents During the Past 12 Months, 2002 vs. 2008. ............................................................................................... 107 Table 74. Activities Youth Respondents Would Like to Participate in More Often....... 109 Table 75. Activities Youth Respondents Would Like to Participate in More Often, 2002 vs. 2008....................................................................................................................... 111 Table 76. Activities Youth Respondents Participated in Before the Age of 14. ........... 113 Table 77. Reasons Why Youth Did Not Visit a California Historic Site or History Museum Before the Age of 14. .................................................................................................. 114 Table 78. Reasons Why Youth Visited a California Historic Site or History Museum Before the Age of 14. .................................................................................................. 114 Table 79. Reasons Why Youth Did Not Play in the Water Before the Age of 14......... 115 Table 80. Reasons Why Youth Played in the Water Before the Age of 14.................. 115

xi
Table 81. Reasons Why Youth Did Not Play in a Safe Place Before the Age of 14. ... 115 Table 82. Reasons Why Youth Played in a Safe Place Before the Age of 14. ............ 115 Table 83. Reasons Why Youth Did Not Go Camping Overnight Before the Age of 14..................................................................................................................................... 116 Table 84. Reasons Why Youth Went Camping Overnight Before the Age of 14......... 116 Table 85. Reasons Why Youth Did Not Explore Nature Outdoors Before the Age of 14..................................................................................................................................... 116 Table 86. Reasons Why Youth Explored Nature Outdoors Before the Age of 14. ...... 117 Table 87. Reasons Why Youth Did Not Learn to Swim Before the Age of 14. ............ 117 Table 88. Reasons Why Youth Learned to Swim Before the Age of 14. ..................... 117 Table 89. Reasons Why Youth Did Not Play on a Sports Team Before the Age of 14..................................................................................................................................... 118 Table 90. Reasons Why Youth Played on a Sports Team Before the Age of 14......... 118 Table 91. Reasons Why Youth Did Not Hike, Bike, or Ride on a Trail Before the Age of 14. ............................................................................................................................... 118 Table 92. Reasons Why Youth Hiked, Biked, or Rode on a Trail Before the Age of 14..................................................................................................................................... 119 Table 93. Reasons Why Youth Did Not Catch a Fish Before the Age of 14. ............... 119 Table 94. Reasons Why Youth Caught a Fish Before the Age of 14........................... 119 Table 95. Reasons Why Youth Did Not Celebrate Their Heritage Before the Age of 14..................................................................................................................................... 120 Table 96. Reasons Why Youth Celebrated Their Heritage Before the Age of 14........ 120 Table 97. Reasons Youth Respondents are Kept from Participating in Outdoor Activities. ..................................................................................................................... 121 Table 98. Other Reasons Youth Respondents are Kept from Participating in Outdoor Activities- - Open-Ended Responses........................................................................... 122 Table 99. Actions That Could Help Youth Respondents Participate in Outdoor Activities More Often. ................................................................................................................. 122 Table 100. Other Actions That Could Help Youth Respondents Participate in Outdoor Activities More Often- - Open-Ended Responses........................................................ 123 Table 101. Socio-demographic Characteristics of Respondents by Region................ 126 Table 102. Socio-demographic Characteristics of Respondents by Region................ 127 Table 103. Socio-demographic Characteristics of Respondents by Region................ 129 Table 104. Socio-demographic Characteristics of Respondents by Region................ 129 Table 105. Respondent Residence Characteristics by Region ................................... 130 Table 106. Respondents Last Park Visit by Region .................................................... 131 Table 107. Respondent Park Visitation Characteristics by Region ............................. 131 Table 108. Frequency of Park Visitation in Past 12 Months by Region....................... 132 Table 109. The Number of Days Respondents Visited Outdoor Recreation Areas During the Past 12 Months- Central Coast Region. ................................................................ 132 Table 110. The Number of Days Respondents Visited Outdoor Recreation Areas During the Past 12 Months- Central Valley Region................................................................. 133 Table 111. The Number of Days Respondents Visited Outdoor Recreation Areas During the Past 12 Months- Los Angeles Region. .................................................................. 133 Table 112. The Number of Days Respondents Visited Outdoor Recreation Areas During the Past 12 Months- Northern CA Region. .................................................................. 134

xii
Table 113. The Number of Days Respondents Visited Outdoor Recreation Areas During the Past 12 Months- San Francisco Region. ............................................................... 135 Table 114. The Number of Days Respondents Visited Outdoor Recreation Areas During the Past 12 Months- Sierra Region. ............................................................................ 135 Table 115. The Number of Days Respondents Visited Outdoor Recreation Areas During the Past 12 Months- Southern CA Region. ................................................................. 136 Table 116. Travel Time from Respondent’s Residence to Place Most Often Go for Recreation- Central Coast Region. ............................................................................. 137 Table 117. Travel Time from Respondent’s Residence to Place Most Often Go for Recreation- Central Valley Region. ............................................................................. 137 Table 118. Travel Time from Respondent’s Residence to Place Most Often Go for Recreation- Los Angeles Region................................................................................. 138 Table 119. Travel Time from Respondent’s Residence to Place Most Often Go for Recreation- Northern CA Region. ............................................................................... 138 Table 120. Travel Time from Respondent’s Residence to Place Most Often Go for Recreation- San Francisco Region. ............................................................................ 138 Table 121. Travel Time from Respondent’s Residence to Place Most Often Go for Recreation- Sierra Region........................................................................................... 139 Table 122. Travel Time from Respondent’s Residence to Place Most Often Go for Recreation- Southern CA Region. ............................................................................... 139 Table 123. Companions Who Accompany Respondents to a Park by Region............ 140 Table 125. Amount of Time Respondents Currently Spend in Outdoor Recreation Activities Compared to 5 Years Ago by Region........................................................... 141 Table 126. Respondents Participation in Other Physical Recreation Activities or Exercises and Time Spent in Moderate or Vigorous Physical Activity by Region........ 142 Table 127. Respondents Participation in Moderate Physical Activity by Region ......... 143 Table 128. Respondents Participation in Vigorous Physical Activity by Region. ......... 144 Table 130. Respondents’ Time Spent Physically Active in Parks by Region............... 145 Table 131. How Respondents Perceive Certain Factors Might Limit Their Level of Physical Activity in Parks - Central Coast Region ....................................................... 146 Table 132. How Respondents Perceive Certain Factors Might Limit Their Level of Physical Activity in Parks - Central Valley Region....................................................... 147 Table 133. How Respondents Perceive Certain Factors Might Limit Their Level of Physical Activity in Parks - Los Angeles Region ......................................................... 148 Table 134. How Respondents Perceive Certain Factors Might Limit Their Level of Physical Activity in Parks - Northern CA Region ......................................................... 150 Table 135. How Respondents Perceive Certain Factors Might Limit Their Level of Physical Activity in Parks - San Francisco Region ...................................................... 151 Table 136. How Respondents Perceive Certain Factors Might Limit Their Level of Physical Activity in Parks - Sierra Region.................................................................... 152 Table 137. How Respondents Perceive Certain Factors Might Limit Their Level of Physical Activity in Parks - Southern CA Region......................................................... 153 Table 138b. Top Five Activities by Participation in During Their Last Park Visit.......... 155 Table 139a. Recreation Activity Participation of Respondents During the Past 12 Months by Region ....................................................................................................... 156

xiii
Table 139b. Top Five Activities Ranked by Percent Participation During the Past 12 Months ........................................................................................................................ 158 Table 140a. Recreation Activities Respondents Would Like to Participate in More Often by Region. ................................................................................................................... 159 Table 140b. Top Five Activities Respondents Would Like to Participate in More Often..................................................................................................................................... 161 Table 141. Park Activities of Companions Who Were Less Than 18 Years of Age by Region......................................................................................................................... 162 Table 142. Facilities or Amenities Used During Their Last Park Visit by Region......... 163 Table 143. Respondents Satisfaction with Public Outdoor Recreation Areas, Facilities and Services Currently Available by Region ............................................................... 164 Table 144. Respondents Perception of Overall Condition and Operation of Public Outdoor Recreation Areas and Facilities by Region.................................................... 164 Table 145. Importance of California Park and Recreation Facilities and Services by Region......................................................................................................................... 165 Table 146. Emphasis of State and Federal Government Outdoor Recreation Agencies in California Should Place on Aspects of Outdoor Recreation- Central Coast Region. ... 167 Table 147. Emphasis of State and Federal Government Outdoor Recreation Agencies in California Should Place on Aspects of Outdoor Recreation- Central Valley Region. .. 168 Table 148. Emphasis of State and Federal Government Outdoor Recreation Agencies in California Should Place on Aspects of Outdoor Recreation- Los Angeles Region. ..... 168 Table 149. Emphasis of State and Federal Government Outdoor Recreation Agencies in California Should Place on Aspects of Outdoor Recreation- Northern CA Region...... 169 Table 150. Emphasis of State and Federal Government Outdoor Recreation Agencies in California Should Place on Aspects of Outdoor Recreation- San Francisco Region. .. 170 Table 151.Emphasis of State and Federal Government Outdoor Recreation Agencies in California Should Place on Aspects of Outdoor Recreation- Sierra Region. ............... 170 Table 152. Emphasis of State and Federal Government Outdoor Recreation Agencies in California Should Place on Aspects of Outdoor Recreation- Southern CA Region. .... 171 Table 153. Importance of Items to Respondents’ Favorite Activities- Central Coast Region......................................................................................................................... 172 Table 154. Importance of Items to Respondents’ Favorite Activities- Central Valley Region......................................................................................................................... 173 Table 155. Importance of Items to Respondents’ Favorite Activities- Los Angeles Region......................................................................................................................... 173 Table 156. Importance of Items to Respondents’ Favorite Activities- Northern CA Region......................................................................................................................... 174 Table 157. Importance of Items to Respondents’ Favorite Activities- San Francisco Region......................................................................................................................... 175 Table 158. Importance of Items to Respondents’ Favorite Activities- Sierra Region. .. 176 Table 159. Importance of Items to Respondents’ Favorite Activities- Southern CA Region......................................................................................................................... 176 Table 160. Respondents’ Level of Agreement with Statements Concerning Outdoor Recreation Lands and Facilities in California- Central Coast Region. ......................... 177 Table 161. Respondents’ Level of Agreement with Statements Concerning Outdoor Recreation Lands and Facilities in California- Central Valley Region.......................... 179

xiv
Table 162. Respondents’ Level of Agreement with Statements Concerning Outdoor Recreation Lands and Facilities in California- Los Angeles Region. ........................... 180 Table 163. Respondents’ Level of Agreement with Statements Concerning Outdoor Recreation Lands and Facilities in California- Northern CA Region. ........................... 181 Table 164. Respondents’ Level of Agreement with Statements Concerning Outdoor Recreation Lands and Facilities in California- San Francisco Region. ........................ 182 Table 165. Respondents’ Level of Agreement with Statements Concerning Outdoor Recreation Lands and Facilities in California- Sierra Region. ..................................... 183 Table 166. Respondents’ Level of Agreement with Statements Concerning Outdoor Recreation Lands and Facilities in California- Southern CA Region. .......................... 184 Table 167. Activities or Services Respondents Think are Appropriate for a Private Firm to Provide in Public Park and Recreation Areas by Region......................................... 185 Table 168. Respondents Level of Agreement with Statements Concerning California Park Agencies Efforts to Reduce and Adapt to Climate Change and Global Warming-Central Coast .............................................................................................................. 186 Table 169. Respondents Level of Agreement with Statements Concerning California Park Agencies Efforts to Reduce and Adapt to Climate Change and Global Warming-Central Valley.............................................................................................................. 186 Table 170. Respondents Level of Agreement with Statements Concerning California Park Agencies Efforts to Reduce and Adapt to Climate Change and Global Warming-Los Angeles ................................................................................................................ 187 Table 171. Respondents Level of Agreement with Statements Concerning California Park Agencies Efforts to Reduce and Adapt to Climate Change and Global Warming-Northern CA ................................................................................................................ 187 Table 172. Respondents Level of Agreement with Statements Concerning California Park Agencies Efforts to Reduce and Adapt to Climate Change and Global Warming-San Francisco ............................................................................................................. 188 Table 173. Respondents Level of Agreement with Statements Concerning California Park Agencies Efforts to Reduce and Adapt to Climate Change and Global Warming-Sierra........................................................................................................................... 188 Table 174. Respondents Level of Agreement with Statements Concerning California Park Agencies Efforts to Reduce and Adapt to Climate Change and Global Warming-Southern CA................................................................................................................ 189 Table A-1. Respondents’ Zip Codes............................................................................ 197 Table A-2. Other Factors Respondents Perceive Might Limit Their Level of Physical Activity- - Open-Ended Responses. ............................................................................ 210 Table A-3. Other Activities Respondents Participated in During Their Last Park Visit- Open-Ended Responses. ............................................................................................ 213 Table A-4. Other Activities Respondents’ Companions <18 Years of Age Participated in During Their Last Park Visit- Open-Ended Responses. .............................................. 215 Table A-5. Other Facilities or Amenities Used During Their Last Park Visit- Open-Ended Responses. ................................................................................................................. 217 Table A-6. Other Statements Respondents Provided Concerning California Park Agencies’ Efforts to Reduce and Adapt to Climate Change and Global Warming- Open-Ended Responses. ...................................................................................................... 218 Table B-1. Youth Respondents’ Zip Codes ................................................................. 225

xv
Table B-2. Other Reasons Youth Respondents are Kept from Participating in Outdoor Activities - Open-Ended Responses............................................................................ 227 Table B-3. Other Actions That Could Help Youth Respondents Participate in Outdoor Activities More Often- - Open-Ended Responses........................................................ 230 Table B-4. Reasons Why Youth Did Not Visit a California Historic Site or History Museum Before the Age of 14, Open-Ended Responses............................................ 232 Table B-5. Reasons Why Youth Visited a California Historic Site or History Museum Before the Age of 14, Open-Ended Responses. ......................................................... 233 Table B-6. Reasons Why Youth Did Not Play in the Water Before the Age of 14, Open-Ended Responses. ...................................................................................................... 234 Table B-7. Reasons Why Youth Played in the Water Before the Age of 14, Open-Ended Responses. ................................................................................................................. 234 Table B-8. Reasons Why Youth Did Not Play in a Safe Place Before the Age of 14, Open-Ended Responses. ............................................................................................ 236 Table B-9. Reasons Why Youth Played in a Safe Place Before the Age of 14, Open-Ended Responses. ...................................................................................................... 236 Table B-10. Reasons Why Youth Did Not Go Camping Overnight Before the Age of 14, Open-Ended Responses. ............................................................................................ 237 Table B-11. Reasons Why Youth Went Camping Overnight Before the Age of 14, Open-Ended Responses. ...................................................................................................... 239 Table B-12. Reasons Why Youth Did Not Explore Nature Outdoors Before the Age of 14, Open-Ended Responses. ...................................................................................... 240 Table B-13. Reasons Why Youth Explored Nature Outdoors Before the Age of 14, Open-Ended Responses. ............................................................................................ 240 Table B-14. Reasons Why Youth Did Not Learn to Swim Before the Age of 14, Open-Ended Responses. ...................................................................................................... 241 Table B-15. Reasons Why Youth Learned to Swim Before the Age of 14, Open-Ended Responses. ................................................................................................................. 243 Table B-16. Reasons Why Youth Did Not Play on a Sports Team Before the Age of 14, Open-Ended Responses. ............................................................................................ 243 Table B-17. Reasons Why Youth Played on a Sports Team Before the Age of 14, Open-Ended Responses. ...................................................................................................... 245 Table B-18. Reasons Why Youth Did Not Hike, Bike, or Ride on a Trail Before the Age of 14, Open-Ended Responses. .................................................................................. 246 Table B-19. Reasons Why Youth Hiked, Biked, or Rode on a Trail Before the Age of 14, Open-Ended Responses. ............................................................................................ 247 Table B-20. Reasons Why Youth Did Not Catch a Fish Before the Age of 14, Open-Ended Responses. ...................................................................................................... 248 Table B-21. Reasons Why Youth Caught a Fish Before the Age of 14, Open-Ended Responses. ................................................................................................................. 249 Table B-22. Reasons Why Youth Did Not Celebrate Their Heritage Before the Age of 14, Open-Ended Responses. ...................................................................................... 250 Table B-23. Reasons Why Youth Celebrated Their Heritage Before the Age of 14, Open-Ended Responses. ............................................................................................ 252 Table C-1. Focus Group Questions and Responses: .................................................. 253

xvi
List of Charts Chart 1. Use of Parks by Californians During the Past 12 Months ................................ 14 Chart 2. The Number of Days Respondents Visited Highly Developed Parks and Recreation Areas .......................................................................................................... 16 Chart 3. The Number of Days Respondents Visited Developed Nature-Oriented Parks and Recreation Areas.................................................................................................... 16 Chart 4. The Number of Days Respondents Visited Historical or Cultural Buildings, Sites, or Areas............................................................................................................... 16 Chart 5. The Number of Days Respondents Visited Natural and Undeveloped Areas.. 17 Chart 6. Respondent Agreement with Reducing Climate Changing Gases................... 68 Chart 7. Respondent Agreement with Anticipating the Effects of Climate Change ....... 68 Chart 8. Respondent Agreement with Educating Californians....................................... 68 Chart 9. Respondent Agreement with Doing Nothing.................................................... 69

1
INTRODUCTION Background
The California Department of Parks and Recreation is responsible for the preparation and timely revision of a comprehensive California Outdoor Recreation Plan. This plan provides policy guidance and basic information of value to public agencies – federal, state, local and special districts engaged in providing outdoor recreation lands, facilities and services throughout the state. The 2009 Survey on Public Opinions and Attitudes on Outdoor Recreation in California is an essential element of the California Outdoor Recreation Plan. It is the basis for the Open Project Selection Process (OPSP), which is the priority rating system for selecting projects funded through the Land and Water Conservation Fund. Similar surveys were undertaken in 1987, 1992, 1997, and 2002. California Polytechnic State University, San Luis Obispo researchers from the Recreation, Parks and Tourism Administration Program collaborated with the University of Utah, and Devine Tarbell and Associates, Inc. to develop the 2008 surveys. On-going consultation took place with staff from the California Department of Parks and Recreation. The 2008 telephone (Appendix D), mail/online (Appendix E) surveys were significantly modified to better address the opinions and attitudes of Californians. Diagnostics Plus, Inc., a marketing research firm, administered the surveys. In addition, a youth survey (Appendix F) was developed and completed. The first youth survey was conducted in 2002, and the 2008 study attempted to build upon the initial study with an extended mail/online survey preceded by youth focus groups conducted in key geographical regions of the state. California Polytechnic State University, San Luis Obispo and University of Utah researchers completed the data analyses and interpretation, presentation of the findings and the report writing. Cal Poly researchers surveyed a random sample of Californians. This sample of California's population has a confidence level of 95%, with an error factor of plus or minus five percent. When analyzing subsets of the data, readers should use a sufficient sample size to maintain this level of confidence when interpreting data. This may require combining data categories to achieve sufficient sample sizes. Using an online sample size calculator, such as that provided by Raosoft, Inc. (http://www.raosoft.com/samplesize.html) can help readers identify appropriate sample sizes and confidence levels. The Land and Water Conservation Fund, California Department of Parks and Recreation, The US Department of the Interior-National Park Service, the California State University Agriculture Research Initiative and a United States Department of Agriculture McIntire-Stennis grant provided funding for this project.

2
Purpose of the Study The purpose of this study was to understand Californians' opinions and attitudes about outdoor recreation and self-reported levels of physical activity in places where Californians recreate. The primary goals of this study included:
• to learn about the recreational activities Californians are engaged in and what they’d like to do more;
• to learn about Californians' opinions and attitudes regarding recreation facilities, programs, services and policies;
• to learn about Californians' physical activity in parks; • to assess changes in responses compared to prior surveys.
Specifically, the study aimed to:
1) Determine the importance of providing public park and recreation facilities and services; 2) Determine the frequency of participation in specific outdoor recreation activities as well
as the interest levels for participating in these activities more often; 3) Determine the frequency of visiting different types of outdoor recreation areas and
facilities; 4) Determine levels of physical activity in parks; 5) Determine the importance of potential benefits associated with participation in outdoor
recreation activities; 6) Identify preferences and priorities for management decisions pertaining to outdoor
recreation facilities, programs, operations, and policies; 7) Identify constraints that discourage participation in physical activity in parks; 8) Identify preferences for potential management decisions that could help California
reduce and adapt to climate change and global warming; 9) Evaluate Hispanic/Non-Hispanic differences in user participation in outdoor recreation
activities, support facilities and services.

3
Changes in the 2008 Survey The 2008 surveys included many items that were similar to the 2002 surveys. However, substantial changes were made in the 2008 surveys, including the following:
Telephone Survey
• Travel time to recreation places included the options of walking, driving, or other transportation;
• Removed questions about budget cuts; • Moved outdoor recreation lands and facilities opinion statements to mail survey; • Added questions about marital status and employment status; • Added questions from the Physical Activity in Park Settings to measure frequency, type,
and duration of physical activity in parks, amenities, activities, and companions during physical activity.
Adult Mail/Online Survey
• Revised facilities/services measurement to “within California” rather than measuring
“within your local community and “outside your local community”; • Revised facilities/services measure from 10-point priority to 5-point importance scale • Reworded the description of a significant number of activities; • Reduced the number of activities measured from 55 to 39; • Revised latent demand measurement to provide information on latent demand for all 39
activities rather than the top 5 activities; • Revised economic items from “value of one day’s worth of each [most important]
activity” to willingness to pay using an ordinal scale; • Changed measure of visitation to types of outdoor recreation areas during the past 12
months from an ordinal scale to a ratio scale; • Removed questions about opposition or support for solutions to budget cuts; • Revised benefits items from a 4-point to a 5-point importance scale; • Changed agreement statements about outdoor recreation lands and facilities from a 4-
point to a 5-point Likert scale; • Developed an emphasis scale to measure preferences for specific facilities, protection,
acquisitions, programs and services; • Added constraints questions; • Added questions about park agencies’ response to climate change; • Removed questions about information sources and internet access.
Youth Surveys
• Conducted youth focus groups in order to develop a revised youth mail survey; • Created a youth survey using vocabulary suitable for youth ages 12-17 with relevant
activities, constraints, reasons for a favorite activity, and analysis of the 10 activities in the California Children’s Outdoor Bill of Rights.

4

5
METHODOLOGY The research design for the 2008 Opinions and Attitudes Survey included several survey research methods in order to obtain a sample representative of the residents of California. Four general approaches were employed: (1) a telephone survey, (2) an adult mail/online survey (3) youth focus groups, and (4) a youth mail/online survey. The Cal Poly Human Subjects Review Committee approved the study procedures. The survey procedures followed a modified Dillman approach to data collection (Dillman, 2000).
Telephone Survey Methodology Using the 2002 telephone survey as an initial basis, the 2008 telephone survey was revised to include content from the Physical Activity in Parks Setting (PAPS) survey instrument. A consortium of public health and leisure research scholars developed the PAPS to measure physical activity levels and facility use within a park setting. The survey was administered to residents of California using a random sample of telephone numbers within the state. Calls were made between April and June 2008 with a target of 2,500 completed interviews. If a potential interview participant was not reached following six phone call attempts, the number was no longer called. The sampling procedure included a request by the interviewer to speak with a member of the household who was 18 years of age or older with the birth date closest to the date of the call. If a Spanish-speaking household was contacted, a subsequent interview was conducted in Spanish. The procedures resulted in 2,004 completed interviews. The refusal rate for participation in the survey was 77% (n=6,229). In order to reach the target of 2,500 interviews, an additional 499 surveys were completed using an online panel during July 2008. Furthermore, it was determined that the interviews should be expanded to other counties of the state (the original target was the four largest geographical regions in California). An online panel with residents of these other counties during July and August resulted in an additional 277 completed surveys for a total sample size of 2,780 subjects.

6
Adult Mail/Online Survey Methodology Following participation in the telephone survey, each interviewee was asked to complete a second survey via mail or online. A $1 bill was provided as an incentive to complete the mail back survey. As an additional incentive, once the completed survey was received, participants were entered into a drawing to win one of three California State Parks getaway packages. Incentives were explained to the participant over the telephone. A total of 1,350 (67.4%) participants agreed to complete the mail back survey. A link to the online survey as well as a unique login ID and password were provided in the cover letter. Within 24 hours, an email was also sent containing the link to the survey. Of those 1,350 who agreed to complete the survey, 601 (44.5%) completed and returned it (388 by mail and 213 online). Spanish speaking households were sent a Spanish version of the mail survey packet. Approximately three weeks after the initial mail packet was sent, all participants were mailed a reminder postcard about the importance of their participation in the study. Contact information for Diagnostics Plus (phone and email) was provided on the reminder postcard in the event the participant did not receive the packet. If the mail survey was not received within approximately one week, participants were contacted by telephone to remind them to complete the survey and to determine why it had not been completed. Participants were called a second time approximately one week later if they responded that they intended to send the survey back but it still had not been received. Participants received up to three reminder phone calls (approximately 1 week apart). If an email address was provided, they also received an email reminder that included a link to the online version of the survey. Participants also received up to three email reminders (approximately 1 week apart) as needed. The online panel members who finished the telephone survey could also complete the mail survey. Four hundred forty of them (88%) completed the mail survey. In addition to identifying a sample representative of the four largest geographical regions of the state, an online panel was used to complete 277 telephone surveys from other California counties including: Alpine, Amador, Calaveras, Del Norte, El Dorado, Humboldt, Imperial, Inyo, Lake, Lassen, Mariposa, Mendocino, Modoc, Mono, Monterey, Nevada, Plumas, San Benito, San Luis Obispo, Santa Barbara, Santa Cruz, Sierra, Siskiyou, Trinity, Tuolumne, and Ventura Counties. The online panel vendor sent email invitations to members of their panel to complete the survey. Panel members who completed the telephone survey also had the option of participating in the mail survey. One hundred eighty six (67.1%) completed the mail survey. Data collection for these counties took place from July 25th, 2008 to August 1st, 2008. In summary, the overall data collection procedures for the adult survey resulted in 2,780 participants in the telephone survey and 1,227 participants in the mail/online survey.

7
Youth Focus Groups Methodology In order to develop an expanded 2008 youth survey, prior to implementation of the mail/online survey, youth focus groups were conducted within the four geographic regions representing 90% of California’s population. Researchers contacted community recreation centers within these regions to invite participation in the study. The participating centers were ultimately self-selected and represented the Los Angeles Metro Area, San Diego, Modesto, and Livermore. Parental consent forms were sent to the youth prior to participation and were collected during the focus groups. Ten semi-structured interview questions for the focus groups were initially designed based on the Oregon State Parks 2008-12 SCORP (Oregon State Parks, 2007). In order to verify the relevance of the focus group survey to California youth, an expert panel was consulted to review the questions. Research assistants recorded responses to focus group questions using digital recording devices and field notes. Eight focus group sessions were recorded and seven of those recordings were useable and transcribed by a research assistant. Field notes were utilized for the eighth session. A researcher and a research assistant reviewed transcribed results. In order to attain inter-rater reliability, both reviewed one focus group transcription at one time, and then the remaining six were themed and coded separately. There was 90% inter-rater reliability. To resolve the discrepancy, original transcriptions were re-reviewed to examine themes. To develop larger themes (also known as axial themes) (Strauss & Corbin, 1990), past research on outdoor opinions was consulted (Iso-Ahola, Jackson & Dunn, 1994; Jackson, 1987; Jackson, 1994). A third researcher reviewed the three to seven themes that emerged per question. The youth participating in the focus groups were participants in programs at community recreation centers. They were divided into groups based on age (10-13 and 14-17). Participants were assumed to be residents of the geographic regions. A total of 72 California youth participated in the focus groups. Males and females were equally represented. Most respondents were Hispanic (n=25), Caucasian (n=21) or African American (n=16). Other populations represented were Asian, Native American, and multiracial. Key findings of the focus groups can be found in Appendix C.

8
Youth Mail/Online Survey Methodology The results of the youth focus groups were incorporated into the design of the youth mail/online survey. During the telephone interview, participants were asked if there were any children between the ages of 12-17 living in the household. If so, the parent or legal guardian of the child was asked permission to send the child a youth survey through the mail. Children who returned the completed youth survey received a $5 check as an incentive. If the parent/guardian gave permission, a copy of the youth survey as well as an additional postage paid envelope was included with the adult mail packet (note: If the adult did not agree to complete the mail survey but gave permission for the child to complete the survey, the mail packet only contained the youth survey information but was still addressed to the parent). A youth cover letter was also sent that explained the survey, contact information, and requested signatures of both the parent and child. Two copies of the youth cover letter were sent - one copy to sign and return with the youth mail survey and one copy to keep. Spanish speaking households were sent a Spanish version of the youth survey. Postcard reminders were sent following the same procedures as employed in the adult mail/online survey. A total of 456 (22.8%) participants reported having children 12 to 17 years of age living in the household. Of these households, 304 (66.7%) agreed to complete the youth mail survey. Youth also had the option of completing the survey online. A link to the survey as well as a unique login ID and password was provided in the cover letter. Youth also had the option of receiving the link to the online version of the mail survey immediately by email. Within 24 hours an email was sent that contained the link to the survey, (emails with the link were sent directly to the parent/guardian). Of the 304 youth who agreed to complete the survey, 88 (29%) completed and returned it (73 mailed the survey back and 15 completed it online). As expected, the percentage of households with youth ages 12-17 in the telephone sample was not adequate to collect a target of 400 youth mail surveys. For this reason, along with the lower than expected return rate for the youth mail survey, an online youth panel was used to complete 309 surveys. Data collection for the panel took place from July 17, 2008 to July 24, 2008. Since this data could not be linked to telephone interviews for demographic information, demographic questions were added to the survey (number of years living in California, number of years living in current community, household race/ethnicity, county and zip code). The online panel vendor sent email invitations to youth ages 13-17 (for 12 year olds, the invite was sent to the parents) in the four defined regions. Quotas were set to get approximately the same number of interviews from each age. Due to research restrictions when working with youth younger than 13 years of age, parents of 12-year-old participants were required to answer the demographic questions. The data collection procedures resulted in the receipt of 397 youth surveys.

9
SURVEY OF CALIFORNIA ADULTS Overall, the sample surveyed was representative of each region within generally a 95% confidence level with a confidence interval of + 5. The sample was representative of males and females, and contained a range of age groups from 18 years of age to 65 and older. Further, the majority of those sampled specified their household as white, however the sample did include households of Hispanic or Latino of Mexican descent, Asian, American Indian or Alaskan Native, and other races. While we cannot be sure the sample is representative of all races in California, it does include races identified in the 2000 Census. Most of those surveyed were married (53%), however the sample also included those who were single, living with a partner, divorced, widowed, and separated. Although just over 39% of those surveyed had identified having children under the age of 18 living in their home, the majority did not. Respondents were generally well educated, with at least some college or higher degrees, employed full or part-time, and had lived in their area for a substantial amount of time (on average 16 years). The sample also seemed relatively split between lower, medium, and higher incomes at approximately 30% each.
Adult Socio-Demographics An evaluation of socio-demographics of respondents included gender, age, household ethnicity, marital status, household status, education, employment, household income, and residence. A summary of the results are shown in Tables 1 and 2. With respect to adults, 51% of respondents were male and 49% were female (Table 1). The majority identified their household as "white" (59%), were married (53%), had earned at least an associates degree (51%), were either employed full-time or a student (53%), and earned at least $35,000 per year. Sixty-two percent of respondents ranged from 25 to 54 years of age and the majority lived as a couple, either with or without children at home (59%).
Table 1. Socio-Demographic Characteristics of Respondents. Characteristic Gender (Q32)
% n
Male 51.4 1430 Female 48.6 1350
Age (Q30A) 18 to 24 13.8 385 25 to 34 21.7 602 35 to 44 22.5 625 45 to 54 17.8 494 55 to 64 10.6 294
65 or older 13.4 372 Household Ethnicity (Q30)
White 58.8 1636 Hispanic or Latino of Mexican Descent 25.1 697
Asian 9.7 271 Black or African American 5.5 152
Other Hispanic or Latino 5.1 142

10
Table 1. Socio-Demographic Characteristics of Respondents. Characteristic
American Indian or Alaska Native 2.7 75 Some other race 2.3 64
Native Hawaiian or Other Pacific Islander 1.2 34 Mixed 0.5 11
Marital Status (Q27A) Single, never married 28.3 786
Married 53.1 1475 Living with partner 3.7 102
Separated 0.9 24 Divorced 7.9 221 Widowed 4.7 132
Household Status (Q28) Living alone 15.7 437
Couple with no children under 18 at home
24.6 684
Couple with one or more children under 18 at home
34.3 953
Single person(s) with children under 18 at home
5.2 145
Single person with children over 18 at home
8.4 233
Another living situation 1.5 43 Living with roommates (no relation) 6.9 193
Adult Telephone Survey, n is the # of responses
Table 2. Socio-Economic Characteristics of Respondents. Characteristic % n Education (Q27)
Did not graduate high school 5.8 160 High school graduate 18.2 506
Some college but no degree 24.0 667 Associate degree 11.0 305
Bachelor’s degree 26.1 726 Master’s degree 9.2 256
Professional degree 2.0 55 Doctorate degree 2.7 75
Employment Status (Q28A) Employed full time 45.3 1258
Employed part time 11.3 315 Retired 14.8 411 Student 7.4 207
Homemaker 9.6 267 Not employed, but looking for work 4.0 111

11
Table 2. Socio-Economic Characteristics of Respondents. Characteristic % n
Not employed and not looking for work 1.3 35 Other 4.9 135
Household Income (Q29) Under $20,000 15.3 425
$20,000 to $34,999 15.2 423 $35,000 to $49,999 13.3 369 $50,000 to $74,999 17.4 484 $75,000 to $99,999 10.1 282
$100,000 to $149,999 8.5 236 $150,000 to $199,999 2.9 82
$200,000 or more 3.3 91 Adult Telephone Survey, n is the # of responses Respondents for the survey were targeted from seven regions in California: Central Coast, Central Valley, Los Angeles, Northern California, San Francisco Bay Area, Sierra, and Southern California. The percent of the surveyed population in each region closely matches the percent of the total population in each region according to California Census data. This comparison, and the confidence interval for each region, is shown in Table 3 below. The sample size with a particular percent confidence interval set at the 95% confidence level will produce answers that are 95 times out of a hundred within plus or minus the number of percentage points of the answer that would be produced if asked of the entire population. Table 3. Region Where Respondents Lives.
Regional Number of Respondents
Regional Percent of Total Respondents
95% Confidence Level: Confidence Intervals
Regional Percent of Total State Population
Regional Population (Census data, 2008 est.)
Central Coast
136 4.8% ±8.40 3.8% 1,386,767
Central Valley
405 14.6% ±4.87 15.9% 5,861,564
Los Angeles
814 29.3% ±3.43 29.0% 10,659,789
Northern CA
59 2.1% ±12.76 1.9% 705,343
San Francisco
596 21.4% ±4.01 19.2% 7,046,719
Sierra 56 2.1% ±13.10 2.2% 804,810Southern CA
714 25.7% ±3.67 28.0% 10,291,674
Totals 2780 100.00% ±1.85 100.00% 36,756,666Adult Telephone Survey (Q31)

12
On average, the subjects had lived in California for 31 years and in their current community for 16 years (Table 4). Table 4. Respondent Residence Characteristics.
Characteristic Mean Mode Range n Years lived in California 30.7 20 1 - 95 2780 Years lived in current community 15.8 3 1 - 80 2780
Adult Telephone Survey, n is the # of responses (Q1, Q2)

13
Adult Outdoor Recreation Behavior
Overall, a majority of adult Californians visit parks fairly frequently (at least once per week). They also visit a range of facility types, from highly developed to nature oriented park and recreation areas, cultural and historic buildings or sites, and natural or undeveloped areas—all of which appear to be important to significant portions of California’s population. In summary, Californians visit the outdoors! Data from the 2008 survey suggest that Californians are frequent users of public parks and recreation areas and that they visit these areas with others. Since the largest percentage of respondents spends less than 5 minutes traveling to recreation areas, the importance of local public parks and recreation areas that are accessible and convenient for users should not be underestimated.
Adult Frequency of Outdoor Recreation Area Visitation Respondents were asked a series of questions about the frequency of their park visits within the last 12 months. The majority had visited a park within either the last month or the last six months (88%) (Table 5). Table 5. Respondents’ Last Park Visit.
Characteristic % n Visited within the last month 73.7 2049 Visited within the last 6 months 14.3 397 Visited within the last 12 months 5.4 150 Visited more than 1 year ago 6.6 184 Adult Telephone Survey, n is the # of responses (Q3, Q4, Q3B, Q3C)
A small percentage of respondents reported last visiting a park more than one year ago (6.6%), with the majority (54%) of these infrequent visitors last going to a park either 1 to 2 years ago or 5 or more years ago (Table 6). According to research conducted by Southeastern Research Station of the U.S. Forest Service, there were 740 million visits to state parks in the United States in 2007 alone. With almost two-thirds of respondents visiting parks within the last month, this number and the research by the Forest Service reflect a trend toward increasing park visitation nationally since a low of 711 million visits in 2006 (Cordell, Betz & Green, 2008) Table 6. Respondents’ Last Park Visit If More than One Year Ago.
Number of Years Ago % n 1 to 2 years ago 25.0 46 2 to 3 years ago 17.4 32 3 to 4 years ago 8.7 16 4 to 5 years ago 8.7 16 5 or more years ago 29.3 54 Never visited a park 3.8 7 Don't know 7.1 13 Adult Telephone Survey, n is the # of responses (Q3C)

14
Those Californians who said they visited a park within the last month also frequent parks at least once a week or more. On average, these Californians visited parks approximately 6 days in their most recent month surveyed and spent 8.5 hours at the park during their last visit (Table 7) (Chart 1). In the past 12 months, the majority (62%) reported visiting parks either one or more times per week or once or twice a month (Table 8). Table 7. Respondent Park Visitation Characteristics.
Characteristic Mean Mode Range n Don’t Know
# days visited in last month 5.9 2.0 1 - 31 2007 42 # hours spent during last visit 8.5 2.0 .03- 336 2681 91 Adult Telephone Survey, n is the # of responses (Q4, Q5) Table 8. Frequency of Park Visitation in Past 12 Months.
Visitation in Past 12 months % n Two or more times per week 20.9 580 About once a week 14.6 404 Once or twice a month 26.2 726 Several times a year 19.5 542 Once or twice a year 11.9 331 Not at all 5.8 162 Don't know 1.0 28 Adult Telephone Survey, n is the # of responses (Q6) In summary, park visits are important to Californians, with the vast majority visiting within the last month, and less than eleven percent not visiting a park within the last year.
Respondents were asked to report how many days they spent visiting different types of outdoor recreation areas in the past 12 months. The areas included: 1) highly developed parks and recreation areas; 2) developed nature-oriented parks and recreation areas; 3) historical or cultural buildings, sites, or areas; and 4) natural and undeveloped areas. The majority of
Chart 1. Use of Parks by Californians During the Past 12 Months (Q6)
5.8%
11.9%
19.5%
26.2%
20.9%
0% 10%
20% 30% 40%
Once or twice a year
Several times a year
Two or more times per week

15
Californians reported visiting each of these areas 1 to 5 days during the past 12 months (Table 9) (Charts 1 through 5). Table 9. The Number of Days Respondents Visited Outdoor Recreation Areas During the Past 12 Months.
0 days
1-5 days
6-10 days
11-20 days
21-50 days
>50 days Type of Outdoor
Recreation Area % n % n % n % n % n % n Highly developed parks and recreation areas: In or near urban areas that may include playgrounds, sports facilities, and highly developed beaches; for example, city parks
9.9 122 31.8 390 14.0 172 13.3 163 14.9 183 16.1 197
Developed nature-oriented parks and recreation areas: Located outside or on the fringe of urban areas, including trails, picnic areas, campgrounds, and information centers. Generally includes national, state, large county and regional parks, beaches, reservoirs, and state and national recreation areas
12.3 151 41.5 509 15.0 184 11.5 141 9.0 111 10.0 131
Historical or cultural buildings, sites, or areas: Regardless of location
22.2 272 47.9 588 13.3 163 6.0 74 2.6 32 8.0 98
Natural and undeveloped areas: Large areas in natural or nearly natural condition, with few developments; for example, forests, deserts, mountains, wetlands, and seashores
21.9 269 41.2 505 11.4 140 9.4 115 6.2 76 9.9 122
Adult Mail-Back Survey, n is the # of responses (Q4)

16
Chart 3. The Number of Days Respondents Visited Developed Nature-Oriented Parks and Recreation Areas (Q4)
12.3% 41.5%
15.0%11.5%
9.0% 10.0%
0 10 20 30 40 50 0
1-56-10
11-20 21-50
>50
# Visits
Chart 2. The Number of Days Respondents Visited Highly Developed Parks and Recreation Areas (Q4)
9.9%
31.8%14.0%13.3%14.9%
16.1%
0 5 10 15 20 25 30 350
1-5 6-10
11-20 21-50
>50
# Visits
Chart 4. The Number of Days Respondents Visited Historical or Cultural Buildings, Sites or Areas (Q4)
47.9%
13.3% 6.0%
2.6% 8.0%
0 10 20 30 40 50 600
1-56-10
11-20 21-50
>50
# Visits

17
Even though our nature-based numbers are less than developed parks, Californians still like nature-based areas more than people in the other western states do. For example, in a recent Recreation Statistics Update Report (published by the U.S. Forest Service), the nature-based outdoor tourism activities of residents of the eight most populated metro areas in the Western U.S. were analyzed. On average, residents of the San Francisco and Los Angeles metro areas were more likely to engage in nature-based outdoor tourism activities compared to residents in Phoenix, Seattle, and Denver. Residents of San Francisco outpaced their Los Angeles neighbors (Cordell & Betz, 2005). In general, Californians not only enjoy the outdoors, but they are more likely to engage in nature-based outdoor tourism activities than their Western neighbors are.
Chart 5 . The Number of Days Respondents Visited Natural and Undeveloped Areas (Q4)
21.9%41.2%
11.4% 9.4%
6.2% 9.9%
0 10 20 30 40 500
1-56-10
11-20 21-50
>50
# Visits
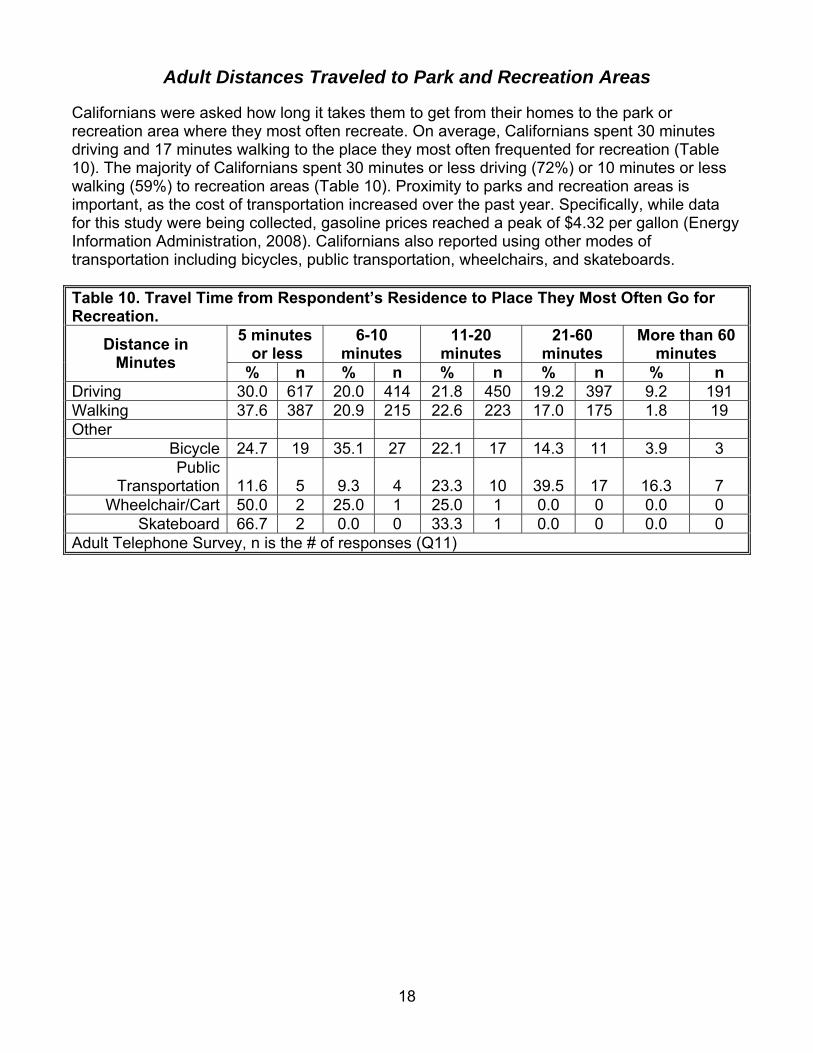
18
Adult Distances Traveled to Park and Recreation Areas
Californians were asked how long it takes them to get from their homes to the park or recreation area where they most often recreate. On average, Californians spent 30 minutes driving and 17 minutes walking to the place they most often frequented for recreation (Table 10). The majority of Californians spent 30 minutes or less driving (72%) or 10 minutes or less walking (59%) to recreation areas (Table 10). Proximity to parks and recreation areas is important, as the cost of transportation increased over the past year. Specifically, while data for this study were being collected, gasoline prices reached a peak of $4.32 per gallon (Energy Information Administration, 2008). Californians also reported using other modes of transportation including bicycles, public transportation, wheelchairs, and skateboards. Table 10. Travel Time from Respondent’s Residence to Place They Most Often Go for Recreation.
5 minutes or less
6-10 minutes
11-20 minutes
21-60 minutes
More than 60 minutes Distance in
Minutes % n % n % n % n % n Driving 30.0 617 20.0 414 21.8 450 19.2 397 9.2 191 Walking 37.6 387 20.9 215 22.6 223 17.0 175 1.8 19 Other
Bicycle 24.7 19 35.1 27 22.1 17 14.3 11 3.9 3 Public
Transportation 11.6 5 9.3 4 23.3 10 39.5 17 16.3 7 Wheelchair/Cart 50.0 2 25.0 1 25.0 1 0.0 0 0.0 0
Skateboard 66.7 2 0.0 0 33.3 1 0.0 0 0.0 0 Adult Telephone Survey, n is the # of responses (Q11)

19
Adult Visitor Group Characteristics Californians travel to parks with family and friends (family-56%; family and friends-31%) (Table 11). Fewer than 15% of respondents went alone, with a pet, or an organized group. Other respondents traveled with a care provider, co-workers, daycare children, or a personal trainer. Although the number of companions who accompanied respondents to parks varied, respondents on average went to parks with nearly five other companions over the age of 18 and three companions under the age of 18 (Table 12).
Table 11. Companions Who Accompany Respondents to a Park. Companion % n
Just Family 55.6 1542 Both Family and Friends at the same time 31.2 864 Just Friends 24.7 684 No one 14.8 411 Pet 13.0 360 Organized group 10.0 278 Other:
Care Provider .04 1 Co-Workers .04 .1
Daycare Children .04 1 Personal Trainer .04 1
Adult Telephone Survey, n is the # of responses (Q16)
Table 12. Number of Companions Respondents Visited a Park With. Don’t Know Companions Mean # Mode n % n
# of people 18 years and older 4.7 2 2374 2.7 67 # of people less than 18 years of age 2.8 0 2384 2.3 56 Adult Telephone Survey, n is the # of responses (Q17, 18)

20
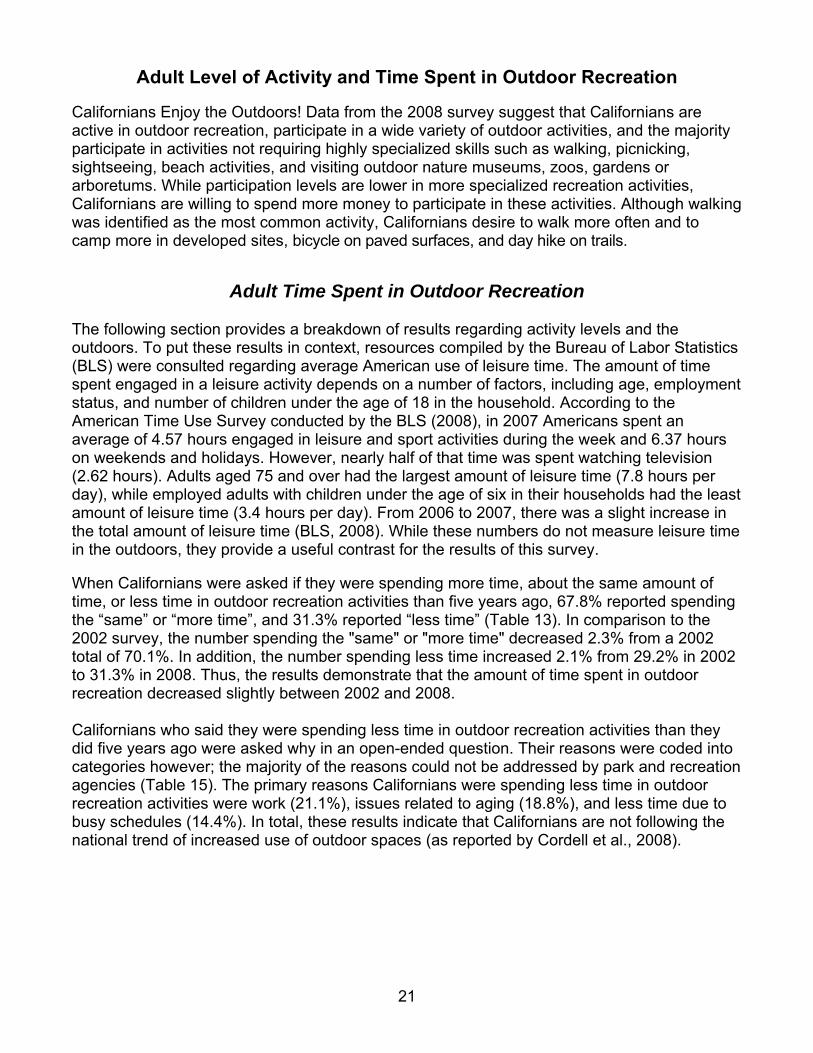
21
Adult Level of Activity and Time Spent in Outdoor Recreation Californians Enjoy the Outdoors! Data from the 2008 survey suggest that Californians are active in outdoor recreation, participate in a wide variety of outdoor activities, and the majority participate in activities not requiring highly specialized skills such as walking, picnicking, sightseeing, beach activities, and visiting outdoor nature museums, zoos, gardens or arboretums. While participation levels are lower in more specialized recreation activities, Californians are willing to spend more money to participate in these activities. Although walking was identified as the most common activity, Californians desire to walk more often and to camp more in developed sites, bicycle on paved surfaces, and day hike on trails.
Adult Time Spent in Outdoor Recreation The following section provides a breakdown of results regarding activity levels and the outdoors. To put these results in context, resources compiled by the Bureau of Labor Statistics (BLS) were consulted regarding average American use of leisure time. The amount of time spent engaged in a leisure activity depends on a number of factors, including age, employment status, and number of children under the age of 18 in the household. According to the American Time Use Survey conducted by the BLS (2008), in 2007 Americans spent an average of 4.57 hours engaged in leisure and sport activities during the week and 6.37 hours on weekends and holidays. However, nearly half of that time was spent watching television (2.62 hours). Adults aged 75 and over had the largest amount of leisure time (7.8 hours per day), while employed adults with children under the age of six in their households had the least amount of leisure time (3.4 hours per day). From 2006 to 2007, there was a slight increase in the total amount of leisure time (BLS, 2008). While these numbers do not measure leisure time in the outdoors, they provide a useful contrast for the results of this survey. When Californians were asked if they were spending more time, about the same amount of time, or less time in outdoor recreation activities than five years ago, 67.8% reported spending the “same” or “more time”, and 31.3% reported “less time” (Table 13). In comparison to the 2002 survey, the number spending the "same" or "more time" decreased 2.3% from a 2002 total of 70.1%. In addition, the number spending less time increased 2.1% from 29.2% in 2002 to 31.3% in 2008. Thus, the results demonstrate that the amount of time spent in outdoor recreation decreased slightly between 2002 and 2008. Californians who said they were spending less time in outdoor recreation activities than they did five years ago were asked why in an open-ended question. Their reasons were coded into categories however; the majority of the reasons could not be addressed by park and recreation agencies (Table 15). The primary reasons Californians were spending less time in outdoor recreation activities were work (21.1%), issues related to aging (18.8%), and less time due to busy schedules (14.4%). In total, these results indicate that Californians are not following the national trend of increased use of outdoor spaces (as reported by Cordell et al., 2008).

22
Table 13. Amount of Time Respondents Currently Spend in Outdoor Recreation Activities Compared to 5 Years Ago.
Amount of Time n % More time 1040 37.4 About the same 846 30.4 Less time 869 31.3 Don't know 24 0.9 Refused 1 0.0 Adult Telephone Survey, n is the # of responses (Q7) Table 14. Amount of Time Respondents Spend in Outdoor Recreation Activities Compared to 5 Years Ago, 1997 to 2008.
Amount of Time 1997 2002 2008 More time 34.0 34.0 37.4 About the same 28.7 36.1 30.4 Less time n/a 29.2 31.3 Adult Telephone Survey, n is the # of responses (Q7) Table 15. Reasons Respondents Spend Less Time in Outdoor Activities Than They Did 5 Years Ago- Open-Ended Responses (n = 869).
Reason % n Work 21.1 183 Aging 18.8 163 Less Time/Too Busy 14.4 125 Children Growing /Grown Up 8.6 75 Health Issues 6.8 59 Other Interests/Lifestyle Changed 6.0 52 Young Children 4.9 43 School 4.6 40 Other Obligations 4.1 36 Cost 2.8 24 Disability 2.4 21 Crowding 2.2 19 Too Far Away 2.1 18 Fuel Prices 2.0 17 Crime/Safety 1.7 15 No Reason/Don't Know 1.7 15 Caring for Other People 1.6 14 Lazier 1.6 14 Too Hot/Too Sunny 1.5 13 No Companions 1.3 11 Participate on Private Property Now 1.0 9 Lack of Transportation 0.9 8 Parks Not Maintained 0.9 8 Rather Be Indoors 0.8 7

23
Table 15. Reasons Respondents Spend Less Time in Outdoor Activities Than They Did 5 Years Ago- Open-Ended Responses (n = 869).
Reason % n Do Not Belong to Organized Team Anymore 0.6 5 Dog Older/Gone 0.6 5 No Place Worth Going/Fewer Opportunities Where Live 0.6 5 Homeless People in Parks 0.5 4 Too Difficult to Get to a Park 0.5 4 Do Not Have a Reason to Go 0.3 3 Do Not Own RV Anymore 0.3 3 Different Friends 0.2 2 Difficult to Get Reservations 0.2 2 Fires 0.2 2 No Parking 0.2 2 Organized Sport Schedules 0.2 2 Schedule Changed 0.2 2 Too Many Park Restrictions 0.2 2 Do Not Like Clientele of Public Parks 0.1 1 Do Not Like to Go Anywhere 0.1 1 Do Not Own Boat Anymore 0.1 1 Do Not Own Cabin Anymore 0.1 1 Go to a Gym Now Instead 0.1 1 Insecurity 0.1 1 Music 0.1 1 No Alcohol Permitted 0.1 1 No Fishing Opportunities in California 0.1 1 Park Funds Cut 0.1 1 Poor Environmental Quality 0.1 1 Poor Hunting/Fishing Quality 0.1 1 Adult Telephone Survey, n is the # of responses (Q8)

24
Adult Time Spent in Physical Activity Californians were asked to indicate their level of physical activity in the past month. In general, the majority (77%) had been physically active (Table 16). Eighty-seven percent reported participating in moderate activity for at least 10 minutes at a time and 52% reported participating in vigorous physical activity (Moderate activities were defined as causing small increases in breathing or heart rate such as brisk walking or bicycling and vigorous activities causing large increases in breathing or hear rate such as running or aerobics.). Among those reporting moderate levels of activity, the highest percentage participated three times per week (21%) and most commonly spent an average of 72 minutes in the activity (Table 17). Likewise, the highest percentage of those reporting vigorous levels of activity also reported participating three times per week (25%) and spent an average of 74 minutes in the activity (Table 18). According to the National Center for Health Statistics (2007), approximately 31% of adults engage in regular physical activity during their leisure time. Results of the current research suggest Californians meet (and exceed) the national average. Table 16. Respondents Participation in Other Physical Recreation Activities or Exercises.
Yes No Don’t Know Activity % n % n % n Participated in other physical activities or exercises during past month.
77.4 2152 22.2 616 0.4 11
Participated in moderate physical activity for at least 10 minutes at a time.
87.2 2424 11.8 328 0.9 26
Participated in vigorous physical activity for at least 10 minutes at a time.
51.8 1441 46.5 1293 1.6 45
Adult Telephone Survey, n is the # of responses (Q20)

25
Table 17. Respondents Participation in Moderate Physical Activity.
# Days per week: % n < 1 1.1 27
1 5.5 134 2 13.7 331 3 20.8 504 4 13.7 333 5 17.1 414 6 5.2 126 7 22.5 542
Mean Days 4.3 Do not do any moderate physical activity for at least 10 min 0.2 6
Don’t Know 0.3 7
Mean Mode Range n Amount of time per day participated in moderate activity (minutes) 72.1 60.0 1 - 1440 2359
Adult Telephone Survey, n is the # of responses (Q21, Q22, Q23) Table 18. Respondents Participation in Vigorous Physical Activity.
Vigorous Physical Activity # days per week participated in vigorous activity: % n
< 1 2.2 32 1 15.7 226 2 20.2 290 3 25.5 366 4 13.7 197 5 11.0 158 6 3.8 55 7 7.7 111
Mean Days 3.2 Do not do any vigorous physical activity for at least 10 min 0.1 2
Don’t Know 0.1 2 Mean Mode Range n Amount of time per day participated in vigorous activity (minutes) 74.0 60.0 5 - 840 1409
Adult Telephone Survey, n is the # of responses (Q24, Q25, Q26) When specifically asked about their levels of physical activity in parks, the majority of Californians (77%) reported participating in either light (standing or walking at a slow pace) to moderate (walking at a moderate pace, playing tennis) levels of activity during park visits

26
(Table 19). In fact, only 8.9% said they mostly sat while at parks. During their time at parks, nearly 26% of Californians reported spending 31 to 60 minutes being physically active whereas the highest percentage (29.6%) spent 30 minutes or less (Table 20). However, 22% said they spent more than 2 hours being physically active in parks. Table 19. Respondents’ Level of Activity When Visiting Parks.
Activity Level % n Mostly sitting 8.9 247 Mostly light activities 36.1 1000 Mostly moderate activities 40.6 1125 Mostly vigorous activities 13.6 377 Don't know 0.7 20 Refused 0.1 4 Adult Telephone Survey, n is the # of responses (Q14) Table 20. Respondents’ Time Spent Physically Active in Parks.
Minutes % n Less than 10 minutes 10.2 268 11 – 30 minutes 19.4 509 31 – 60 minutes 25.9 680 61 – 90 minutes 8.2 216 91 – 120 minutes 13.8 363 More than 2 hours 22.4 587 Adult Telephone Survey, n is the # of responses (Q12) Californians (adults) were asked to what extent certain factors might limit their level of physical activity at parks. Gang activity, alcohol, and drug use in parks, and poorly maintained parks were perceived as the most limiting (Table 21 and 22). The least limiting factors were handicap accessibility and the availability of commercial visitor services. This could be because many parks meet the Americans with Disabilities Act compliance standards. Additional open-ended comments associated with this question indicated that access to amenities (n = 18), facilities/opportunities (n = 18), and crowding (n = 14) were also factors perceived as potentially limiting respondents' physical activity in parks (Table 23) (Appendices A-2). Safety and the physical condition of the parks appear to be the largest barriers to physical activity at parks.

27
Table 21. How Respondents Perceive Certain Factors Might Limit Their Level of Physical Activity in Parks.
Limit Activity Factor1 Mean2 Mode n Gang activity in park 4 5 1218 Alcohol and drug use in park 4 5 1218 Poorly maintained park 3 5 1217 Poorly maintained trail conditions 3 5 1214 Poor lighting in park 3 3 1215 Park does not have the facilities I like to use 3 3 1214
Lack of scenic beauty 3 3 1214 Not enough time 3 3 1208 Fear of crime from others in the park 3 3 1218 I am physically active elsewhere 3 3 1210 Trail design 3 3 1213 Limited park hours 3 3 1213 No restrooms 3 1 1208 Personal safety concerns 3 1 1216 Park is too far away from where I live 3 1 1214 No one to be physically active with 3 1 1215 Costs of activity 3 1 1205 Weather 3 1 1207 Personal health problems 2 1 1215 I am not physically active 2 1 1209 Lack of skills and abilities 2 1 1210 Don’t feel welcome in park 2 1 1210 Lack of public transportation to park 2 1 1208 Dogs are not allowed 2 1 1201 Park is not accessible for individuals with a physical disability 2 1 1200
Commercial visitor services, like food services or gift shops, are not available 2 1 1208
1 Rated on a scale from 1 = not at all to 5 = a lot. 2 Rounded to the nearest whole number.
Adult Mail-Back Survey, n is the # of responses (Q9)

28
Table 22. How Respondents Perceive Certain Factors Might Limit Their Level of Physical Activity in Parks.
Not at All 2 3 4 A lot Factor1 % n % n % n % n % n Gang activity in park 15.3 186 8.0 98 13.7 167 13.5 164 49.5 603 Alcohol and drug use in park 17.7 216 10.1 123 16.6 202 16.5 201 39.1 476
Poorly maintained park 16.8 204 14.4 175 20.3 247 22.0 268 26.5 323
Poorly maintained trail conditions 16.3 198 15.6 189 23.5 285 20.9 254 23.7 288
Poor lighting in park 16.6 202 14.6 177 25.8 314 20.9 254 22.1 268 Park does not have the facilities I like to use
19.9 242 14.6 177 29.8 362 19.5 237 16.2 197
Lack of scenic beauty 19.6 238 13.7 166 29,1 353 20.8 253 16.8 204 Not enough time 18.6 225 11.8 143 30.2 265 25.4 307 13.9 168 Fear of crime from others in the park 22.9 279 16.7 204 24.1 294 15.3 186 20.9 255
I am physically active elsewhere 19.3 234 13.7 166 35.1 425 18.1 219 13.7 16
Trail design 22.3 270 19.4 235 29.3 355 17.0 206 12.1 147 Limited park hours 25.1 305 15.3 185 27.8 337 19.5 236 12.4 150 No restrooms 28.6 346 13.5 163 24.0 290 16.0 193 17.9 216 Personal safety concerns 28.6 348 19.5 237 23.4 284 14.6 178 13.9 169
Park is too far away from where I live 31.9 387 11.2 136 24.5 297 17.1 207 15.4 187
No one to be physically active with 34.8 423 12.7 154 25.7 312 14.5 176 12.3 150
Costs of activity 31.2 376 16.3 197 27.8 335 13.5 163 11.1 134 Weather 34.7 419 13.4 162 28.6 345 13.6 164 9.7 117 Personal health problems 43.6 530 12.2 148 20.1 244 12.6 153 11.5 140
I am not physically active 43.6 527 15.6 189 24.7 299 10.2 123 5.9 71
Lack of skills and abilities 37.9 458 20.7 251 30.4 368 8.1 98 2.9 35
Don’t feel welcome in park 49.6 600 13.0 157 18.6 225 9.3 112 9.6 116
Lack of public transportation to park 51.3 620 14.4 174 19.5 236 8.0 97 6.7 81
Dogs are not allowed 55.2 663 11.7 140 18.1 217 6.7 81 8.3 100 Park is not accessible for individuals with a physical disability
58.8 705 11.8 141 19.6 235 5.2 62 4.8 57

29
Table 22. How Respondents Perceive Certain Factors Might Limit Their Level of Physical Activity in Parks.
Not at All 2 3 4 A lot Factor1 % n % n % n % n % n Commercial visitor services, like food services or gift shops, are not available
55.4 669 12.8 155 20.9 253 5.5 67 5.3 64
Adult Mail-Back Survey, n is the # of responses (Q9)
Table 23. Other Factors Respondents Perceive Might Limit Their Level of Physical Activity-Open-Ended Responses. Factor n Access to Amenities 18 Facilities/Opportunities 18 Crowding 14 Safety 9 Cost 8 Actions of Others 5 Health 4 Activity Viewed Unfavorable 2 Bugs 2 No Companions 2 Time 1 Transportation 1 Other 1 Adult Mail-Back Survey, n is the # of responses (Q9) Californians may be constrained due to safety concerns. Even though the majority of Californians are physically active, they perceive issues of safety and security as potentially limiting future activity. Specifically, factors such as gang activity, the prevalence of substance abuse in parks, and poorly maintained park facilities are perceived as having the greatest influence in reducing their physical activity in parks.

30
Activities of Adult Californians
Californians identified being quite active in outdoor recreation and participated in a number of activities. The most common activities were walking (49%), playing (30%), sedentary activities (24%), and eating/picnicking (24%) (Table 24). Other common activities reported in the open-ended comments included camping (n = 24), boating (n =19), photography (n = 16), and sightseeing (n = 16) (Appendix A-3). Respondents participated the least in fishing (5%), active water sports (4%), tennis (2%), marital arts /tai chi/yoga (<1%), and in-line skating (<1%). These statistics are echoed by results from a U. S. Forest Service study of visitors to the Angeles National Forest in 2004. In that study, walking and day hiking were very popular, while participation in fishing and water sports were not (USDA, 2005). Table 24. Activities Respondents Participated in During Their Last Park Visit.
Yes No Don’t Know Activity % n % n % n
Walking 49.0 1360 50.8 1408 0.1 4 Playing 30.5 845 69.3 1923 0.1 4 Sedentary activities 24.1 667 75.8 2101 0.1 4 Eating/picnicking 24.0 666 75.8 2102 0.1 4 Sports 18.6 515 81.2 2253 0.1 4 Hiking 16.8 467 83.0 2301 0.1 4 Wildlife viewing 12.7 352 87.1 2416 0.1 4 Jogging/running 12.5 348 87.3 2420 0.1 4 Dog walking 9.2 254 90.7 2514 0.1 4 Swimming 8.5 235 91.3 2533 0.1 4 Bicycling 8.0 223 91.8 2545 0.1 4 Fishing 5.2 145 94.6 2623 0.1 4 Active water sports 4.0 110 95.9 2658 0.1 4 Tennis 2.2 61 97.6 2707 0.1 4 Martial arts/tai chi/yoga 0.7 20 99.1 2748 0.1 4 In-line skating 0.5 15 99.3 2753 0.1 4 Other 9.7 269 90.1 2499 0.1 4 Adult Telephone Survey, n is the # of responses (Q15)

31
Activity Participation and Latent Demand for Adult Californians Californians were asked to report the number of days they spent participating in specific outdoor recreation activities and which ones they would like to participate in more often. Generally, Californians like to be outdoors. The most popular activities among Californians were: 1) Walking for fitness or pleasure (74%); 2) Picnicking in picnic areas (67%); 3) Driving for pleasure, sightseeing, driving through natural scenery (60%); 4) Beach activities (59%); and 5) Visiting outdoor nature museums, zoos, gardens or arboretums (58%) (Table 25). On average, Californians spent more days during the past 12 months walking for fitness or pleasure (73 days) and jogging or running for exercise than any other activity (Table 26). Compared to the more recent 2002 survey however, fewer Californians participated in virtually all recreation activities. The most compelling differences were seen in the following activities: using open turf areas, visiting historic or cultural sites, driving for pleasure/sightseeing, wildlife viewing/bird watching/viewing natural scenery, motor boating/personal watercraft, attending outdoor cultural events, beach activities, and hunting (Table 27). In addition, Californians spent fewer days participating in each recreation activity than they had in 2002 (Table 27). Results indicating that Californians like to be outdoors echo a national trend toward increased participation in outdoor activities. According to Cordell et al (2008), since 1994 participation in wildlife viewing, bird watching, camping and backpacking have increased. However, the 2002 Public Opinions data paints a different picture, one of declining attendance in outdoor recreation in California. Table 25. Recreation Activity Participation of Respondents During the Past 12 Months.
Number of Days Activity Mean
Days %
Participated n
Walking for fitness or pleasure 72.9 74.2 910 Jogging and running for exercise 60.6 39.8 488 Bicycling on paved surfaces 37.9 36.3 446 Organized team sports such as soccer, football, baseball, softball, basketball 33.4 25.6 314
Skateboarding 32.4 7.4 91 Using play equipment, play structures, tot-lots 30.0 32.8 403 Wildlife viewing, bird watching, viewing natural scenery 26.9 45.9 563
Outdoor photography 25.5 33.3 408 Swimming in a pool 25.0 50.9 624 Driving for pleasure, sightseeing, driving through natural scenery 21.9 59.8 734
Using open turf areas 20.9 33.3 408 Bicycling on unpaved surfaces and trails 20.4 15.9 195 Golf 20.0 12.6 154 Hunting 16.5 3.8 47 Tennis 16.1 12.6 155

32
Table 25. Recreation Activity Participation of Respondents During the Past 12 Months.
Number of Days Activity Mean
Days %
Participated n
Day hiking on trails 15.9 46.9 576 Surfing or boogie boarding, windsurfing 15.2 14.1 173 Beach activities 14.9 59.2 726 Off-highway vehicle use 14.8 12.9 158 Sail boating 14.4 5.9 73 Horseback riding, horse shows and events 12.9 7.8 96 Fishing – freshwater 12.8 21.4 262 Backcountry activities such as mountaineering, rock climbing, and bouldering 11.0 12.1 148
Fishing – saltwater 10.7 10.8 132 Swimming in freshwater lakes, rivers and/or streams 10.4 31.2 383
Target shooting 10.2 11.3 139 RV/trailer camping with hookups 9.1 11.2 137 Motor boating, personal watercraft 8.7 14.8 182 Visiting historic or cultural sites 8.0 54.8 672 Picnicking in picnic areas 7.4 67.0 822 Attending outdoor cultural events 7.1 56.3 691 Camping in developed sites with facilities such as toilets and tables 6.9 39.0 479
Visiting outdoor nature museums, zoos, gardens or arboretums 6.2 58.4 716
Downhill (Alpine) skiing 5.8 7.9 97 Snowboarding 5.5 8.6 105 Snowmobiling 5.1 3.6 44 Paddle sports 4.7 15.0 184 Cross-country skiing 4.6 4.2 51 Backpacking 4.5 10.7 131 Other: 0.0
Activities with dog 110.2 0.5 6 Scuba/Snorkeling 101.0 0.2 2
Gym 100.5 0.2 2 Farmer's market 52.0 0.1 1
Tetherball 50.0 0.1 1 Yoga/Tai Chi 42.3 0.2 3
Badminton 40.0 0.2 2 Family activities 40.0 0.1 1
Racquetball 32.5 0.2 2 Airsofting 30.0 0.1 1
Bocce ball 23.5 0.2 2 Scientific exploration 21.0 0.1 1
Reading 15.0 0.1 1

33
Table 25. Recreation Activity Participation of Respondents During the Past 12 Months.
Number of Days Activity Mean
Days %
Participated n
BBQ 12.0 0.1 1 Horseshoes 12.0 0.1 1
Relaxing 10.0 0.1 1 Painting/art 7.0 0.1 1
Frisbee 6.3 0.2 3 Caving 5.0 0.1 1
Paintball 5.0 0.1 1 Antique shows 3.0 0.1 1
Backcountry horseback riding 3.0 0.1 1 Car events 3.0 0.1 1 Kite flying 3.0 0.1 1 Concerts n/a n/a n/a Dancing n/a n/a n/a Exercise n/a n/a n/a
Ping-pong n/a n/a n/a Rollerblading n/a n/a n/a Shuffleboard n/a n/a n/a
Squash n/a n/a n/a Adult Mail-Back Survey, n is the # of responses (Q2) Table 26. Recreation Activity Participation of Respondents During the Past 12 Months, 2002 vs. 2008.
Percent Participated Activity* 2002 2008 Walking for fitness or pleasure 91.1 74.2 Jogging and running for exercise 35.6 39.8 Bicycling on paved surfaces 45.8 36.3 Skateboarding 9.1 7.4 Using play equipment, play structures, tot-lots 43.5 32.8 Wildlife viewing, bird watching, viewing natural scenery 75.1 45.9
Swimming in a pool 59.5 50.9 Driving for pleasure, sightseeing, driving through natural scenery 90.2 59.8
Using open turf areas 65.5 33.3 Bicycling on unpaved surfaces and trails 24.0 15.9 Golf 23.0 12.6 Hunting 23.0 3.8 Tennis 18.8 12.6 Surfing or boogie boarding, windsurfing 20.4 14.1 Beach activities 82.2 59.2

34
Table 26. Recreation Activity Participation of Respondents During the Past 12 Months, 2002 vs. 2008.
Percent Participated Activity* 2002 2008 Off-highway vehicle use 19.8 12.9 Sail boating 10.4 5.9 Horseback riding, horse shows and events 19.2 7.8 Fishing - freshwater 34.0 21.4 Backcountry activities such as mountaineering, rock climbing, and bouldering 19.4 12.1
Fishing - saltwater 17.8 10.8 Swimming in freshwater lakes, rivers and/or streams 46.7 31.2
Target shooting 16.5 11.3 RV/trailer camping with hookups 19.9 11.2 Motor boating, personal watercraft 42.7 14.8 Visiting historic or cultural sites 85.5 54.8 Picnicking in picnic areas 76.7 67.0 Attending outdoor cultural events 82.6 56.3 Camping in developed sites with facilities such as toilets and tables 49.8 39.0
Visiting outdoor nature museums, zoos, gardens or arboretums 80.1 58.4
Downhill (Alpine) skiing 18.0 7.9 Snowboarding 10.2 8.6 Snowmobiling 4.6 3.6 Paddle sports 23.0 15.0 Cross-country skiing 7.1 4.2 Backpacking 20.1 10.7 * Not all activities were the same in the 2002 and 2008 surveys. Therefore, only those used in both surveys are displayed. (2008 Q2) Table 27. Mean Recreation Activity Participation of Respondents During the Past 12 Months, 2002 vs. 2008.
Mean Number of Participation DaysActivity* 2002 2008 Walking for fitness or pleasure 102.8 72.9 Jogging and running for exercise 65.0 60.6 Bicycling on paved surfaces 42.9 37.9 Skateboarding 35.2 32.4 Using play equipment, play structures, tot-lots 33.4 30.0 Wildlife viewing, bird watching, viewing natural scenery 33.7 26.9
Swimming in a pool 31.1 25.0 Driving for pleasure, sightseeing, driving through natural scenery 34.7 21.9

35
Table 27. Mean Recreation Activity Participation of Respondents During the Past 12 Months, 2002 vs. 2008.
Mean Number of Participation DaysActivity* 2002 2008 Using open turf areas 27.2 20.9 Bicycling on unpaved surfaces and trails 21.3 20.4 Golf 24.1 20.0 Hunting 20.7 16.5 Tennis 19.3 16.1 Surfing or boogie boarding, windsurfing 16.5 15.2 Beach activities 17.0 14.9 Off-highway vehicle use 14.7 14.8 Sail boating 11.2 14.4 Horseback riding, horse shows and events 20.0 12.9 Fishing - freshwater 17.0 12.8 Fishing - saltwater 12.1 10.7 Swimming in freshwater lakes, rivers and/or streams 11.2 10.4
Target shooting 15.7 10.2 RV/trailer camping with hookups 15.4 9.1 Motor boating, personal watercraft 13.9 8.7 Visiting historic or cultural sites 8.3 8.0 Picnicking in picnic areas 11.7 7.4 Attending outdoor cultural events 8.7 7.1 Camping in developed sites with facilities such as toilets and tables 11.2 6.9
Visiting outdoor nature museums, zoos, gardens or arboretums 7.5 6.2
Downhill (Alpine) skiing 6.7 5.8 Snowboarding 6.7 5.5 Snowmobiling 5.0 5.1 Paddle sports 7.7 4.7 Cross-country skiing 4.6 4.6 Backpacking 4.5 4.5 Note: Average number of participation days for the activity’s participants * Not all activities were the same in the 2002 and 2008 surveys. Therefore, only those used in both surveys are displayed. (2008 Q2)

36
As a representation of unmet latent demand, when asked which recreation activities they would like to participate in more often, the majority of Californians chose: 1) Walking for fitness or pleasure; 2) Camping in developed sites with facilities such as toilets and tables; 3) Bicycling on paved surfaces; and 4) Day hiking on trails (Table 28). Table 28. Recreation Activities Respondents Would Like to Participate in More Often.
Would Participate More Often Activity
% Yes n Walking for fitness or pleasure 45.6 559 Camping in developed sites with facilities such as toilets and tables 45.0 552
Bicycling on paved surfaces 44.7 548 Day hiking on trails 44.1 541 Picnicking in picnic areas 41.9 514 Beach activities 41.7 512 Visiting outdoor nature museums, zoos, gardens or arboretums 41.4 508
Visiting historic or cultural sites 39.9 490 Attending outdoor cultural events 39.0 478 Off-highway vehicle use 37.3 458 Driving for pleasure, sightseeing, driving through natural scenery 36.8 451
Swimming in a pool 36.4 447 Wildlife viewing, bird watching, viewing natural scenery 32.4 397
Outdoor photography 28.4 348
Swimming in freshwater lakes, rivers and/or streams 28.2 346
Jogging and running for exercise 27.3 335 Fishing – freshwater 23.1 284 Using open turf areas 22.7 279 Backpacking 20.9 256 Paddle sports 20.4 250 Bicycling on unpaved surfaces and trails 19.7 242 Using play equipment, play structures, tot-lots 18.7 230 Organized team sports such as soccer, football, baseball, softball, basketball 17.8 219
Backcountry activities such as mountaineering, rock climbing, and bouldering 17.7 217
RV/trailer camping with hookups 17.0 209 Surfing or boogie boarding, windsurfing 16.7 205 Fishing – saltwater 16.0 196 Motor boating, personal watercraft 15.9 195

37
Table 28. Recreation Activities Respondents Would Like to Participate in More Often.
Would Participate More Often Activity
% Yes n Target shooting 15.5 190 Horseback riding, horse shows and events 14.3 176 Snowboarding 13.3 163 Tennis 13.1 161 Downhill (Alpine) skiing 13.0 159 Golf 12.8 157 Sail boating 12.6 154 Snowmobiling 12.1 148 Cross-country skiing 8.8 108 Skateboarding 8.1 100 Hunting 7.2 88 Other:
Activities with dog 0.1 1 Scuba/Snorkeling 0.1 1
Gym 0.1 1 Farmer's Market 0.0 0
Tetherball 0.1 1 Yoga/Tai Chi 0.2 2
Badminton 0.4 5 Family Activities 0.0 0
Racquetball 0.2 2 Airsofting 0.1 1
Bocce Ball 0.1 1 Scientific Exploration 0.1 1
Reading 0.0 0 BBQ 0.1 1
Horseshoes 0.2 2 Relaxing 0.0 0
Painting/Art 0.1 1 Frisbee 0.1 1 Caving 0.1 1
Paintball 0.0 0 Antique shows 0.1 1
Backcountry horseback Riding 0.1 1 Car Events 0.1 1 Kite Flying 0.0 0
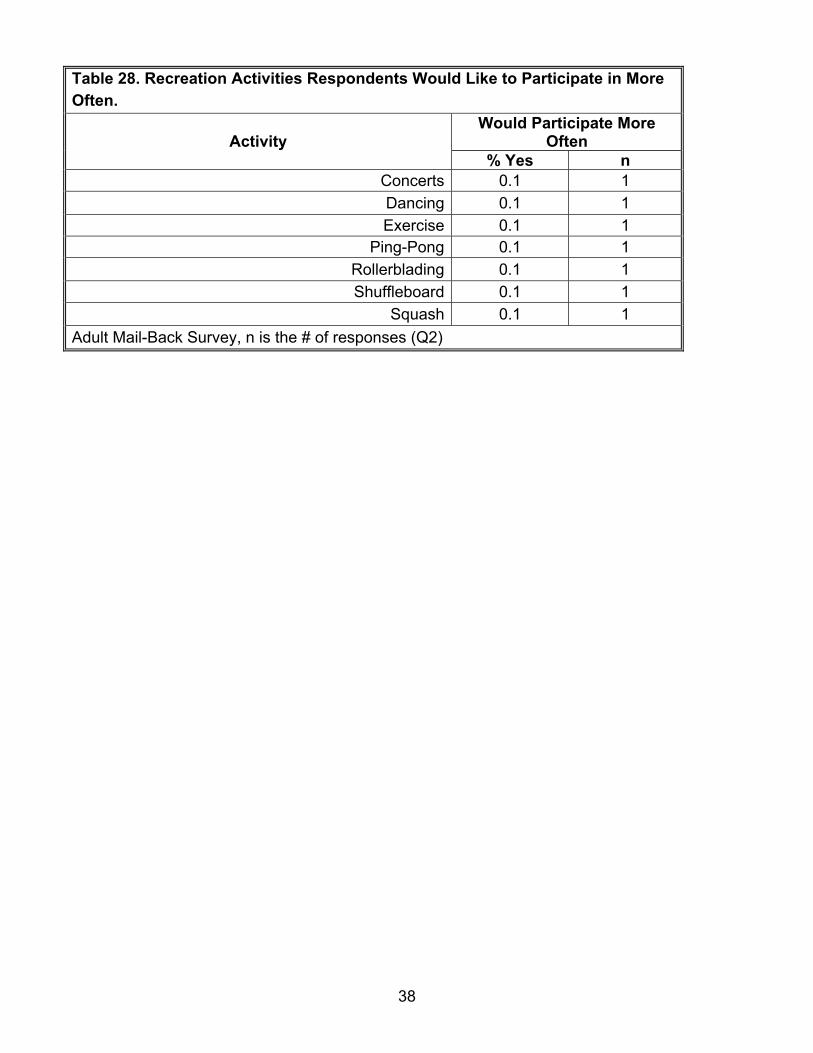
38
Table 28. Recreation Activities Respondents Would Like to Participate in More Often.
Would Participate More Often Activity
% Yes n Concerts 0.1 1 Dancing 0.1 1 Exercise 0.1 1
Ping-Pong 0.1 1 Rollerblading 0.1 1 Shuffleboard 0.1 1
Squash 0.1 1 Adult Mail-Back Survey, n is the # of responses (Q2)

39
Willingness to Pay for Activities Californians were asked to indicate how much they would be willing to pay to participate in their three favorite activities. Responses varied greatly. In general, respondents were willing to pay more for activities that required the use of facilities, equipment/skills, or fuel, such as camping, hunting, fishing, target shooting, horseback riding, sailing, and off-road vehicle use (see Tables 29 through 31 below). Respondents were willing to pay greater fees for overnight facilities and specialized activities. Respondents were less likely to pay for activities that did not require any specialized personal equipment or equipment/facilities provided by parks. For example, more respondents indicated they would not be willing to pay any amount for jogging and exercise (n=31). In this example, however, individuals who use parks for jogging and exercise do use a “facility” in that the park provides established trails. Therefore, individuals may be less willing to pay for a facility if it is not as physically obvious as more developed structures like restrooms. They may also be less willing to pay for an activity that they already perceive as “free.” For example, many respondents indicated that they would not pay to participate in surfing, day hiking, and walking for fitness and pleasure. These activities tend to occur in public spaces where participation costs little to nothing. Table 29. Favorite Activity of Respondents and How Much They Would Pay to Participate.
$0 $1 - $4 $5 - $10 $11 - $15 $16 - $20 Activity % n % n % n % n % n Camping in developed sites with facilities such as toilets and tables (not including backpacking)
5.3 5 7.4 7 18.1 17 22.3 21 46.8 44
Picnicking in picnic areas (with tables, fire pits, or grills)
27.5 14 25.5 13 29.4 15 11.8 6 5.9 3
RV/trailer camping with hookups
0.0 0 0.0 0 0.0 0 12.5 2 87.5 14
Backpacking (overnight hiking) 14.3 2 0.0 0 21.4 3 42.9 6 21.4 3
Backcountry activities such as mountaineering, rock climbing, and bouldering
0.0 0 0.0 0 50.0 1 0.0 0 50.0 1
Walking for fitness or pleasure
70.5 79 17.9 20 8.9 10 2.7 3 0.0 0

40
Table 29. Favorite Activity of Respondents and How Much They Would Pay to Participate.
$0 $1 - $4 $5 - $10 $11 - $15 $16 - $20 Activity % n % n % n % n % n Jogging and running for exercise (on trails, streets, sidewalks, paths)
72.1 31 11.6 5 11.6 5 0.0 0 4.7 2
Day hiking on trails 41.5 22 30.2 16 26.4 14 0.0 0 1.9 1
Skateboarding (skate parks, paths, sidewalks)
28.6 2 42.9 3 28.6 2 0.0 0 0.0 0
Horseback riding, horse shows and events
0.0 0 0.0 0 0.0 0 0.0 0 100.0 2
Bicycling on paved surfaces 50.0 13 23.1 6 23.1 6 3.8 1 0.0 0
Bicycling on unpaved surfaces and trails (mountain biking)
50.0 4 25.0 2 25.0 2 0.0 0 0.0 0
Driving for pleasure, sightseeing, driving through natural scenery
18.2 4 36.4 8 18.2 4 0.0 0 27.3 6
Wildlife viewing, bird watching, viewing natural scenery
40.0 6 40.0 6 6.7 1 0.0 0 13.3 2
Outdoor photography 25.0 4 18.8 3 43.8 7 0.0 0 12.5 2
Downhill (Alpine) skiing 0.0 0 0.0 0 0.0 0 0.0 0 100.0 6
Snowboarding 0.0 0 9.1 1 0.0 0 0.0 0 90.9 10 Snowmobiling 0.0 0 0.0 0 100.0 1 0.0 0 0.0 0 Off-highway vehicle use (motorcycles, 4-wheel drive, all-terrain vehicles)
23.1 3 0.0 0 23.1 3 7.7 1 46.2 6
Swimming in a pool 15.6 5 53.1 17 21.9 7 6.3 2 3.1 1

41
Table 29. Favorite Activity of Respondents and How Much They Would Pay to Participate.
$0 $1 - $4 $5 - $10 $11 - $15 $16 - $20 Activity % n % n % n % n % n Swimming in freshwater lakes, rivers and/or streams
50.0 4 37.5 3 0.0 0 12.5 1 0.0 0
Beach activities (swimming, sunbathing, surf play, wading, playing on beach)
41.2 21 15.7 8 33.3 17 2.0 1 7.8 4
Surfing or boogie boarding, windsurfing
46.7 7 13.3 2 33.3 5 0.0 0 6.7 1
Paddle sports (kayaking, rowing, canoeing, rafting)
0.0 0 25.0 1 50.0 2 0.0 0 25.0 1
Sail boating 0.0 0 0.0 0 0.0 0 0.0 0 100.0 3 Motor boating, personal watercraft (jet skis, wave runners, waterskiing, wakeboarding)
0.0 0 0.0 0 40.0 4 40.0 4 20.0 2
Fishing - freshwater 15.8 3 0.0 0 36.8 7 15.8 3 31.6 6
Fishing - saltwater (includes catching abalone, clams, crabs, etc.)
0.0 0 0.0 0 0.0 0 25.0 1 75.0 3
Hunting (large or small game with a firearm)
33.3 1 0.0 0 0.0 0 0.0 0 66.7 2
Target shooting (including pistol and skeet)
0.0 0 0.0 0 40.0 2 0.0 0 60.0 3
Visiting historic or cultural sites 7.7 1 0.0 0 46.2 6 30.8 4 15.4 2
Visiting outdoor nature museums, zoos, gardens or arboretums
0.0 0 0.0 0 40.0 4 20.0 2 40.0 4

42
Table 29. Favorite Activity of Respondents and How Much They Would Pay to Participate.
$0 $1 - $4 $5 - $10 $11 - $15 $16 - $20 Activity % n % n % n % n % n Attending outdoor cultural events (festivals, fairs, concerts, historical reenactments, outdoor theatre)
0.0 0 3.8 1 19.2 5 11.5 3 65.4 17
Using play equipment, play structures, tot-lots
55.0 11 25.0 5 20.0 4 0.0 0 0.0 0
Using open turf areas (casual and unstructured activities - games, relax, sunning, etc.)
33.3 1 66.7 2 0.0 0 0.0 0 0.0 0
Organized team sports such as soccer, football, baseball, softball, basketball
21.6 11 7.8 4 17.6 9 7.8 4 45.1 23
Golf 0.0 0 4.8 1 0.0 0 9.5 2 85.7 18 Tennis 30.8 4 23.1 3 30.8 4 7.7 1 7.7 1 Total N 258 137 167 68 193 Adult Mail-Back Survey, n is the number of responses (Q3) Table 30. Second Favorite Activities of Respondents and How Much They Would Pay to Participate.
$0 $1 - $4 $5 - $10 $11 - $15 $16 - $20 Activity % n % n % n % n % n Camping in developed sites with facilities such as toilets and tables (not including backpacking)
4.0 2 0.0 0 18.0 9 32.0 16 46.0 23
Picnicking in picnic areas (with tables, fire pits, or grill
18.6 11 35.6 21 35.6 21 8.5 5 1.7 1

43
Table 30. Second Favorite Activities of Respondents and How Much They Would Pay to Participate.
$0 $1 - $4 $5 - $10 $11 - $15 $16 - $20 Activity % n % n % n % n % n RV/trailer camping with hookups
0.0 0 0.0 0 18.2 2 9.1 1 72.7 8
Backpacking (overnight hiking) 20.0 3 6.7 1 13.3 2 26.7 4 33.3 5
Backcountry activities such as mountaineering, rock climbing, and bouldering
57.1 4 0.0 0 0.0 0 0.0 0 42.9 3
Walking for fitness or pleasure
69.6 55 12.7 10 11.4 9 0.0 0 6.3 5
Jogging and running for exercise (on trails, streets, sidewalks, paths)
63.6 21 15.2 5 15.2 5 3.0 1 3.0 1
Day hiking on trails 34.5 20 31.0 18 32.8 19 1.7 1 0.0 0
Skateboarding (skate parks, paths, sidewalks)
22.2 2 44.4 4 22.2 2 0.0 0 11.1 1
Horseback riding, horse shows and events
0.0 0 0.0 0 50.0 1 0.0 0 50.0 1
Bicycling on paved surfaces 60.9 28 19.6 9 17.4 8 0.0 0 2.2 1
Bicycling on unpaved surfaces and trails (mountain biking)
11.1 2 38.9 7 33.3 6 11.1 2 5.6 1
Driving for pleasure, sightseeing, driving through natural scenery
27.0 10 21.6 8 27.0 10 2.7 1 21.6 8
Wildlife viewing, bird watching, viewing natural scenery
31.8 7 22.7 5 36.4 8 4.5 1 4.5 1
Outdoor photography 65.5 19 10.3 3 10.3 3 3.4 1 10.3 3

44
Table 30. Second Favorite Activities of Respondents and How Much They Would Pay to Participate.
$0 $1 - $4 $5 - $10 $11 - $15 $16 - $20 Activity % n % n % n % n % n Downhill (Alpine) skiing 0.0 0 0.0 0 0.0 0 0.0 0 100.0 5
Snowboarding 0.0 0 0.0 0 0.0 0 0.0 0 100.0 9 Cross-country skiing 33.3 1 0.0 0 0.0 0 0.0 0 66.7 2
Off-highway vehicle use (motorcycles, 4-wheel drive, all-terrain vehicles)
0.0 0 0.0 0 22.2 2 22.2 2 55.6 5
Swimming in a pool 41.2 21 39.2 20 15.7 8 3.9 2 0.0 0
Swimming in freshwater lakes, rivers and/or streams
35.0 7 10.0 2 50.0 10 0.0 0 5.0 1
Beach activities (swimming, sunbathing, surf play, wading, playing on beach)
36.1 22 32.8 20 19.7 12 4.9 3 6.6 4
Surfing or boogie boarding, windsurfing
14.3 1 0.0 0 57.1 4 0.0 0 28.6 2
Paddle sports (kayaking, rowing, canoeing, rafting)
0.0 0 11.1 1 33.3 3 33.3 3 22.2 2
Sail boating 25.0 1 0.0 0 0.0 0 25.0 1 50.0 2 Motor boating, personal watercraft (jet skis, wave runners, waterskiing, wakeboarding)
0.0 0 0.0 0 16.7 1 0.0 0 83.3 5
Fishing - freshwater 26.9 7 11.5 3 23.1 6 19.2 5 19.2 5
Fishing - saltwater (includes catching abalone, clams, crabs, etc.)
0.0 0 0.0 0 50.0 2 25.0 1 25.0 1

45
Table 30. Second Favorite Activities of Respondents and How Much They Would Pay to Participate.
$0 $1 - $4 $5 - $10 $11 - $15 $16 - $20 Activity % n % n % n % n % n Hunting (large or small game with a firearm)
0.0 0 0.0 0 20.0 1 0.0 0 80.0 4
Target shooting (including pistol and skeet)
0.0 0 0.0 0 100.0 3 0.0 0 0.0 0
Visiting historic or cultural sites 0.0 0 10.0 2 45.0 9 15.0 3 30.0 6
Visiting outdoor nature museums, zoos, gardens or arboretums
0.0 0 15.0 3 40.0 8 25.0 5 20.0 4
Attending outdoor cultural events (festivals, fairs, concerts, historical reenactments, outdoor theatre)
6.9 2 10.3 3 20.7 6 20.7 6 41.4 12
Using play equipment, play structures, tot-lots
83.3 10 16.7 2 0.0 0 0.0 0 0.0 0
Using open turf areas (casual and unstructured activities - games, relax, sunning, etc.)
60.0 6 20.0 2 20.0 2 0.0 0 0.0 0
Organized team sports such as soccer, football, baseball, softball, basketball
27.8 5 38.9 7 11.1 2 5.6 1 16.7 3
Golf 0.0 0 0.0 0 8.3 1 16.7 2 75.0 9 Tennis 50.0 6 16.7 2 8.3 1 8.3 1 16.7 2 Total N 273 158 186 68 145 Adult Mail-Back Survey, n is the number of responses (Q3)

46
Table 31. Third Favorite Activity of Respondents and How Much They Would Pay to Participate.
$0 $1 - $4 $5 - $10 $11 - $15 $16 - $20 Activity % n % n % n % n % n Camping in developed sites with facilities such as toilets a
0.0 0 8.5 5 25.4 15 8.5 5 57.6 34
Picnicking in picnic areas (with tables, fire pits, or grill
36.0 18 20.0 10 38.0 19 2.0 1 4.0 2
RV/trailer camping with hookups
8.3 1 0.0 0 41.7 5 8.3 1 41.7 5
Backpacking (overnight hiking) 12.5 1 12.5 1 50.0 4 12.5 1 12.5 1
Backcountry activities such as mountaineering, rock climbing
37.5 3 12.5 1 37.5 3 0.0 0 12.5 1
Walking for fitness or pleasure
59.1 26 22.7 10 15.9 7 0.0 0 2.3 1
Jogging and running for exercise (on trails, streets, sidewalks)
80.0 24 13.3 4 6.7 2 0.0 0 0.0 0
Day hiking on trails 37.5 15 35.0 14 25.0 10 2.5 1 0.0 0
Skateboarding (skate parks, paths, sidewalks)
66.7 6 22.2 2 11.1 1 0.0 0 0.0 0
Horseback riding, horse shows and events
20.0 1 0.0 0 20.0 1 20.0 1 40.0 2
Bicycling on paved surfaces 63.0 17 11.1 3 14.8 4 11.1 3 0.0 0
Bicycling on unpaved surfaces and trails (mountain biking)
45.5 5 0.0 0 27.3 3 0.0 0 27.3 3

47
Table 31. Third Favorite Activity of Respondents and How Much They Would Pay to Participate.
$0 $1 - $4 $5 - $10 $11 - $15 $16 - $20 Activity % n % n % n % n % n Driving for pleasure, sightseeing, driving through natural s
28.6 12 21.4 9 33.3 14 0.0 0 16.7 7
Wildlife viewing, bird watching, viewing natural scenery
32.0 8 20.0 5 32.0 8 8.0 2 8.0 2
Outdoor photography 37.1 13 20.0 7 17.1 6 11.4 4 14.3 5
Downhill (Alpine) skiing 0.0 0 0.0 0 0.0 0 0.0 0 100.
0 6
Snowboarding 0.0 0 5.3 1 10.5 2 5.3 1 78.9 15 Cross-country skiing 0.0 0 0.0 0 25.0 1 50.0 2 25.0 1
Off-highway vehicle use (motorcycles, 4-wheel drive, all-terrain vehicles)
0.0 0 0.0 0 71.4 5 0.0 0 28.6 2
Swimming in a pool 37.5 18 45.8 22 14.6 7 2.1 1 0.0 0
Swimming in freshwater lakes, rivers and/or streams
44.4 4 44.4 4 11.1 1 0.0 0 0.0 0
Beach activities (swimming, sunbathing, surf play, wading, p
35.1 20 17.5 10 33.3 19 5.3 3 8.8 5
Surfing or boogie boarding, windsurfing
0.0 0 40.0 2 40.0 2 0.0 0 20.0 1
Paddle sports (kayaking, rowing, canoeing, rafting
16.7 1 33.3 2 0.0 0 33.3 2 16.7 1
Sail boating 0.0 0 0.0 0 25.0 1 0.0 0 75.0 3 Motor boating, personal watercraft (jet skis, wave runners,
12.5 1 0.0 0 50.0 4 25.0 2 12.5 1

48
Table 31. Third Favorite Activity of Respondents and How Much They Would Pay to Participate.
$0 $1 - $4 $5 - $10 $11 - $15 $16 - $20 Activity % n % n % n % n % n Fishing - freshwater 5.3 1 36.8 7 31.6 6 10.5 2 15.8 3
Fishing - saltwater (includes catching abalone, clams, crabs
33.3 4 0.0 0 33.3 4 0.0 0 33.3 4
Target shooting (including pistol and skeet)
0.0 0 9.1 1 63.6 7 18.2 2 9.1 1
Visiting historic or cultural sites 8.9 4 15.6 7 48.9 22 15.6 7 11.1 5
Visiting outdoor nature museums, zoos, gardens or arboretums
9.7 3 16.1 5 48.4 15 9.7 3 16.1 5
Attending outdoor cultural events (festivals, fairs, concerts, historical reenactments)
2.5 1 10.0 4 30.0 12 17.5 7 40.0 16
Using play equipment, play structures, tot-lots
66.7 10 33.3 5 0.0 0 0.0 0 0.0 0
Using open turf areas (casual and unstructured activities - games, relax, sunning, etc.)
40.0 8 25.0 5 25.0 5 10.0 2 0.0 0
Organized team sports such as soccer, football, baseball, softball, basketball
17.4 4 8.7 2 30.4 7 0.0 0 43.5 10
Golf 6.7 1 0.0 0 13.3 2 13.3 2 66.7 10 Tennis 23.1 3 30.8 4 30.8 4 0.0 0 15.4 2 Total N 233 152 228 55 154 Adult Mail-Back Survey, n is the number of responses (Q3)
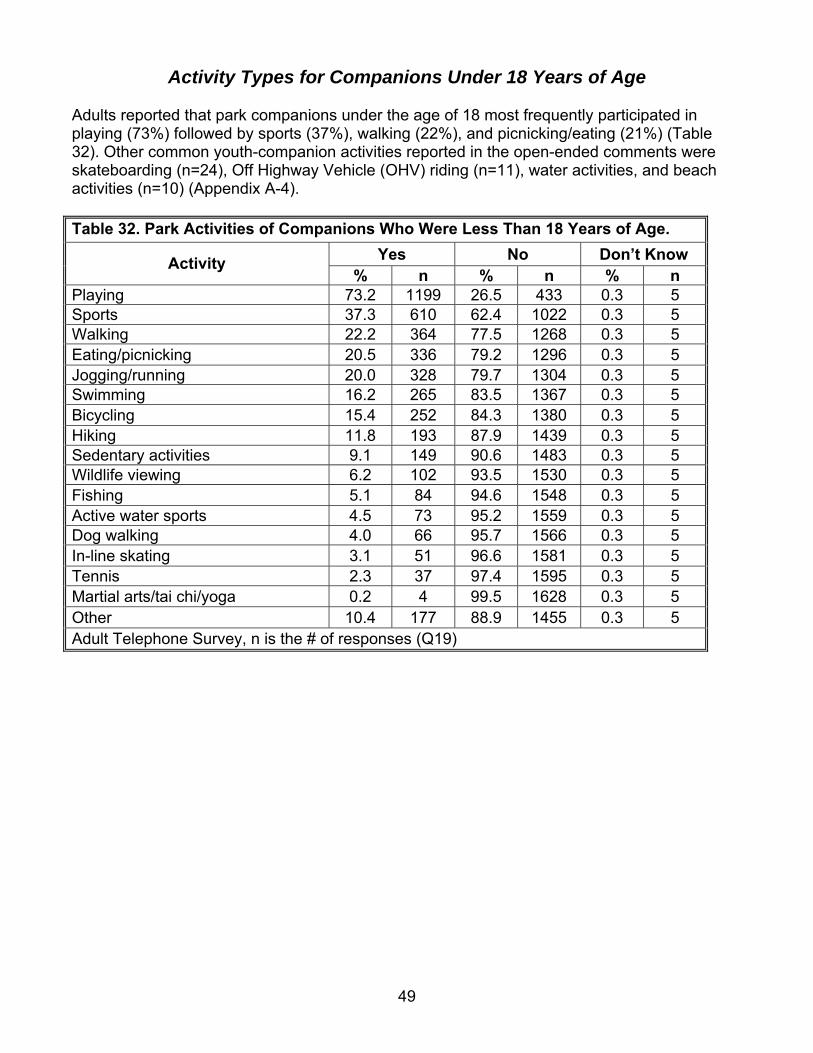
49
Activity Types for Companions Under 18 Years of Age Adults reported that park companions under the age of 18 most frequently participated in playing (73%) followed by sports (37%), walking (22%), and picnicking/eating (21%) (Table 32). Other common youth-companion activities reported in the open-ended comments were skateboarding (n=24), Off Highway Vehicle (OHV) riding (n=11), water activities, and beach activities (n=10) (Appendix A-4). Table 32. Park Activities of Companions Who Were Less Than 18 Years of Age.
Yes No Don’t Know Activity % n % n % n
Playing 73.2 1199 26.5 433 0.3 5 Sports 37.3 610 62.4 1022 0.3 5 Walking 22.2 364 77.5 1268 0.3 5 Eating/picnicking 20.5 336 79.2 1296 0.3 5 Jogging/running 20.0 328 79.7 1304 0.3 5 Swimming 16.2 265 83.5 1367 0.3 5 Bicycling 15.4 252 84.3 1380 0.3 5 Hiking 11.8 193 87.9 1439 0.3 5 Sedentary activities 9.1 149 90.6 1483 0.3 5 Wildlife viewing 6.2 102 93.5 1530 0.3 5 Fishing 5.1 84 94.6 1548 0.3 5 Active water sports 4.5 73 95.2 1559 0.3 5 Dog walking 4.0 66 95.7 1566 0.3 5 In-line skating 3.1 51 96.6 1581 0.3 5 Tennis 2.3 37 97.4 1595 0.3 5 Martial arts/tai chi/yoga 0.2 4 99.5 1628 0.3 5 Other 10.4 177 88.9 1455 0.3 5 Adult Telephone Survey, n is the # of responses (Q19)

50

51
Facilities and Amenities In summary, facilities and services are important to Californians! Overall, Californians were satisfied with the facilities and services currently available and perceived their overall condition to be the same or better than they were five years ago. However, for a significant portion of Californians, poor maintenance is a barrier to outdoor recreation. Respondents commonly used community buildings, open spaces, picnic tables/pavilions, and paved and unpaved trails at public park and recreation areas. Most Californians rated these facilities as important along with wilderness type areas and environmental and outdoor education programs.
Facilities and Amenities Utilized During Adult's Last Park Visit When asked about the types of facilities and amenities used during their last park visit, respondents most commonly used community/facility buildings (64%), open spaces to play (59%), picnic tables/pavilions (58%), unpaved multipurpose trails (53%), and paved trails (50%) (Table 33). Fewer than 20% of respondents reported using amusement areas (19%), tennis or basketball courts (19%), dog park areas (16%), botanical gardens (15%), and skate parks (6%). The most common facilities or amenities reported in open-ended comments were campgrounds (n=15), food concessions (n=14), water fountains (n=11), and exercise trails and structures (n=9) (Appendix A-5). Table 33. Facilities or Amenities Used During Their Last Park Visit.
Yes No Don’t Know Facility/Amenity % n % n % n
Community facility/building 64.1 1778 35.3 978 0.6 17 Open space to play 59.2 1641 40.5 1122 0.4 10 Picnic table, picnic pavilion 57.6 1598 41.9 1163 0.4 12 Unpaved multipurpose trail 52.9 1466 46.7 1294 0.5 13 Paved trail 49.8 1380 49.7 1379 0.5 14 Scenic observation/wildlife viewing area 43.7 1211 55.6 1541 0.8 21
Beach or water recreation area 39.7 1102 59.8 1657 0.5 14 Playground 39.3 1091 60.1 1666 0.6 16 Organized sports fields 20.7 575 78.6 2180 0.6 18 Amusement area 19.5 541 79.9 2217 0.5 15 Tennis or basketball courts 19.4 538 80 2218 0.6 17 Dog park area 15.7 434 83.6 2318 0.8 21 Botanical garden 14.5 401 84.7 2349 0.8 23 Swimming Pool 6.4 177 93.1 2581 0.5 15 Skate park 6.3 175 93.3 2587 0.4 11 Other 6.3 176 93.3 2586 0.0 0 Adult Telephone Survey, n is the # of responses (Q13)

52
Outdoor Recreation Facilities and Services When asked about park and recreation facilities and services, adults rated the following as the most important: 1) Play activity areas for tots and young children; 2) Wilderness type areas where no vehicles or development are allowed; 3)Areas and facilities for environmental and outdoor education programs; 4) Multi-use turf areas for field sports such as softball, baseball, soccer, and/or football; 5) Picnic sites for large groups; 6) Trails for multiple, non-motorized activities such as hiking, mountain biking or horseback riding; and 7) Hard surface trails for biking, jogging, and fitness walking (Table 38). Facilities with the relatively lowest average scores were: 1) Areas for the legal use of off-highway vehicles such as motorcycles, dune buggies, 4-wheel drive vehicles, or all-terrain vehicles; and 2) Public hunting areas especially managed for waterfowl like ducks and geese. Table 34. Importance of California Park and Recreation Facilities and Services.
Importance1 Facility/Service Mean2 Mode n Play activity areas for tots and young children 4 5 1222 Wilderness type areas where no vehicles or development are allowed 4 5 1221
Areas and facilities for environmental and outdoor education programs 4 5 1221
Multi-use turf areas for field sports such as softball, baseball, soccer, and/or football 4 5 1220
Picnic sites for large groups 4 4 1221 Trails for multiple, non-motorized activities such as hiking, mountain biking or horseback riding 4 5 1220
Hard surface trails for biking, jogging, and fitness walking 4 5 1221 Courts for activities such as tennis, basketball, and volleyball 4 5 1221
Trails solely for a single activity such as hiking, mountain biking, or horseback riding 4 5 1219
Recreation facilities at lakes, rivers and reservoirs 4 5 1221 Facilities in the local community that can be used for day youth camps 4 4 1216
Community swimming pools 4 4 1219 Multi-purpose buildings with rooms that can be used for community meetings and facilities for cultural events, senior or teen programs
4 5 1222
Developed fishing areas with piers and/or fish cleaning stations 4 4 1220
Facilities in the local community for overnight camping 3 3 1220 Community skateboard parks 3 3 1219 Launch ramps, marinas, and other boating facilities 3 3 1220 Sheltered lodging facilities such as rustic cabins, yurts, and tent cabins 3 3 1218
Off-leash dog parks 3 3 1219 RV campgrounds with electrical and water hookups, sewer dump stations, or pull-through sites 3 3 1221
Commercial visitor services within public parks and 3 3 1220

53
Table 34. Importance of California Park and Recreation Facilities and Services. Importance1 Facility/Service Mean2 Mode n
outdoor recreation areas such as hotels, motels, restaurants, or shops Areas for the legal use of off-highway vehicles such as motorcycles, ‘dune buggies, 4-wheel drive vehicles, or all-terrain vehicles
3 3 1220
Public hunting areas especially managed for waterfowl like ducks and geese 3 1 1219 1 Rated on a scale from 1 = not at all important to 5 = very important. 2 Rounded to the nearest whole number. Adult Mail-Back Survey, n is the # of responses (Q1) Adult respondents were asked several questions about various park facilities and services. Overall, the majority of respondents were satisfied with the public outdoor recreation areas, facilities, and services currently available (Table 34). In fact, less than 3% reported any dissatisfaction with park facilities and services. Overall, satisfaction with outdoor recreation areas, facilities and services showed little change in 2008 when compared to prior years (Table 35). However, the percentage of Californians who said that areas, facilities, and services were not as good as they were five years ago slightly increased in 2008 when compared with 2002, while those who said they were about the same decreased. Thus, most Californians believe that conditions of parks and recreation areas, facilities and services worsened slightly between 2002 and 2008. This finding coincides with results shown earlier (Table 22) that indicate that a significant portion of respondents feel that the condition of facilities is a major barrier to use of recreation facilities and participation in outdoor activities. Table 35. Respondent Satisfaction with Public Outdoor Recreation Areas, Facilities, and Services Currently Available.
Level of Satisfaction % n Not at all satisfied 2.7 76 Somewhat satisfied 23.6 656 Satisfied 46.5 1292 Very satisfied 25.6 713 Don't know 1.5 42 Refused 0.0 1
Mean1 3.0 1 Rated on a scale from 1 = not at all satisfied , 2 = somewhat satisfied, 3 = satisfied, and 4 = very satisfied Adult Telephone Survey, n is the # of responses (Q9)

54
Table 36. Percent Respondent Satisfaction with Public Outdoor Recreation Areas, Facilities and Services Currently Available, 1987 to 2008.
Level of Satisfaction 1987 %
1992 %
1997 %
2002 %
2008 %
Not at all satisfied 3.1 5.0 3.4 4.6 2.7 Unsatisfied 6.4 9.8 7.5 Neutral 27.7 34.8 29.2 Somewhat satisfied 23.7 23.6 Satisfied 34.0 28.2 32.7 51.3 46.5 Very satisfied 28.7 21.4 27.3 20.4 25.6 NOTE: Outdoor recreation within and outside local communities was split into two separate questions for the 2002 survey. Therefore, data displayed in this table for 2002 are averages of both responses to yield overall satisfaction for comparison purposes. In addition, the scale was modified in 2002 and 2008 by adding “somewhat satisfied” and dropping the “neutral” and “unsatisfied” response categories. Therefore, comparisons of the 2002 and 2008 data with prior years must be made with caution. (Q9) Concerning just 2008 opinions on the condition and operation of public outdoor recreation areas and facilities, the majority (38.4%) of adults living in California for at least 5 years thought their condition to be the same as five years ago (Table 36). However, 34% thought their condition had improved. Compared to previous years, perceptions of the overall condition and operation of public outdoor recreation areas and facilities varied slightly (Table 37). In 1987, the majority thought the overall condition was better than 5 years prior. However, by 1992, the majority thought conditions had worsened and were not as good as they were in 1987. From 1997 onward, respondents indicated that conditions were remaining the same.
Table 37. Respondents’ Perception of Overall Condition and Operation of Public Outdoor Recreation Areas and Facilities.
Condition % n Better than 5 years ago 34.0 885 The same as 5 years ago 38.4 1001 Not as good as they were 5 years ago 18.6 484 Don't know 9.0 234 Refused 0.1 2 Adult Telephone Survey, n is the # of responses (Q10)

55
Table 38. Percent of Respondents’ Perception of Overall Condition and Operation of Public Outdoor Recreation Areas and Facilities, 1987 to 2008.
Condition 1987 %
1992 %
1997 %
2002 %
2008 %
Better than 5 years ago 37.8 28.7 34.6 34.7 34.0 The same as 5 years ago 36.2 32.1 35.9 48.1 38.4 Not as good as they were 5 years ago
18.2 32.9 25.8 17.3 18.6
Not here 5 years ago 7.7 6.4 3.7 * * * The 2002 and 2008 survey respondents were asked how many years they had lived in their local communities. Those who said they had lived in their local communities less than 5 years were not asked their opinions on this issue. NOTE: In 1987, 1992, 1997, and 2008 this item was asked as a single question. For the 2002 study, this item was split into conditions of outdoor recreation (1) within local communities, and (2) outside local communities. Therefore, data displayed in this table for 2002 are averages of both responses to yield overall satisfaction for comparison purposes. Adult Telephone Survey, (Q10)

56

57
Adult Attitudes and Beliefs Regarding Outdoor Recreation Californians want parks, people, and facilities to be protected! The majority of Californians believe law enforcement in parks is important and fees generated at parks should be used to maintain them. They think more emphasis should be placed on cleaning up pollution, protecting resources, and improving or maintaining current facilities. Although Californians want park agencies to manage and police their own facilities and resources, they do favor private businesses providing rental equipment, food concessions, sponsorships, and park facilities and maintenance. They also believe parks and recreation agencies should take substantial action on global climate change.
Adult Opinions on State and Federal Agency Emphasis The quality of the environment is very important to outdoor recreationists in California. Respondents were asked to rate the level of emphasis that should be placed on a variety of park and recreation facilities, programs, and services (39). The majority of adult Californians suggested most emphasis should be placed on: 1) Cleaning up pollution of the ocean, lakes, rivers and streams in park and recreation areas; 2) Maintaining or caring for park and recreation areas; 3) Protecting natural resources; 4) Protecting historic resources; and 5) Remodeling and improving existing facilities. Providing more organized activities/special events and building new facilities were perceived as needing about the same emphasis they were currently receiving. Compared to 2002, the amount of emphasis Californians thought should be placed on certain ideas remained relatively the same with a few exceptions. In 2008, a greater percentage of respondents thought that more emphasis was needed in maintaining or caring for park and recreation areas and fewer thought that acquiring more parkland, providing educational programs, and building more facilities should receive more emphasis (Table 40).
Table 39. Emphasis of State and Federal Government Outdoor Recreation Agencies in California Should Place on Aspects of Outdoor Recreation.
Less
Emphasis
About the Same
Emphasis
More
Emphasis
Don't Know/ Unsure
Aspect of Outdoor Recreation
% n % n % n % n Cleaning up pollution of the ocean, lakes, rivers and streams in park and recreation areas
2.1 26 14.1 171 77.8 945 6.0 73
Maintaining or caring for park and recreation areas 1.5 18 21.8 265 71.9 874 4.9 59
Protecting natural resources 2.5 31 20.5 250 71.5 870 5.4 66 Protecting historic resources 2.9 35 25.2 307 66.6 810 5.3 65 Remodeling and improving existing facilities 2.5 31 25.1 305 65.2 793 7.2 87
Buying additional parkland and open space for recreation purposes
6.4 78 33.0 401 50.2 610 10.4 127

58
Table 39. Emphasis of State and Federal Government Outdoor Recreation Agencies in California Should Place on Aspects of Outdoor Recreation.
Less
Emphasis
About the Same
Emphasis
More
Emphasis
Don't Know/ Unsure
Aspect of Outdoor Recreation
% n % n % n % n Providing educational programs 5.3 64 38.5 468 49.3 599 6.9 84
Providing more organized activities and special events 10.5 127 44.1 536 36.0 438 9.4 114
Building new facilities 10.6 128 45.8 556 34.0 412 9.6 117 Adult Mail-Back Survey, n is the # of responses (Q8) Table 40. Amount of Emphasis Respondents Think that State and Federal Government Outdoor Recreation Agencies in California Should Place on Certain Ideas, 2002 vs. 2008.
Less
Emphasis
About the Same
Emphasis
More
Emphasis Idea
2002 2008 2002 2008 2002 2008 Cleaning up pollution of the ocean, lakes, rivers and streams in park and recreation areas n/a 2.1 n/a 14.1 n/a 77.8 Maintaining or caring for park and recreation areas 2.2 1.5 40.4 21.8 57.4 71.9 Protecting natural resources 3.7 2.5 26.5 20.5 69.8 71.5 Protecting historic resources 3.0 2.9 31.3 25.2 65.7 66.6 Remodeling and improving existing facilities 4.4 2.5 32.6 25.1 63.0 65.2 Buying additional parkland and open space for recreation purposes 7.4 6.4 34.8 33.0 57.7 50.2 Providing educational programs 5.5 5.3 27.8 38.5 66.7 49.3 Providing more organized activities and special events 7.2 10.5 37.3 44.1 55.6 36.0 Building new facilities 9.4 10.6 33.8 45.8 56.8 34.0 Adult Mail-Back Survey, n is the # of responses (Q8)

59
Adult Opinions on Outdoor Recreation in California
Californians were asked a variety of questions assessing their opinions about outdoor recreation. When asked about the importance of a variety of items influencing the choice of their favorite activities, they rated the following as the most important: 1) to have fun; 2) to be with family and friends; 3) to relax; and 4) to view the scenic beauty (Tables 41 and 42). As found in the 2002 study, meeting new people was the least important factor influencing participation in their favorite activity. Californians clearly recognize the benefits of participation in outdoor recreation and value traditional experiences that lead to social, emotional, physical, and health benefits. Table 41. Importance of Items to Respondents’ Favorite Activities.
Not at all Important 2 3 4 Very
Important Statement % n % n % n % n % n
To have fun 0.6 7 1.1 13 8.8 107 24.4 297 65.1 791 To be with family and friends 5.6 68 3.8 46 11.4 139 18.6 226 60.7 739
To relax 1.3 16 2 24 10.1 123 27.6 336 59.0 718 To view the scenic beauty 2.6 32 3 36 12.3 149 27 328 55.1 669
To keep fit and healthy 2.4 29 3.5 42 19.8 241 27.8 338 46.5 565 To experience a change from daily routines 4.3 52 3.1 38 16.7 203 30 365 45.8 557
To get away from crowded situations 4.6 56 4.2 51 17.5 212 28.5 346 45.2 549
To feel safe and secure 6.9 83 6.5 79 20.6 250 22 267 43.9 532 To do something your children or grandchildren enjoy
23.9 289 6 73 15 181 13.5 163 41.7 504
To feel harmony with nature 7.3 89 8 97 20.9 253 24.5 297 39.3 477
To be with others who enjoy the same things you do
8 97 6.8 82 19.7 239 27.4 332 38.2 463
To experience challenge and excitement 8.3 101 10.1 122 23.5 284 27.8 337 30.3 367
To achieve spiritual fulfillment 18 217 14.2 171 24.2 292 17.5 211 26.2 317
To learn something new 11.4 138 11 133 23.5 285 28.8 349 25.4 308 To meet new people 23.2 280 19.4 234 28.6 346 15.9 192 13.0 157 Adult Mail-Back Survey, n is the # of responses (Q5)

60
Table 42. Importance of Items to Respondents’ Favorite Activities.
Importance1 Items
Mean2 Mode n To have fun 5 5 1215 To relax 4 5 1217 To view the scenic beauty 4 5 1214 To be with family and friends 4 5 1218 To keep fit and healthy 4 5 1215 To experience a change from daily routines 4 5 1215 To get away from crowded situations 4 5 1214 To feel safe and secure 4 5 1211 To be with others who enjoy the same things you do 4 5 1213 To feel harmony with nature 4 5 1213 To experience challenge and excitement 4 5 1211 To learn something new 4 4 1213 To do something your children or grandchildren enjoy 3 5 1210 To achieve spiritual fulfillment 3 5 1208 To meet new people 3 3 1209 1 Rated on a scale from 1 = not at all important to 5 = very important. 2 Rounded to the nearest whole number
Adult Mail-Back Survey, n is the # of responses (Q5) Californians were also asked to indicate their level of agreement with statements concerning outdoor recreation lands and facilities in California. The majority either “agreed” or “strongly agreed” with the following statements: 1) Recreation facilities, such as picnic or camping sites, are needed at lakes and reservoirs (70%); and 2) Recreation areas for camping or overnight use are needed (55%) (Tables 43 and 44). Statements that received the highest levels of agreement were: 1) Recreation programs help improve people’s health (52% strongly agree); 2) Fees collected at each park, wildlife and recreation area should be spent on that area (52% strongly agree); and 3) Rules and regulations in parks and outdoor recreation areas should be enforced (83% either agree or strongly agree).

61
Table 43. Respondents’ Level of Agreement with Statements Concerning Outdoor Recreation Lands and Facilities in California.
Strongly Disagree Disagree
Neither Disagree or Agree
Agree Strongly Agree Statement
% n % n % n % n % n Recreation programs help improve people’s health
0.7 8 0.9 11 11.0 134 35.9 438 51.6 629
Fees collected at each park, wildlife and recreation area should be spent on that area
1.3 16 3.6 44 13.6 166 29.9 365 51.6 630
Rules and regulations in parks and outdoor recreation areas should be enforced
0.7 9 1.9 23 13.9 170 34.5 422 48.9 598
Recreation programs help reduce crime and juvenile delinquency
1.2 15 3.4 42 17.3 211 36.1 441 42.0 513
The availability of parks, and recreation areas and facilities attract tourists to California
1.4 17 2.0 24 16.2 198 39.1 477 41.4 505
Recreation and park agencies create jobs and help the economy
1.2 15 2.6 32 21.2 259 37.4 457 37.5 458
Recreation areas and facilities increase property values
1.6 20 3.3 40 25.8 315 36.3 443 33.0 403
Open space lands are needed where I live
2.0 24 6.7 82 21.2 258 37.7 460 32.4 395
Recreation facilities, such as picnic or camping sites, are needed at lakes and reservoirs
2.4 29 4.9 60 23.1 281 41.8 509 27.8 339
Recreation areas for camping or overnight use are needed
4.8 58 11.9 145 28.9 347 34.4 420 20.5 250
Private businesses should provide some of the outdoor recreation services at government owned facilities
7.3 89 10.4 127 39.3 480 26.5 323 16.5 202
Adult Mail-Back Survey, n is the # of responses (Q6)

62
Table 44. Respondents’ Level of Agreement with Statements Concerning Outdoor Recreation Lands and Facilities in California.
Level of Agreement1 Statement Mean Mode n Recreation programs help improve people’s health 4.4 5 1220 Rules and regulations in parks and outdoor recreation areas should be enforced 4.3 5 1222
Fees collected at each park, wildlife and recreation area should be spent on that area 4.3 5 1221
The availability of parks, and recreation areas and facilities attract tourists to California 4.2 5 1221
Recreation programs help reduce crime and juvenile delinquency 4.1 5 1222
Recreation and park agencies create jobs and help the economy 4.1 5 1221
Recreation areas and facilities increase property values 4.0 4 1221 Open space lands are needed where I live 3.9 4 1219 Recreation facilities, such as picnic or camping sites, are needed at lakes and reservoirs 3.9 4 1218
Recreation areas for camping or overnight use are needed 3.5 4 1220
Private businesses should provide some of the outdoor recreation services at government owned facilities 3.3 3 1221 1 Rated on a scale where 1 = strongly disagree, 2 = disagree, 3 = neither agree nor disagree, 4 = agree, 5 = strongly agree. Adult Mail-Back Survey, n is the # of responses (Q6)

63
Adult Respondent Preferences for Privatization
Activities and Services in Public Parks When asked which activities or services were appropriate for a private firm to provide in a public park and recreation area, most adults supported: 1) Rental of recreational equipment such as boats, camping equipment; 2) Food services such as the sale of ready-to-eat food and beverages; 3) Sponsorship of contests, races, and special events; 4) General maintenance of facilities and grounds; and 5) operation of campgrounds, other lodging, marinas and boat launching facilities (Table 45). A growing acceptance of private services in public parks may indicate that respondents may feel private businesses are more prepared with more resources available to provide these services (Table 46).
Table 45. Activities or Services Respondents Think are Appropriate for a Private Firm to Provide in Public Park and Recreation Areas.
Yes No Uncertain Activity/Service % n % n % n Rental of recreational equipment such as boats, camping equipment
75.3 915 11.9 144 12.8 156
Food services such as the sale of ready-to-eat food and beverages
73.0 889 11.9 145 15.0 183
Sponsorship of contests, races, and special events
72.5 882 12.4 151 15.1 184
General maintenance of facilities and grounds 57.6 701 29.5 359 13.0 158 Operation and maintenance of campgrounds or other lodging facilities
55.5 676 29.1 354 15.4 187
Operation of marinas and boat launching facilities
51.2 624 26.5 323 22.2 271
Guided nature walks, educational activities 48.9 596 34.9 426 16.2 197 Patrol and law enforcement duties 43.2 526 44.3 540 12.6 153 Total operation and management of the park or recreation area
27.9 339 55.2 672 16.9 206
Adult Mail-Back Survey, n is the # of responses (Q7)
Table 46. Activities or Services Respondents Think are Appropriate for a Private Firm to Provide in Public Park and Recreation Areas, 2002 vs. 2008.
Yes % No % Uncertain % Activity/Service 2002 2008 2002 2008 2002 2008 Rental of recreational equipment such as boats, camping equipment
68.2 75.3 19.7 11.9 12.1 12.8
Food services such as the sale of ready-to-eat food and beverages
72.0 73.0 14.3 11.9 0.2 15.0
Sponsorship of contests, races, and special events
61.5 72.5 21.1 12.4 17.4 15.1
General maintenance of facilities and grounds
44.4 57.6 42.3 29.5 13.3 13.0
Operation and maintenance of campgrounds or other lodging facilities
42.8 55.5 43.3 29.1 13.8 15.4

64
Table 46. Activities or Services Respondents Think are Appropriate for a Private Firm to Provide in Public Park and Recreation Areas, 2002 vs. 2008.
Yes % No % Uncertain % Activity/Service 2002 2008 2002 2008 2002 2008 Operation of marinas and boat launching facilities
50.3 51.2 29.6 26.5 20.0 22.2
Guided nature walks, educational activities 30.2 48.9 55.5 34.9 14.8 16.2 Patrol and law enforcement duties 30.3 43.2 59.6 44.3 10.1 12.6 Total operation and management of the park or recreation area
16.5 27.9 70.9 55.2 12.6 16.9
Adult Mail-Back Survey, n is the # of responses (Q7)

65
California Adults’ Opinions on Park Agencies’ Role in Addressing Climate Change
Californians were asked to indicate their level of agreement with statements regarding management actions that park agencies could adopt to assist with mitigation and adaptation to climate change. Management actions included: 1) reduce climate-changing gases; 2) anticipate the effects of climate change; 3) educate Californians; and 4) do nothing. Californians were in agreement with all actions except “do nothing” where 54% strongly agreed that this was not a solution (Tables 47 and 48) (Charts 6-9). In open-ended comments, Californians said that information and education (n=16), increased recycling efforts and the use of green products (n=16), and more public transportation or forms of transportation that use alternative energy (n=13) should be considered by California park agencies in their efforts to reduce and adapt to climate change and global warming (Table 49) (Appendix A-6). Table 47. Respondents’ Level of Agreement with Statements Concerning California Park Agencies’ Efforts to Reduce and Adapt to Climate Change and Global Warming.
Level of Agreement1 Statement Mean n Reduce climate-changing gases: Park agencies should develop energy efficient facilities, create paths and bike trails that provide alternatives to motorized travel, and plant trees to offset carbon output from pollution.
4.2 1213
Anticipate the effects of climate change: Park agencies should identify hazards (i.e., buildings close to unstable shorelines that could result from rising seas); manage parks to help protect wild animals and plants affected by global climate change.
4.0 1212
Educate Californians: Park agencies should educate park visitors about global climate change and ways in which people can reduce the effects of global climate change in California (i.e., through education programs at parks, interpretive materials, setting examples in park operations).
3.8 1212
Do nothing: Park agencies should not be involved with efforts to reduce or adapt to climate change and global warming. 2.1 1211
1 Rated on a scale where 1 = strongly disagree, 2 = disagree, 3 = neither agree nor disagree, 4 = agree, 5 = strongly agree. Adult Mail-Back Survey, n is the # of responses (Q10)

66
Table 48. Respondents’ Level of Agreement with Statements Concerning California Park Agencies’ Efforts to Reduce and Adapt to Climate Change and Global Warming.
Strongly Disagree Disagree
Neither Disagree or Agree
Agree Strongly Agree
Don’t Know Statement
% n % n % n % n % n % n Reduce climate-changing gases: Park agencies should develop energy efficient facilities, create paths and bike trails that provide alternatives to motorized travel, and plant trees to offset carbon output from pollution.
5.4 65 3.1 37 11.3 137 29.3 355 48.4 587 2.6 31
Anticipate the effects of climate change: Park agencies should identify hazards (i.e., buildings close to unstable shorelines that could result from rising seas); manage parks to help protect wild animals and plants affected by global climate change.
6.2 75 4.7 57 15.8 191 30.6 371 39.8 482 3.0 36

67
Table 48. Respondents’ Level of Agreement with Statements Concerning California Park Agencies’ Efforts to Reduce and Adapt to Climate Change and Global Warming.
Strongly Disagree Disagree
Neither Disagree or Agree
Agree Strongly Agree
Don’t Know Statement
% n % n % n % n % n % n Educate Californians: Park agencies should educate park visitors about global climate change and ways in which people can reduce the effects of global climate change in California (i.e., through education programs at parks, interpretive materials, setting examples in park operations).
9.2 111 5.9 71 19.0 230 29.5 358 35.0 424 1.6 19
Do nothing: Park agencies should not be involved with efforts to reduce or adapt to climate change and global warming.
53.4 647 17.7 214 12.3 149 5.7 69 8.1 98 2.8 34
Adult Mail-Back Survey, n is the # of responses (Q10)

68
2.6% 5.4%
3.1% 11.3%
29.3%48.4%
0 10 20 30 40 50 60
Don’t KnowStrongly Disagree
Disagree
Neither Disagree or Agree Agree
Strongly Agree
Chart 7. Respondent Agreement with Park Agencies’ Role in Anticipating the Effects of Climate Change (Q10)
3.0% 6.2%
4.7%
39.8%30.6%
15.8%
0 10 20 30 40 50
Don’t Know Strongly Disagree
Disagree
Neither Disagree or Agree Agree
Strongly Agree
Chart 8. Respondent Agreement with Park Agencies’ Role in Educating Californians (Q10)
1.6%
9.2%
5.9%
9.0%
29.5%
35.0%
0 5 10 15 20 25 30 35 40
Don’t Know
Strongly Disagree
Disagree
Neither Disagree or Agree
Agree
Strongly Agree
Chart 6. Respondent Agreement with Park Agencies’ Role in Reducing Climate Changing Gases (Q10)

69
Table 49. Other Open-Ended Responses Concerning Management Actions that California Park Agencies Could Adopt to Reduce and Adapt to Climate Change and Global Warming Management Actions n Information/Education 16 Recycling/Green Products 16 Transportation 13 Cooperation/Partnerships 9 Alternative Energy 7 Unsure/Don't Believe in Global Warming 6 Clean Parks/Littering 6 Can't Do Anything About It 4 Natural Resource Conservation/Preservation 4 More Research 4 Management 3 Politics 2 Water Conservation 2 Access 1 Other 6 Adult Mail-Back Survey, n is the # of responses (Q10)
Chart 9. Respondent Agreement with Park Agencies’ Doing Nothing
2.8%
53.4%
17.7%
12.3%
5.7%
8.1%
0 10 20 30 40 50 60
Don’t Know
Strongly Disagree
Disagree
Neither Disagree or Agree
Agree

70

71
ADULT HISPANIC RECREATION PATTERNS In California, the changes in ethnicity patterns influence outdoor recreation. Much of this change is attributed to rapid growth in the Hispanic population. According to a May 1, 2008 US Census Bureau News release, as of July 1, 2007, California had the largest population of Hispanics (13.2 million) in the country. Los Angeles is the California county with the largest Hispanic population, with nearly 5 million residents estimated in 2006. California was also ranked number one in having the largest Hispanic population gain (almost 2 million) from 2000 to 2006. The growth rate of Hispanics from 2000-2004 was nearly 35%. Hispanic Growth in California 2000-2004
Population (July 1)
Numeric Change Births Deaths Natural
Increase Migration Percent of Total CA Pop.
2000 11,085,435 32.51% 2001 11,475,024 389,589 259,349 29,502 229,847 159,742 32.99% 2002 11,894,846 419,822 261,548 30,439 231,109 188,713 33.61% 2003 12,315,332 420,486 267,135 32,131 235,004 185,482 34.22% 2004 12,707,735 392,403 270,696 33,797 236,899 155,504 34.81%
Average 405,575 264,682 31,467 233,215 172,360 The rapid growth in the Hispanic population is an important factor, since this ethnic group will have a substantial influence on outdoor recreation within the state. To address the effects of growth in the Hispanic population on outdoor recreation in California, a comparison of the attitudes, preferences, and recreation behaviors between Hispanics and non-Hispanics is presented in this section. Hispanic survey respondents are those who identified their household as Mexican-American or Other Hispanic (e.g., Central or South American). Respondents who selected one of the remaining categories were grouped into non-Hispanic respondents. This same procedure was utilized in 1997 and 2002. Hispanic and Non-Hispanic Confidence Level, Confidence Intervals
Number of Respondents
Percent of Total Respondents
95% Confidence Level: Confidence Intervals
Percent of Total State Population
State Population (Census data, 2008 est.)
Hispanic 694 25.0% ±3.71 36.6% 13,452,939Non-Hispanic 2074 75.0% ±2.15 63.4% 23,303,726
Totals 2768 100.00% ±1.85 100.00% 36,756,665http://quickfacts.census.gov/qfd/states/06000.html
The telephone and mail surveys (2008) were conducted in both English and Spanish. This section presents a discussion of similarities and differences in opinions and attitudes of Hispanics and non-Hispanics concerning park and recreation issues. Tables in this section also include a t-value or a x2 value, which assess whether the differences between the two

72
groups are statistically significant. T-values determine if differences in means between two groups of data are statistically significant. Chi squared is a statistical test that measures whether the apparent differences between survey responses from these two groups, Hispanics and Non-Hispanics, are significant for a particular question. P-values are the measure of probability that different responses from the groups happened by chance. For example, a p-value of .01 (p = .01) means there is a 1 in 100 chance the result, or difference between responses, occurred by chance. Asterisks (*) signify that Hispanic and Non-Hispanic data are significantly different from one another and are discussed in the narrative. Hispanics visited parks two or more times per week during the past 12 months significantly more than non-Hispanics (26.3 versus 19.1%). Hispanics spent more days visiting highly developed parks and recreation areas than any other recreation area, and the fewest number of days visiting historical or cultural areas. Hispanics were more likely to visit parks with just family members. Although the majority of Non-Hispanics also visited parks with family members, they were also more likely to visit parks alone, with friends, an organized group, or their pet than were Hispanics. On average, both Hispanics and non-Hispanics visited parks with approximately 5 people. Hispanics reported going to parks with more people under the age of 18 than did non-Hispanics.

73
Adult Hispanic Outdoor Recreation Behavior
Adult Hispanic Frequency of Outdoor Recreation Area Visitation A cross-tabulation of visitation frequencies by Hispanics and non-Hispanics showed that a significantly larger percentage of Hispanics (26.3%) than non-Hispanics (19.1%) visited parks two or more times per week during the past 12 months (Table 50). The majority of non-Hispanics (27.4%) reported visiting parks less frequently with visits occurring only once or twice per month. Table 50. A Comparison of Hispanics and Non-Hispanics on Frequency of Park Visitation in Past 12 Months.
Hispanics Non-Hispanics Visitation in Past 12 months % n % n
Two or more times per week***
26.3 183 19.1 397
About once a week*** 16.8 117 13.8 287 Once or twice a month*** 22.6 157 27.4 569 Several times a year*** 19.1 133 19.7 409 Once or twice a year*** 10.4 72 12.5 259 Not at all*** 3.3 23 6.7 139 Don't know*** 1.4 10 0.9 18 Adult Telephone Survey, n is the # of responses *** p <.001 (Q3B)

74
Adult Hispanic Distances Traveled to Park and Recreation Areas
The largest percentage of Hispanics spent 5 minutes or less driving (29.2%) or walking (42.3%) from their residence to the place they most often go for recreation (Table 51). This trend was similar for non-Hispanics and cross-tabulation analysis found no significant differences between Hispanics and non-Hispanics for their travel time to recreation areas. Table 51. A Comparison of Hispanics (H) and Non-Hispanics (NH) on Travel Time from Residence to Place Most Often Go for Recreation.
5 minutes or less
6-10 minutes
11-20 minutes
21-60 minutes
More than 60 minutes
Distance in
Minutes H NH H NH H NH H NH H NH
% (n)
% (n)
% (n)
% (n)
% (n)
% (n)
% (n)
% (n)
% (n) % (n)
Driving 29.2 (145)
30.0 (471)
19.2 (95)
20.3 (319)
21.0 (104)
22.0 (346)
21.4 (106)
18.5 (291)
9.3 (46)
9.2 (145)
Walking 42.3 (102)
36.2 (285)
21.2 (51)
20.8 (164)
23.7 (57)
22.3 (176)
11.6 (28)
18.7 (147)
1.2 (3)
2.0 (16)
Other n/a n/a n/a n/a n/a n/a n/a n/a n/a n/a Adult Telephone Survey, n is the # of responses (Q11) .

75
Adult Hispanic Types of Recreation Areas Visited
Hispanics spent more days visiting highly developed parks and recreation areas than any other recreation area (Table 52). Hispanics spent the fewest number of days visiting historical or cultural areas. Although Hispanics spent slightly more days than non-Hispanics visiting highly developed parks and recreation areas and slightly fewer days visiting natural and developed areas, when comparing overall recreation area visitation behavior between Hispanics and non-Hispanics, no significant differences were found. Table 52. A Comparison of Hispanics and Non-Hispanics on The Number of Days Respondents Visited Outdoor Recreation Areas During the Past 12 Months.
Hispanic Non-Hispanic Type of Outdoor Recreation Area Mean days n Mean days n Highly developed parks and recreation areas: In or near urban areas that may include playgrounds, sports facilities, and highly developed beaches; for example, city parks
29.8 317 26.0 825
Developed nature-oriented parks and recreation areas: Located outside or on the fringe of urban areas, including trails, picnic areas, campgrounds, and information centers. Generally includes national, state, large county and regional parks, beaches, reservoirs, and state and national recreation areas
14.3 320 13.4 811
Historical or cultural buildings, sites, or areas: Regardless of location 5.3 308 5.6 805
Natural and undeveloped areas: Large areas in a natural or nearly natural condition, with few developments; for example, forests, deserts, mountains, wetlands, and seashores
8.8 312 10.7 806
Adult Mail-Back Survey, n is the # of responses (Q4)

76
Adult Hispanic Visitor Group Characteristics Hispanics primarily reported visiting parks with their family (65.9%) followed by both friends and family (27.6%) (Table 53). They rarely went alone (10.2%), with a pet (9.5%), or with an organized group (7.2%). These results are echoed in the study conducted by the U.S. Forest Service on visitors to the Angeles National Forest, where over 70% of Hispanic males indicated they visit parks as part of a family gathering (2007). While this trend was similar for non-Hispanics, the cross-tabulation of the frequencies showed statistically significant differences between Hispanics and non-Hispanics. Hispanics were more likely to visit parks with just family members. Although the majority of Non-Hispanics also visited parks with family members, they were also more likely to visit parks alone, with friends, an organized group, or their pet than were Hispanics. Table 53. A Comparison of Hispanics (H) and Non-Hispanics (NH) on Companions Who Accompany Respondents to a Park.
Hispanic Non-Hispanic Companion
% (n)
% (n)
No one*** 10.2 (71)
16.3 (339)
Just Family*** 65.9 (458)
51.9 (1079)
Just Friends*** 19.0 (132)
26.4 (548)
Both Family and Friends at the same time*
27.6 (192)
32.3 (671)
Organized group** 7.2 (50)
10.9 (227)
Pet** 9.5 (66)
14.1 (293)
Other 0.1 (1)
0.6 (12)
Adult Telephone Survey, n is the # of responses (Q16) * p <.05 ** p <.01 *** p<.001 1 Cannot perform χ2 test because there are not enough cases within each of the “other” activities.
When comparing Hispanics and non-Hispanics on the number of companions that visited parks with them, there were no significant differences in the number of companions over the age of 18 (Table 54). On average, both Hispanics and non-Hispanics visited parks with approximately 5 people. There were differences, however, in the number of companions under the age of 18. Hispanics reported going to parks with more people under the age of 18 than did non-Hispanics.

77
Table 54. A Comparison of Hispanics (H) and Non-Hispanics (NH) on Number of Companions Respondents Visited a Park With.
Hispanic n = 639
Non-Hispanic n = 1805 Companions
Mean Mean # of people 18 years and older 4.6 4.7 # of people less than 18 years of age***
3.7 2.5
Adult Telephone Survey, n is the # of responses (Q17, Q18) *** p<.001

78

79
Adult Hispanic Levels of Activity and Time Spent in Outdoor Recreation The most limiting factors for being active at parks for Hispanic respondents were gang activity in parks and poorly maintained parks or trail conditions. One difference between Hispanic and Non-Hispanic limiting factors for activity at parks was that Non-Hispanics more frequently attributed their limited physical activity in parks to being physically active elsewhere than did Hispanics. Walking for fitness or pleasure was the activity with the highest participation for Hispanics and Non-Hispanics alike. Hispanics were more likely to have participated in sports, jogging/running, and playing than were non-Hispanics. Hispanics were less likely to have participated in hiking and fishing than were non-Hispanics. Hispanics expressed less interest in fishing more often than did non-Hispanics. Like Non-Hispanics, the majority of Hispanics were not willing to pay for their favorite activities.
Adult Hispanic Time Spent in Physical Activity
Hispanics were asked to rate factors that might limit their level of physical activity in parks. The most limiting factors were gang activity in parks and poorly maintained parks or trail conditions (Table 55). When compared to non-Hispanics, only one significant difference was found. Non-Hispanics more frequently attributed their limited physical activity in parks to being physically active elsewhere than did Hispanics. Table 55. A Comparison of Hispanics and Non-Hispanics on How Respondents Perceive Certain Factors Might Limit Their Level of Physical Activity in Parks.
Hispanic n = 325
Non-Hispanic n = 893 Factor1
Mean2 Mean2 No one to be physically active with 3 3
Fear of crime from others in the park 3 3
Personal safety concerns (e.g., fear of injury, poorly maintained equipment)
3 3
Poorly maintained park (e.g., excess trash, run down facilities)
3 3
Park does not have the facilities I like to use (e.g., fitness stations, trails)
3 3
Poorly maintained trail conditions (e.g., unsafe surface, no lighting at night)
3 3
Trail design (e.g., difficulty accessing trail) 3 3
Poor lighting in park 3 3 Alcohol and drug use in park 4 4
Gang activity in park 4 4

80
Table 55. A Comparison of Hispanics and Non-Hispanics on How Respondents Perceive Certain Factors Might Limit Their Level of Physical Activity in Parks.
Hispanic n = 325
Non-Hispanic n = 893 Factor1
Mean2 Mean2 Lack of scenic beauty 3 3 Personal health problems (e.g., difficulty walking, breathing)
2 2
Limited park hours (e.g., fitness facilities, pool) 3 3
Park is too far away from where I live 3 3
I am physically active elsewhere* 3 3
I am not physically active 2 2 Not enough time 3 3 Lack of skills and abilities 2 2 Costs of activity 3 3 Park is not accessible for individuals with a physical disability
2 2
No restrooms 3 3 Lack of public transportation to park 2 2
Don’t feel welcome in park 2 2 Weather 3 3 Dogs are not allowed 2 2 Commercial visitor services, like food services or gift shops, are not available
2 2
Adult Mail-Back Survey, n is the # of responses (Q9) 1 Rated on a scale from 1 = not at all important to 5 = very important. 2 Rounded to the nearest whole number
* p < .05

81
Activities of Adult Hispanic Respondents
Hispanics were asked to indicate which activities they had participated in during their last park visit. The most common activities were walking (51.3%), playing (10.8%), sports (31.7%), sedentary activities (25.8%), and eating/picnicking (24.8%) (Table 56). Activities that exhibited the lowest participation among Hispanics included active water sports (3.5%), fishing (3.2%), tennis (2.9%), in-line skating (0.9%), and martial arts (0.7%). While these trends were similar among non-Hispanics, cross tabulation analysis showed several significant differences between Hispanic and non-Hispanic activity participation. Hispanics were more likely to have participated in sports, jogging/running, and playing than were non-Hispanics. In contrast, Hispanics were less likely to have participated in hiking and fishing than were non-Hispanics. Table 56. A Comparison of Hispanics (H) and Non-Hispanics (NH) on Activities Participated in During Their Last Park Visit.
Yes No H NH H NH Activity % (n)
% (n)
% (n)
% (n)
Sports (baseball, soccer, football, basketball)***
31.7 (220)
14.2 (295)
68.3 (474)
85.8 (1779)
Walking (excluding dog walking) 51.3 (356)
48.4 (1004)
48.7 (338)
51.6 (1070)
Dog walking 8.5 (59)
9.4 (195)
91.5 (635)
90.6 (1879)
Hiking*** 9.8 (68)
19.2 (399)
90.2 (626)
80.8 (1675)
In-line skating 0.9 (6)
0.4 (9)
99.1 (688)
99.6 (2065)
Tennis 2.9 (20)
2.0 (41)
97.1 (674)
98.0 (2033)
Swimming 9.8 (68)
8.1 (167)
90.2 (626)
9139 (1907)
Jogging/running*** 20.2 (140)
10.0 (208)
79.8 (554)
90.0 (1866)
Active water sports (kayaking, rowing, canoeing)
3.5 (24)
4.1 (86)
96.5 (670)
95.9 (1988)
Fishing* 3.2 (22)
5.9 (123)
96.8 (672)
94.1 (1951)
Martial arts/tai chi/yoga 0.7 (5)
0.7 (15)
99.3 (689)
99.3 (2059)
Bicycling 9.1 (6.3)
7.7 (160)
90.9 (631)
92.3 (1914)
Playing (e.g. Frisbee, playing catch with a ball, flying a kite, playing with children)***
40.8 (283)
27.1 (562)
59.2 (411)
72.9 (1512)
Sedentary activities (e.g., sitting, reading, supervising children)
25.8 (179)
23.5 (488)
74.2 (515)
76.5 (1586)

82
Table 56. A Comparison of Hispanics (H) and Non-Hispanics (NH) on Activities Participated in During Their Last Park Visit.
Yes No H NH H NH Activity % (n)
% (n)
% (n)
% (n)
Wildlife viewing (including bird watching)
11.2 (78)
13.2 (274)
88.8 (616)
86.8 (1800)
Eating/picnicking 24.8 (172)
23.8 (494)
75.2 (522)
76.2 (1580)
Other 5.9 (41)
11.0 (228)
94.1 (653)
89.0 (1846)
Adult Telephone Survey, n is the # of responses (Q15) * p <.05 *** p<.001 1 Cannot perform χ2 test because there are not enough cases within each of the “other” activities.

83
Activity Participation and Latent Demand for Adult Hispanic Respondents
On average, Hispanics spent the greatest number of days walking, jogging/running, skateboarding, playing organized team sports, and bicycling on paved surfaces during the past 12 months (Table 57). Although participation levels in recreation activities varied between Hispanics and non-Hispanics, cross-tabulation found no statistically significant differences in the number of days either group participated in each activity. Table 57. A Comparison of Hispanics and Non-Hispanics on Recreation Activity Participation During the Past 12 Months.
Hispanic Non-Hispanic Activity Mean days
n Mean days
n
Camping in developed sites with facilities such as toilets and tables (not including backpacking)
6.1 122.0 7.2 357.0
Picnicking in picnic areas (with tables, fire pits, or grills)
7.2 215.0 7.5 606.0
RV/trailer camping with hookups 10.7 36.0 8.5 101.0 Backpacking (overnight hiking) 4.5 38.0 4.5 93.0 Backcountry activities such as mountaineering, rock climbing and bouldering)
11.1 45.0 11.0 103.0
Walking for fitness or pleasure 79.2 246.0 70.5 664.0 Jogging and running for exercise (on trails, streets, sidewalks, paths)
72.2 133.0 55.3 352.0
Day hiking on trails 15.7 159.0 16.0 417.0 Skateboarding (skate parks, paths, sidewalks) 50.5 31.0 23.0 60.0 Horseback riding, horse shows and events 7.0 28.0 15.4 68.0 Bicycling on paved surfaces 32.5 118.0 39.8 328.0 Bicycling on unpaved surfaces and trails (mountain biking)
17.7 53.0 21.5 142.0
Driving for pleasure, sightseeing, driving through natural scenery
22.0 197.0 21.9 537.0
Wildlife viewing, bird watching, viewing natural scenery
24.5 145.0 27.7 418.0
Outdoor photography 25.8 102.0 25.4 306.0 Downhill (Alpine) skiing 4.1 27.0 6.4 70.0 Snowboarding 5.3 21.0 5.5 84.0 Cross-country skiing 5.6 14.0 4.2 37.0 Snowmobiling 3.9 9.0 5.4 35.0 Off-highway vehicle use (motorcycles, 4-wheel drive, all-terrain vehicles)
10.4 41.0 16.3 117.0
Swimming in a pool 26.6 162.0 24.5 462.0 Swimming in freshwater lakes, rivers and/or streams
9.9 99.0 10.6 284.0

84
Table 57. A Comparison of Hispanics and Non-Hispanics on Recreation Activity Participation During the Past 12 Months.
Hispanic Non-Hispanic Activity Mean days
n Mean days
n
Beach activities (swimming, sunbathing, surf play, wading, playing on beach)
14.2 191.0 15.2 535.0
Surfing or boogie boarding, windsurfing 10.0 48.0 17.2 125.0 Paddle sports (kayaking, rowing, canoeing, rafting
3.5 51.0 5.2 133.0
Sail boating 3.0 20.0 18.7 53.0 Motor boating, personal watercraft (jet skis, wave runners, waterskiing, wakeboarding)
6.2 49.0 9.6 133.0
Fishing - freshwater 8.0 66.0 14.4 196.0 Fishing - saltwater (includes catching abalone, clams, crabs, etc.)
7.3 35.0 11.9 97.0
Hunting (large or small game with a firearm) 11.3 15.0 18.9 32.0 Target shooting (including pistol and skeet) 5.1 45.0 12.7 94.0 Attending outdoor cultural events (festivals, fairs, concerts, historical reenactments, outdoor theatre)
6.7 177.0 7.2 514.0
Visiting historic or cultural sites 8.1 172.0 8.0 500.0 Visiting outdoor nature museums, zoos, gardens or arboretums
6.2 183.0 6.2 532.0
Using open turf areas (casual and unstructured activities - games, relax, sunning, etc.)
20.3 99.0 21.1 309.0
Using play equipment, play structures, tot-lots 30.0 102.0 30.0 301.0 Organized team sports such as soccer, football, baseball, softball, basketball
32.8 66.0 31.4 235.0
Golf 21.0 43.0 19.6 111.0 Tennis 21.5 44.0 14.0 111.0 Adult Mail-Back Survey, n is the # of responses (Q2)
When asked if they would like to have participated in these recreation activities more often, the majority of Hispanics indicated they would like to have spent more time in the following activities:
• Walking for fitness or pleasure • Camping in developed sites with facilities such as toilets and tables • Picnicking in picnic areas • Visiting outdoor nature museums, zoos, gardens or arboretums • Visiting historic or cultural sites • Beach activities • Bicycling on paved surfaces • Day hiking on trails

85
No statistically significant differences were found between Hispanics and non-Hispanics regarding latent demand for recreation activities with the exception of freshwater fishing (Table 58). Hispanics expressed less interest in fishing more often than did non-Hispanics.
Table 58. A Comparison of Hispanics and Non-Hispanics on Recreation Activities Respondents Would Like to Participate in More Often.
Hispanic Non-HispanicActivity %
Yes n % Yes n
Camping in developed sites with facilities such as toilets and tables (not including backpacking) 41.3 136 42.1 37.8
Picnicking in picnic areas (with tables, fire pits, or grills) 43.8 144 45.4 408
RV/trailer camping with hookups 16.4 54 17.3 155 Backpacking (overnight hiking) 20.4 67 21.0 189 Backcountry activities such as mountaineering, rock climbing and bouldering) 17.0 56 17.9 161
Walking for fitness or pleasure 44.4 146 46.0 413 Jogging and running for exercise (on trails, streets, sidewalks, paths) 27.7 91 26.9 242
Day hiking on trails 44.1 145 44.1 396 Skateboarding (skate parks, paths, sidewalks) 8.8 29 7.9 71 Horseback riding, horse shows and events 15.5 51 13.9 125 Bicycling on paved surfaces 45.3 149 44.4 399 Bicycling on unpaved surfaces 20.4 67 19.5 175 Driving for pleasure, sightseeing, driving through natural scenery 35.3 116 37.3 335
Wildlife viewing, bird watching, viewing natural scenery 31.6 104 32.6 293
Outdoor photography 28.0 92 28.5 256 Downhill (Alpine) skiing 12.8 42 13.0 117 Snowboarding 14.0 46 13.0 117 Cross-country skiing 7.9 26 9.1 82 Snowmobiling 11.2 37 12.4 111 Off-highway vehicle use (motorcycles, 4-wheel drive, all-terrain vehicles) 37.1 122 37.4 336
Swimming in a pool 34.3 113 37.2 334 Swimming in freshwater lakes, rivers and/or streams 27.1 89 28.6 257 Beach activities (swimming, sunbathing, surf play, wading, playing on beach) 40.4 133 42.2 379
Surfing or boogie boarding, windsurfing 14.6 48 17.5 157 Paddle sports (kayaking, rowing, canoeing, rafting 19.8 65 20.6 185 Sail boating 12.2 40 12.7 114 Motor boating, personal watercraft (jet skis, wave runners, waterskiing, wakeboarding) 15.2 50 16.1 145
Fishing - freshwater* 18.8 62 24.7 222 Fishing - saltwater (includes catching abalone, clams, crabs, etc.) 13.4 44 16.9 152

86
Table 58. A Comparison of Hispanics and Non-Hispanics on Recreation Activities Respondents Would Like to Participate in More Often.
Hispanic Non-HispanicActivity %
Yes n % Yes n
Hunting (large or small game with a firearm) 6.7 22 7.3 66 Target shooting (including pistol and skeet) 15.8 52 15.4 138 Attending outdoor cultural events (festivals, fairs, concerts, historical reenactments, outdoor theatre) 38.0 125 39.3 353
Visiting historic or cultural sites 40.1 132 39.9 358 Visiting outdoor nature museums, zoos, gardens or arboretums 41.3 136 41.4 372
Using open turf areas (casual and unstructured activities - games, relax, sunning, etc.) 21.9 72 23.1 207
Using play equipment, play structures, tot-lots 19.1 63 18.6 167 Organized team sports such as soccer, football, baseball, softball, basketball 15.5 51 18.7 168
Golf 14.9 49 12.0 108 Tennis 12.8 42 13.3 119 Adult Mail-Back Survey, n is the # of responses (Q2) * p < .05 The majority of Hispanics were not willing to pay for their favorite activities (Table 60). Although responses among non-Hispanics varied slightly, there were no significant differences between Hispanics and non-Hispanics on how much they were willing to pay for their favorite activities. Table 60. A Comparison of Hispanics (H) and Non-Hispanics (NH) on How Much Respondents Would Pay to Participate in Their Top Three Favorite Activities.
$0 $1 - $4 $5 - $10 $11 - $15 $16 - $20 H NH H NH H NH H NH H NH Favorite
Activity % (n)
% (n)
% (n)
% (n)
% (n) % (n) %
(n) % (n)
% (n)
% (n)
First 33.3 (106)
27.2 (238)
17.9 (57)
16.9 (148)
20.1(64)
23.1 (202)
7.5 (24)
9.1 (80)
21.1 (67)
23.7 (208)
Second 30.1 (94)
27.4 (236)
20.8 (65)
19.6 (169)
24.7(77)
24.4 (210)
8.7 (27)
10.5 (90)
15.7 (49)
18.1 (156)
Third 27.6 (83)
25.3 (213)
20.3 (61)
19.2 (162)
26.2(79)
28.7 (242)
5.6 (17)
9.4 (79)
20.3 (61)
17.3 (146)
Adult Mail-Back Survey, n is the # of responses (Q3)

87
Facilities and Amenities Utilized During Last Adult Hispanic Park Visit
When compared to facility use by non-Hispanics, cross-tabulation analyses showed many significant differences between Hispanics and non-Hispanics. Hispanics were more likely than non-Hispanics to use:
• Swimming pools • Picnic tables • Amusement areas • Playgrounds • Tennis or Basketball courts • Organized sports fields • Open spaces to play • Skate parks
Hispanics were less likely than non-Hispanics to use:
• Beach or water recreation areas • Scenic observation/wildlife viewing area • Unpaved multipurpose trails
Hispanics were less likely than Non-Hispanics to rate environmental and outdoor education programs and recreation facilities at lakes, rivers and reservoirs as important. The most common facilities used by Hispanics during their last park visit were open spaces to play (69.4%), picnic tables (66.6%), community facilities/buildings (66.2%), playgrounds (60.0%), and paved trails (51.8%) (Table 61). Table 61. A Comparison of Hispanics (H) and Non-Hispanics (NH) on Facilities or Amenities Used During Their Last Park Visit.
Yes No Don’t Know H NH H NH H NH Facility/Amenity % (n)
% (n)
% (n)
% (n)
% (n)
% (n)
Swimming pool*** 9.6 (67)
5.3 (110)
89.6 (623)
94.2 (1958)
0.7 (5)
0.5 (10)
Beach or water recreation area*** 33.4 (232)
41.9 (870)
66.2 (460)
57.6 (1197)
0.4 (3)
0.5 (11)
Scenic observation/wildlife viewing area*
38.1 (265)
45.5 (946)
61.0 (424)
53.8 (1117)
0.9 (6)
0.7 (15)
Botanical garden 15.4 (107)
14.1 (294)
83.5 (580)
85.1 (1769)
1.2 (8)
0.7 (15)
Paved trail (e.g., bike trail) 51.8 (360)
49.1 (1020)
47.5 (330)
50.5 (1049)
0.7 (5)
0.4 (9)
Unpaved multipurpose trail (e.g., walking/hiking)**
47.2 (328)
54.8 (1138)
51.9 (361)
44.9 (933)
0.9 (6)
0.3 (7)

88
Table 61. A Comparison of Hispanics (H) and Non-Hispanics (NH) on Facilities or Amenities Used During Their Last Park Visit.
Yes No Don’t Know H NH H NH H NH Facility/Amenity % (n)
% (n)
% (n)
% (n)
% (n)
% (n)
Picnic table, picnic pavilion*** 66.6 (463)
54.6 (1135)
32.9 (229)
44.9 (934)
0.4 (3)
0.4 (9)
Community facility/building 66.2 (460)
63.4 (1318)
32.9 (229)
36.0 (749)
0.9 (6)
0.5 (11)
Amusement area (e.g., park train)***
33.5 (233)
14.8 (308)
65.8 (457)
84.7 (1760)
0.7 (5)
0.5 (10)
Playground*** 60.0 (471)
32.4 (674)
39.3 (273)
67.0 (1393)
0.7 (5)
0.5 (11)
Tennis or basketball courts*** 30.2 (210)
15.8 (328)
68.9 (479)
83.7 (1739)
0.9 (6)
0.5 (11)
Organized sports fields (e.g., baseball, soccer)**
34.5 (240)
16.1 (335)
64.5 (448)
83.3 (1732)
1.0 (7)
0.5 (11)
Open space to play (with kids, Frisbee)***
69.4 (482)
55.8 (1159)
30.1 (209)
43.9 (913)
0.6 (4)
0.3 (6)
Skatepark*** 9.6 (67)
5.2 (108)
89.6 (623)
94.5 (1964)
0.7 (5)
0.3 (6)
Dog park area 14.8 (103)
15.9 (331)
84.3 (586)
83.3 (1732)
0.9 (6)
0.7 (15)
Other 3.9 (27)
7.1 (147)
93.4 (649)
91.6 (1903)
2.7 (19)
1.3 (28)
Adult Telephone Survey, n is the # of responses (Q13) * p <.05 ** p <.01 *** p<.001 1 Cannot perform χ2 test because there are not enough cases within each of the “other” activities.

89
Adult Hispanic Outdoor Recreation Facilities and Services
Respondents were asked to rate the importance of a variety of California park and recreation facilities and services. The most important facilities and services to Hispanics were 1) Play activity areas for tots and young children; 2) Multi-use turf areas for field sports such as softball, baseball, soccer, and/or football; 3) Areas and facilities for environmental and outdoor education programs; 4) Hard surface trails for biking, jogging, and fitness walking; and 5) Wilderness type areas where no vehicles or development are allowed (Table 62). These facilities/services were also rated the highest among non-Hispanics. The only significant difference was found for areas and facilities for environmental and outdoor education programs; non-Hispanics rated these as more important than did Hispanics. In addition, recreation facilities at lakes, rivers and reservoirs received a significantly lower importance rating by Hispanics than by non-Hispanics. Table 62. A Comparison of Hispanics and Non-Hispanics on Importance of California Park and Recreation Facilities and Services.
Hispanic2 n = 328
Non-Hispanic2 n = 864 Facility/Service1
Mean Mean Areas and facilities for environmental and outdoor education programs* 4 4
Multi-use turf areas for field sports such as softball, baseball, soccer, and/or football 4 4
Courts for activities such as tennis, basketball, and volleyball 4 4
Multi-purpose buildings with rooms that can be used for community meetings and facilities for cultural events, senior or teen programs
4 4
Play activity areas for tots and young children 4 4 Facilities in the local community that can be used for day youth camps 4 4
Facilities in the local community for overnight camping 3 4
Off-leash dog parks 3 3 Community swimming pools 4 4 Community skateboard parks 3 3 Picnic sites for large groups 4 4 Trails solely for a single activity such as hiking, mountain biking, or horseback riding
4 4
Trails for multiple, non-motorized activities such as hiking, mountain biking or horseback riding
4 4
Hard surface trails for biking, jogging, and fitness walking 4 4
RV campgrounds with electrical and water hookups, sewer dump stations, or pull-through sites
3 3

90
Table 62. A Comparison of Hispanics and Non-Hispanics on Importance of California Park and Recreation Facilities and Services.
Hispanic2 n = 328
Non-Hispanic2 n = 864 Facility/Service1
Mean Mean Sheltered lodging facilities such as rustic cabins, yurts, and tent cabins 3 3
Commercial visitor services within public parks and outdoor recreation areas such as hotels, motels, restaurants, or shops
3 3
Areas for the legal use of off-highway vehicles such as motorcycles, dune buggies, 4-wheel drive vehicles, or all-terrain vehicles
3 3
Wilderness type areas where no vehicles or development are allowed 4 4
Developed fishing areas with piers and/or fish cleaning stations 4 4
Public hunting areas especially managed for waterfowl like ducks and geese 2 3
Launch ramps, marinas, and other boating facilities 3 3
Recreation facilities at lakes, rivers and reservoirs* 4 4
Adult Mail-Back Survey, n is the # of responses (Q1) 1 Rated on a scale from 1 = not at all important to 5 = very important. 2 Rounded to the nearest whole number
* p < .05

91
Adult Hispanic Attitudes and Beliefs Regarding Outdoor Recreation Opinions of Hispanics varied from Non-Hispanics when it came to government emphasis on protecting historic resources, buying additional parkland and open space for recreation purposes, building new facilities, protecting natural resources, and cleaning up pollution of the ocean, lakes, rivers and streams in park and recreation areas. Although the majority of Hispanics rated these as needing more emphasis, significantly more non-Hispanics rated these as needing more emphasis. Hispanics and Non-Hispanics agree that having fun, relaxing, being with family and friends, and viewing scenic beauty were very important factors for participation in their favorite activities. Hispanics strongly agreed that recreation programs help improve people’s health, reduce crime and juvenile delinquency, and attract tourists to California. They also strongly agreed that it is important to enforce rules and regulations and that fees generated in parks should be spent in those parks. When compared to non-Hispanics, Hispanics were more likely to strongly agree that open space lands are needed where they live.
Adult Hispanic Opinions on State and Federal Agency Emphasis
The 2002 survey respondents were asked how much emphasis state and federal government agencies should place on aspects of outdoor recreation. Opinions of Hispanics compared with non-Hispanics revealed statistically significant differences for five of these areas, facilities, and programs (Table 63). A significantly larger percentage of Hispanics think more emphasis should be placed on protecting historic resources. The other four significant items included (1) buying additional parkland and open space for recreation purposes; (2) building new facilities, (3) protecting natural resources, and (4) cleaning up pollution of the ocean, lakes, rivers and streams in park and recreation areas. Although the majority of Hispanics rated these as needing more emphasis, significantly more non-Hispanics rated these as needing more emphasis. Table 63. A Comparison of Hispanics (H) and Non-Hispanics (NH) on How Much Emphasis State and Federal Government Outdoor Recreation Agencies in California Should Place on Aspects of Outdoor Recreation.
Less
Emphasis
About the Same
Emphasis
More
Emphasis Don't Know/
Unsure
H NH H NH H NH H NH Idea
% (n)
% (n)
% (n)
% (n)
% (n)
% (n)
% (n)
% (n)
Buying additional parkland and open space for recreation purposes*
9.2 (30)
5.4 (48)
32.0 (104)
33.3 (297)
46.5 (151)
51.5 (459)
12.3 (40)
9.8 (87)
Maintaining or caring for park and recreation areas
2.5 (8)
1.1 (10)
22.2 (72)
21.7 (193)
70.8 (230)
72.3 (644)
4.6 (15)
4.9 (44)
Providing educational programs
7.1 (23)
4.6 (41)
39.1 (127)
38.3 (341)
45.5 (148)
50.7 (451)
8.3 (27)
6.4 (57)
Building new facilities* 13.6 (44)
9.5 (84)
44.8 (145)
46.2 (411)
29.0 (94)
35.8 (318)
12.7 (41)
8.5 (76)

92
Table 63. A Comparison of Hispanics (H) and Non-Hispanics (NH) on How Much Emphasis State and Federal Government Outdoor Recreation Agencies in California Should Place on Aspects of Outdoor Recreation.
Less
Emphasis
About the Same
Emphasis
More
Emphasis Don't Know/
Unsure
H NH H NH H NH H NH Remodeling and improving existing facilities
4.0 (13)
2.0 (18)
21.8 (71)
26.3 (234)
66.2 (215)
64.9 (578)
8.0 (26)
6.8 (61)
Protecting natural resources** 5.5 (18)
1.5 (13)
23.7 (77)
19.4 (173)
65.2 (212)
73.8 (658)
5.5 (18)
5.4 (48)
Protecting historic resources* 5.2 (17)
2.0 (18)
25.5 (84)
25.0 (223)
62.8 (204)
37.9 (606)
6.2 (20)
5.0 (45)
Providing more organized activities and special events
12.6 (41)
9.7 (86)
42.5 (138)
44.7 (398)
33.8 (110)
36.9 (328)
11.1 (36)
8.8 (78)
Cleaning up pollution of the ocean, lakes, rivers and streams in park and recreation areas**
4.3 (14)
1.3 (12)
18.5 (60)
12.5 (111)
70.7 (229)
80.4 (716)
6.5 (21)
5.8 (52)
Adult Mail-Back Survey, n is the # of responses, (Q8) * p < .05 ** p <.001

93
Adult Hispanic Opinions on Outdoor Recreation in California
When asked about the importance of a variety of items influencing the choice of their favorite activities, the majority of Hispanics said having fun, relaxing, being with family and friends, and viewing the scenic beauty were very important for participation in their favorite activities (Table 64). When compared with non-Hispanics, there were no statistically significant differences between Hispanics and non-Hispanics on the factors influencing participation in their favorite activity.
Table 64. A Comparison of Hispanics (H) and Non-Hispanics (NH) on Importance of Items to Respondents’ Favorite Activities.
Not at all Important 2 3 4 Very
Important H NH H NH H NH H NH H NH Statement % (n)
% (n)
% (n)
% (n)
% (n)
% (n)
% (n)
% (n)
% (n)
% (n)
To be with family and friends
7.7 (25)
4.8 (43)
1.8 (6)
4.5 (40)
12.9 (42)
10.9 (97)
17.8 (58)
18.8 (168)
59.8 (195)
61.0 (544)
To be with others who enjoy the same things you do
9.5 (31)
7.4 (66)
6.2 (20)
7.0 (62)
20.9 (68)
19.3 (171)
27.7 (90)
27.3 (242)
35.7 (116)
39.1 (347)
To meet new people 25.1 (81)
22.5 (199)
17.0 (55)
20.2 (179)
30.0 (97)
28.1 (249)
16.7 (54)
15.6 (138)
11.1 (36)
13.7 (121)
To learn something new
12.7 (41)
10.9 (97)
11.8 (38)
10.7 (95)
23.8 (77)
23.4 (208)
27.9 (90)
29.1 (259)
23.8 (77)
26.0 (231)
To experience challenge and excitement
9.2 (30)
8.0 (71)
9.5 (31)
10.3 (91)
20.9 (68)
24.4 (216)
30.5 (99)
26.9 (238)
29.8 (97)
30.5 (270)
To relax 2.1 (7)
1.0 (9)
2.1 (7)
1.9 (17)
9.5 (31)
10.3 (92)
24.5 (80)
28.8 (256)
61.8 (202)
58.0 (516)
To view the scenic beauty
3.1 (10)
2.5 (22)
3.1 (10)
2.9 (26)
14.5 (47)
11.5 (102)
24.4 (79)
28.0 (249)
54.9 (178)
55.2 (491)
To achieve spiritual fulfillment
18.4 (59)
17.8 (158)
11.5 (37)
15.1 (134)
26.2 (84)
23.4 (208)
18.1 (58)
17.2 (153)
25.9 (83)
26.4 (234)
To have fun 0.9 (3)
0.4 (4)
0.9 (3)
1.1 (10)
7.4 (24)
9.3 (83)
25.9 (84)
23.9 (213)
64.8 (210)
65.2 (581)
To keep fit and healthy 2.8 (9)
2.2 (20)
3.7 (12)
3.4 (30)
20.7 (67)
19.5 (174)
24.7 (80)
29.0 (258)
48.1 (156)
45.9 (409)
To feel safe and secure
8.7 (28)
6.2 (55)
5.0 (16)
7.1 (63)
23.2 (75)
19.7 (175)
20.7 (67)
22.5 (200)
42.4 (137)
44.5 (395)
To do something your children, grandchildren enjoy
26.2 (85)
23.0 (204)
4.9 (16)
6.4 (57)
15.7 (51)
14.7 (130)
13.6 (44)
13.4 (119)
39.5 (128)
42.4 (376)
To experience a change from daily routines
4.9 (16)
4.0 (36)
4.0 (13)
2.8 (25)
18.8 (61)
16.0 (142)
30.2 (98)
30.0 (267)
42.2 (137)
47.2 (420)
To get away from crowded situations
6.1 (20)
4.1 (36)
4.0 (13)
4.3 (38)
17.8 (58)
17.3 (154)
29.4 (96)
28.2 (250)
42.6 (139)
46.2 (410)
To feel harmony with nature
9.0 (29)
6.7 (60)
6.8 (22)
8.4 (75)
24.1 (78)
19.7 (175)
23.8 (77)
24.7 (220)
36.4 (118)
40.4 (359)
Adult Mail-Back Survey, n is the # of responses, (Q5)

94
Hispanics strongly agreed that recreation programs help improve people’s health, reduce crime and juvenile delinquency, and attract tourists to California (Table 65). They also strongly agreed with enforcing rules and regulations and that fees generated in parks should be spent in those parks. When compared to non-Hispanics, a significant difference was found for the need to have open space lands where they live. Hispanics were more likely than non-Hispanics to strongly agree that open space lands were needed. Table 65. A Comparison of Hispanics (H) and Non-Hispanics (NH) on Respondents’ Level of Agreement with Statements Concerning Outdoor Recreation Lands and Facilities in California.
Strongly Disagree Disagree
Neither Disagree or Agree
Agree Strongly Agree
H NH H NH H NH H NH H NH Statement
% (n)
% (n)
% (n)
% (n)
% (n)
% (n)
% (n)
% (n)
% (n)
% (n)
Open space lands are needed where I live*
2.1 (7)
1.9 (17)
8.3 (27)
6.2 (55)
23.6 (77)
20.3 (181)
30.7 (100)
40.3 (360)
35.3 (115)
31.4 (280)
Recreation areas for camping or overnight use are needed
3.4 (11)
5.3 (47)
14.7 (48)
10.9 (97)
30.0 (98)
27.9 (249)
31.8 (104)
35.4 (316)
20.2 (66)
20.6 (184)
Recreation facilities, such as picnic or camping sites, are needed at lakes and reservoirs
3.1 (10)
2.1 (19)
5.2 (17)
4.8 (43)
27.9 (91)
21.3 (190)
39.9 (130)
42.5 (379)
23.9 (78)
29.3 (261)
Recreation programs help reduce crime and juvenile delinquency
1.2 (4)
1.2 (11)
2.8 (9)
3.7 (33)
19.3 (63)
16.5 (148)
34.9 (114)
36.5 (327)
41.9 (137)
42.0 (376)
Recreation programs help improve people’s health
0.3 (1)
0.8 (7)
1.2 (4)
0.8 (7)
10.7 (35)
11.1 (99)
36.8 (120)
35.6 (318)
50.9 (166)
51.8 (463)
Recreation and park agencies create jobs and help the economy
0.9 (3)
1.3 (12)
3.4 (11)
2.3 (21)
22.6 (74)
20.7 (185)
37.3 (122)
37.5 (335)
35.8 (117)
38.1 (341)
The availability of parks, and recreation areas and facilities attract tourists to California
1.8 (6)
1.2 (11)
1.2 (4)
2.2 (20)
15.6 (51)
16.4 (147)
40.7 (133)
38.5 (344)
40.7 (133)
41.6 (372)
Recreation areas and facilities increase property values
1.8 (6)
1.6 (14)
3.7 (12)
3.1 (28)
25.7 (84)
25.8 (231)
37.3 (122)
35.9 (321)
31.5 (103)
33.6 (300)
Rules and regulations in parks and outdoor recreation areas should be enforced
0.6 (2)
0.8 (7)
1.8 (6)
1.9 (17)
14.1 (46)
13.9 (124)
33.3 (109)
35.0 (313)
50.2 (164)
48.5 (434)

95
Table 65. A Comparison of Hispanics (H) and Non-Hispanics (NH) on Respondents’ Level of Agreement with Statements Concerning Outdoor Recreation Lands and Facilities in California.
Strongly Disagree Disagree
Neither Disagree or Agree
Agree Strongly Agree
H NH H NH H NH H NH H NH Statement
% (n)
% (n)
% (n)
% (n)
% (n)
% (n)
% (n)
% (n)
% (n)
% (n)
Fees collected at each park, wildlife and recreation area should be spent on that area
1.5 (5)
1.2 (11)
4.0 (13)
3.5 (31)
11.6 (38)
14.3 (128)
28.4 (93)
30.4 (272)
54.4 (178)
50.6 (452)
Private businesses should provide some of the outdoor recreation services at government owned facilities
8.3 (27)
6.9 (62)
8.3 (27)
11.2 (100)
40.7 (133)
38.8 (347)
25.4 (83)
26.8 (240)
17.4 (57)
16.2 (145)
Adult Mail-Back Survey, n is the # of responses (Q6) * p < .05

96
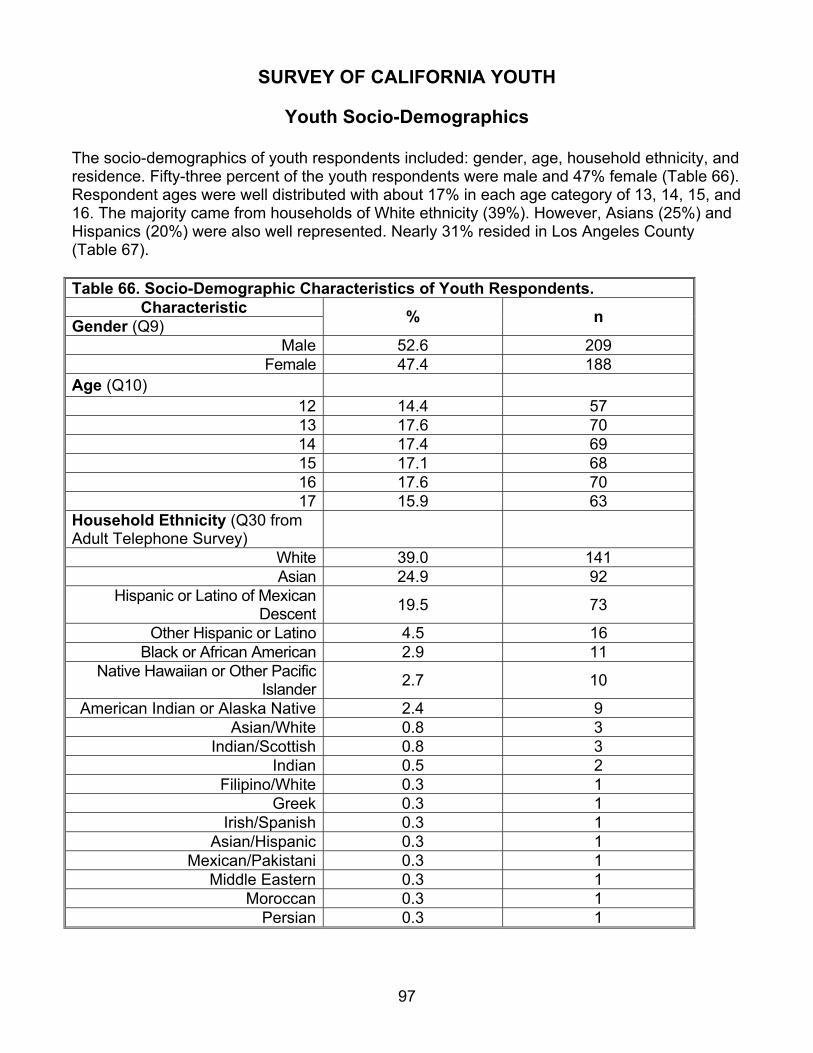
97
SURVEY OF CALIFORNIA YOUTH
Youth Socio-Demographics The socio-demographics of youth respondents included: gender, age, household ethnicity, and residence. Fifty-three percent of the youth respondents were male and 47% female (Table 66). Respondent ages were well distributed with about 17% in each age category of 13, 14, 15, and 16. The majority came from households of White ethnicity (39%). However, Asians (25%) and Hispanics (20%) were also well represented. Nearly 31% resided in Los Angeles County (Table 67). Table 66. Socio-Demographic Characteristics of Youth Respondents.
Characteristic Gender (Q9) % n
Male 52.6 209 Female 47.4 188
Age (Q10) 12 14.4 57 13 17.6 70 14 17.4 69 15 17.1 68 16 17.6 70 17 15.9 63
Household Ethnicity (Q30 from Adult Telephone Survey)
White 39.0 141 Asian 24.9 92
Hispanic or Latino of Mexican Descent 19.5 73
Other Hispanic or Latino 4.5 16 Black or African American 2.9 11
Native Hawaiian or Other Pacific Islander 2.7 10
American Indian or Alaska Native 2.4 9 Asian/White 0.8 3
Indian/Scottish 0.8 3 Indian 0.5 2
Filipino/White 0.3 1 Greek 0.3 1
Irish/Spanish 0.3 1 Asian/Hispanic 0.3 1
Mexican/Pakistani 0.3 1 Middle Eastern 0.3 1
Moroccan 0.3 1 Persian 0.3 1

98
Table 67. Youth Respondents’ County of Residence. County % n Los Angeles 30.7 95 Orange 8.7 27 Sacramento 7.8 24 San Diego 7.8 24 San Francisco 5.5 17 Riverside 5.2 16 Santa Clara 5.2 16 Alameda 4.9 15 Contra Costa 4.2 13 Fresno 3.2 10 San Bernardino 3.2 10 Kern 1.9 6 San Mateo 1.9 6 Solano 1.6 5 San Joaquin 1.3 4 Stanislaus 1.3 4 Placer 1.0 3 Shasta 1.0 3 Butte .6 2 Marin .6 2 Sonoma .6 2 Kings .3 1 Madera .3 1 Merced .3 1 Tulare .3 1 Yuba .3 1 Adult Telephone Survey (Q31)

99
Characteristics of Youth Respondents’ Favorite Outdoor Activities California youth participate in a wide-variety of outdoor activities Data from the 2008 youth survey suggest that California youth participate in a wide variety of outdoor activities. Their favorite activities, and those with the highest participation levels, included walking, swimming, organized sports, running, and playing in the park. While most of these activities do not require specialized skills or equipment, youth desired to participate more often in activities that do require specialization. Youth primarily participated in outdoor activities because they were “fun and enjoyable”, “to do something with their friends and family”, or to be “outside.” California youth recreate locally, and often by themselves. The majority of youth used parks or recreation areas within their town or city and usually recreated with friends and immediate family members. Although California youths' recreation activities appeared to be social in nature, more than one third participated in their favorite activity by themselves.
Youths' Favorite Outdoor Activities Youth respondents were asked to indicate their favorite outdoor activity. The question was open-ended and therefore yielded a wide range of responses (Table 68). The most common outdoor activity reported was swimming (15%), followed by soccer (13%) and basketball (12%). Table 68. Favorite Outdoor Activity of Youth Respondents. Activity % n Swimming 15.4 61 Soccer 13.1 52 Basketball 12.1 48 Bicycling 8.8 35 Walking 6.8 27 Football 6.3 25 Tennis 6.3 25 Hiking 5.8 23 Running 5.8 23 Baseball 4.5 18 Camping 4.0 16 Skateboarding 4.0 16 Sports 3.8 15 Volleyball 2.8 11 Softball 2.5 10 Going to the Beach 2.0 8 OHV Riding 1.5 6 Beach Volleyball 1.3 5 Going to the Park 1.3 5 Skating 1.3 5 Snowboarding 1.3 5 Cheerleading 1.0 4 Horseback Riding 1.0 4 Jogging 1.0 4

100
Table 68. Favorite Outdoor Activity of Youth Respondents. Activity % n Shopping 1.0 4 Surfing 1.0 4 Boating 0.8 3 Fishing 0.8 3 Hanging out with Friends 0.8 3 Jumping on a Trampoline 0.8 3 Lacrosse 0.8 3 Mountain Biking 0.8 3 Relaxing 0.8 3 Campfire 0.5 2 Cross Country Running 0.5 2 Dodgeball 0.5 2 Gardening 0.5 2 Golf 0.5 2 Hockey 0.5 2 Martial Arts 0.5 2 Riding a Scooter 0.5 2 Riding Motorcycles 0.5 2 Rollerblading 0.5 2 Rugby 0.5 2 Sunbathing 0.5 2 Swinging 0.5 2 Water Polo 0.5 2 Water Sports 0.5 2 Airsofting 0.3 1 All Outdoor Activities 0.3 1 Badminton 0.3 1 Canoeing 0.3 1 Climbing Trees 0.3 1 Cricket 0.3 1 Driving Remote Control Cars 0.3 1 Exercise 0.3 1 Field Hockey 0.3 1 Frisbee 0.3 1 Having Fun 0.3 1 Hide and Seek 0.3 1 Hula 0.3 1 Jump Rope 0.3 1 Nature Photography 0.3 1 Playing Tag 0.3 1 Playing with Friends 0.3 1 Rafting 0.3 1 Rock Climbing 0.3 1 Rope Climbing 0.3 1 Theater 0.3 1

101
Table 68. Favorite Outdoor Activity of Youth Respondents. Activity % n Track and Field 0.3 1 Weightlifting 0.3 1 (Q1) When asked why these activities were their favorites, the majority of youth said it was for “fun and enjoyment” (83.9%) and “to do something with their friends and family” (68%) (Table 69). Fifty-percent said their activity was their favorite because they could be “outside.” Table 69. Reason Why Youth Respondents’ Outdoor Activities Are Their Favorites. Reason % n For fun and enjoyment 83.9 333
To do something with my friends or family 67.8 269
For exercise or fitness 61.5 244
To be outside 49.9 198 (Q2)

102
Youths' Favorite Activity Location Youth prefer local recreational opportunities most likely due to their dependence on adults for transportation beyond their local facilities. California youth respondents were asked for the location where they participated in their favorite activities. Thirty-two percent of youth respondents reported equal participation in their favorite activity in other areas or parks both in and outside of their neighborhood, but within their town or city (Table 70). Less than 12% of youth participated in their favorite outdoor activity in their own yard. Other open-ended responses were reported with the most common location being school (n = 11). Table 70. Places Where Youth Respondents Participate in Their Favorite Outdoor Activities. Place % n Other area or park in my neighborhood 31.5 125 Other area or park outside of my neighborhood, but within my town/city
31.5 125
Other area or park outside my town/city 14.9 59 My yard 13.1 52 Other: 11.8 47
School 2.8 11 Anywhere 1.5 6
Beach 1.3 5 Relative's House 1.0 4
Gym 0.8 3 Desert 0.5 2
Mountains 0.5 2 Trails 0.5 2 Camp 0.3 1
Garage 0.3 1 In the Country 0.3 1
Lake 0.3 1 Local Program 0.3 1
My room 0.3 1 OHV parks 0.3 1
Pools 0.3 1 Ranch 0.3 1
Stadium 0.3 1 Street 0.3 1 Studio 0.3 1
(Q4)

103
Youth Group Characteristics When asked who they participate with, the majority of youth respondents reported participating in their favorite activity with friends (86%) and immediate family members (57%) (Table 71). Interestingly, approximately 35% of youth participated in their favorite activity by themselves. Table 71. People Youth Respondents Participate With in Their Favorite Outdoor Activities. People Participated With % n Friends 85.6 340
Immediate Family 56.5 224
Alone 35.3 140 Extended Family 25.7 102
Other 7.0 26
Sports Team/Camps 5.0 20 Teachers, Church, Community Members 1.1 4 (Q3)

104

105
Youth Respondent Activity Participation and Latent Demand Three-quarters of youth reported walking on streets/sidewalks/paths/trails in their community, swimming in a pool, jogging or running, and playing in a park. Fewer than 10% of youth reported participating in hunting, snowmobiling, and cross-country skiing. Over the last five years, youth participation in jogging/running, swimming in natural water sources, surfing/boogie boarding, and tennis has increased. Youth participation in wildlife viewing, bicycling on paved surfaces, picnicking, and scenic driving has decreased. Youth expressed unmet demand for horseback riding, sledding/ice-skating/snow play, snowboarding, swimming in a pool, and using jet skis or wave runners. When asked which activities youth respondents participated in during the past 12 months, at least 75% reported walking on streets/sidewalks/paths/trails in their community, swimming in a pool, jogging or running, and playing in a park (Table 72). Fewer than 10% of youth reported participating in hunting, snowmobiling, and cross-country skiing. Although the 2002 youth survey produced a smaller than expected, number of responses (144), general trends can still be assessed when comparing it to the relatively larger 2008 sample (397). Youth participation in outdoor recreation remained relatively stable from 2002 vs. 2008 for most activities. However, several activities did experience apparent changes in participation. In 2008, more California youth participated in jogging/running, swimming in natural water sources, surfing/boogie boarding, and tennis. Activities with fewer participants in 2008 included wildlife viewing, bicycling on paved surfaces, picnicking, and scenic driving (Table 73). Table 72. Recreation Activity Participation of Youth Respondents During the Past 12 Months.
Participated in Past 12 Months Activity
% Yes n Walking on streets, sidewalks, paths, or trails in your community 85.9 341
Swimming in a pool 82.9 329 Jogging or running 79.8 317 Playing in a park (games, kite flying, catch with a ball, Frisbee, play structure, swing set, etc.) 75.1 298
Beach activities, surf play (including sunbathing, wading, playing on beach) 69.8 277
Attending outdoor events (festivals, fairs, concerts, historical reenactments, outdoor theatre) 67.8 269
Swimming in ocean, lakes, rivers, and streams 67.8 269 Visiting historical or cultural sites, museums, zoos, gardens 64.7 257
Team sports (baseball, soccer, softball, football, basketball, volleyball, etc.) 62.5 248
Bicycling (on paved surfaces) 54.7 217 Day hiking 51.1 203

106
Table 72. Recreation Activity Participation of Youth Respondents During the Past 12 Months.
Participated in Past 12 Months Activity
% Yes n Picnicking 50.6 201 Going on a scenic drive with someone 47.9 190 Camping (tent, recreational vehicle, trailer) 45.1 179 Wildlife viewing and watching 37.3 148 Surfing or boogie boarding 34.5 137 Tennis 34.3 136 Skateboarding (skate parks, paths, sidewalks) 33.8 134 Sledding, ice skating, snow play 33.5 133 Fishing 29.2 116 Mountain biking (unpaved dirt surfaces, trails) 27.7 110 Exploring tide pools 27.0 107 In-line skating or rollerblading 25.7 102 Off-road vehicle use (motocross, ATVs, dune buggies, 4 wheel drive) 25.4 101
Paddle sports (kayaking, canoeing, rowing, rafting) 24.4 97
Rock climbing 24.4 97 Golf 23.7 94 Target shooting 19.1 76 Horseback riding 17.9 71 Snowboarding 17.9 71 Waterskiing or wakeboarding 16.9 67 Martial arts/tai chi/yoga 15.9 63 Archery 15.1 60 Downhill skiing (snow skiing with a lift) 15.1 60 Backpacking (overnight hiking) 14.4 57 Jet skis or wave runners 12.3 49 Hunting 9.3 37 Snowmobiling 5.5 22 Cross-country skiing 3.3 13 Other:
Reading/Library 1.8 7 Dance 1.5 6
Exercise (gym, weightlifting) 0.8 3 Theater/Movies 0.8 3
Boating 0.5 2

107
Table 72. Recreation Activity Participation of Youth Respondents During the Past 12 Months.
Participated in Past 12 Months Activity
% Yes n Cheerleading 0.5 2
Gymnastics 0.5 2 Vacation/Travel 0.5 2
Amusement Parks 0.3 1 Bowling 0.3 1 Boxing 0.3 1
Bull-Riding 0.3 1 Dodgeball 0.3 1
Four Square 0.3 1 Handball 0.3 1
Hula 0.3 1 Letterboxing 0.3 1
Play Guitar 0.3 1 Play with Dog 0.3 1
Riding Scooters 0.3 1 Science Fair 0.3 1
Shopping 0.3 1 Track and Field 0.3 1
Trampoline 0.3 1 Video Games 0.3 1
(Q6) Table 73. Recreation Activity Participation of Youth Respondents During the Past 12 Months, 2002 vs. 2008.
Participated in Past 12 Months Activity
2002 % 2008 % Walking on streets, sidewalks, paths, or trails in your community 92.0 85.9 Swimming in a pool 80.7 82.9 Jogging or running 54.3 79.8 Beach activities, surf play (including sunbathing, wading, playing on beach) 78.7 69.8 Attending outdoor events (festivals, fairs, concerts, historical reenactments, outdoor theatre) 76.3 67.8 Swimming in ocean, lakes, rivers, and streams 43.7 67.8

108
Table 73. Recreation Activity Participation of Youth Respondents During the Past 12 Months, 2002 vs. 2008.
Participated in Past 12 Months Activity
2002 % 2008 % Visiting historical or cultural sites, museums, zoos, gardens 75.2 64.7 Bicycling (on paved surfaces) 72.1 54.7 Day hiking 64.2 51.1 Picnicking 72.3 50.6 Going on a scenic drive with someone 68.4 47.9 Wildlife viewing and watching 64.7 37.3 Surfing or boogie boarding 19.2 34.5 Tennis 20.9 34.3 Skateboarding (skate parks, paths, sidewalks) 34.6 33.8 Sledding, ice skating, snow play 37.1 33.5 Mountain biking (unpaved dirt surfaces, trails) 33.1 27.7 In-line skating or rollerblading 29.5 25.7 Off-road vehicle use (motocross, ATVs, dune buggies, 4 wheel drive) 29.0 25.4 Paddle sports (kayaking, canoeing, rowing, rafting) 31.8 24.4 Rock climbing 27.9 24.4 Golf 23.7 23.7 Target shooting 20.6 19.1 Horseback riding 28.0 17.9 Snowboarding 19.1 17.9 Waterskiing or wakeboarding 17.7 16.9 Archery 11.6 15.1 Downhill skiing (snow skiing with a lift) 17.7 15.1 Backpacking (overnight hiking) 25.2 14.4 Hunting 11.5 9.3 Snowmobiling 3.9 5.5 Cross-country skiing 6.9 3.3 * Not all activities were the same in the 2002 and 2008 surveys. Therefore, only those used in both surveys are displayed. (Q6) Among the activities youth participated in, when asked which ones they would like to participate in more, the majority chose: horseback riding (47%), sledding/ice-skating/snow play (45%), snowboarding (45%), swimming in a pool (45%), and jet skis or wave runners (45%) (Table 74).

109
There is a very large discrepancy in latent demand activities between 2002 and 2008. This is most likely due to the differences in measuring all activities for latent demand in 2008 and an open-ended item that limited latent demand to five activities in 2002. Table 74. Activities Youth Respondents Would Like to Participate in More Often.
Would Participate More Often? Activity % Yes n Horseback riding 46.9 186 Sledding, ice skating, snow play 45.1 179 Snowboarding 45.1 179 Swimming in a pool 44.8 178 Jet skis or wave runners 44.6 177 Rock climbing 43.8 174 Beach activities, surf play (including sunbathing, wading, playing on beach) 43.6 173 Off-road vehicle use (motocross, ATVs, dune buggies, 4 wheel drive) 43.1 171 Surfing or boogie boarding 42.8 170 Waterskiing or wakeboarding 42.1 167 Swimming in ocean, lakes, rivers, and streams 41.3 164 Archery 41.1 163 Camping (tent, recreational vehicle, trailer) 41.1 163 Attending outdoor events (festivals, fairs, concerts, historical reenactments, outdoor theatre) 40.8 162 Paddle sports (kayaking, canoeing, rowing, rafting) 39 155 Team sports (baseball, soccer, softball, football, basketball, volleyball, etc.) 38.8 154 Target shooting 38.5 153 Picnicking 38.3 152 Playing in a park (games, kite flying, catch with a ball, Frisbee, play structure, swing set, etc.) 37.8 150 Backpacking (overnight hiking) 37.3 148 Mountain biking (unpaved dirt surfaces, trails) 36.8 146 Snowmobiling 36.8 146 Downhill skiing (snow skiing with a lift) 36.5 145 Exploring tide pools 36.5 145 Visiting historical or cultural sites, museums, zoos, gardens 33.8 134 Going on a scenic drive with someone 33.5 133 Day hiking 33.2 132 Martial arts/tai chi/yoga 32.7 130 Bicycling (on paved surfaces) 32.5 129 Fishing 32 127 Wildlife viewing and watching 30.7 122

110
Table 74. Activities Youth Respondents Would Like to Participate in More Often. Would Participate More Often? Activity % Yes n
Jogging or running 30.5 121 Skateboarding (skate parks, paths, sidewalks) 29.5 117 Tennis 29.2 116 Walking on streets, sidewalks, paths, or trails in your community 28.5 113 In-line skating or rollerblading 26.4 105 Hunting 26.2 104 Cross-country skiing 25.7 102 Golf 23.9 95 Other:
Reading/Library 0.3 1 Dance 0.3 4
Exercise (gym, weightlifting) 0.3 0 Theater/Movies 0.5 1
Boating 0.0 2 Cheerleading 0.3 1
Gymnastics 0.0 2 Vacation/Travel 0.5 2
Amusement Parks 0.3 1 Bowling 0.3 1 Boxing 0.3 1
Bull-Riding 0.3 1 Dodgeball 0.3 1
Four Square 0.0 1 Handball 0.3 1
Hula 0.0 1 Letterboxing 0.3 1
Play Guitar 0.3 1 Play with Dog 0.0 1
Riding Scooters 0.3 1 Science Fair 0.5 0
Shopping 0.3 0 Track and Field 0.3 0
(Q6)

111
Table 75. Activities Youth Respondents Would Like to Participate in More Often, 2002 vs. 2008.
Would Participate More Often Activity 2002 % 2008 % Horseback riding 10.0 46.9 Sledding, ice skating, snow play 0.7 45.1 Snowboarding 8.1 45.1 Swimming in a pool 5.1 44.8 Jet skis or wave runners 10.5 44.6 Rock climbing 5.8 43.8 Beach activities, surf play (including sunbathing, wading, playing on beach) 22.3 43.6 Off-road vehicle use (motocross, ATVs, dune buggies, 4 wheel drive) 11.4 43.1 Surfing or boogie boarding 9.5 42.8 Waterskiing or wakeboarding 8.6 42.1 Archery 7.6 41.1 Attending outdoor events (festivals, fairs, concerts, historical reenactments, outdoor theatre) 5.8 40.8 Paddle sports (kayaking, canoeing, rowing, rafting) 0.0 39 Target shooting 3.2 38.5 Picnicking 5.8 38.3 Backpacking (overnight hiking) 3.7 37.3 Mountain biking (unpaved dirt surfaces, trails) 7.6 36.8 Snowmobiling 2.8 36.8 Downhill skiing (snow skiing with a lift) 2.1 36.5 Visiting historical or cultural sites, museums, zoos, gardens 6.5 33.8 Going on a scenic drive with someone 8.3 33.5 Day hiking 7.9 33.2 Bicycling (on paved surfaces) 15.4 32.5 Wildlife viewing and watching 7.4 30.7 Jogging or running 4.9 30.5 Skateboarding (skate parks, paths, sidewalks) 7.7 29.5 Tennis 5.1 29.2 Walking on streets, sidewalks, paths, or trails in your community 14.0 28.5 In-line skating or rollerblading 4.6 26.4 Hunting 6.0 26.2 Cross-country skiing 14.9 25.7 Golf 4.2 23.9 * Not all activities were the same in the 2002 and 2008 surveys. Therefore, only those used in both surveys are displayed. (Q6)

112

113
Children’s Outdoor Bill of Rights Youth are participating in COBR activities. The majority of California youth had participated in 6 of the 10 activities in the California Children’s Outdoor Bill of Rights including playing in the water, playing in a safe place, hiking/biking/riding on a trail, exploring nature outdoors, visiting a California historic site/museum, and learning to swim. If they had not participated in these activities before the age of 14, the most common responses given were that they didn’t know or didn’t remember why, they thought the activity was boring, or they had no reason. The fact that many youth indicated “boring” as their primary reason for not participating is interesting and is perhaps related to a lack of exposure to these activities. It may also be related to the increasingly important role technology plays in the lives of California youth, and that activities which do not require technology may be perceived as boring. Those who had participated in them primarily did so because of family and/or friends, they thought the activity was fun and enjoyable, or the activity was part of an organized or educational trip.
Youth Participation in the 10 Children’s Outdoor Bill of Rights Activities
Youth respondents were asked to indicate if they had participated in 10 activities before the age of 14 that are included in the California Children’s Outdoor Bill of Rights (Table 76). At least 80% had played in the water, played in a safe place, hiked/biked/rode on a trail, explored nature outdoors, visited a California historic site/museum, and learned to swim. The lowest participation was reported for catching a fish. However, nearly 58% had reported doing this, which still reflected the majority of respondents. According to the U.S. Fish and Wildlife Service, youth participation in fishing (and hunting) has leveled off after a steady period of decline from 1990 to 2000. Although fishing was the least popular activity on the Children’s Outdoor Bill of Rights, the fact that over half of the respondents indicated they had engaged in the activity is promising.
Table 76. Activities Youth Respondents Participated in Before the Age of 14. Activity % n Play in the water 94.5 375 Play in a safe place 87.7 348 Hike, bike, or ride on a trail 85.1 338 Explore nature outdoors 84.9 337 Visit a California historic site or history museum 84.6 336 Learn to swim 84.4 335 Play on a sports team 75.8 301 Celebrate your heritage 74.1 294 Go camping overnight 73.8 293 Catch a fish 57.9 230 (Q5)

114
Why Youth Did and Did Not Participate in the 10 Children's Outdoor Bill of Rights Activities
If youth respondents did not participate in the 10 Children’s Outdoor Bill of Rights before the age of 14, they were asked to provide open-ended comments explaining why. Many respondents misinterpreted the question and instead, provided reasons why they did participate. Responses were categorized and revealed similar trends among all 10 activities (Tables 77 through 96). The primary reasons youth respondents did not participate in these 10 activities were that they did not know or didn’t remember, they thought the activity was boring, or they did not have a reason. Among those who reported why they did participate, the most common reasons were family or friends, it was fun or enjoyable, and the activity was part of an organized or educational trip. For specific responses, please refer to Appendices B-4 through B-23. 1. Visit a California Historic Site or Museum
Table 77. Reasons Why Youth Did Not Visit a California Historic Site or History Museum Before the Age of 14. Reason n Don't Know/Don't Remember/No reason 34 Boring/Not Interested 14 Didn't Know of Opportunity 4 Distance 4 Time 3 Other Activities 1 Family 1 Cost 1 Special Needs 1 (Q5) Table 78. Reasons Why Youth Visited a California Historic Site or History Museum Before the Age of 14. Reason n Organized Educational Trip 26 Personal Interest/Education 8 Family 9 Fun/Interesting 5 No Choice 2 (Q5)

115
2. Play in the Water Table 79. Reasons Why Youth Did Not Play in the Water Before the Age of 14. Reason n No Reason 18 Can Not Swim 1 Time 1 Water Quality 1 (Q5) Table 80. Reasons Why Youth Played in the Water Before the Age of 14. Reason n Fun 32 Temperature 10 Trip/Vacation 5 Family/Friends 4 To Learn 2 Availability 1 Exercise 1 (Q5) 3. Play in a Safe Place Table 81. Reasons Why Youth Did Not Play in a Safe Place Before the Age of 14. Reason n No Reason 37 Boring 6 Location 3 Risk 2 Other 2
Table 82. Reasons Why Youth Played in a Safe Place Before the Age of 14. Reason n Safety 13 Fun 12 Organized Trip/School 3 Location 1 Other 3 (Q5)

116
4. Go Camping Overnight Table 83. Reasons Why Youth Did Not Go Camping Overnight Before the Age of 14. Reason n No Reason 47 No Interest/Boring 16 Time 12 Family/Friends 10 Location 4 Never Tried 4 Environment 3 No Amenities 3 Safety 3 Cost 2 Skills 2 (Q5) Table 84. Reasons Why Youth Went Camping Overnight Before the Age of 14. Reason n Family/Friends 13 Fun/Interested 12 Organized Group Event 5 Enjoy Outdoors 3 (Q5) 5. Explore Nature Outdoors
Table 85. Reasons Why Youth Did Not Explore Nature Outdoors Before the Age of 14. Reason n No Reason 41 Not Interested/Do Not Like It 10 Boring 3 Time 3 Friends 1 No Choice 1 Safety 1

117
Table 86. Reasons Why Youth Explored Nature Outdoors Before the Age of 14. Reason n Organized Group 9 Interested/Enjoy 7 Environment 5 Family 4 See New Things 4 Education 2 Available 1 Other 2 (Q5) 6. Learn to Swim Table 87. Reasons Why Youth Did Not Learn to Swim Before the Age of 14. Reason n Don't Know/No Reason 38 Fear 7 No Opportunity 7 Already Know How 5 Time 4 Boring/Not Interested 3 Personal 2 (Q5) Table 88. Reasons Why Youth Learned to Swim Before the Age of 14. Reason n Safety/Education 16 Enjoyment 9 Opportunity 4 Family /Friends 1 (Q5)

118
7. Play on a Sports Team Table 89. Reasons Why Youth Did Not Play on a Sports Team Before the Age of 14. Reason N No Reason 34 Boring/Not Interested 33 Time 9 Other 8 Skill 5 Cost 4 Family 3 Personal 3 Safety 1 (Q5) Table 90. Reasons Why Youth Played on a Sports Team Before the Age of 14. Reason n Enjoyment/Fun 12 Exercise/Fitness 6 Other 3 School 3 Friends 2 Skill 2 No Choice 1 Competition 1 (Q5) 8. Hike, Bike, or Ride on a Trail Table 91. Reasons Why Youth Did Not Hike, Bike, or Ride on a Trail Before the Age of 14. Reason n No Reason 41 Boring/Not Interested 7 Equipment 4 Time 3 Other 2 Health 1 No Opportunity 1 (Q5)

119
Table 92. Reasons Why Youth Hiked, Biked, or Rode on a Trail Before the Age of 14. Reason n Enjoyment 8 Family/Friends 8 Exercise/Fitness 7 Organized Group 5 Environment 3 Other 3 In Conjunction with Other Activity 1 (Q5) 9. Catch a Fish
Table 93. Reasons Why Youth Did Not Catch a Fish Before the Age of 14. Reason N No Reason/Don't Know 59 Not Interested/Do Not Like It/Boring 35 No Opportunity 32 Skill/Equipment 18 Do Not Like/Eat Fish 9 Time/Other Obligations 5 Anti-Fishing 4 Other 1 (Q5)
Table 94. Reasons Why Youth Caught a Fish Before the Age of 14. Reason n Family/Friends 8 Fun/Relaxation 6 Skill 5 Food 4 Interested 3 Organized Group 1 (Q5)

120
10. Celebrate Their Heritage Table 95. Reasons Why Youth Did Not Celebrate Their Heritage Before the Age of 14. Reason n No Reason/Don' Know 64 Do Not Have One 12 Not Interested/Do Not Like/Do Not Care 10 Family is Local 5 Not Likely to Happen 3 Boring 2 Other Obligations 2 Other 1 (Q5) Table 96. Reasons Why Youth Celebrated Their Heritage Before the Age of 14. Reason n Family 16 Specific Event 5 Education 2 Enjoyment 2 Food/Party 2 (Q5) Although the Children’s Outdoor Bill of Rights results seem promising on the surface, there are a number of areas of concern. First, approximately one in four children have not had the opportunity to play on a team, celebrate their heritage or go camping overnight. More alarming, is the fact that nearly every activity received comments about it being boring, or a lack of interest among children. The need to introduce outdoor recreation and education to children at a young age is evident. Personal interest, having fun, and being with friends and family account for the six of the top ten reasons that youth do these activities. Since many of the children are already participating in these activities within formal educational and recreational settings, further emphasis should be placed on these avenues to overcome nationwide concerns about declining participation in outdoor and physical activities among youth.

121
Constraints to Youth Participation in Outdoor Recreation California youth are busy. Although youth were active in outdoor activities, they found it difficult to participate because they were too busy. Almost half of youth also said they would rather be on the Internet and that it was too hot or cold outside. This data suggests that when faced with a choice, indoor activities may be preferred over outdoor ones. To help youth participate in outdoor activities more often, they suggested providing more recreation areas closer to their home, areas for activities that are just for kids their age, and having equipment available. Forty-one percent of the youth respondents were too busy to participate in outdoor activities and 49.6% were sometimes too busy (Table 97). In addition, 47% would sometimes rather be on the Internet and 47% indicated it is sometimes too hot or cold outside. One in four youth (25%) do not have a family member to do outdoor activities with. Other constraints mentioned by youth respondents in their open-ended responses included other obligations (n = 10), no one to participate with (n = 9), too tired or sick (n = 9), and not interested (n = 8) (Table 98) (Appendix B-2). Although this question was asked differently in the 2008 survey, responses in the 2002 identified similar constraints to participation in outdoor activities. Table 97. Reasons Youth Respondents are Kept from Participating in Outdoor Activities.
Yes No SometimesReason % n % n % n I’m too busy (with homework, after-school activities, chores, work) 41.3 164 9.1 36 49.6 197
I’d rather be on the Internet (MySpace, surfing the web) or playing video games 21.2 84 31.6 125 47.2 187
It is too hot or cold outside (or other weather reasons) 21.0 83 31.8 126 47.2 187
It isn’t safe to do these activities near where I live (because of crime or gang activity) 11.6 46 73.2 290 15.2 60
My parents or guardians think the activities are too dangerous (I might hurt myself) 11.6 46 65.8 260 22.5 89
A recreation area or park is too far away to walk, drive or ride my bike 21.8 86 56.9 224 21.3 84
My parents or guardians can’t afford the activities I would like to do 14.9 59 55.8 221 29.3 116
No one in my family does these activities 25.1 99 52.4 207 22.5 89 I don’t know how to do these activities 17.2 68 51.9 295 30.9 122 I’d rather be watching TV 15.9 63 46.2 183 37.9 150 My friends don’t want to do the outdoor activities that I want to do 15.2 60 43.5 172 41.3 163
(Q8)

122
Table 98. Other Reasons Youth Respondents are Kept from Participating in Outdoor Activities- - Open-Ended Responses. Reason n Other Obligations 10 No One to Participate With 9 Too Tired/Sick 9 Not Interested 8 Parents 7 Distance 6 Clean/Safe 4 Can Not Get There 2 Crowding 2 Cost 1 Weather 1 Other 2 (Q8) Youth respondents were asked to select actions that could help them participate in outdoor activities more often (Table 99). The majority suggested: 1) providing more recreation areas closer to their home (65%); 2) providing areas for activities that are just for kids their age (56%); and 3) providing equipment (56%). Providing safer ways to get to recreation areas close to their home was only perceived as helpful by 37% of youth respondents. Other actions reported by youth in open-ended responses primarily included having more opportunities and/or facilities (n = 15) and affordability of recreation activities (n = 11) (Table 100) (Appendix B-3).
Table 99. Actions That Could Help Youth Respondents Participate in Outdoor Activities More Often. Action % n Provide more recreation areas closer to my home (sports fields, skateboard parks, open space areas) 65.2 259
Provide areas for these activities that are just for kids my age 56.4 224 Provide equipment (like sports equipment, playground equipment) 55.7 221 Provide instruction or lessons 45.8 182 Provide transportation to recreation areas and activities 41.3 164 Provide safer ways to get to recreation areas close to my home 37.3 148 (Q7)

123
Table 100. Other Actions That Could Help Youth Respondents Participate in Outdoor Activities More Often- - Open-Ended Responses. Action n More Opportunities/Facilities 15 Affordability 11 Fewer Obligations 3 Safety 3 Opportunities to Meet Others 3 Less Crowding 1 Other 2 (Q7)

124

125
REGIONAL RECREATION PATTERNS
Regional Socio-Demographics The adult telephone and mail-back survey results were divided into seven regions, each with a percentage of the total survey sample closely matching the percentage of the state's population living in those regions based on the 2000 census. The regions follow county boundaries and are listed below:
Northern California Shasta Humboldt Mendocino Lake Tehama Siskiyou Lassen Del Norte Glenn Plumas Trinity Modoc Sierra Sierra Placer El Dorado Nevada Tuolumne Calaveras Amador Mariposa Inyo
Mono Alpine Central Valley Sacramento Fresno Kern San Joaquin Stanislaus Tulare Merced Butte Yolo Kings Sutter Yuba Colusa San Francisco Bay Area Santa Clara Alameda Contra Costa San Francisco
San Mateo Sonoma Solano Marin Napa Central Coast Monterey Santa Barbara San Luis Obispo Santa Cruz San Benito Los Angeles Los Angeles Ventura Southern California Orange San Diego Riverside San Bernardino Imperial

126
According to the demographics in the tables below, the Central Coast, San Francisco and Southern California regions have younger populations of respondents. The Central Valley, Northern California and Sierra regions had relatively older respondents. Los Angeles respondents had an equitable spread of age ranges. Gender divisions were evenly spread across most of the regions, with the exception of the Sierra region where 63% of the respondents were male. Los Angeles had an ethnically diverse group of respondents, with only 49% of respondents coming from a single category (white). The Sierra region had 93% of its respondents coming from a single ethnic category (white). California's rapidly growing Hispanic population generated large percentages of respondents in the Southern California (29%) and Central Valley (28.4%) regions. Table 101. Socio-demographic Characteristics of Respondents by Region.
Central Coast
Central Valley
Los Angeles
Northern CA
San Francisco
Sierra Southern CA
Characteristics
% % % % % % %
Gender (Q32)
Male 44.9 49.3 54.8 44.1 48.8 62.5 51.8
Female 55.1 50.7 45.2 55.9 51.2 37.5 48.2 Total 100.0 100.0 100.0 100.0 100.0 100.0 100.0 Age (Q30A)
18 to 24 19.1 8.7 16.2 6.8 14.3 5.4 14.0
25 to 34 23.5 23.6 21.4 11.9 20.8 17.9 22.3 35 to 44 25.0 16.2 21.9 18.6 26.8 21.4 23.1 45 to 54 13.2 20.6 18.6 25.4 15.1 25.0 17.1 55 to 64 9.6 11.2 10.6 16.9 9.4 12.5 10.8 65 or over 9.6 18.4 11.3 20.3 13.4 17.9 12.6 Refused 1.2 0.1 0.2 0.1 Total 100.0 100.0 100.0 100.0 100.0 100.0 100.0 Ethnicity (Q30)
White 75 62.9 48.9 89.8 58.7 92.9 59.7
Hispanic or Latino of Mexican Descent
18.4 28.4 2.9 11.9 16.4 3.6 29.0
Asian 10.3 4.7 9.8 1.7 16.1 5.4 8.1 Black or African
American 5.2 4.0 8.8 4.9 3.6 3.6
American Indian or Alaska Native
4.4 3.0 1.8 5.1 2.2 3.6 3.2
Other Hispanic or Latino, e.g., Guatemalan
2.2 2.2 7.5 1.7 4.9 3.6 5.2

127
Table 101. Socio-demographic Characteristics of Respondents by Region. Central Coast
Central Valley
Los Angeles
Northern CA
San Francisco
Sierra Southern CA
Characteristics
% % % % % % %
Native Hawaiian or Other Pacific Islander
1.5 0.7 1.2 1.7 1.7 0.0 1.1
Other race 2.2 1.7 2.5 1.7 3.7 1.8 1.3 Other mixed
race 0.0 0.6 0.6 0.0 0.3 0.0 0.3
Ethnicity percentage totals exceed 100% as respondents checked all that applied. Adult Telephone Survey
Northern California had a small percentage of single/never-married respondents (15.3%). The Central Valley had a large percentage of married respondents (62.2%). The Central Coast and Los Angeles regions had fewer than half of the respondents state that they were married. The Sierra region had a large percentage of respondents who had not graduated from high school (21.4%). Only 0.7% of respondents from the Central Coast had not graduated from high school. Northern California had many respondents who had some college but not a degree (45.8%). The Central Valley had a great diversity of education levels among its respondents. The Central Coast had a large percentage of respondents with bachelor’s degrees or higher (55.8%). The Sierra had a low percentage of Bachelor’s degree or higher (9%). Table 102. Socio-demographic Characteristics of Respondents by Region.
Central Coast
Central Valley
Los Angeles
Northern CA
San Francisco
Sierra Southern CA
Characteristics
% % % % % % % Marital status (Q27A)
Single, never married
36.8 21.6 34.3 15.3 28.9 25.0 24.5
Married 36.8 62.2 47.4 55.9 53.9 64.3 55.6 Living with
partner 8.8 1.7 4.5 5.1 2.9 3.5
Separated 1.5 0.7 0.6 0.7 1.8 1.3 Divorced 11.8 7.0 6.9 15.3 7.2 7.1 9.1 Widowed 2.2 5.5 4.7 8.5 5.2 1.8 4.5 Refused 2.2 1.2 1.6 1.3 1.5 Total 100.0 100.0 100.0 100.0 100.0 100.0 100.0 Household Status (Q28)
Living alone 17.6 13.9 15.5 20.3 16.9 16.1 15.3
Couple with no children under 18 at home
22.1 27.1 24.2 39.0 23.5 28.6 23.4

128
Table 102. Socio-demographic Characteristics of Respondents by Region. Central Coast
Central Valley
Los Angeles
Northern CA
San Francisco
Sierra Southern CA
Characteristics
% % % % % % % Couple with one
or more children under 18 at home
23.5 38.1 29.4 27.1 37.1 32.1 38.2
Single person(s) with children under 18 at home
8.8 5.2 5.5 4.9 5.4 4.8
Single person(s) with one or more children under 18 at home/children over 18 at home
7.2 8.6 1.7 9.2 8.7
Another living situation (specify below)
8.1 2.0 2.3 5.1 1.7 5.4 0.8
Living with roommates
16.9 3.7 9.8 5.1 3.9 12.5 5.9
Don’t know 0.1 Refused 2.9 2.7 4.5 1.7 2.9 2.9 Total 100.0 100.0 100.0 100.0 100.0 100.0 100.0 Education (Q27)
Did not graduate high school
0.7 7.0 5.8 1.7 5.5 21.4 7.0
High school graduate
11.0 22.6 17.4 16.9 15.9 33.9 19.5
Some college but no degree
19.1 21.1 24.3 45.8 20.3 7.1 26.8
Associate degree 13.2 14.2 10.4 10.2 9.7 28.6 10.6 Bachelor’s
degree 39.0 22.6 27.9 10.2 29.4 5.4 22.1
Master’s degree 11.0 6.5 9.3 15.3 11.2 1.8 8.4 Professional
degree (i.e. MD, JD, DDS, etc.)
2.9 2.0 1.7 2.2 1.8 2.1
Doctorate degree (i.e. PhD)
2.9 2.7 2.0 4.4 2.4
Don’t know 0.2 0.4 0.7 Refused 1.0 0.7 0.7 1.1 Total 100.0 100.0 100.0 100.0 100.0 100.0 100.0Adult Telephone Survey

129
The Central Coast had a high percentage of respondents with full-time employment (53.7%). A small percentage of student respondents came from Northern California (3.4%). Table 103. Socio-demographic Characteristics of Respondents by Region.
Central Coast
Central Valley
Los Angeles
Northern CA
San Francisco
Sierra Southern CA
Characteristics
% % % % % % % Employment Status (Q28A)
Employed full time
53.7 40.8 46.2 47.5 45.6 44.6 44.7
Employed part time
13.2 11.7 12.7 10.2 10.6 12.5 9.9
Retired 9.6 19.4 11.2 27.1 14.6 17.9 16.0 Student (full or
part-time) 9.6 5.2 8.0 3.4 8.2 3.6 7.7
Homemaker 5.9 11.2 9.0 5.1 10.1 7.1 10.4 Not employed,
but looking for work
4.4 3.0 4.7 3.9 5.4 4.1
Not employed and not looking for work
0.2 1.7 1.2 1.8 1.7
Other (please specify below)
3.7 5.7 5.4 5.1 4.7 7.1 3.9
Don’t know 0.1 Refused 2.7 1.2 1.7 1.2 1.5 Total 100.0 100.0 100.0 100.0 100.0 100.0 100.0 Adult Telephone Survey
Within the Central Coast, the highest percentage of their respondents were in the $20,000 to $35,000 income bracket (24.3%). Northern California and Sierra had the highest percentage of their respondents in the $50,000 to $75,000 income bracket (28.8% and 28.6%). Table 104. Socio-demographic Characteristics of Respondents by Region.
Central Coast
Central Valley
Los Angeles
Northern CA
San Francisco
Sierra Southern CA
Characteristics
% % % % % % % Total annual household income (Q29)
Under $20,000
12.5 15.9 17.0 10.2 12.2 7.1 17.2
$20,000 to $35,000
24.3 17.9 16.2 18.6 11.1 16.1 13.9
$35,000 to $50,000
16.9 13.4 12.2 25.4 11.9 25.0 12.9
$50,000 to 22.1 13.4 17.2 28.8 17.3 28.6 17.4

130
Table 104. Socio-demographic Characteristics of Respondents by Region. Central Coast
Central Valley
Los Angeles
Northern CA
San Francisco
Sierra Southern CA
Characteristics
% % % % % % % $75,000
$75,000 to $100,000
19.1 11.7 7.6 10.2 10.1 7.1 10.8
$100,000 to $150,000
3.7 7.0 9.5 3.4 9.7 10.7 8.4
$150,000 to $200,000
1.5 1.7 2.9 4.9 2.8
$200,000 or more
0.5 3.6 6.0 1.8 3.2
Don’t know 3.5 2.9 3.4 3.7 3.8 Refused 14.9 10.9 13.1 3.6 9.7 Total 100.0 100.0 100.0 100.0 100.0 100.0 100.0Adult Telephone Survey
When asked how long they had lived in California, respondents had lived in California an average of 32 years and in their local communities for 16 years. Sierra respondents had lived in their local community one third of the time they had lived in California. Central Valley respondents lived in their communities for more than half of the time they had lived in California on average. Table 105. Respondent Residence Characteristics by Region
Central Coast
Central Valley
Los Angeles
Northern CA
San Francisco Sierra
Southern CA
Mo Mo Mo Mo Mo Mo Mo How many years have you lived in California? 30.2 20.0 35.7 30.0 30.0 20.0 38.1 30.0 29.0 20.0 34.9 52.0 29.2 20.0How many years have you lived in your current community? 15.3 3.0 19.2 5.0 16.6 10.0 19.6 1.0 15.8 3.0 12.4 3.0 13.1 2.0Adult Telephone Survey (Q1, Q2) x = Mean, Mo = Mode
x x x x x x x

131
Regional Outdoor Recreation Behavior
Frequency of Outdoor Recreation Area Visitation Tables 106 through 115 show when respondents from each region made their last park visit, describe the frequency that respondents visited parks within the last month and last 12 months and detail the number of days respondents visited one of four types of outdoor recreation areas in the last 12 months. Central Coast had a very high percentage of respondents who visited a park in the last month, and 94% had visited a park within the last six months. Northern California had 95% percent of its respondents report visiting a park in the last six months. The greatest percentage of respondents within each region had visited a park within the last month. Table 106. Respondents Last Park Visit by Region
Central Coast
Central Valley
Los Angeles
Northern CA
San Francisco
Sierra Southern CA
Characteristic
% % % % % % % Within the LAST MONTH 83.8 64.7 74.4 83.1 77.3 73.2 72.3Within the LAST 2 - 6 MONTHS
10.3 19.2 13.0 11.9 12.2 12.5 15.7
Within the LAST 7- 12 MONTHS
1.5 8.9 5.2 5.1 4.7 5.4 5.0
More than 12 months ago 4.4 6.0 7.2 0.0 5.4 7.1 5.6Never 0.0 0.7 0.0 0.0 0.0 1.8 0.4Don't Know 0.0 0.5 0.2 0.0 0.3 0.0 1.0Total 100.0 100.0 100.0 100.0 100.0 100.0 100.0Adult Telephone Survey (Q3, Q3A, Q3B)
Table 107 shows the data from regional responses to the question “how many days in the last month did you visit a park or outdoor recreation area?” It also shows data from the next question, “During your last park or outdoor recreation area visit, how many minutes did you spend there?” Table 107. Respondent Park Visitation Characteristics by Region Central
Coast Central Valley
Los Angeles
Northern CA
San Francisco
Sierra Southern CA
Characteristic Mo Mo Mo Mo Mo Mo Mo# days visited in the last month
6.1 2.0 5.8 2.0 5.7 2.0 5.2 3.0 6.1 2.0 6.5 2.0 6.0 2.0
# hours spent during last visit
11.9 3.0 9.5 2.0 6.8 2.0 13.3 2.0 6.8 1.0 23.6 2.0 9.0 2.0
Adult Telephone Survey (Q4, Q5)
xxxxxxx

132
Table 108. Frequency of Park Visitation in Past 12 Months by Region
Central Coast
Central Valley
Los Angeles
Northern CA
San Francisco Sierra
Southern CA
Characteristic % % % % % % % Two or more times per week 14.0 18.8 22.9 15.3 22.7 18.2 20.4About once a week 16.9 9.8 14.3 13.6 14.9 18.2 16.7Once or twice a month 27.2 23.3 25.7 30.5 29.4 23.6 25.3Several times a year 25.7 23.1 17.7 25.4 17.6 18.2 19.7Once or twice a year 9.6 17.8 11.5 11.9 9.7 18.2 11.0Not at all 3.7 7.0 6.8 0.0 5.2 3.6 5.8Don’t know 2.9 0.3 1.2 3.4 0.5 0.0 1.1Total 100.0 100.0 100.0 100.0 100.0 100.0 100.0Adult Telephone Survey (Q6)
Over half of the respondents from the Central Coast, Northern California, and Southern California reported visiting historic or cultural buildings, sites, or areas from one to five days in the last 12 months. Only 19.4% of Sierra region respondents visited these areas more than 11 days per year. Most Central Coast respondents spent one to five days visiting all four types of outdoor recreation areas during the past twelve months. Of the types, most respondents visited historical or cultural areas one to five days during the past twelve months. The type of park Central Coast region respondents visited most frequently 21-50 days during the past twelve months was highly developed parks and recreation areas. Table 109. The Number of Days Respondents Visited Outdoor Recreation Areas During the Past 12 Months- Central Coast Region.
0 1-5 6-10 11-20 21-50 >50 TotalType of Outdoor Recreation Area % % % % % % %
Highly developed parks and recreation areas: In or near urban areas that may include playgrounds, sports facilities, and highly developed beaches; for example, city parks
17.7 33.3 7.3 18.8 14.6 8.3 100
Developed nature-oriented parks and recreation areas: Located outside or on the fringe of urban areas, including trails, picnic areas, campgrounds, and information centers. Generally includes national, state, large county and regional parks, beaches, reservoirs, and state and national recreation areas
7.3 36.5 16.7 24.0 8.3 7.3 100
Historical or cultural buildings, sites, or areas: Regardless of location
22.9 52.1 13.5 8.3 2.1 1.0 100
Natural and undeveloped areas: Large areas in a natural or nearly natural condition, with few developments; for example, forests, deserts, mountains, wetlands, and seashores
26.0 34.4 10.4 14.6 7.3 7.3 100
Adult Mail-Back Survey (Q4)

133
Most Central Valley respondents spent one to five days visiting all four types of outdoor recreation areas during the past twelve months. Of the types, respondents visited historical or cultural areas most frequently one to five days during the past twelve months. The type of park Central Valley region respondents visited most frequently 21-50 days during the past twelve months was highly developed parks and recreation areas. Table 110. The Number of Days Respondents Visited Outdoor Recreation Areas During the Past 12 Months- Central Valley Region.
0 1-5 6-10 11-20 21-50 >50 TotalType of Outdoor Recreation Area % % % % % % %
Highly developed parks and recreation areas: In or near urban areas that may include playgrounds, sports facilities, and highly developed beaches; for example, city parks
9.4 30.6 18.8 10.0 12.5 18.8 100.0
Developed nature-oriented parks and recreation areas: Located outside or on the fringe of urban areas, including trails, picnic areas, campgrounds, and information centers. Generally includes national, state, large county and regional parks, beaches, reservoirs, and state and national recreation areas
12.5 39.4 16.3 9.4 10.0 12.5 100.0
Historical or cultural buildings, sites, or areas: Regardless of location
20.0 42.5 14.4 6.9 1.3 15.0 100.0
Natural and undeveloped areas: Large areas in a natural or nearly natural condition, with few developments; for example, forests, deserts, mountains, wetlands, and seashores
23.1 30.6 13.1 11.9 5.0 16.3 100.0
Adult Mail-Back Survey (Q4)
Most Los Angeles respondents spent one to five days visiting all four types of outdoor recreation areas during the past twelve months. Of the types, respondents visited historical or cultural areas most frequently one to five days during the past twelve months. The type of park Los Angeles region respondents visited most frequently 21-50 days during the past twelve months was highly developed parks and recreation areas. Table 111. The Number of Days Respondents Visited Outdoor Recreation Areas During the Past 12 Months- Los Angeles Region.
0 1-5 6-10 11-20 21-50 >50 TotalType of Outdoor Recreation Area % % % % % % %
Highly developed parks and recreation areas: In or near urban areas that may include playgrounds, sports facilities, and highly developed beaches; for example, city parks
7.9 32.5 12.9 13.2 15.8 17.8 100.0

134
Table 111. The Number of Days Respondents Visited Outdoor Recreation Areas During the Past 12 Months- Los Angeles Region.
0 1-5 6-10 11-20 21-50 >50 TotalType of Outdoor Recreation Area % % % % % % %
Developed nature-oriented parks and recreation areas: Located outside or on the fringe of urban areas, including trails, picnic areas, campgrounds, and information centers. Generally includes national, state, large county and regional parks, beaches, reservoirs, and state and national recreation areas
14.9 43.9 11.4 8.8 9.4 11.7 100.0
Historical or cultural buildings, sites, or areas: Regardless of location
22.8 45.9 12.6 6.1 3.8 8.8 100.0
Natural and undeveloped areas: Large areas in a natural or nearly natural condition, with few developments; for example, forests, deserts, mountains, wetlands, and seashores
24.0 44.4 8.5 7.3 7.0 8.8 100.0
Adult Mail-Back Survey (Q4)
Most Northern California respondents spent one to five days visiting all four types of outdoor recreation areas during the past twelve months. Of the types, most respondents visited historical or cultural areas one to five days during the past twelve months. The type of park Northern California region respondents visited most frequently 21-50 days during the past twelve months was highly developed parks and recreation areas and natural and undeveloped areas. Table 112. The Number of Days Respondents Visited Outdoor Recreation Areas During the Past 12 Months- Northern CA Region.
0 1-5 6-10 11-20 21-50 >50 TotalType of Outdoor Recreation Area % % % % % % %
Highly developed parks and recreation areas: In or near urban areas that may include playgrounds, sports facilities, and highly developed beaches; for example, city parks
12.5 35.0 12.5 12.5 15.0 12.5 100.0
Developed nature-oriented parks and recreation areas: Located outside or on the fringe of urban areas, including trails, picnic areas, campgrounds, and information centers. Generally includes national, state, large county and regional parks, beaches, reservoirs, and state and national recreation areas
2.5 40.0 27.5 10.0 10.0 10.0 100.0
Historical or cultural buildings, sites, or areas: Regardless of location
17.5 57.5 12.5 5.0 2.5 5.0 100.0
Natural and undeveloped areas: Large areas in a natural or nearly natural condition, with few developments; for example, forests, deserts, mountains, wetlands, and seashores
10.0 40.0 12.5 12.5 15.0 10.0 100.0
Adult Mail-Back Survey (Q4)

135
Most San Francisco respondents spent one to five days visiting all four types of outdoor recreation areas during the past twelve months. Of the types, respondents visited historical or cultural areas most frequently one to five days during the past twelve months. The type of park San Francisco region respondents visited most frequently over 50 days during the past twelve months was highly developed parks and recreation areas. Table 113. The Number of Days Respondents Visited Outdoor Recreation Areas During the Past 12 Months- San Francisco Region.
0 1-5 6-10 11-20 21-50 >50 TotalType of Outdoor Recreation Area % % % % % % %
Highly developed parks and recreation areas: In or near urban areas that may include playgrounds, sports facilities, and highly developed beaches; for example, city parks
9.3 30.4 12.1 14.6 14.6 19.0 100.0
Developed nature-oriented parks and recreation areas: Located outside or on the fringe of urban areas, including trails, picnic areas, campgrounds, and information centers. Generally includes national, state, large county and regional parks, beaches, reservoirs, and state and national recreation areas
8.9 39.3 16.2 11.3 12.1 12.1 100.0
Historical or cultural buildings, sites, or areas: Regardless of location
21.5 43.3 17.4 6.5 3.2 8.1 100.0
Natural and undeveloped areas: Large areas in a natural or nearly natural condition, with few developments; for example, forests, deserts, mountains, wetlands, and seashores
22.7 39.3 12.6 9.3 5.3 10.9 100.0
Adult Mail-Back Survey (Q4)
Most Sierra respondents spent one to five days visiting all four types of outdoor recreation areas during the past twelve months. Of the types, most respondents visited develop nature-oriented parks and recreation areas and natural and undeveloped areas one to five days during the past twelve months. The type of park Sierra region respondents visited most frequently 21-50 days during the past twelve months was highly developed parks and recreation areas. Table 114. The Number of Days Respondents Visited Outdoor Recreation Areas During the Past 12 Months- Sierra Region.
0 1-5 6-10 11-20 21-50 >50 TotalType of Outdoor Recreation Area % % % % % % %
Highly developed parks and recreation areas: In or near urban areas that may include playgrounds, sports facilities, and highly developed beaches; for example, city parks
12.9 38.7 12.9 12.9 12.9 9.7 100.0

136
Table 114. The Number of Days Respondents Visited Outdoor Recreation Areas During the Past 12 Months- Sierra Region.
0 1-5 6-10 11-20 21-50 >50 TotalType of Outdoor Recreation Area % % % % % % %
Developed nature-oriented parks and recreation areas: Located outside or on the fringe of urban areas, including trails, picnic areas, campgrounds, and information centers. Generally includes national, state, large county and regional parks, beaches, reservoirs, and state and national recreation areas
9.7 51.6 19.4 9.7 6.5 3.2 100.0
Historical or cultural buildings, sites, or areas: Regardless of location
22.6 48.4 16.1 9.7 0.0 3.2 100.0
Natural and undeveloped areas: Large areas in a natural or nearly natural condition, with few developments; for example, forests, deserts, mountains, wetlands, and seashores
6.5 51.6 16.1 16.1 3.2 6.5 100.0
Adult Mail-Back Survey (Q4)
Most Southern California respondents spent one to five days visiting all four types of outdoor recreation areas during the past twelve months. Of the types, most respondents visited historical or cultural areas one to five days during the past twelve months. The type of park Southern California region respondents visited most frequently 21-50 days during the past twelve months was highly developed parks and recreation areas. Table 115. The Number of Days Respondents Visited Outdoor Recreation Areas During the Past 12 Months- Southern CA Region.
0 1-5 6-10 11-20 21-50 >50 TotalType of Outdoor Recreation Area % % % % % % %
Highly developed parks and recreation areas: In or near urban areas that may include playgrounds, sports facilities, and highly developed beaches; for example, city parks
9.7 31.3 16.8 12.6 15.8 13.9 100.0
Developed nature-oriented parks and recreation areas: Located outside or on the fringe of urban areas, including trails, picnic areas, campgrounds, and information centers. Generally includes national, state, large county and regional parks, beaches, reservoirs, and state and national recreation areas
15.2 42.6 14.5 12.3 6.1 9.4 100.0
Historical or cultural buildings, sites, or areas: Regardless of location
23.5 53.9 10.0 4.2 1.9 6.5 100.0
Natural and undeveloped areas: Large areas in a natural or nearly natural condition, with few developments; for example, forests, deserts, mountains, wetlands, and seashores
20.3 45.5 12.6 7.7 5.5 8.4 100.0
Adult Mail-Back Survey (Q4)

137
Regional Distances Traveled to Park and Recreation Areas The largest percentage of Central Coast respondents reported driving for 5 minutes or less or walking for 21 to 60 minutes to reach their most visited recreation destination. Table 116. Travel Time from Respondent’s Residence to Place Most Often Go for Recreation- Central Coast Region.
5 or less 6-10 11-20 21-60 > 60 TotalDistance in Minutes % % % % % %
Driving 34.4 18.4 23.2 9.6 14.4 100.0Walking 22.5 7.5 25.0 32.5 12.5 100.0Other
Bicycle 8.1 0.0 0.0 0.0 0.0 Public Transportation 3.7 0.0 0.0 0.0 0.0
Adult Telephone Survey (Q11)
The largest percentages of Central Valley respondents reported driving for less than five minutes, driving for more than 60 minutes, or walking for five or less minutes to the place they most often visit for recreation. Table 117. Travel Time from Respondent’s Residence to Place Most Often Go for Recreation- Central Valley Region.
5 or less 6-10 11-20 21-60 > 60 TotalDistance in Minutes
% % % % % %Driving 23.0 16.8 18.4 17.2 24.6 100.0Walking 35.4 25.0 13.9 16.0 9.7 100.0Other
Bicycle 2.0 0.0 0.0 0.0 0.0 Public Transportation 0.5 0.0 0.0 0.0 0.0
Wheelchair/Cart 0.2 0.0 0.0 0.0 0.0 Adult Telephone Survey (Q11)

138
The largest percentage of Los Angeles respondents spent five minutes or less walking or driving to their most visited recreation destination. Table 118. Travel Time from Respondent’s Residence to Place Most Often Go for Recreation- Los Angeles Region.
5 or less 6-10 11-20 21-60 > 60 TotalDistance in Minutes % % % % % %
Driving 31.4 20.8 19.9 18.5 9.5 100.0Walking 34.4 17.5 22.3 14.3 11.5 100.0Other
Bicycle 2.8 0.0 0.0 0.0 0.0 Public Transportation 2.0 0.0 0.0 0.0 0.0
Skateboard 0.2 0.0 0.0 0.0 0.0 Adult Telephone Survey (Q11)
The majority of respondents in Northern California spent 21-60 minutes driving or walking to their most frequent recreation destination. Table 119. Travel Time from Respondent’s Residence to Place Most Often Go for Recreation- Northern CA Region.
5 or less 6-10 11-20 21-60 > 60 TotalDistance in Minutes % % % % % %
Driving 16.1 10.7 19.6 35.7 17.9 100.0Walking 18.8 18.8 6.3 37.5 18.7 100.0Other
Bicycle 3.4 0.0 0.0 0.0 0.0 Adult Telephone Survey (Q11)
The largest percentage of San Francisco respondents spent five minutes or less walking or driving to their most visited recreation destination. Table 120. Travel Time from Respondent’s Residence to Place Most Often Go for Recreation- San Francisco Region.
5 or less 6-10 11-20 21-60 > 60 TotalDistance in Minutes % % % % % %
Driving 28.0 21.3 21.9 16.8 12.1 100.0Walking 38.0 19.7 22.3 13.1 7.0 100.0Other
Bicycle 2.7 0.0 0.0 0.0 0.0 Public Transportation 2.0 0.0 0.0 0.0 0.0
Wheelchair/Cart 0.2 0.0 0.0 0.0 0.0 Skateboard 0.2 0.0 0.0 0.0 0.0
Adult Telephone Survey (Q11)

139
The greatest percentages of Sierra respondents either drove for 21-60 minutes or walked five minutes or less to reach their most frequently visited recreation destination. Table 121. Travel Time from Respondent’s Residence to Place Most Often Go for Recreation- Sierra Region.
5 or less 6-10 11-20 21-60 > 60 TotalDistance in Minutes % % % % % %
Driving 21.7 17.4 17.4 28.3 15.2 100.0Walking 50.0 5.0 20.0 15.0 10.0 100.0Other
Bicycle 3.6 0.0 0.0 0.0 0.0 Public Transportation 1.8 0.0 0.0 0.0 0.0
Motorcycle 1.8 0.0 0.0 0.0 0.0 Adult Telephone Survey (Q11)
The largest percentage of Southern California respondents spent five minutes or less walking or driving to their most visited recreation destination. Table 122. Travel Time from Respondent’s Residence to Place Most Often Go for Recreation- Southern CA Region.
5 or less 6-10 11-20 21-60 > 60 TotalDistance in Minutes % % % % % %
Driving 28.8 17.7 21.9 19.3 12.3 100.0Walking 33.4 21.5 20.1 12.6 12.3 100.0Other
Bicycle 2.1 Public Transportation 1.0
Wheelchair/Cart 0.3 Adult Telephone Survey (Q11)

140
Regional Visitor Group Characteristics A large percentage of Central Valley respondents (63.2%) visited a park with just family. A large percentage of Northern California respondents (50.8%) visited a park with family and friends. Over half of the Central Coast respondents (55.2%) either visited a park alone or with just friends. Almost a third of the Northern California respondents (27.1) visited a park with their pet. It was very unlikely that respondents from the Central Valley would visit a park alone; only 8.3% did so. Table 123. Companions Who Accompany Respondents to a Park by Region Central
Coast Central Valley
Los Angeles
Northern CA
San Francisco
Sierra Southern CA
Companion % % % % % % % Just Family 44.1 63.2 52.5 55.9 54.9 50.9 57.4Both Family and Friends at the same time
39.0 32.3 26.7 50.8 30.4 36.4 32.5
Just Friends 30.9 21.1 25.6 22.0 26.8 20.0 22.8No One 24.3 8.3 17.2 20.3 14.8 21.8 12.9Pet 13.2 11.8 12.0 27.1 12.8 10.9 13.8Organized Group 13.2 10.8 9.5 8.5 8.9 9.1 10.7Adult Telephone Survey (Q16)

141
Regional Level of Activity and Time Spent in Outdoor Recreation
Regional Time Spent in Outdoor Recreation A large percentage of respondents spending the same or more time compared to five years ago came from the Central Coast (75%). Forty-one point one percent of Sierra region respondents spent the same amount of time as they did five years ago. Table 125. Amount of Time Respondents Currently Spend in Outdoor Recreation Activities Compared to 5 Years Ago by Region
Central Coast
Central Valley
Los Angeles
Northern CA
San Francisco
Sierra Southern CA
Amount of Time
% % % % % % % More time 39.7 36.1 38.2 28.8 39.3 28.6 36.7About the same 35.3 27.1 30.6 33.9 30.2 41.1 30.3Less time 25.0 36.1 30.2 33.9 29.7 28.6 32.2Don't Know 0.7 1.0 3.4 0.7 1.8 0.8Refused 0.2 Total 100.0 100.0 100.0 100.0 100.0 100.0 100.0Adult Telephone Survey (Q7)

142
Regional Time Spent in Physical Activity A large percentage of respondents from the Central Coast (84.6) engaged in physical activities like running, calisthenics, golf, gardening, or walking for exercise. Within the Sierra (91.1%) and Central Coast (91.2%) regions, the highest percent of respondents participated in ten minutes of moderate physical activity during a usual week. A far smaller percentage, but still almost or more than half of respondents within each regions participated in ten minutes of vigorous activity during a usual week. Table 126. Respondents Participation in Other Physical Recreation Activities or Exercises and Time Spent in Moderate or Vigorous Physical Activity by Region
Central Coast
Central Valley
Los Angeles
Northern CA
San Francisco
Sierra Southern CA
Activity
% % % % % % % Participated in other physical activities or exercises during past month.
84.6 75.4 76.4 79.7 80.0 76.8 76.2
Participated in moderate physical activity for at least 10 minutes at a time.
91.2 87.6 84.8 84.7 87.9 91.1 88.4
Participated in vigorous physical activity for at least 10 minutes at a time.
55.1 43.3 52.2 59.3 53.5 51.8 53.6
Adult Telephone Survey (Q20, Q21, Q24)

143
When asked for the number of days that they participated in moderate physical activity, a large percentage of respondents from the Sierra region (30%) said that they did so three days per week.
Table 127. Respondents Participation in Moderate Physical Activity by Region Central
Coast Central Valley
Los Angeles
Northern CA
San Francisco
Sierra Southern CA
# days per week:
% % % % % % %
< 1 1.6 1.4 0.9 2.0 1.3 2.0 0.81 6.5 4.6 6.7 0.0 5.7 8.0 4.82 14.5 11.4 14.0 14.0 13.8 10.0 14.93 18.5 19.9 22.1 22.0 18.9 30.0 21.44 10.5 12.8 16.2 14.0 11.5 12.0 14.55 19.4 17.7 14.8 22.0 21.2 14.0 15.56 8.1 6.6 5.1 12.0 3.3 4.0 5.37 21.0 25.6 20.2 14.0 24.3 20.0 22.8
Total 100.0 100 100.0 100.0 100.0 100.0 100.0Mean 4.3 4.5 4.1 4.3 4.3 4.0 4.3
Do not do any moderate physical activity for at least 10 min
7.4 11.4 14.5 11.9 11.4 7.1 10.5
Don’t Know
1.5 0.7 0.7 3.4 0.7 1.8 1.1
Me Mo Me Mo Me Mo Me Mo Me Mo Me Mo Me Mo Amount of time per day participated in moderate activity (minutes)
78.1 60.0 77.7 30.0 70.8 60.0 94.5 60.0 68.8 30.0 72.4 60.0 70.3 60.0
Adult Telephone Survey (Q22, Q23, Q21, Q20), Me-Mean, Mo-Mode

144
Almost a third of the respondents from the Northern California (34.3%) and Sierra (31%) regions participated in three days of at least ten minutes of physical activity in a usual week. Respondents from Northern California spent on average 97.1 minutes participating in vigorous activity.
Table 128. Respondents Participation in Vigorous Physical Activity by Region. Central
Coast Central Valley
Los Angeles
Northern CA
San Francisco
Sierra Southern CA
# days per week:
% % % % % % %
< 1 5.3 2.3 2.4 0.0 1.3 0.0 2.61 14.7 20.9 14.6 20.0 15.1 20.7 14.72 24.0 19.2 20.0 20 22.3 20.7 18.33 22.7 22.7 23.8 34.3 27.0 31.0 26.74 9.3 12.8 16.5 11.4 11.6 24.1 13.15 8.0 11.6 10.1 8.6 13.8 0.0 11.06 8.0 3.5 3.1 2.9 2.5 3.4 5.27 8.0 7.0 9.4 2.9 6.3 0.0 8.4
Total 100.0 100.0 100.0 100.0 100.0 100.0 100.0Mean 3.1 3.1 3.3 2.9 3.2 2.7 3.3
Do not do any vigorous physical activity for at least 10 min
39.0 55.8 46.4 35.6 45.3 42.9 45.0
Don’t Know 5.9 0.7 1.4 5.1 1.2 5.4 1.4 Me Mo Me Mo Me Mo Me Mo Me Mo Me Mo Me Mo Amount of time per day participated in vigorous activity (minutes)
77.7 60.0 71.4 30.0 75.0 60.0 97.1 30.0 72.6 60.0 80.4 60.0 71.7 60.0
Adult Telephone Survey (Q25, Q24, Q26), Me-Mean, Mo-Mode

145
Respondents reported varying regional levels of physical activity during their last park visit. More than half of Sierra region respondents reported engaging in mostly light activities when they visited parks (50.9%). San Francisco respondents were more likely to have engaged in moderate or vigorous activities during their last park visit than to participate in light or sedentary activities. Table 129. Respondents Level of Activity When Visiting Parks by Region
Regions Central Coast
Central Valley
Los Angeles
Northern CA
San Francisco Sierra
Southern CA
Characteristic % % % % % % % Mostly sitting 4.4 11.5 9.2 8.5 7.0 5.5 8.9Mostly light activities (standing, walking or strolling at a slow pace) 43.4 38.1 35.1 44.1 34.9 50.9 36.1Mostly moderate activities (walking at a moderate pace, playing tennis) 39.7 38.6 38.1 42.4 43.0 38.2 40.6Mostly vigorous activities (jogging, soccer, playing basketball) 11.8 10.3 16.8 5.1 14.3 5.5 13.6Don’t know 0.7 1.0 0.6 0.0 0.7 0.0 0.7Refused 0.0 0.5 0.1 0.0 0.2 0.0 0.1Total 100.0 100.0 100.0 100.0 100.0 100.0 100.0Adult Telephone Survey (Q14)
Most respondents within each region spent either 31 to 60 minutes or over two hours being physically active during their last park visit. A large percentage of respondents within the Sierra (43.6%) and Northern California (42.4%) regions spent over two hours being physically active in parks. Table 130. Respondents’ Time Spent Physically Active in Parks by Region.
Central Coast
Central Valley
Los Angeles
Northern CA
San Francisco
Sierra Southern CA
Minutes
% % % % % % % Less than 10 9.6 11.2 10.1 6.8 9.7 5.5 8.911 – 30 minutes 14.7 17.4 19.8 8.5 18.1 9.1 19.731 – 60 minutes 17.6 23.1 24.9 20.3 26.7 18.2 25.261 – 90 minutes 7.4 4.7 8.1 8.5 7.9 10.9 8.991 – 120 minutes 15.4 11.7 14.3 13.6 13.4 12.7 11.8

146
Table 130. Respondents’ Time Spent Physically Active in Parks by Region.
Central Coast
Central Valley
Los Angeles
Northern CA
San Francisco
Sierra Southern CA
Minutes
% % % % % % % More than 2 hours 35.3 31.8 22.9 42.4 24.2 43.6 25.6Total 100.0 100.0 100.0 100.0 100.0 100.0 100.0Adult Telephone Survey (Q12)
Overall, gang activity and alcohol and drug use were the primary factors that limited respondents' level of physical activities in parks. Almost more than twice the percentage of Central Coast respondents reported that gang activity (49.3%) and alcohol and drugs (41.8%) limited their physical activity at parks a lot compared to any of the other limiting factors. Half or more of Central Coast respondents reported that dog restrictions (52.2%), lack of public transportation (50%), lack of accessibility (56.8%), and lack of commercial visitor services (55.2%) did not limit their physical activity at all in parks.
Table 131. How Respondents Perceive Certain Factors Might Limit Their Level of Physical Activity in Parks - Central Coast Region
Not at all 2 3 4 A lot Total Factor % % % % % %
Gang activity in park 14.9 6.0 15.7 14.2 49.3 100.0Alcohol and drug use in park 18.7 7.5 14.9 17.2 41.8 100.0Poorly maintained park (e.g., excess trash, run down facilities)
13.4 14.2 23.9 22.4 26.1 100.0
Fear of crime from others in the park 23.1 14.2 23.1 15.7 20.9 100.0Poorly maintained trail conditions (e.g., unsafe surface, no lighting at night)
14.2 14.2 29.9 21.6 20.1 100.0
Poor lighting in park 16.5 16.5 24.1 23.3 19.5 100.0Lack of scenic beauty 19.4 7.5 29.1 26.9 17.2 100.0No restrooms 30.6 11.9 26.9 15.7 14.9 100.0Not enough time 19.4 14.9 29.9 21.6 14.2 100.0Costs of activity 25.4 16.4 30.6 14.2 13.4 100.0Dogs are not allowed 52.2 9.7 19.4 5.2 13.4 100.0Personal safety concerns (e.g., fear of injury, poorly maintained equipment)
26.1 20.1 31.3 9.7 12.7 100.0
Park does not have the facilities I like to use (e.g., fitness stations, trails)
17.2 15.7 33.6 21.6 11.9 100.0
Limited park hours (e.g., fitness facilities, pool)
25.6 12.8 29.3 21.8 10.5 100.0
Park is too far away from where I live 33.1 12.8 28.6 15.0 10.5 100.0I am physically active elsewhere 14.3 19.5 40.6 15.0 10.5 100.0

147
Table 131. How Respondents Perceive Certain Factors Might Limit Their Level of Physical Activity in Parks - Central Coast Region
Not at all 2 3 4 A lot Total Factor % % % % % %
Trail design (e.g., difficulty accessing trail)
17.9 20.9 35.1 16.4 9.7 100.0
No one to be physically active with 31.3 17.9 26.9 14.9 9.0 100.0Weather 29.9 14.9 32.8 13.4 9.0 100.0Lack of public transportation to park 50.0 13.4 24.6 3.7 8.2 100.0Personal health problems (e.g., difficulty walking, breathing)
47.0 11.2 18.7 15.7 7.5 100.0
Don’t feel welcome in park 49.3 11.2 22.4 9.7 7.5 100.0Park is not accessible for individuals with a physical disability
56.8 15.2 22.7 1.5 3.8 100.0
Lack of skills and abilities 33.6 25.4 32.1 5.2 3.7 100.0Commercial visitor services, like food services or gift shops, are not available
55.2 14.2 23.9 3.0 3.7 100.0
I am not physically active 43.7 16.3 25.2 11.1 3.7 100.0 Percents are based on valid percentages and total number of responses; these may be less than the total number of respondents per region. Adult Mail-Back Survey (Q9)
Central Valley respondents also felt strongly that gang activity (47.8%) and alcohol and drug use (39.1%) in parks limited their physical activity a lot. More than half of Central Valley respondents reported that not feeling welcome in parks (52.2%), dog restrictions (57.8%), lack of public transportation (50.7%), lack of accessibility (63%), and lack of commercial visitor services (57%) did not limit their physical activity at all in parks. Table 132. How Respondents Perceive Certain Factors Might Limit Their Level of Physical Activity in Parks - Central Valley Region
Not at all 2 3 4 A lot Total Factor % % % % % %
Gang activity in park 15.9 9.4 13.8 13.0 47.8 100.0Alcohol and drug use in park 19.6 10.1 16.7 14.5 39.1 100.0Fear of crime from others in the park 27.5 18.8 18.8 9.4 25.4 100.0Poorly maintained park (e.g., excess trash, run down facilities)
13.0 15.2 25.4 21.0 25.4 100.0
Poorly maintained trail conditions (e.g., unsafe surface, no lighting at night)
18.8 21.0 17.4 17.4 25.4 100.0
No restrooms 30.1 16.2 17.6 16.2 19.9 100.0Park does not have the facilities I like to use (e.g., fitness stations, trails)
18.2 13.9 32.1 16.8 19.0 100.0
Poor lighting in park 16.7 17.4 24.6 22.5 18.8 100.0Park is too far away from where I live 31.9 13.0 23.9 13.0 18.1 100.0

148
Table 132. How Respondents Perceive Certain Factors Might Limit Their Level of Physical Activity in Parks - Central Valley Region
Not at all 2 3 4 A lot Total Factor % % % % % %
Personal safety concerns (e.g., fear of injury, poorly maintained equipment)
30.4 20.3 19.6 12.3 17.4 100.0
I am physically active elsewhere 19.7 16.8 29.2 17.5 16.8 100.0Lack of scenic beauty 20.4 13.1 29.9 20.4 16.1 100.0No one to be physically active with 32.6 14.5 23.2 16.7 13.0 100.0Personal health problems (e.g., difficulty walking, breathing)
41.3 13.0 21.7 10.9 13.0 100.0
Costs of activity 33.1 19.9 21.3 13.2 12.5 100.0Trail design (e.g., difficulty accessing trail)
24.8 24.8 26.3 12.4 11.7 100.0
Not enough time 21.3 14.7 28.7 24.3 11.0 100.0Weather 39.0 15.4 22.8 11.8 11.0 100.0Limited park hours (e.g., fitness facilities, pool)
26.3 18.2 22.6 21.9 10.9 100.0
Don’t feel welcome in park 52.2 12.5 18.4 6.6 10.3 100.0Park is not accessible for individuals with a physical disability
63.0 12.6 13.3 3.0 8.1 100.0
Dogs are not allowed 57.8 13.3 16.3 4.4 8.1 100.0Commercial visitor services, like food services or gift shops, are not available
57.0 14.1 15.6 7.4 5.9 100.0
I am not physically active 41.9 19.9 23.5 8.8 5.9 100.0Lack of public transportation to park 50.7 15.4 19.1 9.6 5.1 100.0Lack of skills and abilities 40.4 20.6 27.9 8.1 2.9 100.0Percents are based on valid percentages and total number of responses; these may be less than the total number of respondents per region. Adult Mail-Back Survey (Q9)
Los Angeles respondents also strongly felt that gang activity (50.4%) and drugs and alcohol (41.6%) limited their activity at parks a lot. More than half of Los Angeles respondents reported that dog restrictions (53%), lack of accessibility (54.5%) did not limit their physical activity at all in parks. Table 133. How Respondents Perceive Certain Factors Might Limit Their Level of Physical Activity in Parks - Los Angeles Region
Not at all 2 3 4 A lot Total Factor % % % % % %
Gang activity in park 15.0 8.3 12.7 13.6 50.4 100.0Alcohol and drug use in park 18.3 9.4 14.7 15.9 41.6 100.0Poorly maintained park (e.g., excess trash, run down facilities)
16.2 13.9 18.0 22.4 29.5 100.0
Poor lighting in park 15.3 12.1 26.5 20.1 26.0 100.0

149
Table 133. How Respondents Perceive Certain Factors Might Limit Their Level of Physical Activity in Parks - Los Angeles Region
Not at all 2 3 4 A lot Total Factor % % % % % %
Poorly maintained trail conditions (e.g., unsafe surface, no lighting at night)
15.7 14.2 23.7 22.3 24.0 100.0
Fear of crime from others in the park 21.5 14.7 24.8 15.3 23.6 100.0No restrooms 28.4 11.2 24.0 15.1 21.3 100.0Park does not have the facilities I like to use (e.g., fitness stations, trails)
18.3 12.1 30.2 18.9 20.4 100.0
No one to be physically active with 32.3 15.1 23.1 12.5 16.9 100.0I am physically active elsewhere 18.0 12.1 34.0 19.5 16.3 100.0Personal safety concerns (e.g., fear of injury, poorly maintained equipment)
27.1 18.0 24.2 15.0 15.6 100.0
Park is too far away from where I live 34.2 9.7 21.2 19.2 15.6 100.0Lack of scenic beauty 18.0 13.6 29.8 23.6 15.0 100.0Limited park hours (e.g., fitness facilities, pool)
22.1 16.8 25.7 20.4 15.0 100.0
Trail design (e.g., difficulty accessing trail)
21.5 16.2 30.7 18.3 13.3 100.0
Personal health problems (e.g., difficulty walking, breathing)
40.7 10.6 23.6 12.7 12.4 100.0
Not enough time 17.7 15.0 28.0 28.3 10.9 100.0Weather 39.2 12.5 24.3 13.4 10.7 100.0Costs of activity 31.2 15.4 29.4 13.6 10.4 100.0Don’t feel welcome in park 49.9 13.6 17.7 8.8 10.0 100.0Dogs are not allowed 53.0 13.4 18.8 5.7 9.2 100.0Lack of public transportation to park 46.3 15.6 20.6 9.1 8.3 100.0Commercial visitor services, like food services or gift shops, are not available
49.1 13.9 21.3 7.7 8.0 100.0
I am not physically active 40.8 16.7 23.8 11.3 7.4 100.0Park is not accessible for individuals with a physical disability
54.5 11.6 21.1 8.3 4.5 100.0
Lack of skills and abilities 36.3 18.9 31.0 10.0 3.8 100.0Percents are based on valid percentages and total number of responses; these may be less than the total number of respondents per region. Adult Mail-Back Survey (Q9)

150
Only 5% of Northern California respondents said that poor lighting limited their level of physical activity at parks a lot. A small percentage of Northern California respondents (17.5%) said that a poorly maintained park limited their level of physical activity. Table 134. How Respondents Perceive Certain Factors Might Limit Their Level of Physical Activity in Parks - Northern CA Region
Not at all 2 3 4 A lot Total Factor % % % % % %
Gang activity in park 27.5 10.0 12.5 10.0 40.0 100.0Alcohol and drug use in park 22.5 12.5 25.0 7.5 32.5 100.0Lack of scenic beauty 30.0 15.0 25.0 7.5 22.5 100.0No restrooms 32.5 17.5 12.5 17.5 20.0 100.0Fear of crime from others in the park 30.0 20.0 25.0 7.5 17.5 100.0Poorly maintained park (e.g., excess trash, run down facilities)
22.5 20.0 25.0 15.0 17.5 100.0
Dogs are not allowed 40.0 15.0 22.5 5.0 17.5 100.0Personal safety concerns (e.g., fear of injury, poorly maintained equipment)
35.0 15.0 30.0 5.0 15.0 100.0
Park does not have the facilities I like to use (e.g., fitness stations, trails)
25.0 25.0 27.5 10.0 12.5 100.0
Limited park hours (e.g., fitness facilities, pool)
35.0 12.5 27.5 12.5 12.5 100.0
Costs of activity 40.0 17.5 22.5 7.5 12.5 100.0Poorly maintained trail conditions (e.g., unsafe surface, no lighting at night)
25.0 25.0 17.5 22.5 10.0 100.0
Personal health problems (e.g., difficulty walking, breathing)
55.0 5.0 12.5 17.5 10.0 100.0
Lack of public transportation to park 47.5 17.5 20.0 5.0 10.0 100.0Don’t feel welcome in park 60.0 10.0 10.0 10.0 10.0 100.0Park is too far away from where I live 37.5 10.0 35.0 10.0 7.5 100.0I am not physically active 42.5 17.5 30.0 2.5 7.5 100.0Weather 17.5 15.0 37.5 22.5 7.5 100.0Park is not accessible for individuals with a physical disability
51.3 17.9 23.1 2.6 5.1 100.0
No one to be physically active with 37.5 15.0 20.0 22.5 5.0 100.0Poor lighting in park 22.5 25.0 22.5 25.0 5.0 100.0I am physically active elsewhere 20.0 10.0 50.0 15.0 5.0 100.0Not enough time 22.5 5.0 42.5 25.0 5.0 100.0Trail design (e.g., difficulty accessing trail)
30.0 20.0 32.5 15.0 2.5 100.0
Lack of skills and abilities 40.0 17.5 32.5 7.5 2.5 100.0Commercial visitor services, like food services or gift shops, are not available
55.0 25.0 20.0 0.0 0.0 100.0
Percents are based on valid percentages and total number of responses; these may be less than the total number of respondents per region. Adult Mail-Back Survey (Q9)

151
San Francisco had a very small percentage of respondents who said that cost was a limiting factor for their activity at parks (7%). Table 135. How Respondents Perceive Certain Factors Might Limit Their Level of Physical Activity in Parks - San Francisco Region
Not at all 2 3 4 A lot Total Factor % % % % % %
Gang activity in park 16.4 7.8 11.9 15.6 48.4 100.0Alcohol and drug use in park 20.5 10.7 17.2 18.0 33.6 100.0Poorly maintained park (e.g., excess trash, run down facilities)
18.4 12.3 21.7 23.4 24.2 100.0
Poorly maintained trail conditions (e.g., unsafe surface, no lighting at night)
18.1 14.8 22.6 23.0 21.4 100.0
Lack of scenic beauty 21.5 12.0 27.3 19.8 19.4 100.0Poor lighting in park 22.6 13.2 27.2 19.8 17.3 100.0Fear of crime from others in the park 25.0 20.1 21.7 16.0 17.2 100.0Not enough time 21.6 7.9 34.0 20.7 15.8 100.0I am physically active elsewhere 23.2 13.3 34.4 15.4 13.7 100.0Park is too far away from where I live 31.7 11.1 22.2 21.4 13.6 100.0No restrooms 32.5 12.8 26.3 14.8 13.6 100.0Park does not have the facilities I like to use (e.g., fitness stations, trails)
23.5 11.5 28.4 23.5 13.2 100.0
Personal safety concerns (e.g., fear of injury, poorly maintained equipment)
33.3 21.8 17.7 15.2 11.9 100.0
Trail design (e.g., difficulty accessing trail)
21.5 21.9 25.6 19.8 11.2 100.0
Weather 33.1 11.2 31.4 14.0 10.3 100.0No one to be physically active with 38.3 9.1 28.0 14.8 9.9 100.0Personal health problems (e.g., difficulty walking, breathing)
47.7 10.7 18.5 13.2 9.9 100.0
Limited park hours (e.g., fitness facilities, pool)
28.0 13.6 27.2 22.2 9.1 100.0
Don’t feel welcome in park 51.0 12.8 18.9 8.6 8.6 100.0Costs of activity 37.2 15.3 29.3 11.2 7.0 100.0Lack of public transportation to park 54.5 11.6 19.8 8.3 5.8 100.0Dogs are not allowed 59.6 8.3 19.2 7.5 5.4 100.0I am not physically active 47.1 14.3 24.6 9.0 4.9 100.0Park is not accessible for individuals with a physical disability
63.3 10.4 18.3 3.8 4.2 100.0
Commercial visitor services, like food services or gift shops, are not available
62.1 11.1 20.2 4.1 2.5 100.0
Lack of skills and abilities 41.3 16.5 32.2 8.3 1.7 100.0Percents are based on valid percentages and total number of responses; these may be less than the total number of respondents per region. Adult Mail-Back Survey (Q9)

152
Sierra region respondents felt strongly about gangs (64.5% said it limited them a lot). The Sierra region had a high percentage of respondents reporting that lack of commercial visitor services did not limit their activity at parks at all (67.7%).
Table 136. How Respondents Perceive Certain Factors Might Limit Their Level of Physical Activity in Parks - Sierra Region
Not at all 2 3 4 A lot Total Factor % % % % % %
Gang activity in park 19.4 6.5 3.2 6.5 64.5 100.0Alcohol and drug use in park 19.4 9.7 12.9 19.4 38.7 100.0Poorly maintained trail conditions (e.g., unsafe surface, no lighting at night)
19.4 19.4 29.0 6.5 25.8 100.0
Trail design (e.g., difficulty accessing trail)
22.6 16.1 22.6 16.1 22.6 100.0
Poor lighting in park 19.4 16.1 22.6 19.4 22.6 100.0Lack of scenic beauty 19.4 19.4 25.8 12.9 22.6 100.0No one to be physically active with 32.3 6.5 22.6 19.4 19.4 100.0Poorly maintained park (e.g., excess trash, run down facilities)
16.1 9.7 32.3 22.6 19.4 100.0
Personal health problems (e.g., difficulty walking, breathing)
35.5 22.6 19.4 3.2 19.4 100.0
Costs of activity 29.0 12.9 16.1 22.6 19.4 100.0No restrooms 38.7 6.5 19.4 16.1 19.4 100.0Limited park hours (e.g., fitness facilities, pool)
22.6 12.9 35.5 12.9 16.1 100.0
Don’t feel welcome in park 58.1 3.2 16.1 6.5 16.1 100.0Fear of crime from others in the park 25.8 16.1 22.6 22.6 12.9 100.0Personal safety concerns (e.g., fear of injury, poorly maintained equipment)
25.8 25.8 25.8 9.7 12.9 100.0
Park does not have the facilities I like to use (e.g., fitness stations, trails)
19.4 19.4 29.0 19.4 12.9 100.0
Park is too far away from where I live 38.7 12.9 29.0 6.5 12.9 100.0I am physically active elsewhere 9.7 16.1 35.5 25.8 12.9 100.0Dogs are not allowed 54.8 6.5 16.1 9.7 12.9 100.0Not enough time 19.4 9.7 29.0 32.3 9.7 100.0Weather 48.4 22.6 9.7 9.7 9.7 100.0Lack of public transportation to park 61.3 16.1 12.9 3.2 6.5 100.0Commercial visitor services, like food services or gift shops, are not available
67.7 6.5 19.4 0.0 6.5 100.0
I am not physically active 58.1 3.2 25.8 9.7 3.2 100.0Lack of skills and abilities 45.2 19.4 25.8 9.7 0.0 100.0Park is not accessible for individuals with a physical disability
67.7 19.4 6.5 6.5 0.0 100.0
Percents are based on valid percentages and total number of responses; these may be less than the total number of respondents per region. Adult Mail-Back Survey (Q9)

153
More than half of Southern California respondents said that gang activity in parks limited their level of physical activity in parks a lot, and more than half said that dog prohibitions, lack of commercial visitor services, and lack of public transportation did not limit their level of physical activity in parks at all.
Table 137. How Respondents Perceive Certain Factors Might Limit Their Level of Physical Activity in Parks - Southern CA Region
Not at all 2 3 4 A lot Total Factor % % % % % %
Gang activity in park 12.6 8.7 14.9 12.9 50.8 100.0Alcohol and drug use in park 13.6 11.3 16.8 15.9 42.4 100.0Poorly maintained park (e.g., excess trash, run down facilities)
14.6 16.2 18.2 21.8 29.2 100.0
Poorly maintained trail conditions (e.g., unsafe surface, no lighting at night)
14.3 13.3 21.4 22.4 28.6 100.0
Poor lighting in park 13.4 12.7 25.7 22.1 26.1 100.0Fear of crime from others in the park 20.8 17.9 24.4 14.9 22.1 100.0No restrooms 24.4 15.5 22.8 16.8 20.5 100.0Park is too far away from where I live 27.4 11.4 26.4 14.7 20.2 100.0Lack of scenic beauty 16.3 14.7 28.7 20.8 19.5 100.0Park does not have the facilities I like to use (e.g., fitness stations, trails)
16.3 14.7 29.0 21.8 18.2 100.0
Not enough time 16.4 13.2 27.3 26.3 16.8 100.0Personal safety concerns (e.g., fear of injury, poorly maintained equipment)
25.6 20.5 23.4 15.9 14.6 100.0
Costs of activity 28.1 19.2 25.5 12.9 14.2 100.0Trail design (e.g., difficulty accessing trail)
21.5 18.9 29.6 16.0 14.0 100.0
Limited park hours (e.g., fitness facilities, pool)
22.9 16.7 29.4 18.0 13.1 100.0
I am physically active elsewhere 19.0 13.7 36.3 19.0 12.1 100.0Don’t feel welcome in park 43.4 12.8 20.7 11.2 11.8 100.0Personal health problems (e.g., difficulty walking, breathing)
43.3 15.0 19.9 11.1 10.7 100.0
No one to be physically active with 36.7 12.3 26.3 14.6 10.1 100.0Weather 34.1 12.8 28.5 15.1 9.5 100.0Dogs are not allowed 55.0 10.3 18.5 8.3 7.9 100.0Park is not accessible for individuals with a physical disability
57.5 11.0 20.9 5.0 5.6 100.0
Commercial visitor services, like food services or gift shops, are not available
54.3 10.9 23.2 6.0 5.6 100.0
I am not physically active 42.1 14.8 25.0 13.5 4.6 100.0Lack of public transportation to park 52.0 15.8 19.7 8.6 3.9 100.0Lack of skills and abilities 35.2 23.4 31.6 6.3 3.6 100.0Percents are based on valid percentages and total number of responses; these may be less than the total number of respondents per region. Adult Mail-Back Survey (Q9)

154
Activities of Regional Adult Respondents The highest percentage of respondents within each region walked during their last park visit. Table 138a. Activities Respondents Participated in During Their Last Park Visit by Region
Central Coast
Central Valley
Los Angeles
Northern CA
San Francisco
Sierra Southern CA
Activity
% % % % % % % Walking 65.4 48.0 48.3 64.4 45.8 60.0 48.0Wildlife Viewing 45.6 10.0 10.0 39.0 9.7 27.3 10.3Eating/Picnicking 45.6 20.6 21.1 49.2 20.0 50.9 24.3Sedentary Activities 44.1 23.4 24.6 30.5 19.5 49.1 21.4Playing 33.8 29.4 29.6 23.7 28.7 29.1 33.6Hiking 32.4 14.4 14.0 27.1 22.8 21.8 12.2Swimming 16.2 6.0 7.7 18.6 6.4 16.4 9.6Bicycling 13.2 5.7 7.0 8.5 8.1 9.1 9.4Dog Walking 12.5 8.0 9.3 15.3 8.1 14.5 9.0Jogging/Running 10.3 10.0 15.0 1.7 11.7 7.3 13.6Sports 8.8 14.7 22.1 8.5 14.9 7.3 23.3Active Water Sports 8.8 4.0 3.7 6.8 2.9 7.3 3.8Other 8.8 11.7 8.8 8.5 9.7 9.1 9.8Fishing 5.1 9.5 2.8 18.6 4.0 12.7 4.9Tennis 2.9 1.0 2.8 0.0 3.2 1.8 1.4In-Line Skating 0.7 0.2 0.9 0.0 0.5 0.0 0.4Martial arts/tai chi/yoga 0.7 0.5 1.1 0.0 0.3 0.0 0.8Adult Telephone Survey (Q15)

155
Walking, sedentary activities, and eating all made the list of the top five activities that most respondents participated in during their last park visit for each region. Wildlife viewing and sports only made the top five lists in the Central Coast, Northern California, and Sierra. Only Northern California and San Francisco had hiking in their top five lists of activities that they participated in during their last park visit. Table 138b. Top Five Activities by Participation in During Their Last Park Visit 1 2 3 4 5 Central Coast Walking Wildlife
ViewingEating Sedentary
Activities Playing
Central Valley Walking Playing Sedentary Activities
Eating Sports
Los Angeles Walking Playing Sedentary Activities
Sports Eating
Northern CA Walking Eating Wildlife Viewing
Sedentary Activities
Hiking
San Francisco Walking Playing Hiking Eating Sedentary Activities
Sierra Walking Eating Sedentary Activities
Playing Wildlife Viewing
Southern CA Walking Playing Eating Sports Sedentary Activities
Adult Telephone Survey (Q15)

156
Activity Participation and Latent Demand for Regional Adult Respondents
More than half of respondents from within each region walked, picnicked, drove for pleasure, visited outdoor nature museums, and attended outdoor cultural events. Table 139a. Recreation Activity Participation of Respondents During the Past 12 Months by Region
Central Coast
Central Valley
Los Angeles
Northern CA
San Francisco
Sierra Southern CA
Activity
% % % % % % % Walking for fitness or pleasure 83.3% 66.3% 72.5% 87.5% 76.5% 83.9% 72.9%Picnicking in picnic areas (with tables, fire pits, or grills)
80.2% 66.9% 62.3% 65.0% 67.6% 74.2% 67.1%
Driving for pleasure, sightseeing, driving through natural scenery
69.8% 60.0% 55.0% 67.5% 63.6% 87.1% 55.5%
Beach activities (swimming, sunbathing, surf play, wading, playing on beach)
69.8% 48.8% 59.6% 52.5% 57.5% 74.2% 61.6%
Visiting outdoor nature museums, zoos, gardens or arboretums
67.7% 52.5% 59.6% 60.0% 60.3% 51.6% 55.8%
Attending outdoor cultural events (festivals, fairs, concerts, historical reenactments, outdoor theatre)
63.5% 50.6% 59.6% 55.0% 56.3% 54.8% 53.9%
Visiting historic or cultural sites 58.3% 57.5% 53.8% 70.0% 54.3% 74.2% 49.7%Day hiking on trails 57.3% 41.3% 45.0% 62.5% 53.0% 61.3% 40.6%Wildlife viewing, bird watching, viewing natural scenery
55.2% 42.5% 41.2% 72.5% 50.6% 54.8% 41.9%
Swimming in a pool 47.9% 52.5% 51.2% 32.5% 49.0% 58.1% 53.9%Bicycling on paved surfaces 44.8% 35.0% 35.7% 37.5% 40.1% 38.7% 31.9%Camping in developed sites with facilities such as toilets and tables (not including backpacking)
42.7% 47.5% 32.5% 47.5% 44.1% 45.2% 34.8%
Jogging and running for exercise (on trails, streets, sidewalks, paths)
40.6% 33.1% 44.2% 27.5% 42.1% 19.4% 39.0%
Using open turf areas (casual and unstructured activities - games, relax, sunning, etc.)
40.6% 29.4% 33.0% 37.5% 32.8% 29.0% 33.5%
Swimming in freshwater lakes, rivers and/or streams
36.5% 38.1% 28.1% 35.0% 32.4% 67.7% 24.5%
Outdoor photography 34.4% 33.8% 31.6% 45.0% 36.4% 32.3% 30.6%Using play equipment, play structures, tot-lots
30.2% 31.3% 33.0% 37.5% 36.0% 32.3% 31.3%
Bicycling on unpaved surfaces and trails (mountain biking)
21.9% 9.4% 16.1% 20.0% 16.2% 22.6% 15.8%

157
Table 139a. Recreation Activity Participation of Respondents During the Past 12 Months by Region
Central Coast
Central Valley
Los Angeles
Northern CA
San Francisco
Sierra Southern CA
Activity
% % % % % % % Organized team sports such as soccer, football, baseball, softball, basketball
18.8% 20.6% 28.1% 22.5% 25.5% 12.9% 25.2%
Surfing or boogie boarding, windsurfing
17.7% 10.6% 17.8% 5.0% 9.3% 3.2% 16.8%
Paddle sports (kayaking, rowing, canoeing, rafting
17.7% 18.8% 12.6% 22.5% 17.8% 22.6% 11.0%
Fishing - freshwater 17.7% 29.4% 15.2% 35.0% 19.0% 45.2% 22.9%Motor boating, personal watercraft (jet skis, wave runners, waterskiing, wakeboarding)
12.5% 16.9% 14.6% 17.5% 13.4% 29.0% 14.2%
Backcountry activities such as mountaineering, rock climbing and bouldering)
11.5% 9.4% 12.9% 17.5% 11.7% 16.1% 11.9%
Fishing - saltwater (includes catching abalone, clams, crabs, etc.)
11.5% 10.0% 10.5% 5.0% 10.1% 12.9% 12.3%
Target shooting (including pistol and skeet)
11.5% 14.4% 12.3% 12.5% 10.5% 29.0% 7.4%
Horseback riding, horse shows and events
10.4% 5.0% 10.2% 7.5% 4.9% 6.5% 8.4%
Snowboarding 10.4% 3.8% 9.6% 2.5% 9.7% 12.9% 8.7%Off-highway vehicle use (motorcycles, 4-wheel drive, all-terrain vehicles)
10.4% 15.0% 14.6% 27.5% 6.5% 6.5% 14.5%
Sail boating 10.4% 2.5% 7.3% 5.0% 4.9% 3.2% 6.1%Tennis 10.4% 9.4% 17.8% 7.5% 12.6% 9.7% 10.3%Backpacking (overnight hiking) 9.4% 11.9% 9.6% 15.0% 13.4% 12.9% 8.7%Skateboarding (skate parks, paths, sidewalks)
9.4% 3.8% 9.6% 5.0% 6.9% 3.2% 7.4%
Golf 9.4% 11.9% 14.0% 7.5% 12.1% 22.6% 12.3%RV/trailer camping with hookups
8.3% 15.6% 9.1% 15.0% 8.5% 12.9% 13.2%
Downhill (Alpine) skiing 4.2% 5.0% 9.6% 2.5% 10.9% 9.7% 6.8%Snowmobiling 4.2% 3.1% 4.1% 2.5% 4.0% 9.7% 2.3%Cross-country skiing 3.1% 2.5% 5.3% 5.0% 5.3% 9.7% 2.6%Hunting (large or small game with a firearm)
3.1% 5.6% 4.4% 7.5% 2.8% 6.5% 2.6%
Other: 2.1% 5.6% 6.7% 2.5% 7.3% 9.7% 4.2%Adult Mail-Back Survey (Q2)

158
Within the regions, walking and picnicking were both in the top five lists for every region. Only two regions listed attending outdoor cultural events or wildlife viewing in their top five; only three regions had visiting historic or cultural sites; most regions had driving for pleasure or visiting outdoor nature museums. Table 139b. Top Five Activities Ranked by Percent Participation During the Past 12 Months 1 2 3 4 5 Central Coast
Walking for fitness or pleasure
Picnicking in picnic areas (with tables, fire pits, or grills)
Driving for pleasure, sightseeing, driving through natural scenery
Beach activities (swimming, sunbathing, surf play, wading, playing on beach)
Visiting outdoor nature museums, zoos, gardens or arboretums
Central Valley
Picnicking in picnic areas (with tables, fire pits, or grills)
Walking for fitness or pleasure
Driving for pleasure, sightseeing, driving through natural scenery
Visiting historic or cultural sites
Visiting outdoor nature museums, zoos, gardens or arboretums
Los Angeles
Walking for fitness or pleasure
Picnicking in picnic areas (with tables, fire pits, or grills)
Beach activities (swimming, sunbathing, surf play, wading, playing on beach)
Visiting outdoor nature museums, zoos, gardens or arboretums
Attending outdoor cultural events (festivals, fairs, concerts, historical reenactments, outdoor theatre)
Northern CA
Walking for fitness or pleasure
Wildlife viewing, bird watching, viewing natural scenery
Visiting historic or cultural sites
Driving for pleasure, sightseeing, driving through natural scenery
Picnicking in picnic areas (with tables, fire pits, or grills)
San Francisco
Walking for fitness or pleasure
Picnicking in picnic areas (with tables, fire pits, or grills)
Driving for pleasure, sightseeing, driving through natural scenery
Visiting outdoor nature museums, zoos, gardens or arboretums
Beach activities (swimming, sunbathing, surf play, wading, playing on beach)
Sierra Driving for pleasure, sightseeing, driving through natural scenery
Walking for fitness or pleasure
Picnicking in picnic areas (with tables, fire pits, or grills)
Beach activities (swimming, sunbathing, surf play, wading, playing on beach)
Visiting historic or cultural sites
Southern CA
Walking for fitness or pleasure
Picnicking in picnic areas (with tables, fire pits, or grills)
Beach activities (swimming, sunbathing, surf play, wading, playing on beach)
Visiting outdoor nature museums, zoos, gardens or arboretums
Driving for pleasure, sightseeing, driving through natural scenery
Adult Mail-Back Survey (Q2)

159
More than half of the respondents in the Central Valley region wanted to camp, walk, and bicycle on paved surfaces more often. More than half of the respondents in the Northern California region wanted to go day hiking and walking more often. Table 140a. Recreation Activities Respondents Would Like to Participate in More Often by Region.
Central Coast
Central Valley
Los Angeles
Northern CA
San Francisco
Sierra Southern CA
Activity
% % % % % % % Camping in developed sites with facilities such as toilets and tables (not including backpacking)
46.9 55.0 39.8 42.5 46.6 35.5 44.8
Day hiking on trails 40.6 48.8 40.1 50.0 44.9 32.3 47.1Walking for fitness or pleasure
39.6 52.5 45.9 55.0 44.5 41.9 43.5
Beach activities (swimming, sunbathing, surf play, wading, playing on beach)
38.5 46.9 41.8 35.0 36.8 41.9 44.8
Visiting historic or cultural sites
38.5 48.1 37.7 47.5 36.4 29.0 41.3
Picnicking in picnic areas (with tables, fire pits, or grills)
36.5 46.9 40.9 47.5 40.9 29.0 43.5
Swimming in a pool 34.4 40.6 33.6 27.5 34.8 29.0 41.3Visiting outdoor nature museums, zoos, gardens or arboretums
33.3 45.0 42.7 45.0 40.5 29.0 42.3
Attending outdoor cultural events (festivals, fairs, concerts, historical reenactments, outdoor theater)
32.3 39.4 42.7 47.5 36.0 32.3 38.7
Bicycling on paved surfaces 29.2 53.1 40.6 45.0 48.2 22.6 49.0Driving for pleasure, sightseeing, driving through natural scenery
27.1 48.8 34.8 40.0 32.8 45.2 37.7
Swimming in freshwater lakes, rivers and/or streams
26.0 39.4 26.0 40.0 24.7 38.7 25.8
Outdoor photography 25.0 28.8 28.9 30.0 26.3 19.4 31.0Wildlife viewing, bird watching, viewing natural scenery
24.0 36.3 30.1 37.5 33.2 25.8 34.8
Backpacking (overnight hiking)
20.8 22.5 18.4 25.0 19.4 25.8 22.9
Using open turf areas (casual and unstructured activities - games, relax, sunning, etc.)
20.8 22.5 23.4 22.5 21.5 19.4 24.2
Bicycling on unpaved surfaces and trails (mountain biking)
17.7 18.1 17.5 22.5 20.2 19.4 22.9

160
Table 140a. Recreation Activities Respondents Would Like to Participate in More Often by Region.
Central Coast
Central Valley
Los Angeles
Northern CA
San Francisco
Sierra Southern CA
Activity
% % % % % % % Paddle sports (kayaking, rowing, canoeing, rafting
17.7 23.1 17.3 30.0 21.1 22.6 21.3
Backcountry activities such as mountaineering, rock climbing and bouldering)
16.7 15.6 18.7 17.5 13.8 22.6 20.6
Surfing or boogie boarding, windsurfing
15.6 14.4 19.3 12.5 11.7 12.9 20.3
Jogging and running for exercise (on trails, streets, sidewalks, paths)
14.6 25.6 30.4 17.5 25.5 25.8 31.0
Fishing - freshwater 13.5 30.0 19.0 25.0 19.8 32.3 28.7Tennis 13.5 12.5 14.3 10.0 10.9 6.5 14.8Organized team sports such as soccer, football, baseball, softball, basketball
12.5 20.6 18.4 12.5 15.8 9.7 20.6
Horseback riding, horse shows and events
11.5 10.0 15.5 20.0 13.4 3.2 17.4
Sail boating 10.4 11.9 14.0 22.5 8.5 9.7 14.2Fishing - saltwater (includes catching abalone, clams, crabs, etc.)
9.4 16.9 15.2 22.5 13.8 6.5 20.3
Target shooting (including pistol and skeet)
9.4 17.5 17.0 7.5 13.0 16.1 17.7
Downhill (Alpine) skiing 8.3 9.4 14.0 15.0 12.6 9.7 15.5Using play equipment, play structures, tot-lots
8.3 21.9 18.7 17.5 19.0 9.7 21.3
Golf 8.3 11.3 14.3 7.5 9.3 19.4 16.1RV/trailer camping with hookups
7.3 21.9 17.5 15.0 10.9 12.9 22.3
Skateboarding (skate parks, paths, sidewalks)
7.3 5.0 9.4 2.5 6.9 9.7 10.3
Snowboarding 7.3 11.3 15.2 10.0 13.0 12.9 14.8Snowmobiling 7.3 13.8 12.9 10.0 11.3 9.7 12.9Cross-country skiing 6.3 8.8 9.4 17.5 9.3 6.5 7.7Motor boating, personal watercraft (jet skis, wave runners, waterskiing, wakeboarding)
6.3 19.4 16.7 15.0 14.6 19.4 17.1
Off-highway vehicle use (motorcycles, 4-wheel drive, all-terrain vehicles)
4.2 50.0 35.4 25.0 38.5 12.9 46.5
Hunting (large or small game with a firearm)
1.0 10.0 8.2 5.0 4.5 9.7 8.7
Other 1.0 6.3 6.7 7.5 3.2 12.9 6.5Adult Mail-Back Survey (Q2)

161
Within the regions, the top five activities that respondents most frequently wanted to participate in more often were camping, walking, day hiking, and beach activities. The outlying activities were visiting outdoor nature museums (Los Angeles), freshwater swimming (Sierra), and driving for pleasure (Sierra).
Table 140b. Top Five Activities Respondents Would Like to Participate in More Often. 1 2 3 4 5 Central Coast
Camping in developed sites with facilities such as toilets and tables (not incl.backpacking)
Day hiking on trails
Walking for fitness or pleasure
Beach activities (swimming, sunbathing, surf play, wading, playing on beach)
Visiting historic or cultural sites
Central Valley
Camping in developed sites with facilities such as toilets and tables (not incl. backpacking)
Bicycling on paved surfaces
Walking for fitness or pleasure
Off-highway vehicle use (motorcycles, 4-wheel drive, all-terrain vehicles)
Day hiking on trails
Los Angeles
Walking for fitness or pleasure
Visiting outdoor nature museums, zoos, gardens or arboretums
Attending outdoor cultural events (festivals, fairs, concerts, historical reenactments, outdoor theater)
Beach activities (swimming, sunbathing, surf play, wading, playing on beach)
Picnicking in picnic areas (with tables, fire pits, or grills)
Northern CA
Walking for fitness or pleasure
Day hiking on trails
Visiting historic or cultural sites
Picnicking in picnic areas (with tables, fire pits, or grills)
Attending outdoor cultural events (festivals, fairs, concerts, historical reenactments, outdoor theater)
San Francisco
Bicycling on paved surfaces
Camping in developed sites with facilities such as toilets and tables (not incl. backpacking)
Day hiking on trails
Walking for fitness or pleasure
Picnicking in picnic areas (with tables, fire pits, or grills)
Sierra Driving for pleasure, sightseeing, driving through natural scenery
Walking for fitness or pleasure
Beach activities (swimming, sunbathing, surf play, wading, playing on beach)
Swimming in freshwater lakes, rivers and/or streams
Camping in developed sites with facilities such as toilets and tables (not incl. backpacking)
Southern CA
Bicycling on paved surfaces
Day hiking on trails
Off-highway vehicle use (motorcycles, 4-wheel drive, all-terrain vehicles)
Camping in developed sites with facilities such as toilets and tables (not incl.backpacking)
Beach activities (swimming, sunbathing, surf play, wading, playing on beach)
Adult Mail-Back Survey (Q2)

162
Activity Types for Regional Companions Under 18 Years of Age Overall, the most frequently reported activity of youth companions was playing. In the Central Coast, the next most frequently reported activity was eating/picnicking. In the Central Valley, Los Angeles, San Francisco, Sierra, and Southern California regions the next most frequently reported activity was sports. In Northern California, it was walking. Table 141. Park Activities of Companions Who Were Less Than 18 Years of Age by Region.
Central Coast
Central Valley
Los Angeles
Northern CA
San Francisco
Sierra Southern CA
Activity
% % % % % % % Playing 70.5 73.1 72.8 64.3 74.5 73.2 73.6Eating/Picnicking 52.5 15.8 19.3 42.9 15.1 20.5 20.1Walking 47.5 17.3 20.2 46.4 18.6 22.2 23.3Swimming 29.5 18.1 12.0 32.1 11.6 16.2 18.3Sedentary Activities 27.9 7.3 10.0 10.7 5.5 9.1 8.1Wildlife Viewing 27.9 4.6 5.7 17.9 5.5 6.2 4.5Sports 24.6 34.6 41.7 39.3 35.7 37.3 38.0Hiking 23.0 10.4 8.9 28.6 13.3 11.8 10.3Dog Walking 13.1 1.9 4.8 10.7 2.3 4.0 3.6Fishing 13.1 6.5 2.4 17.9 4.9 5.1 3.8Jogging/Running 11.5 18.1 23.0 10.7 22.3 20.0 19.0Bicycling 9.8 10.8 13.9 17.9 16.5 15.4 19.2Active Water Sports 6.6 4.2 4.3 17.9 2.0 4.5 4.9Other 6.6 20.0 6.3 3.6 10.7 10.8 11.0Tennis 3.3 1.2 2.4 0.0 2.6 2.3 2.7In-Line Skating 0.0 2.7 4.8 3.6 1.2 3.1 3.8Martial arts/tai chi/yoga 0.0 0.0 0.7 0.0 0.0 0.2 0.2Adult Telephone Survey (Q19)

163
Facilities and Amenities Facilities and Amenities Utilized During Last Regional Adult Park Visit Respondents from the Central Coast (64%), Northern California (76.3%), and San Francisco (59.9%) regions used unpaved multipurpose trails frequently during their last park visit. Central Valley (62.4%), Southern California (66.8%), Sierra (67.3%), and Los Angeles (66.8%) respondents frequently used community facilities, buildings, or restrooms. A uniformly small percentage of respondents within all seven regions used pools (0 - 8.8%) and skate parks (0 – 7.2%) during their last park visit and less than 20% visited botanical gardens (7.3% - 17.6%). Table 142. Facilities or Amenities Used During Their Last Park Visit by Region.
Central Coast
Central Valley
Los Angeles
Northern CA
San Francisco
Sierra Southern CA
Facility/Amenity
% % % % % % % Unpaved multipurpose trail (e.g., walking/hiking)
64.0 52.2 47.4 76.3 59.9 63.6 48.7
Beach or water recreation area
63.2 36.6 38.1 57.6 35.2 52.7 40.2
Community facility/building/restrooms
59.6 62.4 66.8 72.9 58.2 67.3 66.8
Scenic observation/wildlife viewing area
55.1 47.0 39.8 71.2 42.6 58.2 41.5
Picnic table, picnic pavilion
54.4 60.4 57.7 64.4 53.7 61.8 58.9
Open space to play (with kids, Frisbee)
52.9 60.0 58.8 39.0 59.6 36.4 63.4
Paved trail (e.g., bike trail)
48.5 49.0 44.7 44.1 59.2 52.7 48.5
Playground 23.5 39.8 41.6 18.6 38.6 23.6 43.0Botanical garden 13.2 10.9 17.6 15.3 15.3 7.3 12.9Dog park 11.0 12.9 15.2 18.6 18.5 7.3 16.6Organized sports fields (e.g., baseball, soccer)
10.3 17.7 23.1 13.6 20.0 9.1 23.9
Swimming pool 8.8 5.0 8.2 3.4 5.5 0.0 6.0Amusement area (e.g., park train)
8.1 20.6 22.7 6.8 17.4 9.1 21.0
Tennis or basketball courts
7.4 16.4 24.3 1.7 18.6 3.6 21.1
Other 5.1 6.7 6.1 8.5 7.2 5.5 5.5Skating park 2.9 6.7 7.2 1.7 6.5 0.0 6.3Adult Telephone Survey (Q13)

164
Outdoor Recreation Facilities and Services Within each regions, most respondents were satisfied with public outdoor recreation areas, facilities, and services currently available. Table 143. Respondents Satisfaction with Public Outdoor Recreation Areas, Facilities and Services Currently Available by Region
Central Coast
Central Valley
Los Angeles
Northern CA
San Francisco
Sierra Southern CA
Level of Satisfaction
% % % % % % % Not at all satisfied 2.2 4.0 2.7 3.4 1.0 5.4 3.4Somewhat satisfied 16.2 21.9 25.9 22.0 23.2 23.2 23.9Satisfied, or 44.1 48.8 47.4 32.2 46.0 46.4 46.2Very satisfied 36.0 23.6 22.0 40.7 29.0 25.0 24.8Don’t know 1.5 1.7 2.0 1.7 0.8 0.0 1.5Refused 0.1Total 100.0 100.0 100.0 100.0 100.0 100.0 100.0Percents are based on valid percentages and total number of responses; these may be less than the total number of respondents per region. Adult Telephone Survey (Q9)
In the Central Coast, Central Valley, Los Angeles, San Francisco, Sierra, and Southern California regions, most respondents thought that the overall condition and operation of outdoor recreation facilities was the same or better than it was five years ago. In the Northern California region, most respondents thought that the overall condition and operation of outdoor recreation facilities was the same or not as good as it was five years ago. Table 144. Respondents Perception of Overall Condition and Operation of Public Outdoor Recreation Areas and Facilities by Region Central
Coast Central Valley
Los Angeles
Northern CA
San Francisco
Sierra Southern CA
Condition % % % % % % % Better than 5 years ago
21.8 32.9 38.3 23.2 30.3 25.5 36.4
The same as 5 years ago
47.6 38.1 35.7 37.5 39.7 43.1 38.8
Not as good as they were five years ago
19.4 19.8 17.1 35.7 21.1 15.7 15.9
Don’t know 11.3 9.1 8.8 1.8 8.8 15.7 8.9Refused 0.1 1.8 Total 100.0 100.0 100.0 100.0 100.0 100.0 100.0Percents are based on valid percentages and total number of responses; these may be less than the total number of respondents per region. Adult Telephone Survey (Q10)

165
When rating the importance of various outdoor recreation facilities and services, respondents from San Francisco, Los Angeles, and the Central Coast did not think it was important to provide public hunting areas managed for waterfowl. San Francisco respondents also did not think that off-highway vehicles are important. Northern California respondents thought OHV areas were important. Table 145. Importance of California Park and Recreation Facilities and Services by Region
Central Coast
Central Valley
Los Angeles
Northern CA
San Francisco Sierra Southern
CA Facility/Service1
Me Mo Me Mo Me Mo Me Mo Me Mo Me Mo Me MoAreas and facilities for environmental and outdoor education programs
4 5 4 5 4 5 4 5 4 5 4 5 4 5
Multi-use turf areas for field sports such as softball, baseball, soccer, and/or football
4 5 4 5 4 5 4 4 4 5 4 3 4 5
Courts for activities such as tennis, basketball, and volleyball
4 4 4 5 4 5 4 4 4 5 4 3 4 5
Multi-purpose buildings with rooms that can be used for community meetings and facilities for cultural events, senior or teen programs
4 3 4 5 4 5 4 3 4 4 4 4 4 4
Play activity areas for tots and young children 4 5 4 5 4 5 4 5 4 5 4 5 4 5
Facilities in the local community that can be used for day youth camps
4 4 4 5 4 5 4 3 4 5 4 4 4 4
Facilities in the local community for overnight camping
4 3 3 3 3 3 4 4 4 5 4 5 3 3
Off-leash dog parks 3 3 3 3 3 3 3 3 3 3 3 2 3 3 Community swimming pools 4 4 4 5 4 4 4 5 4 5 4 5 4 4
Community skateboard parks 4 3 3 3 3 4 3 3 3 3 3 3 3 3
Picnic sites for large groups 4 4 4 5 4 5 4 5 4 4 4 5 4 4
Trails solely for a single activity such as hiking, mountain biking, or horseback riding
4 5 4 5 4 5 4 4 4 5 4 5 4 4
Trails for multiple, non-motorized activities such as hiking, mountain biking or horseback riding
4 5 4 5 4 4 4 5 4 5 4 5 4 5

166
Table 145. Importance of California Park and Recreation Facilities and Services by Region
Central Coast
Central Valley
Los Angeles
Northern CA
San Francisco Sierra Southern
CA Facility/Service1
Me Mo Me Mo Me Mo Me Mo Me Mo Me Mo Me MoHard surface trails for biking, jogging, and fitness walking
4 5 4 5 4 5 4 4 4 5 4 4 4 5
RV campgrounds with electrical and water hookups, sewer dump stations, or pull-through sites
3 3 3 3 3 3 3 3 3 3 4 5 3 3
Sheltered lodging facilities such as rustic cabins, yurts, and tent cabins
3 3 3 3 3 3 4 3 3 3 4 4 3 3
Commercial visitor services within public parks and outdoor recreation areas such as hotel, motels, restaurants, or shops
3 3 3 3 3 3 3 3 3 3 3 3 3 3
Areas for the legal use of off-highway vehicles such as motorcycles, dune buggies, 4-wheel drive vehicles, or all-terrain vehicles
3 1 3 3 3 3 4 5 2 1 3 4 3 3
Wilderness type areas where no vehicles or development are allowed
4 5 4 5 4 5 4 4 4 5 4 5 4 5
Developed fishing areas with piers and/or fish cleaning stations
3 3 4 4 3 3 4 4 3 4 4 4 4 4
Public hunting areas especially managed for waterfowl like ducks and geese
2 1 3 3 2 1 4 3 2 1 3 2 3 1
Launch ramps, marinas, and other boating facilities 3 3 3 3 3 3 4 5 3 3 4 5 3 3
Recreation facilities at lakes, rivers, and reservoirs
4 5 4 5 4 5 4 3 4 5 4 5 4 5
1 Rated on a scale from 1 = not at all important to 5 = very important. 2 Rounded to the nearest whole number; Me-Mean , Mo = mode Adult Mail-Back Survey (Q1)

167
Regional Adult Attitudes and Beliefs Regarding Outdoor Recreation
Regional Adult Opinions on State and Federal Agency Emphasis Respondents within each region thought that more governmental emphasis should be placed on most of these outdoor recreation aspects. A small percentage of Central Coast respondents wanted more emphasis on building more facilities and providing more organized activities and special events. Table 146. Emphasis of State and Federal Government Outdoor Recreation Agencies in California Should Place on Aspects of Outdoor Recreation- Central Coast Region.
Less Emphasis
About the Same
Emphasis
More Emphasis
Don't Know/ Unsure
Total Idea
% % % % % Buying additional parkland and open space for recreation purposes
8.3 36.5 40.6 14.6 100.0
Maintaining or caring for park and recreation areas
1.0 27.1 62.5 9.4 100.0
Providing educational programs 3.1 38.5 45.8 12.5 100.0Building new facilities 13.5 49.0 20.8 16.7 100.0Remodeling and improving existing facilities
2.1 25.0 58.3 14.6 100.0
Protecting natural resources 4.2 14.6 72.9 8.3 100.0
Protecting historic resources 5.2 17.7 66.7 10.4 100.0Providing more organized activities and special events
8.3 47.9 28.1 15.6 100.0
Cleaning up pollution of the ocean, lakes, rivers and streams in park and recreation areas
0.0 13.5 77.1 9.4 100.0
Adult Mail-Back Survey (Q8)
A large percentage of Central Valley respondents wanted more emphasis on maintaining or caring for and cleaning up water pollution at park and recreation areas.

168
Table 147. Emphasis of State and Federal Government Outdoor Recreation Agencies in California Should Place on Aspects of Outdoor Recreation- Central Valley Region.
Less Emphasis
About the Same
Emphasis
More Emphasis
Don't Know/ Unsure
Total Idea
% % % % % Buying additional parkland and open space for recreation purposes
7.5 33.3 47.2 11.9 100.0
Maintaining or caring for park and recreation areas
1.3 21.5 72.8 4.4 100.0
Providing educational programs 6.3 32.9 54.4 6.3 100.0Building new facilities 12.0 46.2 31.0 10.8 100.0Remodeling and improving existing facilities
2.5 25.3 65.8 6.3 100.0
Protecting natural resources 3.1 23.3 69.2 4.4 100.0Protecting historic resources 3.1 23.9 68.6 4.4 100.0Providing more organized activities and special events
12.7 43.7 34.8 8.9 100.0
Cleaning up pollution of the ocean, lakes, rivers and streams in park and recreation areas
1.9 17.7 75.3 5.1 100.0
Adult Mail-Back Survey (Q8)
A large percentage of Los Angeles repondents (83.4%) wanted more emphasis on cleaning up polluted water resources in park and recreation areas. Los Angeles respondents also wanted more emphasis on buying additional parkland and open space (75.3%). Table 148. Emphasis of State and Federal Government Outdoor Recreation Agencies in California Should Place on Aspects of Outdoor Recreation- Los Angeles Region.
Less Emphasis
About the Same
Emphasis
More Emphasis
Don't Know/ Unsure
Total Idea
% % % % % Buying additional parkland and open space for recreation purposes
1.9 17.7 75.3 5.1 100.0
Maintaining or caring for park and recreation areas
2.1 19.2 76.0 2.7 100.0
Providing educational programs 4.7 36.4 53.8 5.0 100.0Building new facilities 9.8 42.1 40.7 7.4 100.0Remodeling and improving existing facilities
1.8 21.6 70.4 6.2 100.0
Protecting natural resources 2.1 17.8 76.0 4.1 100.0Protecting historic resources 2.1 23.7 70.7 3.6 100.0

169
Table 148. Emphasis of State and Federal Government Outdoor Recreation Agencies in California Should Place on Aspects of Outdoor Recreation- Los Angeles Region.
Less Emphasis
About the Same
Emphasis
More Emphasis
Don't Know/ Unsure
Total Idea
% % % % % Providing more organized activities and special events
7.1 40.8 45.0 7.1 100.0
Cleaning up pollution of the ocean, lakes, rivers and streams in park and recreation areas
1.2 11.5 83.4 3.8 100.0
Adult Mail-Back Survey (Q8)
Within the Northern California region, respondents were most likely to agree with each other that they wanted more emphasis on park maintenance (70%) and cleaning up polluted water resources (72.5%). Table 149. Emphasis of State and Federal Government Outdoor Recreation Agencies in California Should Place on Aspects of Outdoor Recreation- Northern CA Region.
Less Emphasis
About the Same
Emphasis
More Emphasis
Don't Know/ Unsure
Total Idea
% % % % % Buying additional parkland and open space for recreation purposes
15.0 30.0 45.0 10.0 100.0
Maintaining or caring for park and recreation areas
0.0 27.5 70.0 2.5 100.0
Providing educational programs 5.0 45.0 45.0 5.0 100.0Building new facilities 10.0 57.5 25.0 7.5 100.0Remodeling and improving existing facilities
0.0 22.5 67.5 10.0 100.0
Protecting natural resources 2.5 30.0 60.0 7.5 100.0Protecting historic resources 0.0 42.5 50.0 7.5 100.0Providing more organized activities and special events
12.5 55.0 27.5 5.0 100.0
Cleaning up pollution of the ocean, lakes, rivers and streams in park and recreation areas
2.5 17.5 72.5 7.5 100.0
Adult Mail-Back Survey (Q8)

170
Within the San Francisco region, respondents were also most likely to agree with each other that they wanted more emphasis on park maintenance (75%) and cleaning up polluted water resources (75.8%). Table 150. Emphasis of State and Federal Government Outdoor Recreation Agencies in California Should Place on Aspects of Outdoor Recreation- San Francisco Region.
Less Emphasis
About the Same
Emphasis
More Emphasis
Don’t Know/ Unsure
Total Idea
% % % % % Buying additional parkland and open space for recreation purposes
4.1 32.1 56.0 7.8 100.0
Maintaining or caring for park and recreation areas
1.2 18.4 75.0 5.3 100.0
Providing educational programs 5.8 40.7 46.1 7.4 100.0Building new facilities 11.5 48.8 29.1 10.7 100.0Remodeling and improving existing facilities
3.7 28.7 61.9 5.7 100.0
Protecting natural resources 2.0 22.5 70.9 4.5 100.0Protecting historic resources 2.0 27.9 65.6 4.5 100.0Providing more organized activities and special events
13.5 48.4 27.9 10.2 100.0
Cleaning up pollution of the ocean, lakes, rivers and streams in park and recreation areas
3.7 13.1 75.8 7.4 100.0
Adult Mail-Back Survey (Q8)
A large percentage of Northern California respondents wanted more emphasis on maintaining or caring for and protectin natural resources at park and recreation areas. Table 151.Emphasis of State and Federal Government Outdoor Recreation Agencies in California Should Place on Aspects of Outdoor Recreation- Sierra Region.
Less Emphasis
About the Same
Emphasis
More Emphasis
Don't Know/ Unsure
Total Idea
% % % % % Buying additional parkland and open space for recreation purposes
9.7 38.7 38.7 12.9 100.0
Maintaining or caring for park and recreation areas
0.0 35.5 64.5 0.0 100.0
Providing educational programs 6.5 51.6 35.5 6.5 100.0Building new facilities 16.1 54.8 22.6 6.5 100.0

171
Table 151.Emphasis of State and Federal Government Outdoor Recreation Agencies in California Should Place on Aspects of Outdoor Recreation- Sierra Region.
Less Emphasis
About the Same
Emphasis
More Emphasis
Don't Know/ Unsure
Total Idea
% % % % % Remodeling and improving existing facilities
0.0 45.2 51.6 3.2 100.0
Protecting natural resources 0.0 32.3 61.3 6.5 100.0Protecting historic resources 0.0 41.9 54.8 3.2 100.0Providing more organized activities and special events
16.1 51.6 25.8 6.5 100.0
Cleaning up pollution of the ocean, lakes, rivers and streams in park and recreation areas
0.0 29.0 67.7 3.2 100.0
Adult Mail-Back Survey (Q8)
A large percentage of Southern California respondents wanted more emphasis on natural resource protection and cleaning up water pollution at park and recreation areas. Table 152. Emphasis of State and Federal Government Outdoor Recreation Agencies in California Should Place on Aspects of Outdoor Recreation- Southern CA Region.
Less Emphasis
About the Same
Emphasis
More Emphasis
Don't Know/ Unsure
Total Idea
% % % % % Buying additional parkland and open space for recreation purposes
6.5 32.5 47.4 13.6 100.0
Maintaining or caring for park and recreation areas
1.6 23.7 68.2 6.5 100.0
Providing educational programs 5.5 39.9 47.1 7.5 100.0Building new facilities 8.5 44.1 38.2 9.2 100.0Remodeling and improving existing facilities
3.2 24.4 64.9 7.5 100.0
Protecting natural resources 2.9 20.1 70.1 6.8 100.0Protecting historic resources 4.2 24.0 64.9 6.8 100.0Providing more organized activities and special events
10.4 41.4 37.8 10.4 100.0
Cleaning up pollution of the ocean, lakes, rivers and streams in park and recreation areas
2.9 14.0 76.2 6.8 100.0
Adult Mail-Back Survey (Q8)

172
Regional Adult Opinions on Outdoor Recreation in California In the Central Coast, the most important factor influencing respondents' choice of a favorite activity is to be with family and friends. The second most important factors are relaxing and having fun. The least important factors in this region were meeting new people and doing something that your children or grandchildren will enjoy. Table 153. Importance of Items to Respondents’ Favorite Activities- Central Coast Region.
Not at all Important
2 3 4 Very Important
TotalStatement
% % % % % % To be with family and friends 7.3 4.2 12.5 15.6 60.4 100.0To relax 1.0 2.1 11.5 28.1 57.3 100.0To have fun 1.0 0.0 10.4 31.3 57.3 100.0To view the scenic beauty 1.0 4.2 11.5 29.2 54.2 100.0To experience a change from daily routines
6.3 6.3 13.5 35.4 38.5 100.0
To get away from crowded situations
7.3 4.2 16.7 33.3 38.5 100.0
To keep fit and healthy 1.0 3.1 22.9 35.4 37.5 100.0To feel harmony with nature 7.3 11.5 24.0 25.0 32.3 100.0To do something your children or grandchildren enjoy
27.1 9.4 16.7 15.6 31.3 100.0
To be with others who enjoy the same things you do
8.3 11.5 26.0 26.0 28.1 100.0
To feel safe and secure 8.3 5.2 25.0 35.4 26.0 100.0To experience challenge and excitement
8.3 10.4 27.1 29.2 25.0 100.0
To learn something new 10.4 9.4 34.4 29.2 16.7 100.0To achieve spiritual fulfillment 21.9 14.6 27.1 20.8 15.6 100.0To meet new people 32.3 19.8 33.3 10.4 4.2 100.0Adult Mail-Back Survey (Q5)

173
In the Central Valley, the most important factors influencing respondents' choice of a favorite activity is to relax and have fun. The second most important factor is viewing scenic beauty. The least important factors in this region were meeting new people and doing something that your children or grandchildren will enjoy. Table 154. Importance of Items to Respondents’ Favorite Activities- Central Valley Region.
Not at all Important
2 3 4 Very Important
Total Statement
% % % % % % To relax 1.3 1.9 11.5 19.1 66.2 100.0To have fun 0.0 1.3 10.8 21.7 66.2 100.0To view the scenic beauty 1.3 1.3 13.5 22.6 61.3 100.0To be with family and friends 7.0 4.4 10.1 20.3 58.2 100.0To feel safe and secure 5.2 4.5 20.0 17.4 52.9 100.0To experience a change from daily routines
3.9 3.2 16.1 23.9 52.9 100.0
To get away from crowded situations
5.1 3.2 14.1 26.9 50.6 100.0
To do something your children or grandchildren enjoy
16.1 3.9 17.4 13.5 49.0 100.0
To keep fit and healthy 2.5 1.9 23.6 24.2 47.8 100.0To feel harmony with nature 7.1 7.1 14.8 23.2 47.7 100.0To be with others who enjoy the same things you do
9.0 5.2 21.3 28.4 36.1 100.0
To achieve spiritual fulfillment 15.7 13.1 22.9 16.3 32.0 100.0To experience challenge and excitement
11.0 9.7 18.8 30.5 29.9 100.0
To learn something new 10.4 9.1 19.5 32.5 28.6 100.0To meet new people 24.0 19.5 27.3 15.6 13.6 100.0Adult Mail-Back Survey (Q5)
In Los Angeles, the most important factor influencing respondents' choice of a favorite activity is to have fun. The second and third most important factors are to be with family and friends and to relax. The least important factors in this region were meeting new people and doing something that your children or grandchildren will enjoy. Table 155. Importance of Items to Respondents’ Favorite Activities- Los Angeles Region.
Not at all Important
2 3 4 Very Important
TotalStatement
% % % % % % To have fun 0.6 1.5 5.0 24.6 68.3 100.0To be with family and friends 5.0 2.9 9.7 19.1 63.3 100.0To relax 0.9 2.1 7.9 29.9 59.2 100.0To view the scenic beauty 2.1 2.9 10.9 28.5 55.6 100.0To keep fit and healthy 2.6 3.2 17.9 26.4 49.9 100.0

174
Table 155. Importance of Items to Respondents’ Favorite Activities- Los Angeles Region.
Not at all Important
2 3 4 Very Important
TotalStatement
% % % % % % To feel safe and secure 3.8 7.6 20.8 19.9 47.8 100.0To experience a change from daily routines
2.9 2.6 15.9 30.9 47.6 100.0
To get away from crowded situations
3.5 3.8 17.3 29.3 46.0 100.0
To be with others who enjoy the same things you do
7.6 4.4 19.6 26.7 41.6 100.0
To do something your children or grandchildren enjoy
24.0 5.6 17.8 13.9 38.6 100.0
To feel harmony with nature 5.3 8.8 20.0 28.2 37.6 100.0To experience challenge and excitement
7.0 8.8 19.9 32.0 32.3 100.0
To achieve spiritual fulfillment 13.6 13.0 26.0 20.1 27.4 100.0To learn something new 8.8 10.9 24.0 29.6 26.7 100.0To meet new people 21.2 14.4 32.4 17.4 14.7 100.0Adult Mail-Back Survey (Q5)
In the Northern California, the most important factor influencing respondents' choice of a favorite activity is to have fun. The second and third most important factors are relaxing and viewing scenic beauty. The least important factors in this region were meeting new people and doing something that your children or grandchildren will enjoy. Table 156. Importance of Items to Respondents’ Favorite Activities- Northern CA Region.
Not at all Important
2 3 4 Very Important
TotalStatement
% % % % % % To have fun 0.0 0.0 7.5 30.0 62.5 100.0To relax 0.0 0.0 7.5 35.0 57.5 100.0To view the scenic beauty 2.5 0.0 7.5 32.5 57.5 100.0To be with family and friends 7.5 7.5 12.5 17.5 55.0 100.0To feel harmony with nature 2.5 7.5 20.0 15.0 55.0 100.0To get away from crowded situations
2.5 0.0 12.5 35.0 50.0 100.0
To keep fit and healthy 0.0 2.5 20.0 30.0 47.5 100.0To be with others who enjoy the same things you do
7.5 5.0 22.5 20.0 45.0 100.0
To feel safe and secure 10.0 7.5 10.0 30.0 42.5 100.0To do something your children or grandchildren enjoy
22.5 7.5 17.5 12.5 40.0 100.0
To experience a change from daily routines
2.5 5.0 17.5 35.0 40.0 100.0

175
Table 156. Importance of Items to Respondents’ Favorite Activities- Northern CA Region.
Not at all Important
2 3 4 Very Important
TotalStatement
% % % % % % To achieve spiritual fulfillment 10.3 12.8 17.9 23.1 35.9 100.0To experience challenge and excitement
7.7 17.9 17.9 25.6 30.8 100.0
To learn something new 5.1 12.8 20.5 35.9 25.6 100.0To meet new people 25.6 20.5 28.2 17.9 7.7 100.0Adult Mail-Back Survey (Q5)
In San Francisco, the most important factor influencing respondents' choice of a favorite activity is to have fun. The second and third most important factors are to be with family and friends and to relax. The least important factors in this region were meeting new people and doing something that your children or grandchildren will enjoy. Table 157. Importance of Items to Respondents’ Favorite Activities- San Francisco Region.
Not at all Important
2 3 4 Very Important
TotalStatement
% % % % % % To have fun 0.4 0.8 11.2 24.9 62.7 100.0To be with family and friends 6.2 5.3 11.9 15.2 61.3 100.0To relax 1.2 2.1 11.9 26.7 58.0 100.0To view the scenic beauty 2.5 4.1 14.0 24.3 55.1 100.0To keep fit and healthy 3.3 2.5 19.3 25.5 49.4 100.0To experience a change from daily routines
4.9 4.1 19.3 26.2 45.5 100.0
To get away from crowded situations
3.3 5.8 18.1 28.8 44.0 100.0
To feel harmony with nature 7.4 7.0 21.5 23.1 40.9 100.0To feel safe and secure 11.3 7.5 20.4 20.4 40.4 100.0To do something your children or grandchildren enjoy
31.8 5.4 11.2 12.4 39.3 100.0
To be with others who enjoy the same things you do
8.3 11.6 18.6 27.7 33.9 100.0
To experience challenge and excitement
8.3 12.8 22.3 24.0 32.6 100.0
To achieve spiritual fulfillment 20.7 15.4 22.8 14.9 26.1 100.0To learn something new 17.3 12.3 21.0 23.5 25.9 100.0To meet new people 28.1 25.2 21.5 15.3 9.9 100.0Adult Mail-Back Survey (Q5)

176
In the Sierra, the most important factor influencing respondents' choice of a favorite activity is to view the scenic beauty. The second and third most important factors are to relax and to be with family and friends. The least important factors in this region were to achieve spiritual fulfillment and to do something that your children or grandchildren will enjoy. Table 158. Importance of Items to Respondents’ Favorite Activities- Sierra Region.
Not at all Important
2 3 4 Very Important
TotalStatement
% % % % % % To view the scenic beauty 3.2 0.0 9.7 16.1 71.0 100.0To relax 0.0 3.2 6.5 29.0 61.3 100.0To be with family and friends 3.2 6.5 19.4 12.9 58.1 100.0To have fun 0.0 3.2 6.5 32.3 58.1 100.0To get away from crowded situations
0.0 3.2 16.1 29.0 51.6 100.0
To do something your children or grandchildren enjoy
16.1 3.2 16.1 16.1 48.4 100.0
To experience a change from daily routines
0.0 0.0 19.4 32.3 48.4 100.0
To be with others who enjoy the same things you do
0.0 6.5 22.6 25.8 45.2 100.0
To feel safe and secure 0.0 12.9 19.4 29.0 38.7 100.0To keep fit and healthy 0.0 19.4 22.6 25.8 32.3 100.0To feel harmony with nature 9.7 16.1 25.8 19.4 29.0 100.0To learn something new 6.5 29.0 12.9 35.5 16.1 100.0To experience challenge and excitement
0.0 22.6 45.2 16.1 16.1 100.0
To achieve spiritual fulfillment 38.7 12.9 22.6 9.7 16.1 100.0To meet new people 12.9 19.4 45.2 16.1 6.5 100.0Adult Mail-Back Survey (Q5)
In Southern California, the most important factor influencing respondents' choice of a favorite activity is to have fun. The second and third most important factors are to be with family and friends and to relax. The least important factors in this region were to do something that your children or grandchildren will enjoy, to achieve spiritual fulfillment, and to meet new people. Table 159. Importance of Items to Respondents’ Favorite Activities- Southern CA Region.
Not at all Important
2 3 4 Very Important
TotalStatement
% % % % % % To have fun 1.0 1.0 10.1 21.8 66.2 100.0To be with family and friends 4.5 2.3 12.3 21.4 59.4 100.0To relax 2.3 1.9 10.7 28.9 56.2 100.0

177
Table 159. Importance of Items to Respondents’ Favorite Activities- Southern CA Region.
Not at all Important
2 3 4 Very Important
TotalStatement
% % % % % % To view the scenic beauty 4.5 3.2 13.0 29.5 49.7 100.0To do something your children or grandchildren enjoy
21.4 7.1 12.7 13.0 45.8 100.0
To keep fit and healthy 2.3 3.9 19.0 30.7 44.1 100.0To feel safe and secure 7.5 5.2 21.2 22.1 44.0 100.0To experience a change from daily routines
5.5 1.9 16.6 32.8 43.2 100.0
To get away from crowded situations
6.5 4.6 19.9 25.8 43.1 100.0
To be with others who enjoy the same things you do
8.5 5.2 17.3 28.7 40.4 100.0
To feel harmony with nature 10.1 6.5 23.1 23.4 37.0 100.0To experience challenge and excitement
9.4 7.2 27.7 26.1 29.6 100.0
To learn something new 11.7 9.4 25.0 28.2 25.6 100.0To achieve spiritual fulfillment 19.5 15.3 23.7 16.2 25.3 100.0To meet new people 19.0 19.9 27.8 16.0 17.3 100.0Adult Mail-Back Survey (Q5)
Half of Central Coast respondents strongly agreed that recreation programs help improve people’s health. Over half also agreed with the remaining statements, with the exception of recreation areas for camping or overnight use are needed, and private businesses should provide some of the outdoor recreation services at government owned facilities. Table 160. Respondents’ Level of Agreement with Statements Concerning Outdoor Recreation Lands and Facilities in California- Central Coast Region.
Strongly Disagree
Disagree Neither Disagree or Agree
Agree Strongly Agree
Total Statement
% % % % % % Recreation programs help improve people’s health
0.0 1.0 15.6 33.3 50.0 100.0
Fees collected at each park, wildlife and recreation area should be spent on that area
0.0 2.1 12.5 39.6 45.8 100.0
Rules and regulations in parks and outdoor recreation areas should be enforced
2.1 1.0 19.8 37.5 39.6 100.0
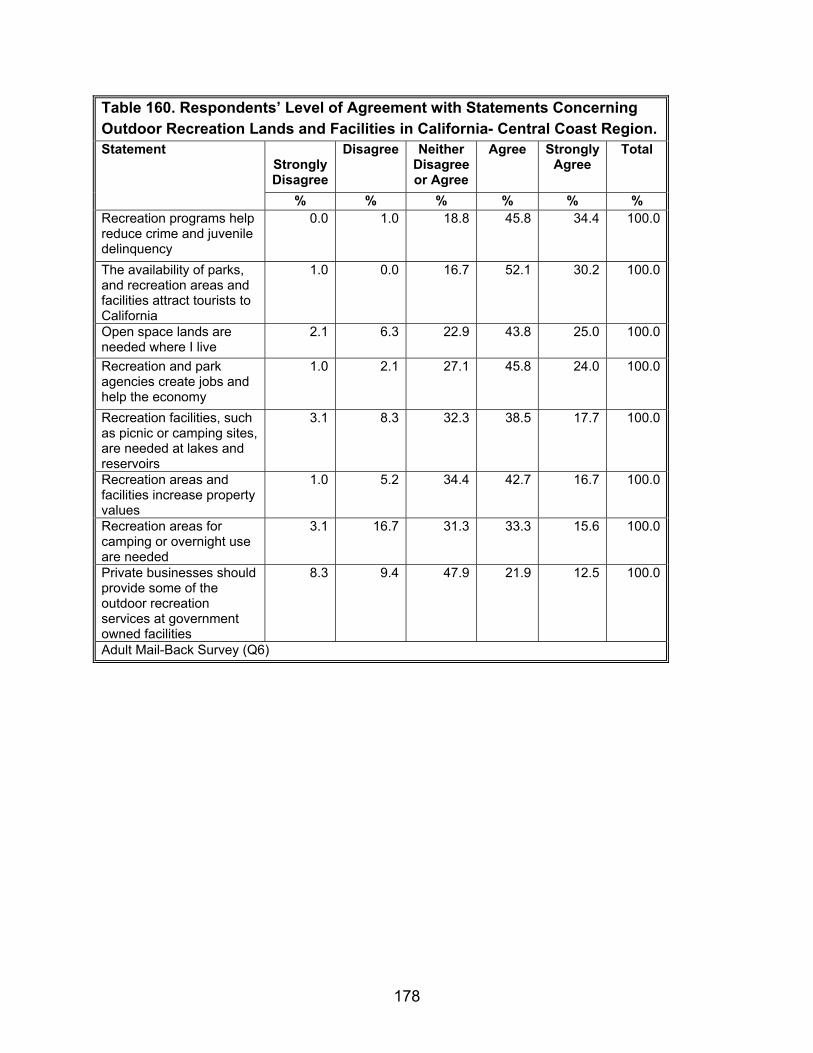
178
Table 160. Respondents’ Level of Agreement with Statements Concerning Outdoor Recreation Lands and Facilities in California- Central Coast Region.
Strongly Disagree
Disagree Neither Disagree or Agree
Agree Strongly Agree
Total Statement
% % % % % % Recreation programs help reduce crime and juvenile delinquency
0.0 1.0 18.8 45.8 34.4 100.0
The availability of parks, and recreation areas and facilities attract tourists to California
1.0 0.0 16.7 52.1 30.2 100.0
Open space lands are needed where I live
2.1 6.3 22.9 43.8 25.0 100.0
Recreation and park agencies create jobs and help the economy
1.0 2.1 27.1 45.8 24.0 100.0
Recreation facilities, such as picnic or camping sites, are needed at lakes and reservoirs
3.1 8.3 32.3 38.5 17.7 100.0
Recreation areas and facilities increase property values
1.0 5.2 34.4 42.7 16.7 100.0
Recreation areas for camping or overnight use are needed
3.1 16.7 31.3 33.3 15.6 100.0
Private businesses should provide some of the outdoor recreation services at government owned facilities
8.3 9.4 47.9 21.9 12.5 100.0
Adult Mail-Back Survey (Q6)

179
Over half of Central Valley respondents strongly agreed that fees collected at an area should stay in an area, rules should be enforced, and recreation programs help improve people’s health. The majority of respondents agreed with the remaining statements, with the exception of private businesses should provide some of the outdoor recreation services at government owned facilities. Table 161. Respondents’ Level of Agreement with Statements Concerning Outdoor Recreation Lands and Facilities in California- Central Valley Region.
Strongly Disagree
Disagree Neither Disagree or Agree
Agree Strongly Agree
Total Statement
% % % % % % Fees collected at each park, wildlife and recreation area should be spent on that area
1.9 5.0 13.8 23.1 56.3 100.0
Rules and regulations in parks and outdoor recreation areas should be enforced
0.0 1.9 13.8 29.4 55.0 100.0
Recreation programs help improve people’s health
0.0 1.3 10.7 37.1 50.9 100.0
The availability of parks, and recreation areas and facilities attract tourists to California
0.6 1.9 10.0 40.6 46.9 100.0
Recreation programs help reduce crime and juvenile delinquency
0.0 5.0 17.5 33.8 43.8 100.0
Recreation and park agencies create jobs and help the economy
1.9 3.1 19.4 35.0 40.6 100.0
Recreation facilities, such as picnic or camping sites, are needed at lakes and reservoirs
1.9 3.2 23.4 34.8 36.7 100.0
Recreation areas and facilities increase property values
0.6 5.0 28.8 32.5 33.1 100.0
Open space lands are needed where I live
2.5 6.3 25.9 38.0 27.2 100.0
Recreation areas for camping or overnight use are needed
2.5 6.9 24.5 42.8 23.3 100.0
Private businesses should provide some of the outdoor recreation services at government owned facilities
8.8 11.3 32.5 25.0 22.5 100.0
Adult Mail-Back Survey (Q6)

180
Over half of Los Angeles respondents strongly agreed that recreation programs help improve people’s health, and that fees collected at an area should stay in an area. The majority of respondents agreed with the remaining statements, with the exception of recreation areas for camping or overnight use are needed, and private businesses should provide some of the outdoor recreation services at government owned facilities. Table 162. Respondents’ Level of Agreement with Statements Concerning Outdoor Recreation Lands and Facilities in California- Los Angeles Region.
Strongly Disagree
Disagree Neither Disagree or Agree
Agree Strongly Agree
Total Statement
% % % % % % Recreation programs help improve people’s health
0.6 0.6 8.2 35.2 55.4 100.0
Fees collected at each park, wildlife and recreation area should be spent on that area
1.5 2.9 11.1 32.0 52.5 100.0
Rules and regulations in parks and outdoor recreation areas should be enforced
0.6 2.6 13.5 34.9 48.4 100.0
Recreation programs help reduce crime and juvenile delinquency
0.9 4.1 13.2 36.4 45.5 100.0
Recreation and park agencies create jobs and help the economy
0.6 2.6 20.5 35.5 40.8 100.0
The availability of parks, and recreation areas and facilities attract tourists to California
1.2 2.6 19.4 36.1 40.8 100.0
Open space lands are needed where I live
1.2 5.9 21.1 35.8 36.1 100.0
Recreation areas and facilities increase property values
1.8 3.5 24.0 36.7 34.0 100.0
Recreation facilities, such as picnic or camping sites, are needed at lakes and reservoirs
1.8 4.7 20.8 46.6 26.1 100.0
Recreation areas for camping or overnight use are needed
5.6 13.8 31.1 31.7 17.9 100.0
Private businesses should provide some of the outdoor recreation services at government owned facilities
7.0 9.4 39.9 28.2 15.5 100.0
Adult Mail-Back Survey (Q6)

181
Over half of Northern California respondents strongly agreed that fees collected at an area should stay in that area, and that rules should be enforced. The majority of respondents agreed with the remaining statements, with the exception of private businesses should provide some of the outdoor recreation services at government owned facilities. Table 163. Respondents’ Level of Agreement with Statements Concerning Outdoor Recreation Lands and Facilities in California- Northern CA Region.
Strongly Disagree
Disagree Neither Disagree or Agree
Agree Strongly Agree
Total Statement
% % % % % % Fees collected at each park, wildlife and recreation area should be spent on that area
0.0 2.5 12.5 27.5 57.5 100.0
Rules and regulations in parks and outdoor recreation areas should be enforced
0.0 2.5 15.0 30.0 52.5 100.0
Recreation programs help improve people’s health
0.0 0.0 10.0 45.0 45.0 100.0
The availability of parks, and recreation areas and facilities attract tourists to California
0.0 0.0 10.0 47.5 42.5 100.0
Recreation and park agencies create jobs and help the economy
0.0 0.0 17.5 45.0 37.5 100.0
Recreation programs help reduce crime and juvenile delinquency
2.5 2.5 15.0 47.5 32.5 100.0
Open space lands are needed where I live
0.0 17.9 17.9 35.9 28.2 100.0
Recreation facilities, such as picnic or camping sites, are needed at lakes and reservoirs
0.0 10.0 15.0 50.0 25.0 100.0
Recreation areas and facilities increase property values
5.0 5.0 30.0 37.5 22.5 100.0
Recreation areas for camping or overnight use are needed
0.0 10.0 27.5 45.0 17.5 100.0
Private businesses should provide some of the outdoor recreation services at government owned facilities
12.5 12.5 37.5 30.0 7.5 100.0
Adult Mail-Back Survey (Q6)

182
Over half of San Francisco respondents strongly agreed that recreation programs help improve people’s health. The majority of respondents agreed with the remaining statements, with the exception of private businesses should provide some of the outdoor recreation services at government owned facilities. Table 164. Respondents’ Level of Agreement with Statements Concerning Outdoor Recreation Lands and Facilities in California- San Francisco Region.
Strongly Disagree
Disagree Neither Disagree or Agree
Agree Strongly Agree
Total Statement
% % % % % % Recreation programs help improve people’s health
1.2 0.4 11.1 36.5 50.8 100.0
Rules and regulations in parks and outdoor recreation areas should be enforced
0.8 0.8 15.6 36.5 46.3 100.0
Fees collected at each park, wildlife and recreation area should be spent on that area
1.2 6.2 18.9 28.8 44.9 100.0
The availability of parks, and recreation areas and facilities attract tourists to California
2.5 1.2 15.6 36.5 44.3 100.0
Recreation programs help reduce crime and juvenile delinquency
2.0 2.9 20.9 31.6 42.6 100.0
Recreation areas and facilities increase property values
3.3 1.2 23.4 34.0 38.1 100.0
Recreation and park agencies create jobs and help the economy
2.5 3.3 23.4 33.2 37.7 100.0
Open space lands are needed where I live
1.2 4.9 19.3 39.1 35.4 100.0
Recreation facilities, such as picnic or camping sites, are needed at lakes and reservoirs
2.9 6.2 21.1 38.8 31.0 100.0
Recreation areas for camping or overnight use are needed
5.8 14.8 26.3 30.0 23.0 100.0
Private businesses should provide some of the outdoor recreation services at government owned facilities
8.2 11.1 39.1 24.3 17.3 100.0
Adult Mail-Back Survey (Q6)

183
Over half of Sierra respondents strongly agreed that fees collected at an area should stay in that area, and that rules should be enforced. The majority of respondents agreed with the remaining statements, with the exception of private businesses should provide some of the outdoor recreation services at government owned facilities. Table 165. Respondents’ Level of Agreement with Statements Concerning Outdoor Recreation Lands and Facilities in California- Sierra Region.
Strongly Disagree
Disagree Neither Disagree or Agree
Agree Strongly Agree
Total Statement
% % % % % % Fees collected at each park, wildlife and recreation area should be spent on that area
0.0 3.2 3.2 25.8 67.7 100.0
Rules and regulations in parks and outdoor recreation areas should be enforced
0.0 6.5 6.5 35.5 51.6 100.0
Recreation programs help improve people’s health
0.0 3.2 16.1 35.5 45.2 100.0
The availability of parks, and recreation areas and facilities attract tourists to California
0.0 3.2 9.7 41.9 45.2 100.0
Recreation and park agencies create jobs and help the economy
0.0 6.5 12.9 38.7 41.9 100.0
Recreation programs help reduce crime and juvenile delinquency
3.2 0.0 25.8 32.3 38.7 100.0
Recreation facilities, such as picnic or camping sites, are needed at lakes and reservoirs
6.5 0.0 25.8 35.5 32.3 100.0
Open space lands are needed where I live
6.5 6.5 32.3 25.8 29.0 100.0
Recreation areas for camping or overnight use are needed
6.5 6.5 22.6 35.5 29.0 100.0
Recreation areas and facilities increase property values
0.0 0.0 25.8 48.4 25.8 100.0
Private businesses should provide some of the outdoor recreation services at government owned facilities
6.5 16.1 51.6 19.4 6.5 100.0
Adult Mail-Back Survey (Q6)

184
Over half of Southern California respondents strongly agreed that fees collected at an area should stay in that area, and that rules should be enforced. The majority of respondents agreed with the remaining statements, with the exception of private businesses should provide some of the outdoor recreation services at government owned facilities. Table 166. Respondents’ Level of Agreement with Statements Concerning Outdoor Recreation Lands and Facilities in California- Southern CA Region.
Strongly Disagree
Disagree Neither Disagree or Agree
Agree Strongly Agree
Total Statement
% % % % % % Fees collected at each park, wildlife and recreation area should be spent on that area
1.6 2.3 13.6 29.8 52.8 100.0
Rules and regulations in parks and outdoor recreation areas should be enforced
1.0 1.6 12.0 35.0 50.5 100.0
Recreation programs help improve people’s health
1.0 1.3 12.3 35.1 50.3 100.0
Recreation programs help reduce crime and juvenile delinquency
1.6 3.6 17.5 36.6 40.8 100.0
The availability of parks, and recreation areas and facilities attract tourists to California
1.6 2.6 17.9 38.0 39.9 100.0
Recreation and park agencies create jobs and help the economy
1.0 1.9 20.8 40.3 36.0 100.0
Recreation areas and facilities increase property values
0.6 3.2 24.7 36.4 35.1 100.0
Open space lands are needed where I live
2.9 8.1 19.0 38.1 31.9 100.0
Recreation facilities, such as picnic or camping sites, are needed at lakes and reservoirs
2.6 3.9 24.9 42.7 25.9 100.0
Recreation areas for camping or overnight use are needed
5.2 9.4 29.1 35.3 21.0 100.0
Private businesses should provide some of the outdoor recreation services at government owned facilities
5.2 10.0 38.5 28.8 17.5 100.0
Adult Mail-Back Survey (Q6)

185
Regional Adult Respondent Preferences for Privatization Of all the activities and services, Los Angeles respondents were most likely to agree that sponsorship of special events was the most appropriate. San Francisco (74.9%), Central Coast (78.1%), Central Valley (76.7%), Sierra (71%), and Southern California (77.9) respondents thought that recreation equipment rentals were the most appropriate. Northern California (75%) and Sierra (71%) respondents thought that food services were the most appropriate (75%). Table 167. Activities or Services Respondents Think are Appropriate for a Private Firm to Provide in Public Park and Recreation Areas by Region.
Central Coast
Central Valley
Los Angeles
Northern CA
San Francisco
Sierra Southern CA
Activity/Service
% % % % % % % Food services such the sale of ready-to-eat food and beverages
72.9 69.6 77.2 75.0 71.0 71.0 71.8
Sponsorship of contests, races, and special events
77.1 72.3 74.3 57.5 71.8 67.7 72.3
General maintenance of facilities and grounds
50.0 59.7 62.1 50.0 52.5 38.7 60.8
Patrol and law enforcement duties
40.6 47.2 45.6 40.0 38.8 25.8 45.0
Guided nature walks, educational activities
56.3 49.1 51.5 47.5 45.3 29.0 48.9
Operation and maintenance of campgrounds or other lodging facilities
56.3 59.1 58.9 47.5 49.4 48.4 56.6
Rental of recreational equipment such as boats
78.1 76.7 73.1 67.5 74.9 71.0 77.9
Total operation and management of the park or recreation area
18.8 28.3 32.2 15.0 26.9 12.9 29.6
Operation of marinas and boat launching facilities
51.0 57.9 47.9 60.0 49.8 41.9 52.6
Adult Mail-Back Survey (Q7)

186
Regional Adult Respondents' Opinions on Park Agencies'’ Role in Addressing Climate Change
A majority of Central Coast respondents strongly agree that California park agencies should reduce climate-changing gases and strongly disagree that nothing should be done. Table 168. Respondents Level of Agreement with Statements Concerning California Park Agencies Efforts to Reduce and Adapt to Climate Change and Global Warming-Central Coast
Strongly Disagree
Disagree Neither Disagree or Agree
Agree Strongly Agree
Don't Know
Total Statement
% % % % % % % Educate Californians 13.5 4.2 8.3 38.5 33.3 2.1 100.0Reduce climate-changing gases
9.4 2.1 7.3 28.1 51.0 2.1 100.0
Anticipate the effects of climate change
11.5 1.0 13.5 30.2 42.7 1.0 100.0
Do nothing 60.4 18.8 8.3 2.1 9.4 1.0 100.0Adult Mail-Back Survey (Q10)
A large percentage of Central Valley respondents also strongly agree that California park agencies should reduce climate-changing gases. Table 169. Respondents Level of Agreement with Statements Concerning California Park Agencies Efforts to Reduce and Adapt to Climate Change and Global Warming-Central Valley
Strongly Disagree
Disagree Neither Disagree or Agree
Agree Strongly Agree
Don't Know
Total Statement
% % % % % % % Educate Californians 14.1 6.4 21.2 26.3 31.4 0.6 100.0Reduce climate-changing gases
9.6 4.5 14.1 27.6 43.6 0.6 100.0
Anticipate the effects of climate change
8.3 7.7 17.9 30.1 32.7 3.2 100.0
Do nothing 47.4 17.3 13.5 7.7 10.9 3.2 100.0Adult Mail-Back Survey (Q10)

187
A majority of Los Angeles respondents strongly agree that California park agencies should reduce climate-changing gases and strongly disagree that nothing should be done. Table 170. Respondents Level of Agreement with Statements Concerning California Park Agencies Efforts to Reduce and Adapt to Climate Change and Global Warming-Los Angeles
Strongly Disagree
Disagree Neither Disagree or Agree
Agree Strongly Agree
Don't Know
Total Statement
% % % % % % % Educate Californians 7.4 4.7 17.5 31.1 38.2 1.2 100.0Reduce climate-changing gases
4.4 2.7 8.3 29.6 53.0 2.1 100.0
Anticipate the effects of climate change
5.6 4.1 14.5 31.1 42.9 1.8 100.0
Do nothing 57.9 16.9 11.6 5.3 6.5 1.8 100.0Adult Mail-Back Survey (Q10)
A majority of Northern California respondents strongly agree that California park agencies should reduce climate-changing gases and strongly disagree that nothing should be done. Table 171. Respondents Level of Agreement with Statements Concerning California Park Agencies Efforts to Reduce and Adapt to Climate Change and Global Warming-Northern CA
Strongly Disagree
Disagree Neither Disagree or Agree
Agree Strongly Agree
Don't Know
Total Statement
% % % % % % % Educate Californians 2.5 2.5 27.5 27.5 40.0 0.0 100.0Reduce climate-changing gases
0 2.5 17.5 22.5 55.0 2.5 100.0
Anticipate the effects of climate change
0.0 2.5 22.5 30.0 42.5 2.5 100.0
Do nothing 62.5 12.5 20.0 0.0 5.0 0.0 100.0Adult Mail-Back Survey (Q10)

188
A large percentage of San Francisco respondents strongly agree that California park agencies should reduce climate-changing gases and anticipate the effects of climate change. Table 172. Respondents Level of Agreement with Statements Concerning California Park Agencies Efforts to Reduce and Adapt to Climate Change and Global Warming-San Francisco
Strongly Disagree
Disagree Neither Disagree or Agree
Agree Strongly Agree
Don't Know
Total Statement
% % % % % % % Educate Californians 7.0 6.1 18.9 29.5 36.5 2.0 100.0Reduce climate-changing gases
3.3 2.5 10.7 34.0 46.7 2.9 100.0
Anticipate the effects of climate change
4.5 2.5 13.2 32.1 44.9 2.9 100.0
Do nothing 54.7 18.5 11.9 5.3 7.0 2.5 100.0Adult Mail-Back Survey (Q10)
A large percentage of Sierra respondents strongly agree that California park agencies should reduce climate-changing gases. Table 173. Respondents Level of Agreement with Statements Concerning California Park Agencies Efforts to Reduce and Adapt to Climate Change and Global Warming-Sierra
Strongly Disagree
Disagree Neither Disagree or Agree
Agree Strongly Agree
Don't Know
Total Statement
% % % % % % % Educate Californians 12.9 16.1 25.8 22.6 22.6 0.0 100.0Reduce climate-changing gases
9.7 3.2 22.6 19.4 41.9 3.2 100.0
Anticipate the effects of climate change
12.9 12.9 9.7 22.6 35.5 6.5 100.0
Do nothing 35.5 16.1 16.1 6.5 19.4 6.5 100.0Adult Mail-Back Survey (Q10)

189
A large percentage of Southern California respondents strongly agree that California park agencies should reduce climate-changing gases and strongly disagree that nothing should be done. Table 174. Respondents Level of Agreement with Statements Concerning California Park Agencies Efforts to Reduce and Adapt to Climate Change and Global Warming-Southern CA
Strongly Disagree
Disagree Neither Disagree or Agree
Agree Strongly Agree
Don't Know
Total Statement
% % % % % % % Educate Californians 9.4 6.5 21.2 27.4 33.2 2.3 100.0Reduce climate-changing gases
4.9 3.6 13.1 28.1 46.4 3.9 100.0
Anticipate the effects of climate change
5.5 6.2 18.6 30.0 35.2 4.6 100.0
Do nothing 49.2 18.2 12.7 7.2 8.1 4.6 100.0Adult Mail-Back Survey (Q10)

190

191
FINAL OVERALL RECOMMENDATIONS General Findings Californians are visiting parks, yet feel as though more maintenance and care should be given to them. This includes law enforcement efforts, pollution control, and overall maintenance for facilities. Californians are concerned about the health of the environment, with more than two-thirds suggesting that pollution, maintenance of existing facilities, and preservation of cultural and historic heritage should receive focus by recreation and park providers. Californians support private businesses in the provision of rental equipment, food services, sponsorship of events, operation of camping, lodging, and marina facilities, and maintenance of parks at publicly managed parks. Most Californians believe the job of law enforcement and management of areas should remain with the public park and recreation agencies. Californians think park and recreation agencies should address climate change by reducing green house gases, education, and management actions to mitigate the impacts. They agree that doing nothing is not an option. Therefore, it appears that agencies providing park resources and recreation can play a proactive role in education and mitigating the impacts of global climate change. Hispanic respondents felt even more strongly than non-Hispanics that state and federal government agencies should place more emphasis on protecting historic resources. Californians visit a diversity of park types in general - from natural to cultural and developed to remote or wilderness areas. Hispanics visit highly developed parks and recreation areas more frequently than non-Hispanics and visit natural and developed areas less frequently. Park and recreation providers should take care to maintain this diversity. Hispanic Recreation Patterns The Hispanic population will have a substantial and growing influence on outdoor recreation within the state. Park and recreation providers should focus increased attention on addressing the significant differences between Hispanic and Non-Hispanic recreation behavior, activity participation and choices of facilities and amenities that include:
• Hispanics reported going to parks with more people under the age of 18 than did
non-Hispanics.

192
• Hispanics were more likely to have participated in sports, jogging/running, and playing than were non-Hispanics. In contrast, Hispanics were less likely to have participated in hiking and fishing than were non-Hispanics.
• Hispanics were more likely than non-Hispanics to use:
• Swimming pools • Picnic tables • Amusement areas • Playgrounds • Tennis or Basketball courts • Organized sports fields • Open spaces to play • Skate parks
• Hispanics were less likely than non-Hispanics to use: • Beach or water recreation areas • Scenic observation/wildlife viewing area • Unpaved multipurpose trails
Locale is important. Recreation providers should continue to evaluate the accessibility of local parks for all citizens in California. Although Hispanics visited parks more frequently during the last 12 months compared to non-Hispanics, there were no significant differences between Hispanics and non-Hispanics for their travel time to recreation areas. It appears that having local parks will continue to encourage increased use by local community members. Large majorities of Californians are physically active; however, more Hispanic respondents reported that a barrier to their physical activity in parks was because they were physically active elsewhere. Therefore, parks and recreation facilities and areas/resources should continue to provide increased access and promote safe and accessible venues for physical activity. Constraints to participation appear to focus on issues relative to safety (perceived gang activity and alcohol and drugs), as well as poor facilities maintenance. Respondents from all five regions identified gang activity as the biggest factor limiting their level of physical activity in a park. These concerns are expressed equally between the Hispanic and non-Hispanic survey respondents. Californians are generally pleased with existing facilities, with the exception of the constraints mentioned above. Park and recreation providers should continually seek ways to provide a safe environment as well as maintain existing facilities. Additionally, continuing to provide access to trailways or safe walking, hiking activities will help meet the demands of outdoor recreationists in California.

193
Youth Characteristics Youth generally participate in activities in and around their neighborhoods or in their community—therefore the provision of local recreation activities for all youth should remain a high priority, with safe accessibility to these activities. Youth continue to enjoy access to safe opportunities for walking, bicycling, playing, and swimming at paths, trails, sidewalks, swimming pools, and parks. Increasing access to safe and local venues for these activities should remain a high priority for continued youth participation. Youth identified an increased desire to have greater access to snow play activities (sledding, ice-skating, snow boarding), swimming in a pool, and motorized water sports. We recommend maintaining opportunities for winter activities for youth from both urban and rural environments. It appears youth are participating in six of the 10 activities identified by the Children’s Outdoor Bill of Rights. We recommend that programs continue to focus on all 10 activities, but perhaps pay special attention to fishing, celebrating their heritage, camping overnight, and playing on a team. Because youth appear to be “too busy” often times to participate in outdoor activities, our recommendation is to continue to provide accessible activities close to home and in safe environments, and providing the equipment necessary to participate. Regional Differences Park and recreation providers can address the regional differences in recreation behavior, activity participation and choices of facilities and amenities reported by respondents from the Central Coast, Central Valley, Los Angeles, Northern California, San Francisco, Sierra and Southern California regions. Regional providers should focus on the regional differences detailed in the regional survey analysis. concentrating their efforts to provide recreation opportunities tailroed to their residents and considering their regional preferences. For example, respondents from the San Francisco and Los Angeles regions were most likely to agree that they wanted more emphasis on park maintenance and cleaning up polluted water resources. Providers in these regions should focus their efforts in these areas. Central Valley and Sierra park and recreation providers also need to focus on providing more local park and recreation opportunities. The largest percentages of Central Valley respondents reported driving for less than five minutes, driving for more than 60 minutes, or walking for five or less minutes to the place they most often visit for recreation. The largest percentages of Sierra respondents either drove for 21-60

194
minutes or walked five minutes or less to reach their most frequently visited recreation destination. Recreation providers should pay particular attention to the specific activity participation patterns, demand for more activity opportunities and factors limiting physical activity at parks expressed by respondents from their regions.

195
REFERENCES
Bureau of Labor Statistics (2008). ATUS latest number: Leisure and sports. Retrieved
on October 26, 2008, from http://www.bls.gov/tus/current/leisure.htm Cordell, H.K., & Betz, C., Green, G.T., Fly, M., Stephens, B., & Leeworthy, R. (2006).
Recreation statistics update: Western and Mid-western metropolitan residents participation in nature-based activities. Update Report No. 9. Retrieved on October 26, 2008 from http://www.srs.fs.usda.gov/trends/RECUPDATES/selectrtsu.html
Cordell, H.K., Betz, C.J., & Green, G.T. (2008). Nature-based outdoor recreation trends
and wilderness. International Journal of Wilderness, 14(2), 7-9, 13. Dillman, D.A. (2000). Mail and internet surveys: The tailored design method (2nd Ed).
New York, NY: John Wiley & Sons, Inc.
Energy Information Administration (2008). Gasoline and diesel fuel update. Retrieved on October 30, 2008, from http://tonto.eia.doe.gov/oog/info/gdu/gasdiesel.asp
Iso-Ahola, S. E., Jackson, E. L., & Dunn, E. (1994). Starting, ceasing, and replacing leisure activities over the life span. Journal of Leisure Research 26(3), 227-249.
Jackson, E. L. (1994). Activity-specific constraints on leisure participation. Journal of
Park and Recreation Administration, 12(2), 33-49. Jackson, E. L. (1987). Outdoor recreation participation and views on resource
Development and Preservation. Leisure Sciences, 9, 235-250. National Center for Health Statistics (2007). NCHS-FASTATS – Exercise/physical
activity. Retrieved on October 26, 2008, from http://www.cdc.gov/nchs/fastats/exercise.htm
Strauss, A. & Corbin, J. (1990). Basics of Qualitative Research. Newbury, California:
Sage Publication, Inc.
United States Fish and Wildlife Service (2007) Fishing and hunting recruitment and retention in the U.S. from 1990 to 2005: Addendum to the 2001 national survey of fishing, hunting, and wildlife-associated recreation. Report 2001-11. Retrieved on October 30, 2008 from http://www.funoutdoors.com/research
United States Forest Service (2006). 2002-2004 National survey on recreation and the
environment. Retrieved on October 29, 2008 from http://www.srs.fs.usda.gov/trends/RECUPDATES/NFRS/angeles1.html

196

197
Appendix A: Open-Ended Responses - Adult Respondents Table A-1. Respondents’ Zip Codes. Zip Code n 94601 19 95616 12 90011 11 92126 11 94080 11 90046 10 91331 10 91367 10 92154 10 93003 10 93405 10 94954 10 90034 9 90808 9 91335 9 92037 9 92503 9 92780 9 95060 9 95112 9 91320 8 91343 8 92570 8 92703 8 93101 8 93955 8 94518 8 95020 8 90002 7 90026 7 90201 7 91304 7 91306 7 91745 7 91801 7 91910 7 92105 7 92544 7 92882 7
Table A-1. Respondents’ Zip Codes. Zip Code n 93063 7 93307 7 93611 7 94110 7 94509 7 94510 7 94538 7 95969 7 90003 6 90032 6 90042 6 90044 6 90630 6 90631 6 90640 6 90650 6 90744 6 91016 6 91303 6 91911 6 92104 6 92128 6 92404 6 92627 6 92708 6 92805 6 93401 6 93703 6 94044 6 94109 6 94116 6 94521 6 94558 6 94568 6 94591 6 94801 6 95062 6 95111 6 95123 6

198
Table A-1. Respondents’ Zip Codes. Zip Code n 95124 6 95404 6 95476 6 95624 6 95630 6 95687 6 90007 5 90019 5 90027 5 90045 5 90066 5 90280 5 90604 5 90620 5 90638 5 90703 5 90731 5 90804 5 90805 5 91311 5 91326 5 91342 5 91403 5 91406 5 91505 5 91711 5 91730 5 91754 5 91803 5 92021 5 92024 5 92026 5 92083 5 92122 5 92127 5 92130 5 92307 5 92311 5 92324 5 92376 5 92507 5
Table A-1. Respondents’ Zip Codes. Zip Code n 92509 5 92553 5 92626 5 92683 5 92804 5 92807 5 92870 5 92886 5 93111 5 93230 5 93308 5 93312 5 93536 5 93555 5 93950 5 94103 5 94117 5 94501 5 94533 5 94602 5 94611 5 95014 5 95076 5 95127 5 95209 5 95240 5 95336 5 95521 5 95818 5 95822 5 95825 5 96001 5 90006 4 90018 4 90024 4 90025 4 90029 4 90031 4 90043 4 90047 4 90065 4

199
Table A-1. Respondents’ Zip Codes. Zip Code n 90069 4 90241 4 90250 4 90255 4 90275 4 90501 4 90605 4 90723 4 90813 4 90815 4 91001 4 91006 4 91040 4 91042 4 91104 4 91360 4 91402 4 91423 4 91601 4 91605 4 91710 4 91723 4 91750 4 91761 4 91766 4 91770 4 91786 4 91789 4 91941 4 91977 4 92027 4 92054 4 92064 4 92065 4 92071 4 92123 4 92264 4 92392 4 92506 4 92563 4 92592 4
Table A-1. Respondents’ Zip Codes. Zip Code n 92617 4 92646 4 92647 4 92677 4 92879 4 92880 4 93001 4 93021 4 93065 4 93117 4 93257 4 93309 4 93420 4 93436 4 93446 4 93551 4 93711 4 93722 4 94025 4 94062 4 94070 4 94102 4 94118 4 94121 4 94403 4 94531 4 94544 4 94559 4 94580 4 94703 4 94705 4 94709 4 94803 4 94806 4 94903 4 94965 4 95035 4 95051 4 95116 4 95118 4 95136 4

200
Table A-1. Respondents’ Zip Codes. Zip Code n 95205 4 95337 4 95355 4 95376 4 95501 4 95608 4 95618 4 95620 4 95621 4 95660 4 95678 4 95695 4 95826 4 95831 4 95843 4 95973 4 90004 3 90016 3 90017 3 90020 3 90022 3 90039 3 90059 3 90063 3 90064 3 90068 3 90220 3 90221 3 90247 3 90262 3 90265 3 90266 3 90405 3 90503 3 90504 3 90505 3 90601 3 90603 3 90660 3 90807 3 91007 3
Table A-1. Respondents’ Zip Codes. Zip Code n 91010 3 91030 3 91106 3 91107 3 91206 3 91214 3 91321 3 91325 3 91344 3 91350 3 91351 3 91355 3 91377 3 91387 3 91401 3 91405 3 91504 3 91506 3 91604 3 91607 3 91702 3 91722 3 91744 3 91748 3 91764 3 91768 3 91780 3 91790 3 91942 3 92008 3 92020 3 92025 3 92029 3 92040 3 92078 3 92082 3 92084 3 92101 3 92110 3 92115 3 92119 3

201
Table A-1. Respondents’ Zip Codes. Zip Code n 92129 3 92220 3 92236 3 92284 3 92301 3 92314 3 92336 3 92337 3 92345 3 92354 3 92374 3 92501 3 92505 3 92508 3 92562 3 92591 3 92620 3 92624 3 92637 3 92648 3 92673 3 92691 3 92692 3 92701 3 92704 3 92706 3 92802 3 92806 3 92808 3 92832 3 92833 3 92843 3 93004 3 93010 3 93041 3 93215 3 93280 3 93292 3 93311 3 93422 3 93454 3
Table A-1. Respondents’ Zip Codes. Zip Code n 93455 3 93458 3 93702 3 93705 3 93710 3 93720 3 93726 3 93907 3 93933 3 94010 3 94014 3 94015 3 94019 3 94030 3 94089 3 94107 3 94112 3 94305 3 94506 3 94517 3 94523 3 94526 3 94534 3 94536 3 94542 3 94550 3 94553 3 94556 3 94566 3 94574 3 94577 3 94598 3 94606 3 94610 3 94704 3 94708 3 94941 3 94952 3 94960 3 95023 3 95050 3

202
Table A-1. Respondents’ Zip Codes. Zip Code n 95054 3 95120 3 95125 3 95129 3 95132 3 95210 3 95215 3 95219 3 95340 3 95350 3 95403 3 95407 3 95409 3 95492 3 95503 3 95610 3 95632 3 95670 3 95747 3 95819 3 95820 3 95833 3 95926 3 95928 3 95949 3 95963 3 96002 3 96003 3 96007 3 96150 3 90001 2 90008 2 90014 2 90015 2 90023 2 90035 2 90036 2 90041 2 90049 2 90057 2 90230 2
Table A-1. Respondents’ Zip Codes. Zip Code n 90242 2 90245 2 90249 2 90254 2 90272 2 90274 2 90292 2 90293 2 90301 2 90403 2 90602 2 90670 2 90680 2 90706 2 90710 2 90716 2 90720 2 90740 2 90802 2 90806 2 90810 2 91024 2 91103 2 91105 2 91108 2 91202 2 91208 2 91340 2 91354 2 91362 2 91436 2 91501 2 91502 2 91701 2 91706 2 91709 2 91731 2 91732 2 91741 2 91762 2 91776 2

203
Table A-1. Respondents’ Zip Codes. Zip Code n 91784 2 91791 2 92010 2 92014 2 92019 2 92028 2 92056 2 92057 2 92081 2 92103 2 92108 2 92116 2 92118 2 92120 2 92124 2 92131 2 92139 2 92173 2 92201 2 92211 2 92225 2 92227 2 92232 2 92240 2 92241 2 92243 2 92251 2 92252 2 92260 2 92262 2 92308 2 92316 2 92325 2 92335 2 92344 2 92377 2 92395 2 92407 2 92504 2 92530 2 92545 2
Table A-1. Respondents’ Zip Codes. Zip Code n 92555 2 92557 2 92571 2 92584 2 92595 2 92605 2 92606 2 92610 2 92612 2 92614 2 92630 2 92649 2 92653 2 92656 2 92672 2 92679 2 92694 2 92782 2 92801 2 92821 2 92831 2 92835 2 92840 2 92844 2 92860 2 92865 2 92867 2 92869 2 92881 2 92883 2 93033 2 93035 2 93105 2 93110 2 93210 2 93225 2 93240 2 93256 2 93291 2 93444 2 93449 2

204
Table A-1. Respondents’ Zip Codes. Zip Code n 93535 2 93552 2 93560 2 93612 2 93635 2 93638 2 93644 2 93647 2 93657 2 93704 2 93727 2 93728 2 93901 2 93905 2 93940 2 94066 2 94086 2 94087 2 94122 2 94127 2 94133 2 94134 2 94401 2 94404 2 94502 2 94513 2 94520 2 94547 2 94555 2 94560 2 94564 2 94565 2 94578 2 94582 2 94583 2 94587 2 94588 2 94596 2 94609 2 94621 2 94928 2
Table A-1. Respondents’ Zip Codes. Zip Code n 94949 2 95003 2 95033 2 95037 2 95110 2 95119 2 95121 2 95122 2 95126 2 95148 2 95204 2 95207 2 95212 2 95236 2 95242 2 95304 2 95341 2 95348 2 95351 2 95354 2 95356 2 95357 2 95366 2 95367 2 95380 2 95382 2 95388 2 95401 2 95405 2 95448 2 95464 2 95482 2 95490 2 95603 2 95628 2 95640 2 95648 2 95661 2 95667 2 95677 2 95682 2

205
Table A-1. Respondents’ Zip Codes. Zip Code n 95691 2 95758 2 95765 2 95823 2 95827 2 95828 2 95829 2 95835 2 95838 2 95864 2 95901 2 95946 2 95966 2 95991 2 96019 2 96022 2 96094 2 12345 1 90005 1 90013 1 90028 1 90033 1 90037 1 90048 1 90061 1 90077 1 90116 1 90122 1 90211 1 90212 1 90222 1 90232 1 90240 1 90260 1 90270 1 90277 1 90278 1 90305 1 90326 1 90402 1 90502 1
Table A-1. Respondents’ Zip Codes. Zip Code n 90606 1 90621 1 90701 1 90704 1 90712 1 90715 1 90717 1 90746 1 90755 1 90803 1 91011 1 91101 1 91201 1 91204 1 91205 1 91301 1 91307 1 91310 1 91316 1 91324 1 91345 1 91352 1 91356 1 91384 1 91552 1 91602 1 91642 1 91704 1 91724 1 91737 1 91739 1 91740 1 91746 1 91752 1 91755 1 91763 1 91765 1 91767 1 91769 1 91773 1 91775 1

206
Table A-1. Respondents’ Zip Codes. Zip Code n 91810 1 91901 1 91905 1 91913 1 91914 1 91915 1 91932 1 91945 1 91950 1 92004 1 92007 1 92009 1 92030 1 92058 1 92069 1 92087 1 92102 1 92106 1 92109 1 92111 1 92112 1 92113 1 92121 1 92223 1 92231 1 92234 1 92263 1 92270 1 92276 1 92318 1 92321 1 92329 1 92365 1 92371 1 92382 1 92386 1 92405 1 92408 1 92536 1 92543 1 92546 1
Table A-1. Respondents’ Zip Codes. Zip Code n 92549 1 92551 1 92567 1 92572 1 92582 1 92583 1 92586 1 92602 1 92604 1 92625 1 92629 1 92651 1 92663 1 92674 1 92675 1 92688 1 92705 1 92707 1 92726 1 92823 1 92868 1 93012 1 93023 1 93036 1 93060 1 93072 1 93109 1 93212 1 93218 1 93219 1 93221 1 93223 1 93234 1 93241 1 93247 1 93263 1 93265 1 93270 1 93274 1 93277 1 93305 1

207
Table A-1. Respondents’ Zip Codes. Zip Code n 93306 1 93402 1 93427 1 93428 1 93433 1 93442 1 93464 1 93465 1 93483 1 93510 1 93514 1 93527 1 93534 1 93550 1 93602 1 93610 1 93614 1 93618 1 93626 1 93630 1 93636 1 93646 1 93654 1 93656 1 93662 1 93706 1 93723 1 93725 1 93923 1 93924 1 93926 1 93928 1 93944 1 93960 1 94002 1 94005 1 94011 1 94040 1 94043 1 94061 1 94085 1
Table A-1. Respondents’ Zip Codes. Zip Code n 94108 1 94114 1 94115 1 94123 1 94124 1 94131 1 94132 1 94301 1 94303 1 94306 1 94402 1 94508 1 94511 1 94514 1 94525 1 94530 1 94535 1 94539 1 94541 1 94545 1 94546 1 94549 1 94552 1 94561 1 94563 1 94571 1 94572 1 94579 1 94585 1 94590 1 94599 1 94605 1 94607 1 94608 1 94612 1 94618 1 94619 1 94702 1 94706 1 94707 1 94720 1

208
Table A-1. Respondents’ Zip Codes. Zip Code n 94805 1 94901 1 94904 1 94930 1 94931 1 94937 1 94940 1 94945 1 94947 1 95002 1 95008 1 95026 1 95032 1 95046 1 95064 1 95066 1 95070 1 95108 1 95117 1 95128 1 95131 1 95138 1 95203 1 95206 1 95220 1 95223 1 95228 1 95245 1 95255 1 95257 1 95305 1 95307 1 95315 1 95320 1 95322 1 95327 1 95338 1 95352 1 95358 1 95361 1 95363 1
Table A-1. Respondents’ Zip Codes. Zip Code n 95368 1 95370 1 95379 1 95408 1 95422 1 95425 1 95430 1 95436 1 95437 1 95446 1 95451 1 95471 1 95472 1 95488 1 95491 1 95519 1 95531 1 95540 1 95570 1 95614 1 95623 1 95626 1 95641 1 95645 1 95650 1 95662 1 95665 1 95666 1 95673 1 95683 1 95685 1 95688 1 95689 1 95694 1 95709 1 95726 1 95776 1 95815 1 95821 1 95824 1 95834 1

209
Table A-1. Respondents’ Zip Codes. Zip Code n 95841 1 95842 1 95916 1 95917 1 95927 1 95945 1 95953 1 95954 1 95959 1 95961 1 95965 1 95988 1 96080 1 96087 1 96088 1 96090 1 96092 1 96097 1 96101 1 96130 1 96137 1 96146 1 96160 1 96161 1 96722 1 Adult Telephone Survey (Q31)

210
Table A-2. Other Factors Respondents Perceive Might Limit Their Level of Physical Activity- - Open-Ended Responses. Factor Access to Amenities access to potable water, parking campsites not available clean bathrooms? different food; more activities in the lake like swimming I only go to parks where dogs are allowed. I would like to see more dog friendly parks. lack of parking more benches, shaded areas, water fountains for people and pets. 911 help call boxes, bulletin boards for neighbor/personal notices. no place to buy water no pools. no restrooms or water private changing areas for removing wet clothes etc… proper shade at parks, in my neighborhood, the parks are new restrooms & water shade, water, picnic tables. there aren't clean bathrooms poor bathrooms water fountains don't work. we need more lighting; no more alcohol and drug Facilities/Opportunities although there is a park close to my home, the park does not have a full basketball court - just two half courts. I really only go to the park to play basketball so this is a big deterrent. disrepair of sidewalks and parking lot illumination inability to avoid equestrian and dog use trail routes. lack of maintenance of facilities especially restrooms many of the parks near me in Santa Clarita have hiking only trails. much is due to either lack of monies, or the parks are run down, & not designed for the disabled! no organized sports and activities for adults and the younger generation not enough horse activities not enough parking or parking is too far away only clean parks are in the next city poorly marked trails. restrooms areas not clean. senior activities.

211
Table A-2. Other Factors Respondents Perceive Might Limit Their Level of Physical Activity- - Open-Ended Responses. Factor the lack of dirt trails. cement/asphalt is too hard on my knees. but if a park also has dirt/sand trails then I’m there. there are not that many good parks in my area. vandalized or graffitied facilities lack of water fountains we've been to many parks since we moved back to ca three years ago, esp. the last year, and since I was a kid growing up here, there are fewer rangers, so when we arrive and try to find trailheads, it can be frustrating Crowding crowded--too many people for space. crowds, expense, noise, over use of facilities, over development, de-naturizing of nature facilities too crowded how busy the park is, generally. how crowded the park is. lack of space when a lot of people are present during peak times. overcrowdedness overcrowding overcrowding as meeting places for illegal immigrants. some parks in south san diego carry huge mexican crowds. the area was too crowded. too crowded too many people too many people for the park to handle; some of our regional parks have this problem so you just keep driving and don't stop. too much noise and people Safety dangerous wild animals, cougars, bears, coyotes. mosquito infestation from ponds,etc. or abundance of poison oak. depends upon the park. I feel safer in some parks than others. mountain lions are a problem and you can't walk alone, but I need to deal with that because I think they have as much right as anyone to be there. multi-use trails can be hazardous for hikers, bikers and horse riders my family visits parks that don't have homeless people in dangerous areas. mountain lions live in those areas. gangs especially if I don't feel that it is a safe or appropriate place to have my children safety first concern when the parks are dirty people hanging out that seem threatening lack of lighting

212
Table A-2. Other Factors Respondents Perceive Might Limit Their Level of Physical Activity- - Open-Ended Responses. Factor Cost charging for parking entrance fees/costs entry fees. fees too high high cost of gas I would like to see more free outdoor programs for all ages. parking and other required fees not posted ergo: fear of getting a ticket. user fees Actions of Others educate people, especially Hispanic people, not to throw trash at the park or lake, where you can find ducks, which I love to watch and it really angers me that they do not respect animals have less racism within other people, give preference or services equally. hillbillies shooting automatic weapons while drinking, but I don't it's generally dirty. people leave their garbage, enforcing rules, and having rules for people leaving trash and enforcing those rules. people driving on the beaches Health disabled I am handicapped & my position is if there were more disabled accessible walking trails that would help. I am hypertensive so I limit my walking and cannot run or jog at all and I was a sprinter in high school. I did love to run (born to run!) I don't do much physical activity since I have 2 artificial hips and an artificial knee. I enjoy taking a picnic lunch to a park that has tables and benches. Activity Viewed Unfavorable biking is encouraged, but skating is treated like some kind of crime kill-joy stick-up-the-ass park rangers making people turn off music and pour out alcoholic beverages on weekends/holidays in city parks Bugs mosquitoes flying insects at dusk. No Companions lack of companions spouse not as interested as I am in some activities e.g. overnight hiking, camping.

213
Table A-2. Other Factors Respondents Perceive Might Limit Their Level of Physical Activity- - Open-Ended Responses. Factor Time not enough time Transportation I have no transportation to get to a park. Other unfounded laws that restrict hunting (like using non-lead bullets in hunting zones). Adult mail-back survey (Q9) Table A-3. Other Activities Respondents Participated in During Their Last Park Visit- Open-Ended Responses. Activity N Camping 24 Boating 19 Photography 16 Sightseeing 16 Party/Special Event 14 Exercise 13 Baseball 12 Beach Activities 12 Golf 12 OHV 12 Concerts/Movies/Theater 8 Horseback Riding 8 Dancing 7 Climbing 6 Skateboarding 6 Horseshoes 5 Jet Ski 5 Museum/Nature Center 5 Soccer 5 Socializing 5 Water Activities 5 Dog Activities 4 Eating 3 Feeding Wildlife 3 Fishing 3

214
Table A-3. Other Activities Respondents Participated in During Their Last Park Visit- Open-Ended Responses. Activity N Kids 3 Scuba Diving 3 Sitting 3 Trains 3 Walking 3 Amusement Park/Zoo 2 Art 2 Badminton 2 Basketball 2 Campfire 2 Cards 2 Disc Golf 2 Driving 2 Gold Panning 2 Nature Exploration 2 Park Maintenance 2 Playground 2 Setting up Events 2 Aerobics 1 Airsoft/Paintball 1 Biking 1 Bocce 1 Croquet 1 Cross Country Skiing 1 Drinking 1 Football 1 Frisbee 1 Gardening 1 Gathering 1 Handball 1 Hunting 1 Jogging 1 Kickball 1 Organized Games 1 Parade 1 Par course 1 Pick Up Trash 1 Play Music 1 Race Cars 1
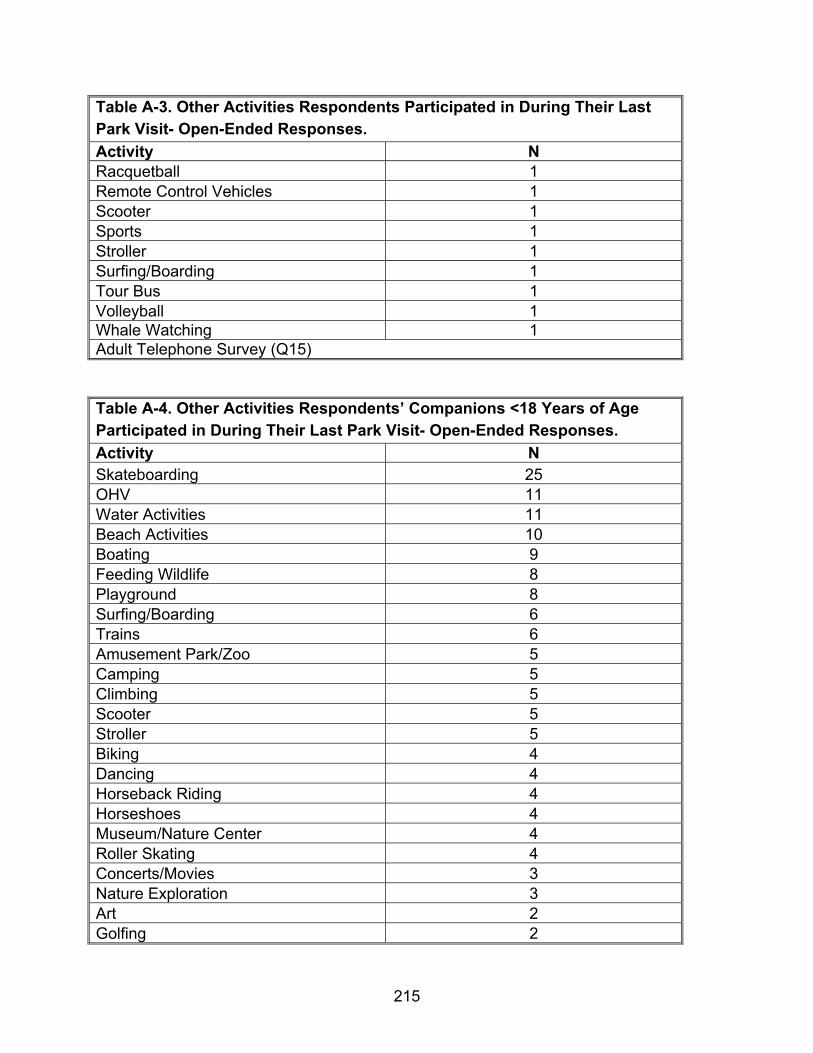
215
Table A-3. Other Activities Respondents Participated in During Their Last Park Visit- Open-Ended Responses. Activity N Racquetball 1 Remote Control Vehicles 1 Scooter 1 Sports 1 Stroller 1 Surfing/Boarding 1 Tour Bus 1 Volleyball 1 Whale Watching 1 Adult Telephone Survey (Q15) Table A-4. Other Activities Respondents’ Companions <18 Years of Age Participated in During Their Last Park Visit- Open-Ended Responses. Activity N Skateboarding 25 OHV 11 Water Activities 11 Beach Activities 10 Boating 9 Feeding Wildlife 8 Playground 8 Surfing/Boarding 6 Trains 6 Amusement Park/Zoo 5 Camping 5 Climbing 5 Scooter 5 Stroller 5 Biking 4 Dancing 4 Horseback Riding 4 Horseshoes 4 Museum/Nature Center 4 Roller Skating 4 Concerts/Movies 3 Nature Exploration 3 Art 2 Golfing 2

216
Table A-4. Other Activities Respondents’ Companions <18 Years of Age Participated in During Their Last Park Visit- Open-Ended Responses. Activity N Organized Games 2 Party/Holiday Event 2 Rock Climbing 2 Sightseeing 2 Singing/Karaoke 2 Badminton 1 Baseball 1 Bocce 1 Campfire 1 Darts 1 Fishing 1 Flying Kites 1 Football 1 Gardening 1 Gathering 1 Gold Panning 1 Handball 1 Hunting 1 Jet Ski 1 Martial Arts 1 Photography 1 Pick Up Trash 1 Ping Pong 1 Play with Dog 1 Played X-Box in Motor home 1 Racquetball 1 Sitting 1 Sleep 1 Sliding 1 Soccer 1 Sports 1 Sunbathing 1 Table Games 1 Tennis 1 Throw Rocks 1 Walking 1 Adult Telephone Survey (Q19)

217
Table A-5. Other Facilities or Amenities Used During Their Last Park Visit- Open-Ended Responses. Facility/Amenity N Campgrounds 15 Food Concession 14 Water Fountain 11 Exercise Trail/Structures 10 Fishing Areas/Piers 9 Golf Course 8 Boat Ramp/Dock 7 Museum 6 Sports Fields/Courts 6 Boat Rental 5 Parking Lot 5 Benches 4 Fire Ring/Pits 4 Interpretive Center/Classroom 4 Ranger Station 4 RV Hook-ups 4 Shower 4 Special Entertainment 4 Store/Gift Shop/Vendors 4 Cabins 3 Dog Areas 3 Horseback Riding Facilities 3 Zoo/Farm 3 Amphitheater 2 Batting Cage 2 BBQ Stand 2 Beach 2 Bleachers 2 Cart Track 2 Library 2 OHV Areas 2 Park Rangers 2 Port-a-Potty 2 Recreation Center 2 Shuttles 2 Volleyball Court 2 Bikes 1 Disk Golf 1

218
Table A-5. Other Facilities or Amenities Used During Their Last Park Visit- Open-Ended Responses. Facility/Amenity N Dog Clean-up Bags 1 Farmer's Market 1 Guided Tours 1 Handicap Facilities 1 Ice Skating Area 1 Running Tracks 1 Sidewalks 1 Train Facilities 1 Adult Telephone Survey (Q13) Table A-6. Other Statements Respondents Provided Concerning California Park Agencies’ Efforts to Reduce and Adapt to Climate Change and Global Warming- Open-Ended Responses. Statement Information/Education allow education about climate change by non profit organizations hosted by the state/federal parks don't preach at your visitors. providing information is one thing, but people come to these facilities to get away from lectures and formal instruction. educate and offer mass transit educate people regarding how to stay healthy in different weather situations educate the park visitors on how that particular park encourages and supports native plant and animal life. educational flyers have fun education programs about global warming etc. designed for children I believe in education but should not try to foresee changes. nothing, it is up to the general public to learn and lots of people just don't care. these people don't go to the parks so they have to be educated by other means park agencies should educate and give opportunities to community members to assist with park clean-up or planting of more trees. parks/recreation is not responsible for educating the public at this level. there is much educ promote volunteer programs for education and restoration purposes. target k-12 (particularly at the earl public commercial announcements informing public about climate & parks. public meetings seminars, concerts and festivals in the park to increase awareness like global warming awareness day. they should be an educational force , not restricted access to wild like areas.

219
Table A-6. Other Statements Respondents Provided Concerning California Park Agencies’ Efforts to Reduce and Adapt to Climate Change and Global Warming- Open-Ended Responses. Statement youth programs on awareness and activities to follow as examples of proper earth care Recycling/Green Products do not allow concessionaires to use non-recyclable items. emphasis on recycling, including irrigation with reclaimed water. encourage and provide ability for recycling on site - no bins are on most sites. encourage recycling with appropriate receptacles available expand recycling in parks for waste brought into them, and use inmates to expand clean up functions in addition to educating the public, all parks or recreation facilities should provide ample recycling bins (with signs that make recycling in park and rec areas easier make sure there are recycling facilities (bins, etc.) in parks themselves, easily accessed just like trash cans are, so people will be encouraged to recycle. more recycle containers all over the city would help. also more education is key! I think teaching all residents/homeowners etc about eco friendly living is a place to start. also implementing laws for home builders parks should have recycling programs easily available. penalize individuals who are caught littering or do not clean after using the facilities. encourage the use of green products inside the park and recycling by providing separate trashcans for aluminum, plastic and organics. eco-friendly facilities perhaps start recycling programs at the parks. promote more recycling at the public parks. putting in recycling bins for various materials recycle, recycle, recycle!!! use recycle bins at parks Transportation get rid of all motorized off road vehicles. limit access of rvs. encourage tent camping. give incentives to folks who ride bikes in, drive hybrids in improve parking facilities so that people are not driving around looking for a place to park. lakes areas should manage the amount of gas powered engines allowed. cut the amount of boats, jet skis because of pollution. limit car use, prohibit or charge suvs & huge rvs a painful fee.

220
Table A-6. Other Statements Respondents Provided Concerning California Park Agencies’ Efforts to Reduce and Adapt to Climate Change and Global Warming- Open-Ended Responses. Statement public transportation is too restrictive: increase the amount of public transportation at state and national parks, forests, & monuments for better access and less impact. reduce use of motorized vehicles by staff - more walking and biking stop driving around in suvs! use energy efficient vehicles; educate guests about the costs of their choices in their daily lives there could be city (Pasadena) programs for the disabled were we could be driven to the beach on mt wilson. etc. use battery or hybrid vehicles use fuel-efficient vehicles for park business, encourage carpooling and driving less, have clear recycling containers, ban plastic. use of electric vehicles in parks when possible. we should have more public transportation. Cooperation/Partnerships all of the care takers have to cooperate for a better quality of healthy life. everybody should do their part everyone needs to be aware and help out where they can. good start. it is the responsibility of all of us and if we make the people aware of these things, we will be able to maintain our earth green and livable. make it a group effort by getting the community involved and get the community to take responsibility too. organize clean ups in a community. organize youth group activities to increase "green" actions partner with environmental/habitat protection groups we all need to do our part for saving the earth. Alternative Energy increased use of solar and wind power for park facilities, use of cell phone/s technology/ies in interpretation and education. install solar panels to power park facilities parks could utilize any fry oil from food facilities to produce biofuel to run park vehicles. solar for part of the lighting if possible. start out with bigger trees in new parks!!! solar or wind power - recycle bins - closer free river access store solar energy for light sources. you should make companies clean up their messes all over the world. all new houses and business should have solar power

221
Table A-6. Other Statements Respondents Provided Concerning California Park Agencies’ Efforts to Reduce and Adapt to Climate Change and Global Warming- Open-Ended Responses. Statement Unsure/Don't Believe in Global Warming I do not believe in global warming. I don't believe in global warming I believe our climate goes in cycles so I don't want to answer these questions. I don't know enough about it to comment. I have not yet decided if I completely buy into the entire theory of climate change man created global warming is a hoax. promote resource conservation the public can do themselves. plant trees, drive economically, limit lawns, recycle, advocate nuclear energy. what climate change? Clean Parks/Littering be sure that parks are clean. planting trees is always a good idea and make sure trash cans get emptied so the trash doesn't get put on the ground. show the effects that littering has on wildlife and environment. stress cleanliness, pick up after yourself. the parks are dirty; they need to clean and maintain them. we all need to be aware of what we are doing that causes pollution in consult the American (illegible). they have it down pat! we generate way too much garbage. Can't Do Anything About It global warming is cyclic. stop complaining. I believe that man is too puny to have much effect - if any - on climate change. the main cause of "global warming" is the sun. responsible research puts man's effects at #9 of 9 causes. a few years ago, there was the same talk about "global cooling". please stop brainwashing us about global warming. it's god's work, leave it alone! take care of the parks and god will do the rest. Natural Resource Conservation/Preservation acquire land with public money and not allowing public access - with minor exceptions: brushy peak - livermore park & rec. perhaps planting native plants in the park and having a plaque describing the goal can create a beautiful setting while educating at the same time. protect wildlife and plants not just because of climate change stop over fishing from commercialized fisherman More Research

222
Table A-6. Other Statements Respondents Provided Concerning California Park Agencies’ Efforts to Reduce and Adapt to Climate Change and Global Warming- Open-Ended Responses. Statement actually do real research and realize that global warming is not caused by anything listed in this survey. do research and measure changes in all park areas. first, identify if there is global warming. then if there is, is it a naturally occurring phenomena or is it a political phenomena. start doing some critical thinking in this area. this is ridiculous; we should research the facts & myths of global warming not give in to this stupid ideology based on feelings. the climate is on a 10 year cooling trend- you disappoint me with the above. Management clear brush and dead trees regularly and see that trees are growing the proper distance apart to reduce the likelihood of forest fires. thin out trees when necessary and sell the wood to make money for park maintenance. green building; refurbish existing instead parks should lead the way about good stewards of the kind. Politics get off the global warming political bandwagon. global climate change is not something that parks need to rush into dealing with. mistakes are made when everyone rushes to jump on the newest political or social hot topic. let's only make changes that we know are going to do more good than harm. Water Conservation ...reduce water use. consider artificial grass in open areas, ball fields, etc. to conserve water used in irrigation Access change some access to trails so environment can revert back to natural state. limit the amount of buses allowed per day or eliminate altogether. make park shuttles electric or "clean" fuel users. Other do not allow hybrid companies to sell their cars here, the nickel mined in Canada produces too much of the climate don't listen to the current administration economic incentive/ government rebates

223
Table A-6. Other Statements Respondents Provided Concerning California Park Agencies’ Efforts to Reduce and Adapt to Climate Change and Global Warming- Open-Ended Responses. Statement make sure the park facilities (buildings, furniture, lighting etc.) is as environmentally friendly as possible offer incentives to people who can show they are reducing their carbon footprint park agencies should warn global climate change is before assigning blame. Adult Telephone Survey (Q10)

224

225
Appendix B: Open-Ended Responses – Youth Respondents Table B-1. Youth Respondents’ Zip Codes Zip Code n
90703 4 92130 3 92683 3 94112 3 94539 3 90601 2 90660 2 90712 2 91006 2 91325 2 91342 2 91387 2 91731 2 91744 2 91775 2 92069 2 92129 2 92346 2 92555 2 92673 2 93215 2 93274 2 94080 2 94086 2 94133 2 94134 2 94501 2 94531 2 95124 2 95125 2 95127 2 95620 2 95630 2 95758 2 95828 2 95829 2 1824 1 9548 1
90001 1
Table B-1. Youth Respondents’ Zip Codes Zip Code n
90016 1 90023 1 90025 1 90037 1 90042 1 90062 1 90063 1 90065 1 90210 1 90230 1 90248 1 90275 1 90280 1 90291 1 90292 1 90405 1 90604 1 90630 1 90631 1 90650 1 90706 1 90723 1 90744 1 90745 1 90808 1 90815 1 91007 1 91010 1 91024 1 91042 1 91104 1 91303 1 91324 1 91343 1 91350 1 91351 1 91352 1 91506 1 91601 1

226
Table B-1. Youth Respondents’ Zip Codes Zip Code n
91607 1 91701 1 91702 1 91706 1 91709 1 91710 1 91711 1 91733 1 91746 1 91754 1 91766 1 91767 1 91770 1 91776 1 91784 1 91789 1 91801 1 91902 1 91914 1 91941 1 91978 1 92009 1 92019 1 92024 1 92056 1 92057 1 92078 1 92122 1 92131 1 92139 1 92154 1 92173 1 92253 1 92320 1 92324 1 92336 1 92392 1 92503 1 92505 1 92509 1 92530 1
Table B-1. Youth Respondents’ Zip Codes Zip Code n
92557 1 92562 1 92563 1 92587 1 92612 1 92614 1 92626 1 92629 1 92630 1 92648 1 92677 1 92679 1 92691 1 92704 1 92780 1 92806 1 92821 1 92880 1 93210 1 93230 1 93309 1 93312 1 93313 1 93505 1 93534 1 93535 1 93551 1 93612 1 93638 1 93640 1 93704 1 93711 1 93725 1 93727 1 93730 1 94014 1 94024 1 94030 1 94044 1 94070 1 94109 1

227
Table B-1. Youth Respondents’ Zip Codes Zip Code n
94122 1 94306 1 94403 1 94513 1 94523 1 94530 1 94546 1 94547 1 94553 1 94563 1 94566 1 94567 1 94580 1 94583 1 94585 1 94598 1 94618 1 94619 1 94706 1 94928 1 95008 1 95014 1 95020 1 95035 1 95037 1 95070 1 95129 1 95209 1 95219 1 95337 1 95351 1
Table B-1. Youth Respondents’ Zip Codes Zip Code n
95358 1 95363 1 95368 1 95376 1 95407 1 95662 1 95670 1 95677 1 95687 1 95815 1 95818 1 95820 1 95821 1 95823 1 95826 1 95833 1 95835 1 95842 1 95843 1 95969 1 95993 1 96001 1 96003 1 96140 1 913342 1
Adult Telephone Survey (Q31)
Table B-2. Other Reasons Youth Respondents are Kept from Participating in Outdoor Activities - Open-Ended Responses. Reason Other Obligations during the winter, it gets dark so early, by the time my homework is done, it is too dark to play outside. family doesn't have time to do activities I am on the ice or ballet about 12-13 hours per week in addition to school.

228
Table B-2. Other Reasons Youth Respondents are Kept from Participating in Outdoor Activities - Open-Ended Responses. Reason I don't find it to be convenient I don't have time. I have school during the day and do my homework after I get out of school. it gets too late jobs at the stores in town other activities take over it sometimes there isn't a parent or guardian watching my sister and I so we can't go outside. traveling No One to Participate With friends don't want to do it I’m not motivated. no one I like to play with lives near me. I don't have anyone to do it with or who wants to do it I don't know where to go/ no one will do it with me. I don't want to do them alone I have no one to do them with it is a game that needs more than 2 people and there aren't enough people people don’t have time. there is no one to hang out with. everyone is busy so I stay home and do stuff. Too Tired/Sick I’m too tired I’m too tired from school to go do anything. I am too sick to play I don't have the energy I get dehydrated quite easily I suffer from severe migraines. sometimes I’m sick too lazy too tired to play at times Not Interested I’m not very outdoorsy in the first place I don't enjoy being outside I don't have an interest in doing some of the activities mentioned I don't want to I just don't feel like it. I only surf not really fun sometimes too boring Parents my mom is paranoid about everything

229
Table B-2. Other Reasons Youth Respondents are Kept from Participating in Outdoor Activities - Open-Ended Responses. Reason my mom is strict my parents are very busy my parents do not like me to walk to the park alone my parents don't have time to drive me to activities my parents don’t want to drive me sometimes. parents won't allow me to ride my bike because there are no sidewalks Distance go swimming--pool is far away I don't live near the snow. not one near nothing in my neighborhood; not even a park number one reason would be no transportation to areas where I could do the activities. too far away to get there myself Clean/Safe I wish the park near my house was cleaner I would rather be addressing security issues. injuries it's not safe Can Not Get There can't get there transportation is difficult Crowding too much crowds. where there are large amounts of people, I don't go. Cost too expensive Weather in the summer, most of the time it is too hot to do anything except swim outside. Other either I’m in trouble or parents don't want to too many dogs out without a leash (Q8)

230
Table B-3. Other Actions That Could Help Youth Respondents Participate in Outdoor Activities More Often- - Open-Ended Responses. Action Affordability affordable classes cheaper lessons lower prices of lessons for something make them free make equipment cheaper make gas cheaper!!! make some activities more accessible and affordable provide everything free of charge provide them at a low cost or free of charge reduce costs more money and cool parents. Fewer Obligations having more free time less homework to have time Less Crowding areas that attract me the most include places that have few crowds. More Opportunities/Facilities bmx dirt trails more unpaved trails. dirt trails are ideal. a skate park close my home that has an age limit for kids, and has tutors or teachers that help you become a better skater. have more community pools make a sports team in the area and a field for any sport more activities need more skateboarding and bike parks, too far way right now more place to ride/race off road motorcycles. offer a more variety of clubs add paved sidewalk more target shooting places provide more camp grounds or better opportunity to make reservations provide Olympic sized pools in schools or close to them more private areas supply the kids with musical instruments Safety less violence in neighborhood, so no one needs to be agitated about getting kidnapped, or some sort. more security

231
Table B-3. Other Actions That Could Help Youth Respondents Participate in Outdoor Activities More Often- - Open-Ended Responses. Action break up some of the gangs that frequent my area so I could walk to the park Opportunities to Meet Others a sign-up sheet where people can play a game together and get to know each other better. offer small group games. like sign-up board to play at a certain time with random kids my age. events to help kids meet other kids their age that go to the park Other get license to drive have my parents trust me as a 13 year old to be outside without an adult (Q7)

232
Why Youth Did and Did Not Participate in the 10 Children’s Outdoor Bill of Rights
1. Visit a California Historic Site or Museum Table B-4. Reasons Why Youth Did Not Visit a California Historic Site or History Museum Before the Age of 14, Open-Ended Responses. Reason N Don't Know/Don't Remember/No reason
don't know of any 1 don't remember 1
no reason 30 haven't got around to it yet 1
just never went 1 Boring/Not Interested
not interested 7 boring 1
I don't have the will to go 1 not interested 1
not interested in historic sites 1 not too interested 1
sounds boring 1 too boring 1
Didn't Know of Opportunity
I don't know where one is 1 I don't know where there Is one 1
never heard of one 1 we do not know where there is one 1
Distance
it is too far 1 not one near by 1
too far 1 too far away 1
Time
no time 2 I have no time 1
Other Activities
I'd rather watch TV 1 Family
my mom said no 1 Cost
too expensive 1

233
Table B-4. Reasons Why Youth Did Not Visit a California Historic Site or History Museum Before the Age of 14, Open-Ended Responses. Reason N Special Needs
special needs, learning disability 1 (Q5) Table B-5. Reasons Why Youth Visited a California Historic Site or History Museum Before the Age of 14, Open-Ended Responses. Reason N Organized Educational Trip
field trip 6 school 5
educational 3 fieldtrip 2
school field trip 2 4th grade school trip 1
classroom field trip 1 field trip 1
on a school field trip 1 school field trip 1 school field trip 1 school field trip 1 school project 1
Personal Interest/Education
for historical education 1 for information 1 for knowledge 1
learn the history before me 1 to learn about California's history 1
to learn more 1 to learn something outside of my "bubble" 1
to see it 1
Family family camping 1
family outing 1 family trip 1
family visit 1 my family went there 1
on vacation 1 personal enjoyment family outing 1
time with family/friends 1 vacation 1

234
Table B-5. Reasons Why Youth Visited a California Historic Site or History Museum Before the Age of 14, Open-Ended Responses. Reason N Fun/Interesting
for fun 1 fun 1
I love history 1 it's fun 1
it's interesting 1
No Choice I had to 1
mom made me 1 (Q5) 2. Play in the Water Table B-6. Reasons Why Youth Did Not Play in the Water Before the Age of 14, Open-Ended Responses. Reason N No Reason
no reason 18 Can Not Swim
can't swim 1 Time
no time 1 Water Quality
I don't trust how clean the water is 1 (Q5) Table B-7. Reasons Why Youth Played in the Water Before the Age of 14, Open-Ended Responses. Reason N Fun
fun 8 for fun 9
to have fun 4 it's fun 2
for fun and exercise 1 fun with friends 1
fun, exercise 1 I love to swim 1
it's fun swimming 1

235
Table B-7. Reasons Why Youth Played in the Water Before the Age of 14, Open-Ended Responses. Reason N
love the water 1 party 1
recreation 1 to have a fun time while getting exercise 1
Temperature
it was hot 2 because it's hot 1
cool off 1 hot 1
hot outside and went to the pool 1 it was hot 1
to cool down 1 to cool down during summer 1
to cool off in the summer heat. 1
Trip/Vacation camping 1 field trip 1
field trip and personal enjoyment family outing 1
vacation 1 vacation 1
Family/Friends
spending family time 1 time with family/friends 1
visit friend 1 with friends 1
To Learn
to learn how to swim 2
Availability I have a pool 1
Exercise
to have a fun time while getting exercise 1 (Q5)

236
3. Play in a Safe Place Table B-8. Reasons Why Youth Did Not Play in a Safe Place Before the Age of 14, Open-Ended Responses. Reason N No Reason
no reason 37 Boring
boring 1 it's boring 1 too boring 1
not exciting enough 1 not fun 1
safe places are lame 1
Location Modesto’s not safe 1
never heard of a safe place in Los Angeles 1 there are no safe places 1
Risk
because I live dangerously 1 like to be dangerous 1
Other
logical I guess 1 because I don't want to get hurt 1
(Q5) Table B-9. Reasons Why Youth Played in a Safe Place Before the Age of 14, Open-Ended Responses. Reason N Safety
all parks are safe in my town 1 because it's safe 1
better to be safe than sorry 1 dangerous places are bad 1 I'm always in a safe place 1
it is safe 2 just in case 3
safer playing safe 1 to be safe, of course 1
too dangerous 1 Fun
for fun 2 fun 3

237
Table B-9. Reasons Why Youth Played in a Safe Place Before the Age of 14, Open-Ended Responses. Reason N
fun and safe 1 fun with friends 1
good 1 to have a fun time 1
to have fun 2 to have fun and be safe at the same time 1
Organized Trip/School
field trip 1 field trip and personal enjoyment family
outing 1 school 1
Location
close to house 1
Other to play 1
where my parents can see me 1 to get outside 1
(Q5) 4. Go Camping Overnight Table B-10. Reasons Why Youth Did Not Go Camping Overnight Before the Age of 14, Open-Ended Responses. Reason N No Reason
no reason 47 No Interest/Boring
boring 1 don't like camping 3
I don’t like camping outside! 1 I have little interest in nature 1
I've never been camping before, and I'd rather sleep inside 1
not interested 7 prefer to be indoors. 1
we don't like to sleep outside 1 Time
have not taken the chance yet 1 haven't had time to 1
I have not had the opportunity 1 I never got the chance 1

238
Table B-10. Reasons Why Youth Did Not Go Camping Overnight Before the Age of 14, Open-Ended Responses. Reason N
it's hard to go 1 never got a chance 1
never got around to it 1 no time 2
not enough time 1 opportunity has not presented itself 1
too busy 1 Family/Friends
family doesn't like camping 1 household doesn't like "roughing" it 1
my family doesn't camp 1 my family never took me 1
parents don't want to 1 parents never took me 1
parents wouldn't let me 1 prohibited by parents 1 no one to camp with 1
they didn't take me (pick me) 1
Location no nice places in my area to do this 1
there is no place to camp near by 1 wasn't a good camping place 1
we don't have any 1 Never Tried
I've never tried it 3 never planned a trip 1
Environment
mosquitoes 1 outdoor environment 1
the bugs 1 No Amenities
I dislike the fact that I can't shower 1 I wouldn't survive. 1
I'm too high maintenance 1 Safety
not safe 1 too dangerous 2
Cost
too expensive 2

239
Table B-10. Reasons Why Youth Did Not Go Camping Overnight Before the Age of 14, Open-Ended Responses. Reason N Skills
I do not know 1 too scared 1
(Q5) Table B-11. Reasons Why Youth Went Camping Overnight Before the Age of 14, Open-Ended Responses. Reason N Family/Friends
family fun 1 fun with family 2
spend time with family 1 hang out with cousins 1
hanging out with my brother 1 motorcycle trip with dad 1
vacation 2 vacation 1
with family 1 to be with friends 2
Fun/Interested
camping is cool 1 I enjoy camping every once in a while 1
exciting 1 for fun 1
for fun, , time with family/friends 1 for the experience 2
it's fun 1 fun 1
fun experience 1 to have fun 1
fun 1
Organized Group Event boy scouts 1 girl scouts 3
to help the w.o.w. program 1 Enjoy Outdoors
enjoy the outdoors 1 for the outdoor fun 1
great to be outdoors once in awhile 1 (Q5)

240
5. Explore Nature Outdoors Table B-12. Reasons Why Youth Did Not Explore Nature Outdoors Before the Age of 14, Open-Ended Responses. Reason N No Reason
I don't know 1 no reason 40
Not Interested/Do Not Like It
bugs on me 1 I don't have the will 1
not interested 1 not interested 5
rather play video games 1 too nitty-gritty for me 1
Boring
boring 2 its boring 1
Time
don't have time 2 not much time to spend outdoors for nature. 1
Friends
friend not wanting to do it 1 No Choice
I was forced to 1
Safety outdoors are not safe 1
(Q5) Table B-13. Reasons Why Youth Explored Nature Outdoors Before the Age of 14, Open-Ended Responses. Reason N Organized Group
boy scouts 1 field trip 2
field trip and personal enjoyment family outing 1
girl scouts 1 outdoor school 1 school field trip 2
to help the w.o.w. program 1

241
Table B-13. Reasons Why Youth Explored Nature Outdoors Before the Age of 14, Open-Ended Responses. Reason N
Interested/Enjoy
enjoyment 1 fun 2
fun experience 1 interesting 1
it's fun 1 its enjoyable 1
Environment
because of the animals 1 it's pretty 1
to explore scenery 1 to see nature 2
Family
family fun 1 family trip 1
hang out with cousins 1 vacation 1
See New Things
see new things 1 like to see what's out there 1
there isn't a lot in the city 1 no nature around me 1
Education
education 1 to learn about my surroundings and relax 1
Available
because it's there 1
Other recreation 1
went on nature walks when I was little 1 (Q5) 6. Learn to Swim Table B-14. Reasons Why Youth Did Not Learn to Swim Before the Age of 14, Open-Ended Responses. Reason N Don't Know/No Reason
no reason 37

242
Table B-14. Reasons Why Youth Did Not Learn to Swim Before the Age of 14, Open-Ended Responses. Reason N
I don’t know 1
Fear because I am afraid of water 1
I don’t want to drown! 1 I have a fear of drowning 1
I have not learned yet scared 1 safety 1
scared 1 too afraid to 1
No Opportunity
I don't know how to swim 1 never took professional lessons 1
no close swimming classes 1 no one to learn from 1
nowhere to swim. 1 parents never took me 1
we don't have one in our community. 1
Already Know How already know how 3
already know how to swim 1 I have known how to swim since I was 9
months old 1
Time have not had time 1
classes conflict with family's schedule 1 I haven't had time 1
no time 1 Boring/Not Interested
boring 1 not interested 2
Personal
I don't like taking swimming lessons because it makes me feel exposed. 1
unable to follow instructions 1 (Q5)

243
Table B-15. Reasons Why Youth Learned to Swim Before the Age of 14, Open-Ended Responses. Reason N Safety/Education
it is necessary 1 it's a basic life skill. 1
it's a good thing to know 1 might save a life 1 so I don't drown 4
so that I can save myself if drowning and to have fun 1
swimming is a good technique to know for your life 1
to be able to swim 1 to be able to swim correctly 1
to be safe 1 to be safe in water 1
to learn 1 wanted to learn 1
Enjoyment
because I love swimming 1 fun 3
fun, you need to know if you live close to the water like I do 1
how can anyone live without knowing how to swim!? 1
it sounded like fun 1 so I could do something during the summer 1
to enjoy water sports 1
Opportunity I have a pool 1
school 1 signed up by parents 1
summer course 1
Family /Friends family party 1
(Q5) 7. Play on a Sports Team Table B-16. Reasons Why Youth Did Not Play on a Sports Team Before the Age of 14, Open-Ended Responses. Reason N No Reason
no reason 34

244
Table B-16. Reasons Why Youth Did Not Play on a Sports Team Before the Age of 14, Open-Ended Responses. Reason N Boring/Not Interested
because I was bored 1 didn't feel like it 1
didn't want to 1 dislike sports 1
don't like playing sports 1 don't like sports 1
don't like sports that much 2 don't think I am good enough 1
I am not interested 1 I don't like sports 1
I don't want too 1 I have no interest of it 1
it does not interested me 1 no interest 1
no interest in sports 1 not a sports fan 1
not interested 9 not interested in sports 1
not interested in team play 1 not interested, not enough time 1
not interested. 1 not very interested but have played team
sport in pe 1 not that interested in sports 1
sports teams bore me 1 Time
don't have enough time 1 have not really found time yet 1
I’m very busy doing what I have to do 1 not enough time 2
practice conflict with family's schedule 1 too busy 1
too busy to attend practices, games, etc. 1 too busy with school 1
Skill
can't play sport well 1 not athletic 2
not good at sports 1 not really good at sports. 1
Cost
it's too expensive 4

245
Table B-16. Reasons Why Youth Did Not Play on a Sports Team Before the Age of 14, Open-Ended Responses. Reason N Family
big family...not a necessary expense 1 my mom does not let me 1
never received enough support from parents. 1
Personal
I’m too shy 1 not an actual team due to health 1
still making up my mind on joining a team 1 Safety 1
I might break my nose 1 Other
cheer 2 I like individual sports 1
I only like to play for fun 1 I’m not on a team 1
not really into sports that have teams, I do gymnastics, I also do color guard at school 1
rather just play for fun 1 very competitive 1
(Q5) Table B-17. Reasons Why Youth Played on a Sports Team Before the Age of 14, Open-Ended Responses. Reason N Enjoyment/Fun 12
because I like playing sports 1 fun 4
fun, meet new people 1 I love sports 1
I was interested in the activity 1 it was fun and had a sport to do 1
it's exciting 1 looked like fun 1
to have a fun time with friends competitively 1 Exercise/Fitness 6
exercise 1 fitness 1
for exercise 1 to exercise 1
to get exercise and be a part of a team 1

246
Table B-17. Reasons Why Youth Played on a Sports Team Before the Age of 14, Open-Ended Responses. Reason N
to stay in shape 1 School 3
school 1 school tennis 1 tennis. school 1
Friends 2
to make new friends and be active 1 it's fun to spend time with friends 1
Skill 2
because I’m awesome at it 1 to build leadership and team building skills 1
No Choice 1
I was forced against my will by my dad 1 Competition 1
I love competition 1 Other 3
earn respect 1 I signed up 1
keeps me busy 1 (Q5) 8. Hike, Bike, or Ride on a Trail Table B-18. Reasons Why Youth Did Not Hike, Bike, or Ride on a Trail Before the Age of 14, Open-Ended Responses. Reason N No Reason
no reason 41 Boring/Not Interested
boredom 1 boring 1
didn't like 1 I don't like it 1
not interested 2 not, are you kidding? 1
Equipment
I don't have a bike 1 I don't own a bike 2

247
Table B-18. Reasons Why Youth Did Not Hike, Bike, or Ride on a Trail Before the Age of 14, Open-Ended Responses. Reason N
no bike 1
Time I never had the time 1
no time 1 too busy with chores 1
Other
it is too hot and scary 1 too dangerous 1
Health
physically unable 1
No Opportunity haven't had a chance to do 1
(Q5) Table B-19. Reasons Why Youth Hiked, Biked, or Rode on a Trail Before the Age of 14, Open-Ended Responses. Reason N Enjoyment
for fun 2 I love doing that type stuff 1
it's fun 1 its fun 1 leisure 1
riding bikes is cool 1 have a fun time 1
Family/Friends
bike riding with my brothers 1 family 1
family trip 1 fun with family 1
fun with friends 1 fun, time with family/friends 1
just spending quality time with my dad 1 to be with family 1
Exercise/Fitness
exercise 1 for the exercise 1
good exercise 2 a good workout 1

248
Table B-19. Reasons Why Youth Hiked, Biked, or Rode on a Trail Before the Age of 14, Open-Ended Responses. Reason N
to get exercise 1 to stay in shape 1
Organized Group
boy scouts 1 field trip and personal enjoyment family
outing 1 go with girl scouts 1
school camping trip 1 school trip 1
Environment
see the views of the ocean 1 nature 1
to see the world 1
Other I was forced against my will 1
relax 1 something different 1
In Conjunction with Other Activity
camping 1 (Q5) 9. Catch a Fish Table B-20. Reasons Why Youth Did Not Catch a Fish Before the Age of 14, Open-Ended Responses. Reason N No Reason/Don't Know
don't know 1 no reason 58
Not Interested/Do Not Like It/Boring
don't fish 2 don't like to fish 9
not interested 20 boring 4
No Opportunity
no one to go with 9 did not get a chance 3
never been fishing 15 no place to go 5

249
Table B-20. Reasons Why Youth Did Not Catch a Fish Before the Age of 14, Open-Ended Responses. Reason N Skill/Equipment
don't know how 4 not good at it 3 no equipment 5
tried but never caught one 5 too hard 1
Do Not Like/Eat Fish 9
do not eat fish 2 fish smell 3
fish are icky 1 fish creep me out 1
do not like fish 2
Time/Other Obligations homework 1
it takes too much time 1 no time 1
too busy 2
Anti-Fishing I am against fishing 1
I am vegetarian and don’t kill fish 1 I don't want to kill the fish 1
killing animals is not my idea of fun 1 Other
I rather buy my own fish 1 (Q5) Table B-21. Reasons Why Youth Caught a Fish Before the Age of 14, Open-Ended Responses. Reason N Family/Friends
because my grandpa has a boat 1 cause my dad wished to teach us 1
family time 1 fishing with my dad 1
I spend time with my grandfather when I go fishing 1
I went with my grandpa 1 time with family 1
my daddy loves to fish and takes me 1
Fun/Relaxation

250
Table B-21. Reasons Why Youth Caught a Fish Before the Age of 14, Open-Ended Responses. Reason N
for fun 3 fun 1
fun with family and friends 1 relaxing 1
Skill
good experience 1 haven't had the fortunate luck to catch one,
but have gone fishing 1 I have been fishing but have never caught a
fish 1 to learn how to 1
to learn 1
Food food 1
to eat 1 to eat while camping 1
yummylicious :] 1 Interested
decided to go fishing 1 looked like something I wanted to do 1
sounded interesting 1 Organized Group
had the opportunity to do so on a school camping trip, but no fish was biting. 1
(Q5) 10. Celebrate Their Heritage Table B-22. Reasons Why Youth Did Not Celebrate Their Heritage Before the Age of 14, Open-Ended Responses. Reason N No Reason/Don' Know 64
no reason 63 I don't know 1
Do Not Have One 12
don't have one 1 don't have someone to do it with 1
have none 1 I don't have a religion 1
I don't have any heritage 1 just never did. 1

251
Table B-22. Reasons Why Youth Did Not Celebrate Their Heritage Before the Age of 14, Open-Ended Responses. Reason N
my family doesn't do that 1 my family never had one of these days to do
that. 1 never have found a festival celebrating our
culture 1 never have one 1
never knew there was something like that 1 there are no special festivities 1
Not Interested/Do Not Like/Do Not Care 10
dislikes celebrations 1 don't care; it's not important 1
I never really thought my heritage was that important 1
not interested 2 not that much into religion 1
not too interested. 1 we don't celebrate 1
we don't celebrate our heritage 1 we don't really care... 1
Family is Local 5
all my family lives in my town 1 I don't have a big family 1
my families do it 1 no such thing in our family, or not really
much. 1 they live too far from me. 1
Not Likely to Happen 3
as if we're gonna see a festival from the Czech republic 1
don't celebrate our culture 1 Italian - no one celebrates Christopher
Columbus anymore. 1
Boring 2 boring 1
boring, don't care 1 Other Obligations 2
no time. 1 I missed our family reunion because I had
semester exams in school 1 Other 1

252
Table B-22. Reasons Why Youth Did Not Celebrate Their Heritage Before the Age of 14, Open-Ended Responses. Reason N
I like to pretend I’m not Mexican 1 (Q5) Table B-23. Reasons Why Youth Celebrated Their Heritage Before the Age of 14, Open-Ended Responses. Reason N Family 16
family 2 family is distanced 1
family thing 1 fun, family 1
good to spend time with family 1 because it's tradition 1
most family out of state 1 my extended family does not live near. 1
none of my family lives in ca 1 to be with family and relatives 1 to honor my families traditions 1
to see family 2 to see my distant family members 1
yes it fun to see my family 1
Food/Party 2
I’m Italian so bring on the spaghetti! 1 to party 1
Specific Event 5
birthday 1 Chinese new year 1
little sister's school event/ church 1 once a year my family get together for a
family reunion1
once in Maine 1 Education 2
history means a lot 1 knowledge 1
Enjoyment 2
I like to celebrate it 1 it's fun 1
(Q5)

253
Appendix C: Youth Focus Groups Introduction Questions: The youth were asked which month they prefer being outside, if they had swam in the ocean, and if they had stayed the night in a tent. The months that they preferred to be outside were throughout the year. Over half had swam in the ocean and stayed the night in a tent. Table C-1. Focus Group Questions and Responses: When you think about the outdoors, what kinds of things pop into your mind? Environment – trees, flowers, water, animals Activities – camping/tents, skateboarding, biking (road and mountain), walking (with or without a dog), football, hiking, fishing, hunting, sports, baseball, swimming, basketball, games Community – people (hippies and mountain men), happiness/fun, active/fit, clean environment, wilderness versus industrialization Place – specific places were listed (Santa Cruz, Costa Rica) What activities do you do in the outdoors? Exercise-oriented – swimming, hiking Outdoor recreational – camping, hunting, fishing Team sports – football, basketball, soccer, baseball Mechanized activities – biking (mountain, dirt, road), motorcycling, three/four wheeling Passive activities – sit/eat outside, sleeping outside, walking (thinking/talking), people watching, looking at scenery Other – paintball, inline skating, archery Are there any outdoor activities that would you like to participate in, that you haven’t tried yet? What are these activities? Exercise-oriented – swimming, running, hiking Outdoor recreational – mountain/rock climbing, snowboarding/skiing, kayaking, scuba diving Team sports – ice hockey, soccer, football, basketball, lacrosse Mechanized – skydiving, biking (dirt, BMX, motorcycle, ATV), water-ski, drive a plane Other – bungee jumping, travel more, jump off rocks, ice skating, paintball What do you enjoy most about being outdoors? Why? What do you like about doing these activities outdoors? Environment – weather (fresh air, sun), water, everything, hearing outdoor noise Physical – active, running, hitting the ball, doing tricks, physical challenge, tackling/contact Personal – fun/enjoyment, forget about stress/peaceful/relaxing, experience new places/things, getting away from family/parents, explore, freedom, to get better, competitive Social – friends, being with people, family Other – safety, eating smores, away from technology

254
Table C-1. Focus Group Questions and Responses: What don’t you enjoy about outdoor activities? Is there anything you don’t like about the outdoors or doing things outdoors? Environment – weather (temperature, rain, hail, wind, darkness, sun burn), bugs/stings Physical – injuries/health (allergies, asthma), exercise and sweating Personal – safety (gangs, hobos, gambling in park) Social – other kids messing with others, seeing kids fight What keeps you from participating in outdoor activities? What keeps you from doing more in the outdoors (or being outside more)? Environment – weather (thunderstorms, rain and too cold outside, heat), creatures Physical – health/injuries Personal – time schedule, lazy/effort, scared, competitive/skill level Social – family influence (parents, chores, curfew, grounded), school/homework (teachers, principles, detention, tests), friend influence, lack of supervision/safety Amenities - technology/electronics (videogames, internet, TV, Myspace, downloading, guitar hero, x-box), lack of nice/big/close locations, lack of equipment, transportation There are people whose job is to manage parks. What can they do to get kids interested in doing things outdoors? Social - safe environment (no drinking, no smoking, no drugs, no homeless people, more lighting, park security), bathrooms, environment/maintain beauty Amenities - courts/fields/parks (football, baseball, open grass), sports equipment (volleyball net, soccer net tetherball, boxing gloves), more games in the centers (pool table, air hockey, foosball, video games), motocross track/bike track (with jumps), jungle gyms (for teens, teeter totter), swimming pool, skateparks, waterparks, organized activities/fairs/festivals, new/creative games, make convenient/closer, bigger weight rooms, mini golf course, trails/camping areas Have you participated in an outdoor activity because someone brought you to that location or taught you that activity? Was it your parents, school, organizations that you belong to? Many of the participants did state that they do an outdoor activity because someone did bring them to a location or taught them an activity. The following individuals were listed as people that influenced these youth to participate in outdoor activities: dad, mom, sibling, family, friend, a club/camp/center, or a school/teacher. Many activities were listed such as baseball, tennis, kayaking, biking, camping, skateboarding, wilderness skills, football, and surfing. Do you recreate in the same places that your parents visited as kids? What do your parents say about this place? Many youth indicated that they visited and used the same location as their parents or the same structure (a specific house). Others said they go to the same environment as their parents (such as a specific beach) or did the same activity (such as dirt biking).

255
Appendix D: Public Opinions and Attitudes Telephone Survey
CALIFORNIA OUTDOOR RECREATION TELEPHONE SURVEY
Survey on Public Opinions and Attitudes on Outdoor Recreation in California
Telephone Survey Instrument INTRO Hello. My name is ____ and I’m from Diagnostics Plus calling on behalf of the California Department
of Parks and Recreation to conduct a survey on California parks and recreation facilities. This is not a sales call and the survey will take about 10 minutes to complete. Are you the person in the home who has had the most recent birthday and is 18 or older? [KEEP GOING TO NEXT MOST RECENT BIRTHDAYS UNTIL SOMEONE CAN DO THE SURVEY. IF NO ONE AVAILABLE, SCHEDULE A CALLBACK FOR WHEN SOMEONE WILL BE AVAILABLE. SKIP TO INTRO 2]
Do you have a few minutes now to answer these questions? [IF NOT NOW, ASK FOR THE
BEST TIME TO CALL BACK.]
YES NO [IF NOT NOW, ASK FOR THE BEST TIME TO CALL BACK.]
INTRO2. This survey is being conducted to obtain your ideas on how to improve recreation opportunities for
the residents of California and to understand park use among adults. You are not required to answer any question you do not wish to answer, and your responses will remain completely anonymous and confidential. This call may be monitored by my supervisor for quality control purposes only.
Q1. How many years you have lived in California? [IF LESS THAN 1 YEAR, ENTER "0" ]
1 = Yes [SKIP TO Q1] 2 = No ____ Number of years
Q2. How many years have you lived in your current community? [IF LESS THAN 1 YEAR, ENTER "0"]
____ Number of years
Next, we’d like to ask you some questions about activities you do while at parks. By park we mean public parks, forests, lakes, rivers, beaches and open spaces. Q3. Within the LAST MONTH (i.e. last 30 days), did you visit a park or outdoor recreation area? 1 = Yes [SKIP TO Q4]
2 = No [ASK IF Q3 = "NO" OR "DON'T KNOW/NOT SURE"] Q3A. Within the LAST SIX MONTHS did you visit a park or outdoor recreation area?
1 = Yes [SKIP TO Q5] 2 = No
See Tables 3, 4, 105
See Tables 3, 4, 105
See Tables 5, 6, 50, 106

256
[ASK IF Q3A = "NO" OR "DON'T KNOW/NOT SURE"] Q3B. Within the LAST 12 MONTHS did you visit a park or outdoor recreation area?
1 = Yes [SKIP TO Q5] 2 = No
[ASK IF Q3B = "NO" OR "DON'T KNOW/NOT SURE"] Q3C. When was the last time you visited a park or outdoor recreation area? [DO NOT READ] 1 = 1 to 2 years ago (up to 2 years) [SKIP TO Q5] 2 = 2 to 3 years ago (up to 3 years) [SKIP TO Q5]
3 = 3 to 4 years ago (up to 4 years) [SKIP TO Q5] 4 = 4 to 5 years ago (up to 5 years) [SKIP TO Q5] 5 = 5 or more years ago [SKIP TO Q5]
6 = Never visited a park [SKIP TO Q7] Q4. How many days in the LAST MONTH (i.e., last 30 days) did you visit a park or outdoor recreation area?
____ Number of days Q5. DURING your LAST park or outdoor recreation area visit, how many minutes did you spend there?
____ Number of minutes
Q6. How frequently did you use one or more parks or recreation areas during the past 12 MONTHS? 1 = Two or more times per week 2 = About once a week 3 = Once or twice a month 4 = Several times a year 5 = Once or twice a year, or 6 = Not at all
Q7. In general, do you spend more time, about the same amount of time, or less time in outdoor recreation activities than you did 5 years ago? 1 = More time [SKIP TO Q9] 2 = About the same [SKIP TO Q9] 3 = Less time Q8. [IF Q7 = LESS TIME] If you’re spending less time, can you tell us why? ______
Q9. Overall, how would you rate your satisfaction with public outdoor recreation areas, facilities and services currently available to you? Would you say that you are…?
1 = Not at all satisfied 2 = Somewhat satisfied 3 = Satisfied, or 4 = Very satisfied
See Tables 5, 7, 9, 107, Charts 2-5
See Tables 7, 107
See Tables 8, 108, Chart 1
See Tables 13, 14, 125
See Table 15
See Tables 35, 36, 143

257
[IF Q1 = 5 YEARS OR MORE] Q10. Now, I’d like you to think about the overall condition and operation of public outdoor recreation areas and
facilities. Would you say their condition today is…
1 = Better than 5 years ago 2 = The same as 5 years ago, or 3 = Not as good as they were five years ago
Q11. How many minutes are you from your home to the place you most often go to for your recreation?
Please estimate minutes in walking time, driving time or another mode of transportation. [Only one estimate is needed. If they can provide more than one estimate please enter all.]
1 = Driving (specify # of minutes ____) 2 = Walking (specify # of minutes ____) 3 = Other (specify other and # of minutes____)
Q12. Of those [insert from Q5] _______ minutes you said you spent in a park DURING your LAST park visit, how
many of those total minutes did you spend being physically active? By physically active we mean doing any physical movement rather than sitting (e.g., walking, biking).
____ Number of minutes The next question asks whether or not you used certain facilities or amenities DURING your LAST park visit. Please listen to the following and tell me whether or not you used these amenities. [READ, CHECK YES/NO FOR EACH] Q13. Did you use the… No Yes Don’t Know
1 = Swimming pool ___N ___Y ___D/K 2 = Beach or water recreation area ___N ___Y ___D/K 3 = Scenic observation/wildlife viewing area ___N ___Y ___D/K 4 = Botanical garden ___N ___Y ___D/K 5 = Paved trail (e.g., bike trail) ___N ___Y ___D/K 6 = Unpaved multipurpose trail (e.g., walking/hiking) ___N ___Y ___D/K 7 = Picnic table, picnic pavilion ___N ___Y ___D/K 8 = Community facility/building ___N ___Y ___D/K 9 = Amusement area (e.g., park train) ___N ___Y ___D/K 10 = Playground ___N ___Y ___D/K 11 = Tennis or basketball courts ___N ___Y ___D/K 12 = Organized sports fields (e.g., baseball, soccer) ___N ___Y ___D/K 13 = Open space to play (with kids, Frisbee) ___N ___Y ___D/K 14 = Skate park ___N ___Y ___D/K 15 = Dog park area ___N ___Y ___D/K 16 = Any other place not mentioned____________________
Q14. On a typical visit, in general, which of the following BEST describes your level of activity when visiting
parks? [READ, CHECK ONE]
1 = Mostly sitting 2 = Mostly light activities (standing, walking or strolling at a slow pace) 3 = Mostly moderate activities (walking at a moderate pace, playing tennis) 4 = Mostly vigorous activities (jogging, soccer, playing basketball)
See Tables 37, 38, 144, A-6
See Tables 10, 51, 116-122
See Tables 20, 129
See Tables 33, 61, 142, A-5
See Tables 19, 129

258
Q15. What types of activities did you do DURING your LAST park visit? [DO NOT READ LIST. CHECK ALL THAT APPLY]
1 = Sports (baseball, soccer, football, basketball) 2 = Walking (excluding dog walking) 3 = Dog walking 4 = Hiking 5 = In-line skating 6 = Tennis 7 = Swimming 8 = Jogging/running 9 = Active water sports (kayaking, rowing, canoeing) 10 = Fishing 11 = Martial arts/tai chi/yoga 12 = Bicycling 13 = Playing (e.g. Frisbee, playing catch with a ball, flying a kite, playing with children) 14 = Sedentary activities (e.g., sitting, reading, supervising children) 15 = Wildlife viewing (including bird watching) 16 = Eating/picnicking 17 = Other (please list)_______________________
Q16. When you go to a park who do you usually go with? [READ, CHECK ALL THAT APPLY]
____ No one (I usually go alone) [SKIP TO Q20] ____ Just Family ____ Just Friends ____ Both Family and Friends at the same time ____ Organized group [SKIP TO Q20] ____ Pet [SKIP TO Q20] ____ Other (please list) ____ [SKIP TO Q20]
Q17. When you go to a park with friends or family, including yourself, how many people are 18 years of age
or older?
____ Number of persons
Q18. How many people are less than 18 years of age?
____ Number of persons [IF "0" SKIP TO Q20]
See Tables 24, 56, 138a, 138b, A-3
See Tables 11, 53, 123
See Tables 12, 54
See Tables 12, 54

259
Q19. Thinking of those who were less than 18 years of age, what types of activities did they do at a park? [DO NOT READ LIST, CHECK ALL THAT APPLY]
1 = Sports (baseball, soccer, football, basketball) 2 = Walking (excluding dog walking) 3 = Dog walking 4 = Hiking 5 = In-line skating 6 = Tennis 7 = Swimming 8 = Jogging/running 9 = Active water sports (kayaking, rowing, canoeing) 10 = Fishing 11 = Martial arts/tai chi/yoga 12 = Bicycling 13 = Playing (e.g., Frisbee, playing catch with a ball, flying a kite, playing with children) 14 = Sedentary activities (e.g., sitting, reading, resting, supervising children) 15 = Wildlife viewing (including bird watching) 16 = Eating/picnicking 17 = Other (please list) _________________________________
Q20. During the past month, other than your regular job, did you participate in any physical activities or
exercises such as running, calisthenics, golf, gardening, or walking for exercise? 1 = Yes 2 = No We are interested in two types of physical activity - vigorous and moderate. Vigorous activities cause large increases in breathing or heart rate, while moderate activities cause small increases in breathing or heart rate. Q21. Now, thinking about the moderate activities you do when you are not working in a usual week, do you
do moderate activities for at least 10 minutes at a time, such as brisk walking, bicycling, vacuuming, gardening, or anything else that causes some increase in breathing or heart rate?
1 = Yes 2 = No [SKIP TO Q24]
Q22. How many days per week do you do these moderate activities for at least 10 minutes at a time?
____ Days per week (code as 1-7) 0 = Less than once a week 8 = Do not do any moderate physical activity for at least 10 minutes at a time
Q23. On days when you do moderate activities for at least 10 minutes at a time, how much total time per day
do you spend doing these activities?
_:_ _ Hours and minutes per day Q24. Now, thinking about the vigorous activities you do in a usual week, do you do vigorous activities for at
least 10 minutes at a time, such as running, aerobics, heavy yard work, or anything else that causes large increases in breathing or heart rate?
1 = Yes 2 = No [SKIP TO Q27]
See Tables 32, 141, A-4
See Tables 16, 126, 127
See Tables 17, 126, 127
See Tables 17, 127
See Tables 17, 127
See Tables 18, 126, 128

260
Q25. How many days per week do you do these vigorous activities for at least 10 minutes at a time?
____ Days per week (code as 1-7) 0 = Less than once a week 8 = Do not do any vigorous physical activity for at least 10 minutes at a time
Q26. On days when you do vigorous activities for at least 10 minutes at a time, how much total time per day
do you spend doing these activities? _:_ _ Hours and minutes per day
Q27. And now a few last questions for classification purposes. Your answers will remain confidential. What is
the highest grade or level of education you have completed? [DO NOT READ, UNLESS PROMPTING IS NEEDED]
1 = Did not graduate high school 2 = High school graduate 3 = Some college but no degree 4 = Associate degree 5 = Bachelor’s degree 6 = Master’s degree 7 = Professional degree (i.e. MD, JD, DDS, etc.) 8 = Doctorate degree (i.e. PhD)
Q27A. What is your marital status? [DO NOT READ, UNLESS PROMPTING OR CLARIFYING IS NEEDED] 1 = Single, never married 2 = Married 3 = Living with partner 4 = Separated 5 = Divorced 6 = Widowed Q28. Which of the following best describes your household? [READ LIST, CHECK ONE]
1 = Living alone 2 = Couple with no children under 18 at home 3 = Couple with one or more children under 18 at home 4 = Single person(s) with children under 18 at home 5 = Another living situation (specify) __________________ 6 = Single person with child/children over 18 living at home 7 = Living with roommates
Q28A. Which one of the following best describes your employment status?
1 = Employed full time 2 = Employed part time 3 = Retired 4 = Student (full or part-time) 5 = Homemaker 6 = Not employed, but looking for work 7 = Not employed and not looking for work 8 = Other (please specify) _________
See Tables 18, 128
See Tables 18, 128
See Tables 1, 2, 102
See Tables 1, 2, 102, 103

261
Q29. Please stop me when I read the category that best describes your total annual household income before taxes. Is it… [READ LIST]
1 = Under $20,000 2 = $20,000 to $34,999 3 = $35,000 to $49,999
4 = $50,000 to $74,999 5 = $75,000 to $99,999 6 = $100,000 to $149,999 7 = $150,000 to $199,999 8 = $200,000 or more
Q30. Which of the following racial or ethnic backgrounds best describes your household? Is it…? [CHECK ALL
THAT APPLY] ____ Hispanic or Latino of Mexican Descent ____ Other Hispanic or Latino, e.g., Guatemalan ____ White (non-Hispanic) ____ Black or African American ____ Asian ____ Native Hawaiian or Other Pacific Islander ____ American Indian or Alaska Native ____ Some other race (please specify) _____ ____ Mixed (please specify) _____
Q30A. Which of the following best describes your age? [READ LIST] 1 = 18 to 24 2 = 25 to 34 3 = 35 to 44 4 = 45 to 54 5 = 55 to 64 6 = 65 or older Q31. What is your zipcode at your home? _____
PHVERIFY I'd like to verify that your phone number is xxx-xxx-xxxx. Q32. INTERVIEWER CODE GENDER:
1 = Male 2 = Female
MAILER We’d like to send you a brief follow-up questionnaire with more questions concerning
outdoor recreation issues, which you can fill out and mail back to us or complete online. As a token of our appreciation for agreeing to participate in the mail or online survey, you will be sent a dollar in the mail today. Also, once you complete the mail survey you will be automatically entered to win one of three valuable state park getaway experiences. Would you be willing to participate in this follow-up survey? [ONLY IF NEEDED: The three getaway experiences include: 1) Segway tours on Angel Island including barbecue oysters at the Cove Café; or 2) a two-night stay in a cabin in the redwoods at Big Basin Redwood State Park; or 3) a two-night stay on the Monterey Peninsula at Asilomar which includes breakfast for two each morning.]
1 = Yes [MLABEL] 2 = No [SKIP TO MAILKID]
See Tables 2, 104
See Tables 1, 66, 101
See Tables 3, 67, A-1, B-1
See Tables 1, 101

262
MLABEL What is your name, mailing address and email? Name Mailing Address City Email
MAILKID Are there any children between the ages of 12-17 living in your home?
MAILKID2 [IF MAILKID = YES] Are you the parent or legal guardian of these children? MAILKID3 [IF MAILKID2 = YES] We would like to include a very short questionnaire about youth activities for one of your children to fill out. Your child will be sent $5 once we receive the completed survey. May we send your child this questionnaire? [SKIP TO CONCLUDE] [IF MAILKID3 = NO, Do not send youth survey.]
MAILKID4 [IF MAILKID2 = NO] We would like to include a very short questionnaire about youth activities for
one of the children in your household to fill out. Is there a parent or legal guardian there who can give us permission to send the survey?
YES - Guardian available now [SKIP TO MAILKID6] YES - Schedule callback for guardian NO - [SKIP TO CONCLUDE]
MAILKID6 Hello. My name is ____ and I’m from Diagnostics Plus calling on behalf of the California Department of Parks and Recreation. Recently we conducted a survey regarding outdoor recreation and physical activity survey with a member of your household. I am calling back to ask your permission to send a very short questionnaire about youth activities for one of your children to fill out. Your child will be sent $5 once we receive the completed survey. May we send you this questionnaire?
[YES = CONTINUE]
[NO = Thank you for your time] MLABEL What name and mailing address would you like the youth survey sent to? Name Mailing Address City Email CONCLUD That concludes our survey. Thank you very much for your time and cooperation! Your answers
will be very helpful. The mailing will likely go out in a week. Have a nice evening.

263
Appendix E: Public Opinions and Attitudes Adult Mail-Back Survey
California Department of Parks and Recreation
OUTDOOR RECREATION QUESTIONNAIRE
Conducted for
by
Recreation, Parks, & Tourism Administration Program, Cal Poly San Luis Obispo
Parks, Recreation, and Tourism Department University of Utah
Diagnostics Plus, Inc.

264
Dear California Resident, Thank you for completing the telephone survey on outdoor recreation and physical activity in California. You should have already received a token of our appreciation for your participation in this survey. This questionnaire includes questions about your participation in outdoor recreation. By completing and returning this questionnaire, you are assisting in decisions about outdoor recreation management at the local community level and throughout the state. The information that you provide is very important to the future of outdoor recreation for all ages in California. Please carefully complete this questionnaire and return it in the enclosed postage paid envelope. MARKING INSTRUCTIONS:
• Use a dark colored ballpoint pen such as blue or black. A No. 2 pencil can also be used.
• Do not use other colors of ballpoint pens such as pink or red. • Do not use markers or felt tip pens which can bleed through the page. • Erase cleanly any marks you wish to change. • Mark solid marks that fill the response completely:
CORRECT: INCORRECT:

265
Very Important
Q1. Please indicate how important you think it is to provide the following park and recreation facilities and services within California. Please fill in the circle that corresponds with your answer for each facility or service. Areas and facilities for environmental and outdoor education programs 〇 〇 〇 〇 〇
Multi-use turf areas for field sports such as softball, baseball, soccer, and/or football 〇 〇 〇 〇 〇
Courts for activities such as tennis, basketball, and volleyball 〇 〇 〇 〇 〇
Multi-purpose buildings with rooms that can be used for community meetings and facilities for cultural events, senior or teen programs 〇 〇 〇 〇 〇
Play activity areas for tots and young children 〇 〇 〇 〇 〇
Facilities in the local community that can be used for day youth camps 〇 〇 〇 〇 〇
Facilities in the local community for overnight camping 〇 〇 〇 〇 〇
Off-leash dog parks 〇 〇 〇 〇 〇
Community swimming pools 〇 〇 〇 〇 〇
Community skateboard parks 〇 〇 〇 〇 〇
Picnic sites for large groups 〇 〇 〇 〇 〇
Trails solely for a single activity such as hiking, mountain biking, or horseback riding 〇 〇 〇 〇 〇
Trails for multiple, non-motorized activities such as hiking, mountain biking or horseback riding 〇 〇 〇 〇 〇
Hard surface trails for biking, jogging, and fitness walking 〇 〇 〇 〇 〇
RV campgrounds with electrical and water hookups, sewer dump stations, or pull-through sites 〇 〇 〇 〇 〇
Sheltered lodging facilities such as rustic cabins, yurts, and tent cabins 〇 〇 〇 〇 〇
Commercial visitor services within public parks and outdoor recreation areas such as hotels, motels, restaurants, or shops
〇 〇 〇 〇 〇
Areas for the legal use of off-highway vehicles such as motorcycles, dune buggies, 4-wheel drive vehicles, or all-terrain vehicles 〇 〇 〇 〇 〇
Wilderness type areas where no vehicles or development are allowed 〇 〇 〇 〇 〇
Developed fishing areas with piers and/or fish cleaning stations 〇 〇 〇 〇 〇
Public hunting areas especially managed for waterfowl like ducks and geese 〇 〇 〇 〇 〇
Launch ramps, marinas, and other boating facilities 〇 〇 〇 〇 〇
Recreation facilities at lakes, rivers and reservoirs 〇 〇 〇 〇 〇
Not at all Important
See Tables 34, 62, 145

266
Q2. For each activity below, please estimate the total number of days you participated in that activity during the past 12 months. This includes those days when you only participated in an activity for a short period of time. For example, a two-hour bike ride would be considered one day. If you did not participate in an activity during the past 12 months, please leave the space for the activity blank. Also, for each activity please fill in the circle in the second column if you would like to engage in this activity or engage in it more often. Picnicking in picnic areas (with tables, fire pits, or grills) ________ 〇 Camping in developed sites with facilities such as toilets and tables (not including backpacking) ________ 〇 RV/trailer camping with hookups ________ 〇 Backpacking (overnight hiking) ________ 〇
Backcountry activities such as mountaineering, rock climbing, and bouldering ________ 〇 Walking for fitness or pleasure ________ 〇
Jogging and running for exercise (on trails, streets, sidewalks, paths) ________ 〇
Day hiking on trails ________ 〇 Skateboarding (skate parks, paths, sidewalks) ________ 〇 Horseback riding, horse shows and events ________ 〇
Bicycling on paved surfaces ________ 〇 Bicycling on unpaved surfaces and trails (mountain biking) ________ 〇
Driving for pleasure, sightseeing, driving through natural scenery ________ 〇
Wildlife viewing, bird watching, viewing natural scenery ________ 〇 Outdoor photography ________ 〇 Downhill (Alpine) skiing ________ 〇
Snowboarding ________ 〇 Cross-country skiing ________ 〇
Snowmobiling ________ 〇
Off-highway vehicle use (motorcycles, 4-wheel drive, all-terrain vehicles) ________ 〇 Swimming in a pool ________ 〇 Swimming in freshwater lakes, rivers and/or streams ________ 〇 Beach activities (swimming, sunbathing, surf play, wading, playing on beach) ________ 〇
Surfing or boogie boarding, windsurfing ________ 〇
Paddle sports (kayaking, rowing, canoeing, rafting) ________ 〇 Sail boating ________ 〇
Motor boating, personal watercraft (jet skis, wave runners, waterskiing, wakeboarding) ________ 〇 Fishing - freshwater ________ 〇 Fishing - saltwater (includes catching abalone, clams, crabs, etc.) ________ 〇
Hunting (large or small game with a firearm) ________ 〇 Target shooting (including pistol and skeet) ________ 〇
Days in the past
12 months
Would do
more often
See Tables 25-28, 57-58, 139a, 139b, 140a, 140b

267
Attending outdoor cultural events (festivals, fairs, concerts, historical reenactments, outdoor theatre) ________ 〇
Visiting historic or cultural sites ________ 〇 Visiting outdoor nature museums, zoos, gardens or arboretums ________ 〇 Using open turf areas (casual and unstructured activities - games, relax, sunning, etc.) ________ 〇
Using play equipment, play structures, tot-lots ________ 〇
Organized team sports such as soccer, football, baseball, softball, basketball ________ 〇
Golf ________ 〇 Tennis ________ 〇 Other (please specify)___________________________________________ ________ 〇 Q3. Of the activities listed in question 2 above, please select up to your three favorite activities (in order of most favorite to least favorite). Write each activity in the space provided then fill in the circle indicating how much you would be willing to pay to participate in that activity. I would be willing to pay: $1-$4 $5-$10 $11-$15 $16-$20 $0 Favorite Activity: _____________________________ 〇 〇 〇 〇 〇 2nd Most Favorite Activity: ______________________ 〇 〇 〇 〇 〇 3rd Most Favorite Activity: ______________________ 〇 〇 〇 〇 〇 Q4. During the past year, how many days did you visit each of the following types of outdoor recreation areas? Please write the number of days for each type of recreation area. Days visited in Type of Outdoor Recreation Area the past 12 months
Highly developed parks and recreation areas: In or near urban areas that may include playgrounds, sports facilities, and highly developed beaches; for example, city parks............ __________
Developed nature-oriented parks and recreation areas: Located outside or on the fringe of urban areas, including trails, picnic areas, campgrounds, and information centers. Generally includes national, state, large county and regional parks, beaches, reservoirs, and state and national recreation areas.... __________
Historical or cultural buildings, sites, or areas: Regardless of location.................................... __________ Natural and undeveloped areas: Large areas in a natural or nearly natural condition, with few developments; for example, forests, deserts, mountains, wetlands, and seashores ...................... __________
See Tables 29-31, 60
See Tables 9, 52, 109-115
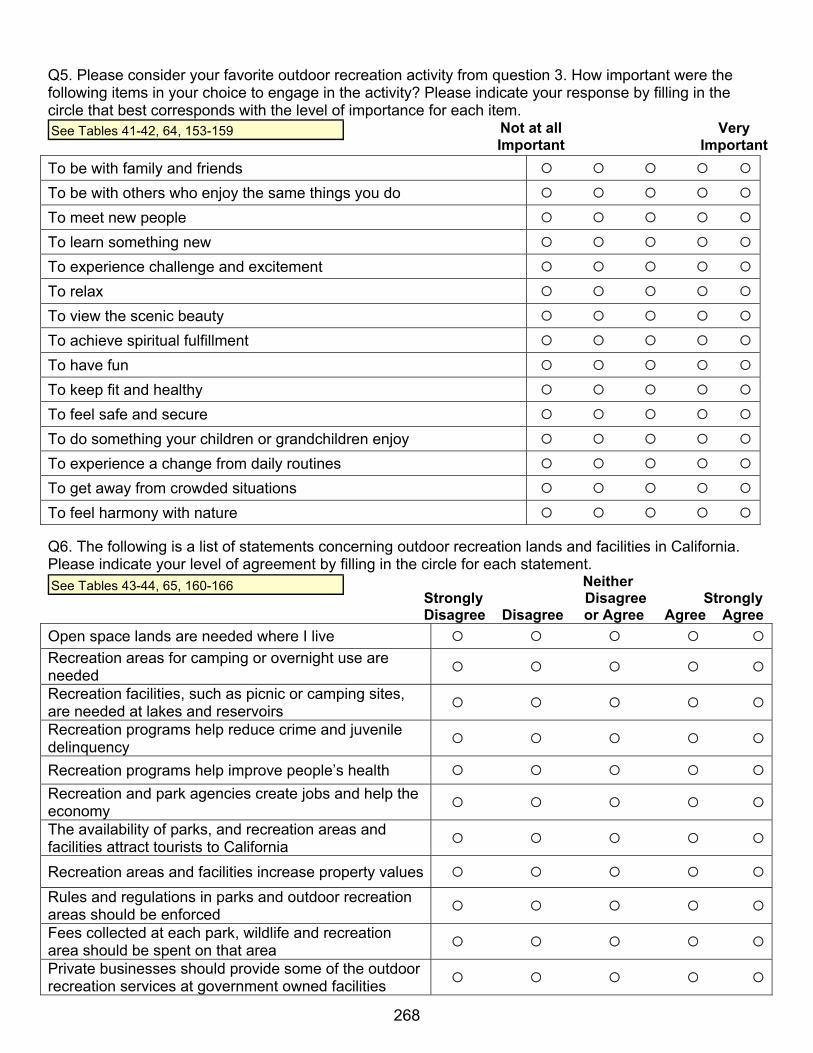
268
Q5. Please consider your favorite outdoor recreation activity from question 3. How important were the following items in your choice to engage in the activity? Please indicate your response by filling in the circle that best corresponds with the level of importance for each item. To be with family and friends 〇 〇 〇 〇 〇To be with others who enjoy the same things you do 〇 〇 〇 〇 〇To meet new people 〇 〇 〇 〇 〇To learn something new 〇 〇 〇 〇 〇To experience challenge and excitement 〇 〇 〇 〇 〇To relax 〇 〇 〇 〇 〇To view the scenic beauty 〇 〇 〇 〇 〇To achieve spiritual fulfillment 〇 〇 〇 〇 〇To have fun 〇 〇 〇 〇 〇To keep fit and healthy 〇 〇 〇 〇 〇To feel safe and secure 〇 〇 〇 〇 〇To do something your children or grandchildren enjoy 〇 〇 〇 〇 〇To experience a change from daily routines 〇 〇 〇 〇 〇To get away from crowded situations 〇 〇 〇 〇 〇To feel harmony with nature 〇 〇 〇 〇 〇 Q6. The following is a list of statements concerning outdoor recreation lands and facilities in California. Please indicate your level of agreement by filling in the circle for each statement. Neither Strongly Disagree Strongly Disagree Disagree or Agree Agree Agree Open space lands are needed where I live 〇 〇 〇 〇 〇
Recreation areas for camping or overnight use are needed 〇 〇 〇 〇 〇
Recreation facilities, such as picnic or camping sites, are needed at lakes and reservoirs 〇 〇 〇 〇 〇
Recreation programs help reduce crime and juvenile delinquency 〇 〇 〇 〇 〇
Recreation programs help improve people’s health 〇 〇 〇 〇 〇
Recreation and park agencies create jobs and help the economy 〇 〇 〇 〇 〇
The availability of parks, and recreation areas and facilities attract tourists to California 〇 〇 〇 〇 〇
Recreation areas and facilities increase property values 〇 〇 〇 〇 〇
Rules and regulations in parks and outdoor recreation areas should be enforced 〇 〇 〇 〇 〇
Fees collected at each park, wildlife and recreation area should be spent on that area 〇 〇 〇 〇 〇
Private businesses should provide some of the outdoor recreation services at government owned facilities 〇 〇 〇 〇 〇
Very Important
Not at allImportant
See Tables 41-42, 64, 153-159
See Tables 43-44, 65, 160-166

269
Q7. Many government outdoor recreation providers contract out some of their work and services to private, profit-making firms. Please indicate which of the following activities or services you think are appropriate for a private firm to provide in public park and recreation areas. Please fill in the circle that corresponds with your answer for each work or service.
Provision by a Private Firm: Work or Services Yes No Uncertain
Food services such as the sale of ready-to-eat food and beverages 〇 〇 〇 Sponsorship of contests, races, and special events 〇 〇 〇 General maintenance of facilities and grounds 〇 〇 〇 Patrol and law enforcement duties 〇 〇 〇 Guided nature walks, educational activities 〇 〇 〇 Operation and maintenance of campgrounds or other lodging facilities 〇 〇 〇 Rental of recreational equipment such as boats, camping equipment 〇 〇 〇 Total operation and management of the park or recreation area 〇 〇 〇 Operation of marinas and boat launching facilities 〇 〇 〇 Q8. How much emphasis do you think that state and federal government agencies that normally provide outdoor recreation areas and facilities in California should place on each of the following ideas? Please fill in the circle that corresponds with your answer for each idea.
Idea
Less
emphasis
About the same emphasis
More
emphasis
Don't know/
UnsureBuying additional parkland and open space for recreation purposes 〇 〇 〇 〇
Maintaining or caring for park and recreation areas 〇 〇 〇 〇 Providing educational programs 〇 〇 〇 〇 Building new facilities 〇 〇 〇 〇 Remodeling and improving existing facilities 〇 〇 〇 〇 Protecting natural resources 〇 〇 〇 〇 Protecting historic resources 〇 〇 〇 〇 Providing more organized activities and special events 〇 〇 〇 〇 Cleaning up pollution of the ocean, lakes, rivers and streams in park and recreation areas 〇 〇 〇 〇
See Tables 45-46, 167
See Tables 39-40, 63, 146-152

270
Q9. The following factors might discourage you from being more physically active in a park. How much do each of the following factors limit your level of physical activity? Factor Not at all A lot No one to be physically active with 〇 〇 〇 〇 〇 Fear of crime from others in the park 〇 〇 〇 〇 〇 Personal safety concerns (e.g., fear of injury, poorly maintained equipment) 〇 〇 〇 〇 〇 Poorly maintained park (e.g., excess trash, run down facilities) 〇 〇 〇 〇 〇 Park does not have the facilities I like to use (e.g., fitness stations, trails) 〇 〇 〇 〇 〇 Poorly maintained trail conditions (e.g., unsafe surface, no lighting at night) 〇 〇 〇 〇 〇
Trail design (e.g., difficulty accessing trail) 〇 〇 〇 〇 〇 Poor lighting in park 〇 〇 〇 〇 〇 Alcohol and drug use in park 〇 〇 〇 〇 〇 Gang activity in park 〇 〇 〇 〇 〇 Lack of scenic beauty 〇 〇 〇 〇 〇 Personal health problems (e.g., difficulty walking, breathing) 〇 〇 〇 〇 〇
Limited park hours (e.g., fitness facilities, pool) 〇 〇 〇 〇 〇 Park is too far away from where I live 〇 〇 〇 〇 〇 I am physically active elsewhere 〇 〇 〇 〇 〇 I am not physically active 〇 〇 〇 〇 〇 Not enough time 〇 〇 〇 〇 〇 Lack of skills and abilities 〇 〇 〇 〇 〇
Costs of activity 〇 〇 〇 〇 〇 Park is not accessible for individuals with a physical disability 〇 〇 〇 〇 〇 No restrooms 〇 〇 〇 〇 〇 Lack of public transportation to park 〇 〇 〇 〇 〇 Don’t feel welcome in park 〇 〇 〇 〇 〇 Weather 〇 〇 〇 〇 〇
Dogs are not allowed 〇 〇 〇 〇 〇 Commercial visitor services, like food services or gift shops, are not available 〇 〇 〇 〇 〇 Other (please specify) ______________________________________ 〇 〇 〇 〇 〇
See Tables 21-23, 55, 131-137, A-2

271
Q10. California is beginning a major effort to reduce and adapt to climate change and global warming. The following is a list of statements regarding management actions that park agencies could adopt to assist with this effort. Please fill in the circle that corresponds with your level of agreement for each action. Neither Strongly Disagree Strongly Management Actions Disagree Disagree or Agree Agree Agree
Educate Californians: Park agencies should educate 〇 〇 〇 〇 〇 park visitors about global climate change and ways in which people can reduce the effects of global climate change in California (i.e., through education programs at parks, interpretive materials, setting examples in park operations). Reduce climate-changing gases: Park agencies 〇 〇 〇 〇 〇 should develop energy efficient facilities, create paths and bike trails that provide alternatives to motorized travel, and plant trees to off-set carbon output from pollution. Anticipate the effects of climate change: Park 〇 〇 〇 〇 〇 agencies should identify hazards (i.e., buildings close to unstable shorelines that could result from rising seas); manage parks to help protect wild animals and plants affected by global climate change. Do nothing: Park agencies should not be involved 〇 〇 〇 〇 〇 with efforts to reduce or adapt to climate change and global warming. Other action (please specify): ____________________〇 〇 〇 〇 〇 Q11. Finally, please use the space below for any comments you may have about public parks and outdoor recreation areas, services and facilities in California. Thank you for your assistance. Thank you for your time and participation in the survey. Please return your completed questionnaire in the enclosed envelope, and thank you for taking your time to assist us. If a child in your household completed a youth questionnaire, please also include it in the envelope. Thank you again!
See Tables 47-49, 168-174, Charts 6-9

272

273
Appendix F: Public Opinions and Attitudes Youth Mail-Back Survey
California Department of Parks and Recreation
OUTDOOR RECREATION
YOUTH QUESTIONNAIRE
Conducted for
by
Recreation, Parks, & Tourism Administration Program, Cal Poly San Luis Obispo
Parks, Recreation, and Tourism Department University of Utah
Diagnostics Plus, Inc.

274
Dear California Youth, In this survey we are going to ask you questions about the kinds of things you like to do for fun outside. Please read each question very carefully and answer it the best you can. If you don’t know what a question means, it’s okay to ask your mom, dad, guardian or another adult to explain it to you. But we want your answers to be about your own activities and thoughts, not the activities and thoughts of someone else. The information that you provide is very important to the future of outdoor recreation for all ages in California. Once we receive your completed survey you will be sent $5 in the mail. MARKING INSTRUCTIONS: • Use a dark colored ballpoint pen such as blue or black. A No. 2 pencil can also be used. • Do not use other colors of ballpoint pens such as pink or red. • Do not use markers or felt tip pens which can bleed through the page. • Erase cleanly any marks you wish to change. • Mark solid marks that fill the response completely: CORRECT: INCORRECT:

275
1. What is your favorite outdoor activity? 2. Why is this your favorite activity? (please fill in one or more circles)
〇 To do something with my friends or family
〇 For fun and enjoyment
〇 For exercise or fitness
〇 To be outside
〇 Other (please write out)
3. Who do you do this activity with? (please fill in one or more circles) 〇 Alone (yourself)
〇 Immediate family (parents, brothers, sisters)
〇 Extended family (grandparents, aunts, uncles, cousins)
〇 Friends
〇 Other (write what other people)
4. Where do you most often do this activity? (please fill in only ONE circle)
〇 My yard
〇 Other area or park in my neighborhood
〇 Other area or park outside of my neighborhood, but within my town/city
〇 Other area or park outside my town/city
〇 Other (please indicate where)
See Table 70
See Table 71
See Table 69
See Table 68

276
5. Please fill in the circles below for the activities that you have done before the age of 14. If you have not done any of these activities please write the reasons why you have not done them. For example, reasons you may not have done an activity might be that you are not interested, it is too dangerous, it is too expensive, you prefer to be indoors, you’d rather spend time on a computer or watching T.V., you are too busy with chores, homework or other recreation activities, or you don’t have someone to do it with. There may be other reasons that you can think of to write below.
Activity: Reasons you did not participate:
〇 Visit a California historic site or Reasons: history museum 〇 Play in the water (either at a swimming Reasons: pool, river, lake, or the ocean) 〇 Play in a safe place Reasons: 〇 Go camping overnight Reasons: 〇 Explore nature outdoors Reasons: 〇 Learn to swim Reasons: 〇 Play on a sports team Reasons: 〇 Hike, bike, or ride on a trail Reasons: 〇 Catch a fish Reasons: 〇 Celebrate your heritage (your family Reasons: history or traditions at an event, family reunion, festival)
See Tables 76-96, B4-B23

277
6. Please tell us about your participation in outdoor activities. For each activity, fill in the circle if
you participated in it during the past 12 months. If you did not do an activity, leave the circle blank. Also, for each activity (whether you have done it or not in the past 12 months) fill in the circle if you would like to do the activity more often.
〇 〇 Mountain biking (unpaved dirt surfaces, trails)
〇 〇 Day hiking
〇 〇 Backpacking (overnight hiking)
〇 〇 Rock climbing
〇 〇 Horseback riding
〇 〇 Walking on streets, sidewalks, paths, or trails in your community
〇 〇 Jogging or running
〇 〇 Skateboarding (skate parks, paths, sidewalks)
〇 〇 In-line skating or rollerblading
〇 〇 Camping (tent, recreational vehicle, trailer)
〇 〇 Picnicking
〇 〇 Fishing
〇 〇 Hunting
〇 〇 Archery
〇 〇 Target shooting
〇 〇 Off-road vehicle use (motocross, ATVs, dune buggies, 4 wheel drive)
〇 〇 Swimming in a pool
〇 〇 Swimming in ocean, lakes, rivers, and streams
〇 〇 Surfing or boogie boarding
〇 〇 Paddle sports (kayaking, canoeing, rowing)
Participated in the past 12 months
Activity
Would like to
do more
See Tables 72-75

278
6. (continued)
〇 〇 Beach activities, surf play (including sunbathing, wading, playing on
beach)
〇 〇 Waterskiing or wakeboarding
〇 〇 Jet skis or wave runners
〇 〇 Visiting historical or cultural sites, museums, zoos, gardens
〇 〇 Playing in a park (games, kite flying, catch with a ball, Frisbee, play
structure, swing set, etc.)
〇 〇 Exploring tide pools
〇 〇 Wildlife viewing and watching
〇 〇 Going on a scenic drive with someone
〇 〇 Snowboarding
〇 〇 Attending outdoor events (festivals, fairs, concerts, historical
reenactments, outdoor theatre)
〇 〇 Downhill skiing (snow skiing with a lift)
〇 〇 Cross-country skiing
〇 〇 Sledding, ice skating, snow play
〇 〇 Snowmobiling
〇 〇 Team sports (baseball, soccer, softball, football, basketball, volleyball,
etc.)
〇 〇 Tennis
〇 〇 Golf
〇 〇 Bicycling (on paved surfaces)
〇 〇 Martial arts/tai chi/yoga
〇 〇 Other activity (please write out)_____________________________
〇 〇 Other activity (please write out)_____________________________
Participated in the past 12 months
Would like to
do more Activity

279
7. What could be done that would help you to participate in outdoor activities more often?
〇 Provide areas for these activities that are just for kids my age
〇 Provide equipment (like sports equipment, playground equipment)
〇 Provide more recreation areas closer to my home (sports fields, skateboard
parks, open space areas)
〇 Provide safer ways to get to recreation areas close to my home
〇 Provide transportation to recreation areas and activities
〇 Provide instruction or lessons
〇 Other (write in what would help)
8. Do the reasons below keep you from doing outdoor activities? Please fill in a circle
for yes, no, or sometimes for each reason.
〇
Yes
〇
No
〇
Sometimes
I’m too busy (with homework, after-school activities, chores,
work)
〇
Yes
〇
No
〇
Sometimes I’d rather be on the Internet (myspace, surfing the web) or playing video games
〇
Yes
〇
No
〇
Sometimes I’d rather be watching TV
〇
Yes
〇
No
〇
Sometimes
My parents or guardians can’t afford the activities I would like
to do
〇
Yes
〇
No
〇
Sometimes
A recreation area or park is too far away to walk, drive or ride
my bike
〇
Yes
〇
No
〇
Sometimes My parents or guardians think the activities are too dangerous (I might hurt myself)
〇
Yes
〇
No
〇
Sometimes
My friends don’t want to do the outdoor activities that I want
to do
〇
Yes
〇
No
〇
Sometimes No one in my family does these activities
〇
Yes
〇
No
〇
Sometimes I don’t know how to do these activities
See Tables 97-98, B-2
See Tables 99-100, B-3

280
〇
Yes
〇
No
〇
Sometimes It isn’t safe to do these activities near where I live (because of crime or gang activity)
〇
Yes
〇
No
〇
Sometimes It is too hot or cold outside (or other weather reasons)
〇
Yes
〇
No
〇
Sometimes Other (please write the reason or reasons)
9. Are you? 〇 Girl (female) 〇 Boy (male) 10. How old are you?
Thank you for completing the survey! Please give this questionnaire back to your
parents, guardian or another adult and ask them to mail it with their completed questionnaire.
See Table 66
See Table 66