complete the incompleteness of land reform: household...
TRANSCRIPT

1
Complete the Incompleteness of Land Reform:
Household Level Evidence from West Bengal
Klaus Deiningera
Songqing Jinb
and
Vandana Yadavb
aWorld Bank
bMichigan State University
Department of Agriculture, Food and Resource Economics Michigan State University
East Lansing, MI 48824-1039, U.S.A.
Selected Paper prepared for presentation at the Agricultural & Applied Economics
Association’s 2011 AAEA & NAREA Joint Annual Meeting, Pittsburgh, Pennsylvania
July 24-26, 2011.
Copyright 20011 by Klaus Deininger, Songqing Jin and Vandana Yadav. All rights reserved. Readers may make verbatim copies of this document for non-commercial purposes by any means, provided that this copyright notice appears on all such copies.

2
Land Reform Effects on Human Capital Investment and Productivity: Household Level Evidence from West Bengal
(Abstract)
Land reforms were successfully implemented in the state of West Bengal through a special program undertaken in 1978 by the then state government. These reforms brought large amount of land under permanent and inheritable tenancy. We use a survey data of more than 9000 plots from 2000 households in 142 villages in West Bengal to ascertain that both productivity and long-term investments on such land are significantly lower than the land under ownership. We also find evidence for disparate levels of input usage on the tenancy plots as compared to those which are fully owned by the cultivator. Programs to allow land reform beneficiaries to acquire full ownership could thus have significant benefits.
1. Introduction
Land holdings in India were historically distributed in a highly unequal fashion, and have
always been used as a source of social power. Ensuring secure access to land for the poor and
landless had been the key motivation for India's land reform since independence. Since then a
number of land reforms have been carried out by the government – abolition of ‘Zamindari’ or
middlemen as revenue collectors, imposing ceiling on landholdings and awarding of the surplus
land’s rights to landless, and tenancy reforms (Mearns, 1998). While abolition of intermediaries
has been implemented swiftly and successfully without much obstacle, the implementation of
ceiling and tenancy reforms are vehemently challenged.
Land reforms have impacted 12.4 mn tenants on 15.6 mn acres of land through
redistribution of ownership rights or by providing them secure access as per the Government of
India records until 2002 (Hanstad et al., 2008). Total area affected in India is more than three times
what was involved in the well-known land reforms of Japan, Korea, and Taiwan together (King
1977). However, the implementation of the land reform in India has varied vastly across states.
The two states that have been most successful in implementing tenancy and ceiling reforms are
West Bengal and Kerala (Ghatak and Roy, 2007). In West Bengal this was achieved by the launch
of a tenant registration drive in 1978, popularly known as “Operation Barga”. This was a program

3
designed to implement tenancy laws that regulated rent and provided security of tenure to
sharecroppers. Due to subsequent successful implementation of the tenancy laws in West Bengal,
we look at the evidence of impact of reforms in this state.
Despite considerable interest in the topic at the policy level and a large literature
documenting the way land reforms were put in practice at the state level (Yugandhar 1996,
Thangaraj 2004), quantitative evidence on their impact is limited. Up to now all of the evidence on
land reform impacts has been at a highly aggregate level (state or district level) and failed to
distinguish the types of reform with varying outcomes. The high aggregation clearly limits the
policy relevance of these studies.
Besley and Burgess (2000) using all-India data exploit interstate variations and find that
the number of identifiable land reform laws across states is positively related to the extent of
poverty reduction but not agricultural productivity. Using the same data, Ghatak and Roy (2007)
find that the impact of land reform on agricultural productivity depends on the type of reform.
They also check the robustness of results by using additional measures of productivity from
alternate datasets. Banerjee, Gertler and Ghatak (2002) use district level data from West Bengal to
conclude reforms improved productivity, and can explain 28 percent of the agricultural
productivity growth occurring post reforms. Similarly, Bardhan and Mookherjee (2007) use a
village level land reform data to conclude a positive impact on productivity. Reforms also affect
the accumulation of human and physical capital of the beneficiary households (Deininger et al.
2008). Given the evidence that poor and landless are likely to benefit most from land reform
(Besley and Burgess 2001; Deininger et al. 2008), role of tenancy reforms in enhancing human
capital investment of children of bargadars household is an important long-term impact of these
reform.
The policy relevance of studying the impact of land reform at individual beneficiary level
has well emphasized in the literature (Ghatak and Roy, 2007; Bardhan and Mookherjee, 2007).
Data limitation is probably the single most important reason why almost all the studies on this

4
topic are based on aggregate data. In this paper, we are able to fill in this knowledge gap by using
plot level production and investment data from a large sample of households from West Bengal,
one of the Indian state where land reform implementation, through the award of permanent
tenancy rights to barga land following the ascent to power of the Communist Party in 1978, has
made the greatest advances. We test whether there is Marshallian inefficiency associated with the
tenancy land by comparing crop productivity, input use intensity and land investment between
barga land and land with ownership after household fixed effects and plot characteristics are
controlled for. We find that the differentials between the output values and yield exist because of
tenancy status. These differences are of the magnitude of -.217 to -.07, depending upon the season
and crop under investigation. We also find the tenancy land is negatively related to input use
intensity and farmers decisions of land investments. Our results suggest that land under reform is
less productive as compared to owned land under cultivation due to the disincentives associated
with sharing contracts. These results suggest awarding full ownership to beneficiaries could be
efficiency-enhancing.
The paper is structured as follows. Section two discusses land reform in a global context. Section
three describes data sources and discusses descriptive statistics on reform targeting, and the
comparison in productivity, input use and long-term investments between reform land and own
land. The econometric results are presented in section four and section five concludes by briefly
discussing policy implications.
2. Background and relation to the literature
This section reviews the rationale and level of land reform implementation -globally and in India-
highlighting main types of land reform and the quantitative accomplishments under each of them.
We use this as a basis to formulate hypotheses on the impact of different types of land reform and
their evolution over time and to outline our strategy that will allow us to assess these empirically
using the data at hand.

5
2.1 Land reform in a global context
A large body of empirical literature on agricultural production has shown that, due to the
transaction costs involved in supervising hired labor (Carter 1984, Feder 1985, Eswaran and
Kotwal 1985, Benjamin 1995), a farm structure based on owner-operated units is more efficient
than one based on wage labor (Berry and Cline 1979, Binswanger et al. 1995). Although market
mechanisms can, in principle, help to equalize the operational land distribution and thus maximize
aggregate production, challenges remain. First, transaction costs and borrowing constraints may
reduce the number of market transactions well below the optimum. Second, to the extent that
transactions in rental and sales markets require transfers of resources among the parties involved
even productivity-enhancing transactions may have undesirable distributional implications. At low
levels of development, and especially with high inequality in the land ownership distribution,
landlords may be able to reduce the benefits to tenants by exerting market power. At higher levels
of development, speculative elements may cause a discrepancy between the market value of land
and its underlying ‘fundamental’ value based on profits from agricultural production, thereby
preventing movement of land to the most productive producers. Third, with imperfections in other
markets, e.g. those for labor or credit, market transactions may not achieve first best outcomes in
terms of production. As a result, government interventions that aim to provide the most productive
producers with land access can have significant social and economic benefits (Chau 1998, Carter
and Zimmerman 2000).
In addition to its potential to increase productivity, land reform can, through its possible effect on
credit markets, also affect productive investment. It can have additional impacts by overcoming
some of the negative consequences of a highly unequal distribution of asset ownership and
economic opportunities. One frequently cited issue is that, with credit market imperfections, the
poor may not be able to attain the level of indivisible investment in human or physical capital that
would correspond to their innate ability (Galor and Zeira 1993, Gersbach and Siemers 2005). In
6
such situations, exogenous increases of asset endowments can bring the level of investment closer
to the social optimum and also be beneficial to the individuals concerned. A second possible
reason is that limited access to economic resources is likely to translate into limited political
influence, possibly giving rise to a vicious and self-perpetuating circle of high inequality, bad
institutions, and low economic growth (Acemoglu et al. 2004). Also, a tendency towards
segregation may affect communities’ ability to supply local public goods and, to the extent that
these are essential inputs into private production, trap the poor in an undesirable equilibrium
(Durlauf 1996, Cardenas 2003). This can be pronounced in cases where what is produced are
public “bads” such as violence, social unrest, and strife, which are associated with significant
economic as well as social costs.1
The potential productivity and social benefits from a more egalitarian distribution of land, often
combined with arguments in favor of historical justice, have provided a justification for
redistributive policies in many countries. The goal was to establish a foundation for an inclusive
and broad-based pattern of economic development in some of the world’s most unequal societies.
The review of land reform episodes in table 1 illustrates that the magnitude of such efforts, in
terms of the number of beneficiaries and the size of area redistributed, was enormous.2 Well-
known land reforms in Japan, Korea, and Taiwan at the end of World War II redistributed between
30% and 40% of the cultivated area, affecting about two thirds of rural households. Although they
were drawn out over longer time periods, reforms in Bolivia, Nicaragua, Peru, and Mexico,
affected sizeable portions of their countries’ arable land endowment and benefited up to a third of
the rural population.
1 For a theoretical underpinning for the relationship between distribution and provision of public goods, including social cohesion, see (Bardhan and Ghatak 1999). It has also been shown that, especially in rural environments where other markets are imperfect, such interventions can help improve their nutritional status, risk-bearing capacity, and investment incentives, in addition to enhancing their ability to access credit markets (Burgess 2001). 2 The purpose of this table is illustrative, to provide an indication of the orders of magnitude involved. Figures on area redistributed and number of beneficiary households are taken from the cited sources and percentages have been calculated by taking the total area of arable land (from FAO statistics) and the rural population divided by 5 (to obtain an estimate of the number of rural households).

7
Compared to the magnitude of these efforts, evidence on their effect is scant and often focused on
outputs rather than impact based on a rigorous counterfactual. In Japan, Korea, and Taiwan, land
reforms helped improve productivity and set the stage for an impressive increase in non-
agricultural development (Jeon and Kim 2000). In the Philippines, early land reforms that
benefited more than 0.5 million households and green revolution technology, improved household
welfare (Otsuka 1991, Balisacan and Fuwa 2004) and increased investment and human capital
accumulation (Deininger and Olinto 2001). Although quite effective, land reforms undertaken
immediately after independence in some African countries, e.g. Kenya and Zimbabwe (Scott 1976,
Gunning and et al 2000, Deininger et al. 2004) were often abandoned for political reasons (Kinsey
and Binswanger 1993). In Latin America, reforms distributed comparatively large amounts of land
(Barraclough 1970, Eckstein and Horton 1978, Jarvis 1989) but often failed to improve
productivity and were insufficient to help overcome deep-rooted structural inequalities (de Janvry
and Sadoulet 1989). Following a relative decline of interest in the topic during the late 1970s, it
received renewed attention recently,3 partly due to the fact that, even if accompanied by high
levels of growth, macro-economic reforms in countries characterized by high land inequality often
failed to narrow the gap between the rich and the poor. More importantly, the task which the
original reforms set out to accomplish remains in many respects unfinished (Lipton 1993).
Together with a strong political appeal of land redistribution, this has recently prompted countries
as diverse as Brazil, Bolivia, South Africa, the Philippines, Venezuela, and Zimbabwe to renew
their land reform efforts.
2.2 Land reform implementation in India
In India, land reform, implementation of which is the responsibility of individual states, has
occupied a central stage in the policy debate for long time, given inequality in the distribution of
productive assets, especially land, which the country inherited from its colonial masters. Reforms
3 For recent contributions on land reform see (Boyce et al. 1998, Bandiera 2003, Bobrow-Strain 2004, Borras, Jr. 2005, Bradstock 2005, Eastwood et al. 2006).

8
had three main elements (Mearns 1999), namely (i) abolition of intermediaries (zamindars) shortly
after independence; (ii) tenancy laws to increase tenure security by sitting tenants by registering
them and often imposing restrictions on the amount of rent they had to pay or the scope for new
rental transactions;4 (iii) ceiling laws that provided a basis for expropriating land held by any given
owner in excess of a state-specific ceiling and subsequently transferring it to poor farmers or
landless agricultural workers. While the first of these is considered to have been highly successful,
progress on the remainder was initially very slow, accelerating only during the 1970s and slowing
down again in the 1980s. Still, both types of intervention resulted in the transfer of rights to almost
10 mn hectares of land, an area more than three times what was involved in the well-known land
reforms of Japan, Korea, and Taiwan together (King 1977). With the exception of few states, the
political commitment to implement reforms was limited and sometimes outcomes were counter to
what had been desired, as with large-scale tenant evictions to prevent them from gaining more
permanent land rights in anticipation of tenancy laws (Appu 1997).
Table 2 provide summary statistics for the level of land reform implementation, measured as the
share of rural population who received land through tenancy reform, the area transferred as a result
of ceiling legislation, or the number of ceiling laws, by state based on a summary report that draws
together official data from various annual reports by the Ministry of Agriculture (Kaushik 2005).
Over and above the large amounts of land affected by zamindari abolition and private initiatives
such as donations of land under the Bhoodan movement,5 direct land distribution affected about
2.5 mn hectares under programs to redistribute of ceiling surplus land, and 7.35 mn hectares under
tenancy reform, implying a direct transfer of 5.45% of the area to about 5.35% of the agricultural
population for the country as a whole. Comparing this to what has been involved in other land
4 Many states combined legislation to improve the situation of tenants with either a complete prohibition of land leasing or provisions to provide tenants who had been on the land for some time with very strong property rights, something that is likely to have limited new supply of land to the rental market (Deininger et al. 2007). 5 The amount of land donated voluntarily and distributed under the Bhoodan movement amounted to 0,7 mn ha by 2004, with focus on Bihar, Orissa, and Uttar Pradesh(Government of India 2006a). While some of these donations may have been motivated by a desire to avoid being affected by ceiling laws, we subsume all of these under the indirect effects of legal measures.

9
reforms internationally illustrates the size of India’s land reform.6 Ceiling and tenancy laws
together resulted in the redistribution of about 10% of arable land, about the level of the
Philippines, Brazil, or Zimbabwe before 2000, but below Asian countries such as Japan, Korea,
and Taiwan (33.3%, 27.3%, and 26.9%) or even El Salvador, Bolivia, and Mexico (27.9%, 32.3%,
and 13.5%). In terms of the share of rural households benefiting, India’s accomplishment is at the
lower end of the scale; while it exceeds what has been accomplished in the pre-1994 period in
Kenya, Zimbabwe, and Brazil (1.6%, 3.1%, and 5.4% of the rural population, respectively), it
remains considerably below other Asian countries such as the Philippines (24%), Japan (60.9%),
and Taiwan (62.5%) or Latin American ones such as Mexico (67.5%), Bolivia (47.5%), and El
Salvador (16.8%).
Comparing the share of beneficiary households to that of the area transferred points towards
considerable variation across states. In some cases, e.g. Kerala or West Bengal, 12.5% and 10.8%
of the population benefited from transfer of 8.5% and 6.4% of the land area, respectively, plot
sizes for land transferred remained considerable below the state average. While some states (e.g.
Gujarat or Tamil Nadu) provided beneficiaries with plots of about average size, in most of the
states the fact that the share of beneficiaries remains significantly below the area share points
towards transfer of above-average plot sizes, as in Maharashtra (27% of area distributed to 10.7%
of population), Karnataka (15.4% and 5.3%), AP and MP (3.5% and 2.2% to 0.75% and 0.61% of
population, respectively).
With 4.4% and 2.3%, the share of area redistributed overall or share of households benefiting from
ceiling laws has been below the figures for tenancy reform. Although some states such as
Rajasthan, UP, Bihar, and AP transferred more land (6.6%, 5.8%, 4.4%, and 8.3%) under ceiling
legislation than through tenancy reform, results seem to have been biased towards transfer of
above-average sized plots of land, suggesting that even where it was possible to acquire above
6 Note that the two measures considered here, i.e. tenancy reform and distribution of above-ceiling land, are in addition to any lands transferred through zamindari abolition.
10
ceiling land by the state, overcoming political pressures in the distribution of such land may have
been difficult. In West Bengal, on the other hand, a state that ranks at or near the top for both
measures and that counts with a formidable level of grassroots-level organization, land reform land
appears to have been transferred in a very pro-poor fashion.
For the country as a whole, an average of 2.1 land reform laws had been passed per state with the
mean law being about 13 years old in 1999. Despite the fact that the highest number of laws was
passed in West Bengal where reform-induced transfers were also highest, the correlation between
number of laws and the share of area transferred through or of rural households benefiting from
reform is, with 0.28, low throughout. This supports the notion that legal provisions alone did not
automatically translate into action on the ground, consistent with arguments that there is no a-
priori reason to expect a positive link between passage of laws -which could be a result of an
objective need for land reform and political mobilization or even lack of actual progress- and their
actual implementation. In fact, in a number of states, high levels of legal activity appear to have
been used to deflect attention from lack of progress on the ground.
While not differentiated in the table, a detailed look at the time dimension of reform measures
allows a number of conclusions (Kaushik 2005): After a spurt of land transfers in the 1970s and
1980s, progress has slowed down considerably; in fact between 1995/96 and 2003/04, i.e. for
almost a decade, progress in awarding land rights to tenants had come to a complete standstill; the
increment in ceiling surplus land transferred during the period amounted to only 10,800 hectares.
The latter represents about one tenth of the land declared ceiling surplus, with the remainder being
tied up in litigation. This suggests that, unless there are significant changes in the overall
parameters, progress in achieving further redistribution of ceiling land could be slow -it would
take almost 90 years to dispose of remaining ceiling surplus cases if the current pace is
maintained- but also that, by clogging up the court system and preventing it from quickly
dispensing justice in other urgent matters, the ceiling legislation may impose external effects

11
beyond land rental markets (Moog 1997).7 While broader changes in the legal framework could
make much additional land available, they do not seem to be too likely in the current political
environment.
Despite considerable interest in the topic at the policy level and a large literature documenting the
way land reforms were put in practice at the state level (Yugandhar 1996, Thangaraj 2004),
attempts to quantitatively assess their economic impacts at a national scale are surprisingly scant.
One study finds that the number of identifiable land reform laws across states is positively related
to the extent of poverty reduction but not agricultural productivity (Besley and Burgess 2000).
While this could be used to make the case for land reform as a redistributive measure, e.g. through
a wage effect, use of a measure only weakly linked to implementation of reforms is a shortcoming.
Studies using data on implementation have only been conducted in individual states, mainly West
Bengal. District level data point towards a positive impact of land reform on productivity
(Banerjee et al. 2002), a finding that receives support from household level evidence taking into
account other political factors (Bardhan and Mookherjee 2006). However, as the policy
environment in West Bengal is likely to be uniquely conducive to land reform, a national
assessment of land reform impact based on actual implementation would be very desirable in view
of the continued relevance of the topic in India’s policy debate (Government of India 2006b).
2.3 Hypotheses on land reform impact
Contrary to most empirical studies that have derived estimates of land reform impact from
aggregate data at the district of state level, we use plot and household level information collected
from a large survey in West Bengal. We expect the reform land to have lower productivity than
land with full ownership due to the fact that tenancy reform land (barga land) is also sharecropped
land. As tenants will be rewarded with a proportional of crop production, their incentive to
7 Two main reasons for court cases are contestation by landlords and instances where beneficiaries were allocated land but were either unable to establish effective possession or were subsequently evicted. A field survey to explore this issue in Andhra Pradesh pointed to at least 20% of beneficiaries who were not able to access the property they had received although the number of those who are able to file court cases calling for their (re)instatement is much more limited.

12
undertake (non-contractible) land investment, to use adequate inputs, and to exert effort in
cultivating it will be reduced, compared to what would be the case under full ownership. This will
reduce the productivity of land use at any given point in time, thereby implying an indirect cost of
this type of land reform. The fact that the reform land cannot be subleased is expected to further
discourage tenants to make long-term investments.
3. Data and Estimation Strategy
A listing exercise of the entire population from more than 200 selected villages in 10
districts of West Bengal was carried out, in which 94,000 households are listed. This listing
contained information on the beneficiary status and current tenure status, and was used as a sample
frame for the next round survey. Data used in this on productivity and investments comes from a
detailed survey of households in 142 villages in the 10 districts. Altogether, about 2000 household
were interviewed, and detailed plot level data on nearly 9,585 plots were collected. An official list
of 1978 land reform beneficiaries was used to draw the village sample in which the bargadars were
over sampled to make sure enough beneficiaries are included. The listing exercise collected
detailed information on land tenure, plots (both own and reform land), main physical assets as well
as household demographic characteristics both at the initial period of 1978 and at present, detailed
history of land change (either through inheritance or through market transactions), literacy and
years of education attained for all the members of the dynasty households (i.e. for the head of 1978
household, head of the current household and all the children) is available. The listing data provide
a unique opportunity to understand the targeting and historical background of the reform which we
will describe in more detail in the section to follow. In the follow up survey, detailed information
on input, output of crop production and various types of land investment for all the agricultural
plots were collected to test the inefficiency hypotheses.
3.1. Household characteristics of Reform Beneficiaries in 1978

13
Land reform was targeted towards the poor and landless households at the time of reform.
By comparing household initial characteristics between land beneficiaries (bargadars or pattadars)
with those who were not affected by either type of the reform, we are able to assess whether the
tenancy and ceiling reforms indeed served the redistributive role as initially intended. The
descriptive evidence as obtained from the first round listing data from Table 3 suggests that the
beneficiaries of both types of reform are indeed those households who had endowed with little or
no land and were relatively poorer and whose livelihood was more dependent upon agricultural
sector. In 1978, the average land endowment, inclusive of patta land, for barga and patta
beneficiary was respectively 1.92 acres and 1.31 acres, which was considerably lower than 2.54
acres, the average land endowment of those households who were not affected by the reform.
While share of landless households between barga beneficiaries and non-beneficiaries is about the
same in 1978 (55% and 57%, respectively), the share of landless households among the patta
beneficiaries are considerably higher (75%), which is as expected as ceiling land is mainly to
support the landless households.
Examining the occupational structure of the beneficiaries, it can be seen that both patta
and barga households heavily rely on agricultural sector. While 91 percent of barga households
and 87 percent of patta households reported that their head’s main occupation is either working for
agricultural wage or farming, 76 percent of the households who were not affected by reform
reported so. The limited number of indicators for welfare that were included in the survey (i.e.
namely the condition of roof and wall) tends to suggest that reform beneficiaries were poorer than
non-beneficiaries. For example, 83 percent of barga and 90 percent of patta beneficiaries reported
to have bad quality roof (ie. identified as thatched, or of plastic or mud) as compared to 70 percent
of non-beneficiaries who reported so.
Finally, land reform also benefited more households from lower castes, as indicated by the
fact that 56 percent of barga beneficiaries and 73 percent of patta beneficiaries are from the most

14
marginalized Scheduled Castes & Scheduled Tribes (SC/ST) as compared to as compared to 43
percent of households who were not affect by reform were from SC/ST.
3.2. Descriptive evidence on productivity, input use intensity and land investments
By comparing productivity by land reform status, we try to gain some insights regarding
the differentials in productivity which exist between tenant and owner cultivated land. We find
there exist significant negative correlation between crop productivity and tenancy.
Table 4 shows that the average plot size of tenants is 0.36 acres respectively as compared
to 0.46 acres those of owner occupied plots. Data on production at the plot level suggests
considerable difference between tenancy plots and owner plots. For example, average annual
gross revenue of crop production on own plots is 33 percentage points higher than that for tenancy
plots (22059 Rs. vs. 16578 Rs.). The difference is consistent for the two main crop seasons (Rabi
season and Kharif seasons – Check the number??? This is not really the case in the table). A
similar pattern can be observed if we focus on the yield of rice crop (the most important staple
crop in West Bengal, with own plot yield at 1925 kgs and that of tenancy plots at 1843 kgs). We
also see that input usage of all the inputs used in cultivation is lower on tenancy land as compared
to the land under full ownership. In addition, plot level characteristics suggest poorer irrigation
conditions for tenancy land than for own land. On average, as we see from table 4, 74% of tenancy
land has access to irrigation as compared to 83% on owned land.
Table 5 shows different types of land investments by tenancy status. The investment data
suggests some consistent evidence that the proportion of plots received land related investment is
much higher for own land than for tenancy land. While 43% and 10% of own plots have access to
bore wells and ponds respectively, the corresponding figures for tenancy land is only 38% and 6%,
respectively, The difference is even more striking in other land improvements. Farmers made soil
improvements on 40% of own plots, but the same type of investment was made only on 10% of
tenancy plots.
3.3. Estimation Strategy

15
The descriptive data given in table 4 and 5 is in general consistent with our hypothesis of low
productivity and investment of reform land. The average crop productivity, input use intensity and
investment in land, are all lower for tenancy plots than for own land. The descriptive evidence
while informative, they are not casual and therefore have limited policy relevance. In order to test
whether the descriptive evidence also holds after the household fixed effects and plot level
characteristics are controlled for, we rely on more rigorous econometrics analysis to test our
hypotheses. We use the methods employed by Shaban (1987) to investigate the impact of tenancy
reform on productivity, input use intensity and long-term investment.
The equation to estimate the Marshallian inefficiency with the plot level production and
investment data is:
∑ ++++= ijrjiiki DXRY εδφβα (1)
Where Yi is the gross yield or revenue of the cultivated plot (or input usage on the plot or
investment variables), the variable Rik is a dummy to indicate whether land is under tenancy. D
measures the distance of the plot from the household dwelling. The identification strategy used
compares the crop yield or inputs use between the tenancy plots (barga plots) and owned plots
after controlling for the cultivator household fixed effect. We also control for the soil
characteristics using a number of indicators of soil quality.
4. Empirical Results
To determine whether the productivity and long-term investment of reform land is indeed lower
than that of land with full ownership as suggested in the descriptive analysis, we regress
production variables (yield, value and net value) and investment variables (whether certain type of
investment was made) of a plot on plot characteristics including area size, distance to homestead,
and a large number of variables on soil characteristics, and tenure status and we control for
household fixed effects.

16
Table 6 reports regression results for productivity when productivity is measured by the gross
revenue receipts from all crops on a given plot. We further divided productivity into annual
productivity (columns 1 and 2), productivity for the Rabi season (columns 3 and 4) and for Kharif
season (columns 5 and 6). For each type of productivity, we have two specifications; a base model
and an augmented model. In the base model, productivity is regressed on only two variables - the
tenancy dummy and plot size. In the augmented model, additional plot characteristics variables
such as irrigation status and distance to homestead and a large number of soil characteristics (such
as soil types, soil color, soil salinity, percolation and drainage) are also added to the explanatory
variables. The regression results are highly consistent with the descriptive findings as illustrated by
the fact that the coefficient on the tenancy dummy variable is negative and significant at 1% level
of significance for all columns. We find that the annual productivity based on the base model is 22
percentage points lower for the tenancy land than own land. Adding plot and soil characteristics
reduced the magnitude of productivity difference between own and tenancy land to 15 percentage
points. The significant productivity difference exists in both crop seasons. In Kharif season, the
seasonal productivity is eight percentage lower in tenancy land than own land. The difference in
Rabi seasons is even larger, 13.4 percentage points or 12.3 percentage points depending on the
model specifications.
In Table 7, we include regression using log of Net Value measured in Rupees. The net value was
reached after netting all input costs. Here we find that the net value of output again differs
substantially between the tenancy and owned plots, and the difference is as high 18% for aggregate,
8% for Kharif, and 13% for Rabi season, where all are statistically significant at 1%. In Table 8,
we limit the estimates to one main crop of rice. The estimates show the yield measured in Kgs and
value of rice. in rupees to be statistically different between tenancy land and own land with the
magnitude of difference between 6% and 7%.
The reason production differences arise partially from differences in application of inputs as
seen from the regression of inputs usage. The input cost is divided into a number of heads

17
depending upon the physical factors, and are used to estimate the input intensity on the tenancy
plots as compared to the owner cultivated plot. These regressions with inputs as dependent
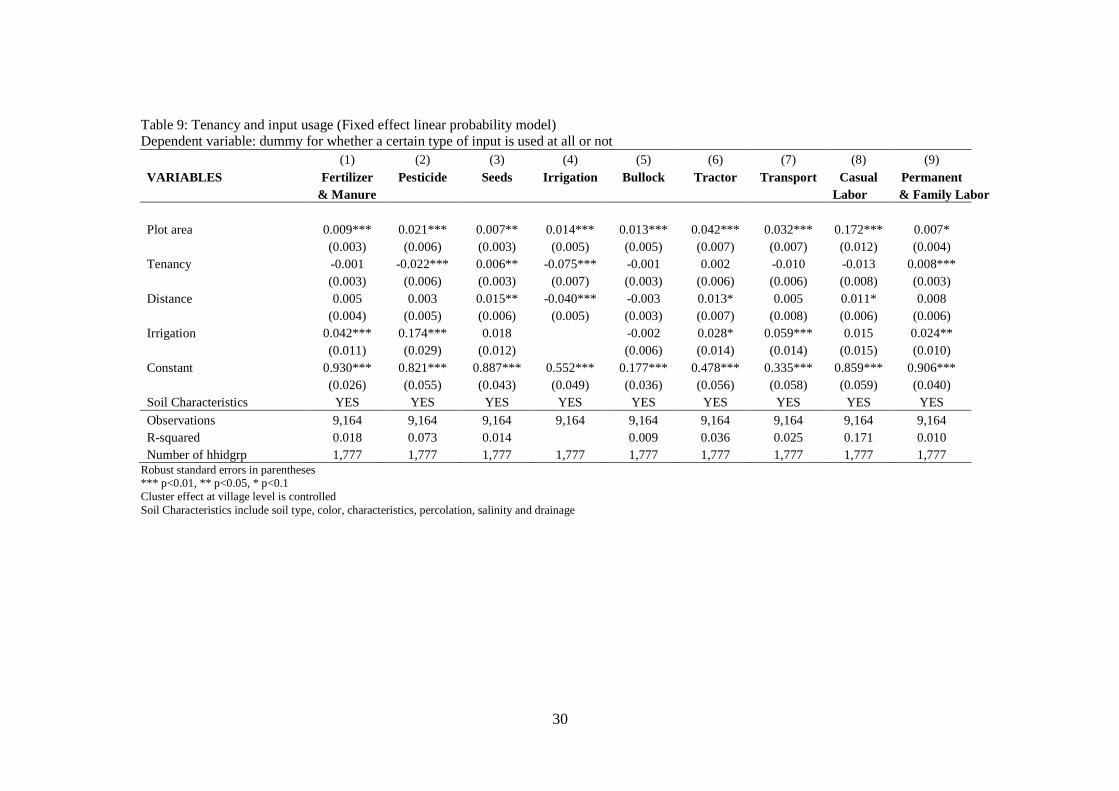
variables are shown in columns of Table 9 and 10. Table 9 is Linear Probability Model, capturing
the likelihood that a particular input will be used in cultivation on the plot. We find that inputs
like pesticide and irrigation are less likely to be used on the tenancy plots, even after controlling
for the cultivator household fixed effect. We find that the farming on tenancy plots reduces the
probability of pesticide use by 2.2% and that of irrigation by nearly 8%. We estimate the intensity
of usage of inputs in Table 10, and find tenancy status reduces the usage of inputs on average by
11% for fertilizer and manure, 3% for pesticides, 6% for seeds, and 9% for casual labor hired.
Given these results we find that if the plot is under tenancy, cultivator is likely to use fewer inputs,
and we also find that the productivity of these plots is less than those of owner occupied.
Finally, Table 11 reports the regression results on land investment. The regression results
show that larger plots or plots that are closer to homestead are more likely to receive land
investment, which is not surprising. The regression results are also highly consistent with the
descriptive findings, as illustrated by the negative and significant coefficients on tenancy land
dummy for all the regressions. The base model results suggest that compared to own land, barga
land is 6.5% less likely to receive private irrigation investment or even more strikingly 29% less
likely to receive land conservation or other types of land investment. The results also do not
change much as the model is augmented by a large set of soil type and soil physical characteristics.
5. Conclusion
A wide scale reform of cultivable land was legislated in India several decades ago. However,
these reforms still have implications for the households which are cultivating reform land. The
land under reform, which provides inheritable and permanent tenancy on these plots, is found to be
less productive than the land which is owner cultivated. This study found lower yield, less gross
value and less net value on the plots which are cultivated by a tenant compared to that on own

18
plots by the same tenant. These differences in productivity on the two types of plots, after
controlling for land quality and irrigation facilities, are found to be attributable to differences in
input usage and labor used on the two types of plot. The divergence between optimal use of inputs
and labor under when land is owner cultivated or cultivated by a tenant generating the loss of
productivity on this land. We also found that tenants have less incentive to make long-term land
investment on reform land than their own land. Therefore tenancy land is also associated with
long-term dynamic inefficiency, an important aspect that has been mostly neglected in previous
impact studies on India tenancy reform. Appropriate policy to address this loss of productivity on
reform land needs to be devised. These differences in productivity can be mitigated by making
changes in tenancy status which prevents sufficient use of labor, inputs and investment in the plots.

19
Reference:
Acemoglu, D., S. Johnson, and J. Robinson. 2004. "Institutions as the Fundamental Cause of Long-Run Growth." NBER Working Paper 10481. Cambridge, MA: National Bureau of Economic Research.
Aghion, P. and P. Bolton. 1997. "A Theory of Trickle-Down Growth and Development." Review of Economic Studies 64 (2): 151-72.
Appu, P. S. 1997. Land Reforms in India: A Survey of Policy, Legislation and Implementation. New Delhi: Vikas Publishing House.
Balisacan, A. M. and N. Fuwa. 2004. "Going beyond Crosscountry Averages: Growth, Inequality and Poverty Reduction in the Philippines." World Development 32 (11): 1891-907.
Bandiera, O. 2003. "Land Reform, the Market for Protection, and the Origins of the Sicilian Mafia: Theory and Evidence." Journal of Law, Economics, and Organization 19 (1): 218-44.
Banerjee, A. and L. Iyer. 2005. "History, Institutions, and Economic Performance: The Legacy of Colonial Land Tenure Systems in India." American Economic Review 95 (4): 1190-213.
Banerjee, A. V., P. J. Gertler and M. Ghatak. 2002. "Empowerment and Efficiency: Tenancy Reform in West Bengal." Journal of Political Economy 110 (2): 239-80.
Bardhan, P., S. Bowles and H. Gintis. 2000. "Wealth Inequality, Wealth Constraints and Economic Performance." In Atkinson, A. B. and F. Bourguignon, eds., Handbook of income distribution. Amsterdam: North-Holland.
Bardhan, P. and M. Ghatak. 1999. "Inequality, Market Imperfections, and Collective Action Problems." University of California, Berkeley, Center for International and Development Economics Research (CIDER) Working Paper: C99/108.
Bardhan, P. and D. Mookherjee. 2006. "Land Reform, Decentralized Governance, and Rural Development in West Bengal." . Stanford, CA: Paper prepared for the Stanford Center for International Development Conference on Challenges of Economic Policy Reform in Asia, May 31–June 3 2006.
Bardhan, P., and D. Mookherjee (2007) Land Reform and Farm Productivity in West Bengal. Stanford Center for International Development
Barraclough, S. L. 1970. "Agricultural Policy and Land Reform." Journal of Political Economy 78 (4): 906-47.
Barro, R. J. 2000. "Inequality and Growth in a Panel of Countries." Journal of Economic Growth 5 (1): 5-32.
Benjamin, D. 1995. "Can Unobserved Land Quality Explain the Inverse Productivity Relationship?" Journal of Development Economics 46 (1): 51-84.
Berry, R. A. and W. R. Cline. 1979. Agrarian Structure and Productivity in Developing Countries. Baltimore: Johns Hopkins University Press.
Besley, T. and R. Burgess. 2000. "Land Reform, Poverty Reduction, and Growth: Evidence from India." Quarterly Journal of Economics 115 (2): 389-430.
Besley, T., and R. Burgess. "Halving global poverty." Journal of Economic Perspectives 17, no. 3(2003): 3-22.
Binswanger, H. P., K. Deininger and G. Feder. 1995. "Power, Distortions, Revolt and Reform in Agricultural Land Relations." Handbook of development economics 3B 2659-772.
Bobrow-Strain, A. 2004. "(Dis)Accords: The Politics of Market-Assisted Land Reforms in Chiapas, Mexico." World Development 32 (6): 887-903.
Borras, S. M., Jr. 2005. "Can Redistributive Reform Be Achieved via Market-Based Voluntary Land Transfer Schemes? Evidence and Lessons from the Philippines." Journal of Development Studies 41 (1): 90-134.

20
Bourguignon, F. and T. Verdier. 2000. "Oligarchy, Democracy, Inequality and Growth." Journal of Development Economics 62 (2): 285-313.
Boyce, J. K., P. Rosset, and E. A. Stanton. 1998. "Land reform and sustainable development." Political Economy Research Institute Working Paper Series No 98. Amherst MA: University of Massachusetts, Amherst.
Bradstock, A. 2005. "Changing livelihoods and land reform: Evidence from the Northern Cape province of South Africa." World Development 33 (11): 1979-92.
Burgess, R. 2001. "Land and Welfare: Theory and Evidence from China." Working Paper. London: London School of Economics.
Cardenas, J. C. 2003. "Real Wealth and Experimental Cooperation: Experiments in the Field Lab." Journal of Development Economics 70 (2): 263-89.
Carter, M. R. 1984. "Identification of the inverse relationship between farm size and productivity: an empirical analysis of peasant agricultural production." Oxford Economic Papers 36 131-45.
Carter, M. R. and F. J. Zimmerman. 2000. "The Dynamic Cost and Persistence of Asset Inequality in an Agrarian Economy." Journal of Development Economics 63 (2): 265-302.
Chau, N. H. 1998. "Land Reforms in the Presence of Monitoring Costs and International Trade." Review of International Economics 6 (4): 564-79.
Conning, J. H. and J. A. Robinson. 2007. "Property rights and the political organization of agriculture." Journal of Development Economics 82 (2): 416-47.
de Janvry, A. 1981. "The Role of Land Reform in Economic Development: Policies and Politics." American Journal of Agricultural Economics 63 (2): 384-92.
de Janvry, A. and E. Sadoulet. 1989. "A Study in Resistance to Institutional Change: The Lost Game of Latin American Land Reform." World Development 17 (9): 1397-407.
Deininger, K. 2003. Land policies for growth and poverty reduction World Bank Policy Research Report series. Washington, D.C.: World Bank; Oxford and New York: Oxford University Press.
Deininger, K., H. Hoogeveen and B. H. Kinsey. 2004. "Economic Benefits and Costs of Land Redistribution in Zimbabwe in the Early 1980s." World Development 32 (10): 1697-709.
Deininger, K., S. Jin and H. K. Nagarajan. 2007. "Efficiency and equity impacts of rural land market restrictions: Evidence from India." European Economic Review, 52(5):892-918.
Deininger, K., S. Jin, and H. K. Nagarajan. "Land Reforms, Poverty Reduction, and Economic Growth: Evidence from India." Journal of Development Studies, 45(4): 496-521.
Deininger, K. and P. Olinto. 2001. "Redistribution, investment, and human capital accumulation: The case of the Philippines." . Washington, DC: World Bank.
Durlauf, S. N. 1996. "A Theory of Persistent Income Inequality." Journal of Economic Growth 1 (1): 75-93.
Eastwood, R., J. Kirsten and M. Lipton. 2006. "Premature deagriculturalisation? Land inequality and rural dependency in limpopo province, South Africa." Journal of Development Studies 42 (8): 1325-49.
Eckstein, S. D. and G. D. Horton. 1978. "Land Reform in Latin America: Bolivia, Chile, Mexico, Peru and Venezuela." World Bank Staff Working Paper 275.
Eswaran, M. and A. Kotwal. 1985. "A Theory of Contractual Structure in Agriculture." American Economic Review 75 (3): 352-67.
Feder, G. 1985. "The Relation between Farm Size and Farm Productivity: The Role of Family Labor, Supervision and Credit Constraints." Journal of Development Economics 18 (2-3): 297-313.
Galor, O. and J. Zeira. 1993. "Income Distribution and Macroeconomics." Review of Economic Studies 60 (1): 35-52.
21
Gersbach, H. and L. Siemers. 2005. "Land reforms and economic development." Discussion Paper 5184. London: Center for Economic Policy Research.
Ghatak, M., and S. Roy. "Land reform and agricultural productivity in India: a review of the evidence." Oxford Review of Economic Policy 23, no. 2(2007): 251-269.
Government of India. 2006a. "Ministry of Rural Development Annual Report 2006/07: Bharat Nirman through Rural Development." . New Delhi: Government Printer.
Government of India. 2006b. "Towards faster and more inclusive growth: An approach to the 11th five-year plan." . New Delhi: Planning Commission, Yojana Bhavan.
Gunning, J. W. and et al. 2000. "Revisiting Forever Gained: Income Dynamics in the Resettlement Areas of Zimbabwe, 1983-96." Journal of Development Studies 36 (6): 131-54.
Hanstad, T., T. Haque, and R. Nielson. "Improving Land Access for India's Rural Poor." Economic and Political Weekly, March 8, 2008.
Jarvis, L. S. 1989. "The Unraveling of Chile's Agrarian Reform, 1973-1986." In Thiesenhusen, W., eds., Searching for Agrarian Reform in Latin America. Boston: Unwin Hyman.
Jeon, Y. D. and Y. Y. Kim. 2000. "Land Reform, Income Redistribution, and Agricultural Production in Korea." Economic Development and Cultural Change 48 (2): 253-68.
Kaushik, A. 2005. "Nature of land market interventions in India." Institute for Sustainable Development Noida.
King, R. 1977. Land Reform: a World Survey. London: G.Bell and Sons.
Kinsey, B. H. and H. P. Binswanger. 1993. "Characteristics and Performance of Resettlement Programs: A Review." World Development 21 (9): 1477-94.
Lipton, M. 1993. "Land-Reform As Commenced Business - the Evidence Against Stopping." World Development 21 (4): 641-57.
Mearns, R. 1999. "Access to Land in Rural India." Policy Research Working Paper 2123. Washingon DC: World Bank.
Moog, R. S. 1997. Whose interests are supreme? Organizational politics in the civil courts in India. Ann Arbor, Michigan: Association for Asian Studies.
Nugent, J. B. and J. A. Robinson. 2002. "Are Endowments Fate?" CEPR Working Paper 3206. London.
Otsuka, K. 1991. "Determinants and Consequences of Land Reform Implementation in the Philippines." Journal of Development Economics 35 (2): 339-55.
Scott, J. C. 1976. The Moral Economy of the Peasant: Rebellion and Subsistence in Southeast Asia. New Haven, C.T.: Yale University Press.
Shaban, R.A 1987. “Testing competing models of sharecropping” Journal of Political Economy vol 95 (5):
Thangaraj, M. 2004. Land reforms in India. Volume 9. Tamil Nadu--An unfinished task New Delhi; Thousand Oaks, Calif. and London: Sage Publications.
Vollrath, D. 2007. "Land distribution and international agricultural productivity." American Journal of Agricultural Economics 89 (1): 202-16.
World Bank. 2005. "World Development Report 2006: Equity and Development." . Washington, DC: The World Bank and Oxford University Press. Yugandhar, B. N. 1996. Land reforms in India. Volume 3. Andhra Pradesh--People's pressure and administrative innovations New Delhi; Thousand Oaks, Calif. and London: Sage Publications.

22
Table 1: Global extent and characteristics of land reforms Country Area Beneficiary households Area per Implementation
Total area Share of arable Number Share of rural household Period (1000 hectares) Land (%) (thousands) Households (%) (hectares)
Africa Egypt 390 15.4 438 10.0 0.89 1952–78 Kenya 403 1.6 34 1.6 11.85 1961–70 Zimbabwe 2,371 11.9 40 3.1 59.28 1980–87 Asia Japan 2,000 33.3 4,300 60.9 0.47 1946–49 Korea, Rep. of 577 27.3 1,646 45.5 0.35 1948–58 Philippines 1,092 10.8 1,511 24.2 0.72 1940–85 Taiwan, China 235 26.9 383 62.5 0.61 1949–53 Central America El Salvador 401 27.9 95 16.8 4.22 1932–89 Mexico 13,375 13.5 3,044 67.5 4.39 1915–76 Nicaragua 3,186 47.1 172 56.7 18.52 1978–87 South America Bolivia 9,792 32.3 237 47.5 41.32 1953–70 Brasil 13,100 11.3 266 5.4 49.32 1964–94 Chile 9,517 60.1 58 12.7 164.09 1973 Peru 8,599 28.1 375 30.8 22.93 1969–79 Source: Deininger (2003).

23
Table 2: Shares of rural households and arable land area affected by different land reforms in Indian States Tenancy legislation Ceiling legislation State Area (%) Pop. (%) No. of laws Average age Area (%) Pop. (%) Andhra Pradesh 3.48 0.75 2 17.0 8.34 3.81 Bihar 0.00 0.00 3 18.3 4.42 4.00 Gujarat 15.00 11.20 2 15.5 1.95 0.31 Haryana 0.51 0.01 0 0 1.26 0.26 Himachal Pradesh 0.16 3.19 n.a. n.a. 0.06 0.05 Karnataka 15.38 5.29 2 14.5 1.71 0.30 Kerala 8.47 12.49 4 10.8 1.30 1.04 Madhya Pradesh 2.15 0.61 1 24.0 2.69 0.71 Maharashtra 27.01 10.68 1 23.0 7.74 1.08 Orissa 0.15 1.43 3 9.0 2.24 1.28 Punjab 1.89 0.04 1 10.0 1.50 0.25 Rajasthan 0.00 0.16 0 0 6.63 0.75 Tamil Nadu 3.65 3.23 5 13.6 2.47 1.24 Uttar Pradesh 0.00 0.00 2 14.5 5.81 3.68 West Bengal 6.41 10.80 5 8.2 14.91 19.73 Total 5.45 5.35 2.1 13.03 4.41 2.27
Source: Kaushik (2005) for columns 1 to 4; Besley and Burgess (2000) for columns (5) and (6)

24
Table 3: Reform Beneficiary Statistics (1978)
Total Barga Patta Lose land Not
affected
Beneficiari
es Beneficiari
es household characteristics in 78 Household size 6.21 6.49 5.84 7.35 6.19 Land endowment in 78 (inc'dg patta) 2.54 1.92 1.31 6.90 2.55 landless in 78 (exc'dg patta land) 0.57 0.55 0.75 0.10 0.57 SC/ST 0.45 0.56 0.73 0.17 0.43 78 head literate 0.25 0.22 0.14 0.68 0.25 Head's occup: Ag wage 0.36 0.30 0.54 0.04 0.36 Farming 0.40 0.61 0.33 0.60 0.38 Non-farm wage 0.12 0.05 0.07 0.04 0.13 Self-employment 0.12 0.04 0.06 0.31 0.12 Non-land assets in 78 Bad roof (thatch/plastic/mud) 0.72 0.83 0.90 0.55 0.70 Bad wall (mud/bamboo) 0.70 0.85 0.78 0.59 0.69

25
Table 4: Plot level production statistics (current)
ALL OWNER PLOTS TENANCY PLOTS
PLOT CHARACTERISTICS
Own land (%) 0.60 1.00 0.00
Tenancy land (%) 0.40 0.00 1.00
Plot Area (acre) 0.40 0.36 0.46
Irrigation (%) 0.79 0.83 0.74
CROP VALUE (in Rupees)
Rabi 8562.59 9965.52 6493.54
Kharif 8846.03 8872.75 8806.64
Total 19844.49 22059.35 16578.01
YIELD - RICE (in Kilograms)
Rabi 606.51 644.66 550.25
Kharif 1278.46 1273.02 1286.49
Total 1892.45 1925.10 1844.30
INPUTS (In Rupees)
Seeds 1256.54 1428.47 1002.97
Fertilizer 1939.87 2195.05 1563.52
Pesticide 605.34 666.13 515.69
Bullock 119.47 126.17 109.60
Tractor 643.72 700.76 559.60
Irrigation 990.62 1106.71 819.41
Transport 247.65 260.10 229.29
Other inputs 53.93 70.32 29.74 Plots: n=9283

26
Table 5: Land investments by land tenure status : Plot level evidence ALL OWN BARGA
Private Irrigation Access
Share of plots with private irrigation 0.485 0.534 0.446
Share of plots with pond irrigation 0.085 0.104 0.062
Share of plots with bore well irrigation 0.400 0.432 0.379 Construction & Maintenance of Private Irrigation Asset
Total cash cost (Rs.) 5511 6322 4762
Number of hired labor (Days) 3.08 3.76 2.32
Number of family labor (Days) 0.48 0.64 0.27
Number of exchange labor (Days) 0.05 0.05 0.07
Total cash spent during 8 years(Rs.) 116.95 164.45 57.93 Total labor days contributed during last 8 years (days) 0.33 0.46 0.16
Land, Soil, and Water Conservation Share of plots with land/soil/water conservation in the past 8 years 0.293 0.401 0.135 Total amount of cash spent during last 8years (Rs.) 145.94 215.91 51.37 Share of households using any family labor during past 8 years 0.236 0.325 0.107
Total family labor used (days) 519 740 207
Number of observation 8913 5223 3300

27
Table 6: Tenancy and productivity Dependent variable: Gross revenue of crop production on per unit of land (Rs./acre)
(1) (2) (3) (4) (5) (6)
VARIABLES Value Value Kharif Value
Kharif Value
Rabi Value
Rabi Value
Plot area -0.010 -0.011 -0.008 -0.004 -0.031 -0.024
(0.014) (0.012) (0.007) (0.007) (0.022) (0.019) Tenancy -0.217*** -0.148*** -0.079*** -0.079*** -0.134*** -0.123***
(0.026) (0.020) (0.009) (0.009) (0.025) (0.024) Distance -0.067*** -0.004 -0.015
(0.017) (0.004) (0.019) Irrigation 0.650*** -0.003 0.112
(0.040) (0.015) (0.134) Constant 9.721*** 9.807*** 9.152*** 9.167*** 9.534*** 9.321***
(0.024) (0.132) (0.011) (0.049) (0.033) (0.242) Soil Characteristics NO YES NO YES NO YES Observations 9,116 9,009 8,329 8,237 4,666 4,607 R-squared 0.051 0.231 0.026 0.028 0.025 0.040 Number of hhidgrp 1,772 1,772 1,649 1,649 1,223 1,217
Robust standard errors in parentheses *** p<0.01, ** p<0.05, * p<0.1 Cluster effect at village level is controlled Soil Characteristics include soil type, color, characteristics, percolation, salinity and drainage

28
Table 7: Tenancy and productivity (Fixed effect model) Dependent variable: Net value of crop production on per unit of land (Rs/acre)
(1) (2) (3) (4) (5) (6) VARIABLES Net Value Net Value Net Value Net Value Net Value Net Value
Kharif Kharif Rabi Rabi Plot area 0.057* 0.061** 0.024*** 0.025*** 0.012 0.027
(0.029) (0.028) (0.008) (0.008) (0.029) (0.026) Tenancy -0.249*** -0.187*** -0.088*** -0.087*** -0.137*** -0.123***
(0.039) (0.036) (0.008) (0.009) (0.029) (0.027) Distance -0.073*** 0.001 -0.039
(0.021) (0.008) (0.024) Irrigation 0.469*** 0.009 -0.097
(0.071) (0.015) (0.179) Constant 9.341*** 9.429*** 8.923*** 8.915*** 9.037*** 9.229***
(0.047) (0.198) (0.012) (0.061) (0.044) (0.278) Soil Characteristics NO YES NO YES NO YES
Observations 9,116 9,009 8,258 8,166 4,436 4,381 R-squared 0.014 0.044 0.024 0.028 0.012 0.026 Number of hhidgrp 1,772 1,772 1,643 1,643 1,193 1,187
Robust standard errors in parentheses *** p<0.01, ** p<0.05, * p<0.1 Cluster effect at village level is controlled Soil Characteristics include soil type, color, characteristics, percolation, salinity and drainage

29
Table 8: Tenancy and rice yield (Fixed effect model) Dependent variable: rice yield (kg/acre) (1) (2) (3) (4) VARIABLES Yield Yield Value Value
(Rice) (Rice) (Rice) (Rice) Plot Area -0.011 -0.009 -0.013* -0.011
(0.007) (0.008) (0.008) (0.008) Distance -0.003 -0.002 -0.000 0.001
(0.004) (0.004) (0.004) (0.004) Tenancy -0.066*** -0.066*** -0.071*** -0.071***
(0.009) (0.009) (0.010) (0.010) Rabi 0.298*** 0.300*** 0.309*** 0.309***
(0.049) (0.049) (0.050) (0.052) Pre Kharif 0.079* 0.081* -0.038 -0.037
(0.045) (0.045) (0.057) (0.058) Constant 7.231*** 7.218*** 9.136*** 9.098***
(0.036) (0.044) (0.036) (0.048) Soil Characteristics NO YES NO YES
Observations 11,128 11,071 11,075 11,021 R-squared 0.174 0.176 0.156 0.157 Number of hhidgrp 1,763 1,763 1,755 1,755
Robust standard errors in parentheses *** p<0.01, ** p<0.05, * p<0.1 Cluster effect at village level is controlled Soil Characteristics include soil type, color, characteristics, percolation, salinity and drainage
30
Table 9: Tenancy and input usage (Fixed effect linear probability model) Dependent variable: dummy for whether a certain type of input is used at all or not (1) (2) (3) (4) (5) (6) (7) (8) (9) VARIABLES Fertilizer Pesticide Seeds Irrigation Bullock Tractor Transport Casual Permanent
& Manure Labor & Family Labor Plot area 0.009*** 0.021*** 0.007** 0.014*** 0.013*** 0.042*** 0.032*** 0.172*** 0.007*
(0.003) (0.006) (0.003) (0.005) (0.005) (0.007) (0.007) (0.012) (0.004) Tenancy -0.001 -0.022*** 0.006** -0.075*** -0.001 0.002 -0.010 -0.013 0.008***
(0.003) (0.006) (0.003) (0.007) (0.003) (0.006) (0.006) (0.008) (0.003) Distance 0.005 0.003 0.015** -0.040*** -0.003 0.013* 0.005 0.011* 0.008
(0.004) (0.005) (0.006) (0.005) (0.003) (0.007) (0.008) (0.006) (0.006) Irrigation 0.042*** 0.174*** 0.018 -0.002 0.028* 0.059*** 0.015 0.024**
(0.011) (0.029) (0.012) (0.006) (0.014) (0.014) (0.015) (0.010) Constant 0.930*** 0.821*** 0.887*** 0.552*** 0.177*** 0.478*** 0.335*** 0.859*** 0.906***
(0.026) (0.055) (0.043) (0.049) (0.036) (0.056) (0.058) (0.059) (0.040) Soil Characteristics YES YES YES YES YES YES YES YES YES
Observations 9,164 9,164 9,164 9,164 9,164 9,164 9,164 9,164 9,164 R-squared 0.018 0.073 0.014 0.009 0.036 0.025 0.171 0.010 Number of hhidgrp 1,777 1,777 1,777 1,777 1,777 1,777 1,777 1,777 1,777
Robust standard errors in parentheses *** p<0.01, ** p<0.05, * p<0.1 Cluster effect at village level is controlled Soil Characteristics include soil type, color, characteristics, percolation, salinity and drainage

31
Table 10: Tenancy and input use intensity (Fixed effect model) Dependent variable: input use intensity (Rupees per acre) (1) (2) (3) (4) (5) (6) (7) (8) (9) VARIABLES Fertilizer Pesticide Seeds Irrigation Bullock Tractor Transport Casual Permanent
& Manure Labor & Family Labor Plot area -0.160*** -0.176*** -0.130*** -0.087*** -0.038** -0.094*** -0.103*** 0.361*** -0.337***
(0.026) (0.024) (0.026) (0.018) (0.015) (0.024) (0.023) (0.050) (0.024) Tenancy -0.114*** -0.038* -0.062** -0.020 0.002 0.010 0.020* -0.088** -0.019
(0.024) (0.021) (0.028) (0.014) (0.010) (0.013) (0.012) (0.039) (0.017) Distance -0.034** -0.035** -0.025* 0.006 0.008 0.004 0.021** 0.012 -0.011
(0.017) (0.014) (0.015) (0.014) (0.005) (0.011) (0.010) (0.019) (0.014) Irrigation 0.764*** 0.529*** 0.734*** 0.023 0.169*** 0.091*** 0.356*** 0.453***
(0.046) (0.043) (0.061) (0.018) (0.026) (0.029) (0.058) (0.038) Constant 6.967*** 5.880*** 6.395*** 7.144*** 6.074*** 6.350*** 5.628*** 11.041*** 10.438***
(0.169) (0.146) (0.171) (0.100) (0.135) (0.124) (0.107) (0.223) (0.137) Soil Characteristics YES YES YES YES YES YES YES YES YES Observations 9,164 9,164 9,164 9,164 9,164 9,164 9,164 9,164 9,164 R-squared 0.756 0.872 0.639 0.962 0.920 0.923 0.918 0.881 0.890 Number of hhidgrp 1,777 1,777 1,777 1,777 1,777 1,777 1,777 1,777 1,777
Robust standard errors in parentheses *** p<0.01, ** p<0.05, * p<0.1 Cluster effect at village level is controlled Soil Characteristics include soil type, color, characteristics, percolation, salinity and drainage

32
Table 11: Tenancy and land investments (Fixed effect linear probability model) Dependent variable: dummy variable for whether investment is made or not
Private Irri. Bore well Conserva
-tion Private Irri. Bore well Conserva
-tion Barga Land
-0.065 (8.63)***
-0.038 (6.13)***
-0.289 (37.46)***
-0.066 (8.76)***
-0.039 (6.25)***
-0.288 (37.30)***
Log of land area
0.03 (5.12)***
0.017 (3.53)***
0.045 (7.52)***
0.03 (5.17)***
0.019 (3.87)***
0.045 (7.45)***
Log of distance to homestead
-0.062 (11.56)***
-0.002 (0.38)
-0.004 (0.74)
-0.058 (10.89)***
-0.002 (0.38)
-0.005 (0.85)
Soil characteristics Yes Yes Yes
Observations 8329 8270 8329 8329 8329 8329 Number of households 1624 1623 1624 1624 1624 1624 R-squared 0.03 0.01 0.18 0.04 0.02 0.18
Robust standard errors in parentheses *** p<0.01, ** p<0.05, * p<0.1 Cluster effect at village level is controlled Soil Characteristics include soil type, color, characteristics, percolation, salinity and drainage