complex explosive volcanic activity on the moon within
TRANSCRIPT

Icarus 273 (2016) 296–314
Contents lists available at ScienceDirect
Icarus
journal homepage: www.elsevier.com/locate/icarus
Complex explosive volcanic activity on the Moon within Oppenheimer
crater
Kristen A. Bennett a , ∗, Briony H.N. Horgan
b , Lisa R. Gaddis c , Benjamin T. Greenhagen
d , Carlton C. Allen
e , Paul O. Hayne
f , James F. Bell III a , David A. Paige
g
a School of Earth and Space Exploration, Arizona State University. ISTB4 Room 795, 781 Terrace Mall, Tempe AZ 85287, United States b Department of Earth, Atmospheric, and Planetary Sciences, Purdue University, 550 Stadium Mall Drive, West Lafayette, IN 47907, United States c Astrogeology Science Center, U.S. Geological Survey, 2255 N. Gemini Drive, Flagstaff, AZ 86001, United States d Johns Hopkins University Applied Physics Laboratory, 11100 Johns Hopkins Rd, Laurel, MD 20723, United States e NASA Johnson Space Center, Emeritus, 2101 NASA Road 1, Houston, TX 77058, United States f NASA Jet Propulsion Laboratory, 4800 Oak Grove Dr, Pasadena, CA 91109, United States g Department of Earth, Planetary, and Space Sciences, University of California, Los Angeles, 595 Charles E Young Dr E, Los Angeles, CA 90095, United States
a r t i c l e i n f o
Article history:
Received 27 July 2015
Revised 10 December 2015
Accepted 3 February 2016
Available online 10 February 2016
Keywords:
Volcanism
Spectroscopy
Infrared observations
Mineralogy
Moon
Moon, surface
a b s t r a c t
Oppenheimer crater is a floor-fractured crater located within the South Pole–Aitken basin on the Moon,
and exhibits more than a dozen localized pyroclastic deposits associated with the fractures. Localized
pyroclastic volcanism on the Moon is thought to form as a result of intermittently explosive Vulcanian
eruptions under low effusion rates, in contrast to the higher-effusion rate, Hawaiian-style fire fountaining
inferred to form larger regional deposits. We use Lunar Reconnaissance Orbiter Camera images and Di-
viner Radiometer mid-infrared data, Chandrayaan-1 orbiter Moon Mineralogy Mapper near-infrared spec-
tra, and Clementine orbiter Ultraviolet/visible camera images to test the hypothesis that the pyroclastic
deposits in Oppenheimer crater were emplaced via Vulcanian activity by constraining their composition
and mineralogy. Mineralogically, we find that the deposits are variable mixtures of orthopyroxene and
minor clinopyroxene sourced from the crater floor, juvenile clinopyroxene, and juvenile iron-rich glass,
and that the mineralogy of the pyroclastics varies both across the Oppenheimer deposits as a whole
and within individual deposits. We observe similar variability in the inferred iron content of pyroclastic
glasses, and note in particular that the northwest deposit, associated with Oppenheimer U crater, con-
tains the most iron-rich volcanic glass thus far identified on the Moon, which could be a useful future
resource. We propose that this variability in mineralogy indicates variability in eruption style, and that it
cannot be explained by a simple Vulcanian eruption. A Vulcanian eruption should cause significant coun-
try rock to be incorporated into the pyroclastic deposit; however, large areas within many of the deposits
exhibit spectra consistent with high abundances of juvenile phases and very little floor material. Thus,
we propose that at least the most recent portion of these deposits must have erupted via a Strombolian
or more continuous fire fountaining eruption, and in some cases may have included an effusive compo-
nent. These results suggest that localized lunar pyroclastic deposits may have a more complex origin and
mode of emplacement than previously thought.
© 2016 Elsevier Inc. All rights reserved.
r
a
n
p
c
(
1. Introduction
Over 100 pyroclastic or “dark mantling” deposits have thus far
been identified on the Moon ( Gaddis et al., 1985, 2003; Hawke
et al., 1989; Carter et al., 2009; Gustafson et al. , 2012; Campbell
et al., 2014 ). These deposits are characterized by their low albedo
and are believed to be products of explosive volcanic eruptions.
∗ Corresponding author. Tel.: +1 8052168887.
E-mail address: [email protected] (K.A. Bennett).
r
t
o
t
http://dx.doi.org/10.1016/j.icarus.2016.02.007
0019-1035/© 2016 Elsevier Inc. All rights reserved.
Pyroclastic deposits are high priority targets for future explo-
ation because of both their scientific value and their potential
s a resource. Lunar pyroclastic materials are thought to origi-
ate from deep within the Moon. Therefore their primitive com-
osition may help to constrain the composition and geophysi-
al evolution of the lunar magma ocean and the lunar mantle
Delano, 1986; Shearer and Papike, 1993 ). Pyroclastic glass beads
eturned as Apollo samples have surface coatings that indicate
hat they formed in volatile-rich eruptions, and recent reanalysis
f the Apollo 17 glass beads revealed melt inclusions with wa-
er content as high as the Earth’s mantle ( Hauri et al., 2011 ). The

K.A. Bennett et al. / Icarus 273 (2016) 296–314 297
a
c
M
f
d
i
e
c
B
p
s
(
(
i
p
i
o
e
e
n
g
2
t
c
t
e
t
i
c
s
m
i
t
s
l
r
a
G
c
H
o
F
b
t
t
e
o
i
2
n
w
l
l
e
1
l
a
G
t
b
c
o
c
t
Fig. 1. LRO Lunar Orbiter Laser Altimeter lunar far-side topographic data ( Smith
et al., 2010 ) showing the global context of Oppenheimer crater (black star). Oppen-
heimer is located within the South Pole–Aitken basin.
f
G
a
g
h
d
n
c
T
i
r
p
s
t
n
o
f
w
t
i
t
t
2
a
p
2
c
d
a
d
bundance and source of these volatiles may have major impli-
ations for the interior structure, composition, and origin of the
oon ( Hauri et al., 2015 ). Pyroclastic deposits are also likely targets
or future in situ resource extraction, due to both their high abun-
ances of metal oxides that could be processed to yield oxygen
n higher abundances than any other known lunar material ( Allen
t al., 1996 ), and their thickness and uniform grain size, which
ould facilitate rapid extraction of 3 He ( Hawke et al., 1990 ). Indeed,
urns et al. (2013) proposed a landing site near the Schrodinger
yroclastic deposit as a potential location for a future lunar mis-
ion.
Lunar pyroclastic deposits are generally divided into localized
< 10 0 0 km
2 in area) and regional ( > 10 0 0 km
2 in area) deposits
e.g., Gaddis et al., 2003 ). The localized deposits that have been
nvestigated previously using Earth-based telescopic spectra ap-
ear to contain minerals likely to originate from different sources,
ncluding juvenile magmatic minerals (typically clinopyroxenes,
livine and/or quenched glass) and local country-rock (orthopyrox-
nes from lunar highlands or clinopyroxenes from mare; Hawke
t al., 1989 ) or mixtures of these. However, the juvenile compo-
ent of localized deposits is poorly constrained, as both olivine and
lass could account for the spectral shapes observed ( Gaddis et al.,
0 0 0 ). Strombolian activity is not energetic enough to strip coun-
ry rock from the vent walls to produce deposits with non-juvenile
omponents. Fire fountaining could erode the vent wall enough
o incorporate non-juvenile material, but this implies such high
ruption rates that the ejected pyroclasts would be hot enough
hat they would coalesce to form lava flows instead of form-
ng pyroclastic deposits ( Head and Wilson, 1979 ). Therefore, lo-
alized deposits are primarily thought to result from Vulcanian-
tyle periodic eruptions. Vulcanian eruptions occur when intruding
agma near the surface solidifies and creates a plug. The magma
n the conduit is trapped below this plug; as gas exsolves from
he magma, pressure builds up under the plug. Once the pres-
ure overcomes the strength of the plug the magma explodes vio-
ently, ejecting juvenile magmatic material and up to 50% country
ock ( e.g., Head and Wilson, 1979 ). Vulcanian-style eruptions imply
relatively low mass eruption rate ( e.g., Head and Wilson, 1979;
addis et al., 20 0 0 ), as would be the case for extrusion through
rustal weak points from sills and dikes ( Head and Wilson, 1979;
ead et al., 20 0 0 ). This scenario is supported by the association
f small deposits with floor-fractured craters ( e.g. , Schultz, 1976 ).
loor-fractured craters are thought to occur when a sill intrudes
eneath a crater and the increased pressure causes the crater floor
o uplift and fracture. The magma in the sill can then slowly travel
hrough these fractures and reach the surface with a low mass
ruption rate ( Head and Wilson, 1979; Jozwiak et al., 2015 ). Dozens
f previously unrecognized localized pyroclastic deposits have been
dentified in the past decade using Clementine data ( Gaddis et al.,
003 ), LROC visible images ( Gustafson et al., 2012 ), and radar sig-
atures ( Carter et al., 2009; Campbell et al., 2014 ), resulting in
hat is now a global population of more than 100 hypothesized
ocal and regional pyroclastic deposits.
Regional pyroclastic deposits are thought to result from either
ow mass eruption rate Strombolian eruptions (coalesced bubble
xplosions) or high mass eruption rate fire fountains ( Heiken et al.,
974; Wilson and Head, 1981 ). The regional deposits may be re-
ated to mare volcanism, as they are often associated with rilles
nd vent-like irregular depressions on mare margins ( Head, 1974;
addis et al., 1985 ). Regional deposits consist of more juvenile ma-
erial than would be expected in Vulcanian deposits, and contain
oth glass and partially crystalline beads ( Gaddis et al., 1985 ). Vol-
anic glass is formed when erupted magma droplets occur in an
ptically thin part of a fountain and are quickly quenched, while
rystalline beads are deposited when the droplets are in an op-
ically thick part of the fountain and have time to crystallize be-
ore they cool ( Arndt et al., 1984; Arndt and von Engelhardt, 1987 ).
lass and crystalline beads in a single eruption have been observed
t Apollo 17 ( i.e. , the Taurus–Littrow landing site) to have the same
eochemical composition ( Pieters et al., 1974 ), but this relationship
as not been documented in detail for other regional pyroclastic
eposits.
Gaddis et al. (2013) identified at least 8 previously unrecog-
ized sites of pyroclastic eruption in the floor of Oppenheimer
rater using recently available high-resolution remote sensing data.
his discovery increases the number of recognized volcanic vents
n Oppenheimer crater to 15 and highlights the importance of py-
oclastic volcanism in this and other floor-fractured craters. The
resence of at least 15 pyroclastic deposits with a wide variety of
izes and morphologies within a single crater enables us to charac-
erize the composition and occurrence of these deposits at a level
ot previously possible. In particular, we can assess the influence
f local and regional factors such as crustal thickness, subsurface
ractures, and crater rays on these volcanic deposits. In this study,
e characterize the composition and morphology of the pyroclas-
ic deposits within Oppenheimer crater using near- and thermal-
nfrared data and visible images from lunar orbiters to constrain
he likely eruption style, mode of occurrence, and resource poten-
ial of each deposit.
. Background
Oppenheimer crater is a floor-fractured crater located at 35 °Snd 166 °W ( Fig. 1 ) within the South Pole–Aitken basin (SPA). Op-
enheimer is Pre-Nectarian ( Hiesinger et al., 2012 ) and roughly
00 km in diameter. Fig. 1 shows the location of Oppenheimer
rater and Fig. 3 a shows the distribution of the largest pyroclastic
eposits within the crater. The Oppenheimer pyroclastic deposits
re associated with vents along fractures in the crater floor. The
eposits range in size from 1500 km
2 (northwest deposit) to a few

298 K.A. Bennett et al. / Icarus 273 (2016) 296–314
d
i
g
e
c
n
t
t
t
a
3
o
d
t
F
s
V
o
square kilometers ( Gaddis et al., 2003, 2013 ). Most deposits are in-
formally named here for their compass locations within the crater
( e.g., Oppenheimer south, Oppenheimer north, etc. ). Although two
of the deposits occur within formally named craters (Oppenheimer
U and Oppenheimer H, respectively) on the floor of Oppenheimer,
we will refer to these deposits by their compass locations (north-
west and southeast) for consistency of naming with other deposits.
Compositional studies using Clementine UVVIS data at Oppen-
heimer crater showed little diversity between the pyroclastic de-
posits, suggesting that they had the same magmatic source, with a
composition dominated by mafic minerals ( e.g. , pyroxene) in frag-
mented basalts and very little, if any, volcanic glass ( Petro et al.,
2001 ). One eastern floor deposit showed a composition consis-
tent with lunar highlands material, but this was interpreted to be
due to relatively high-albedo impact ejecta lying over the eastern
half of the crater. More recent work by Jawin et al. (2015) using
Moon Mineralogy Mapper near-infrared spectra showed that sev-
eral of the pyroclastic deposits within Oppenheimer exhibit signa-
tures consistent with volcanic glass.
Although previous studies support an origin by Vulcanian erup-
tion for all deposits in Oppenheimer ( Head et al., 20 0 0 ), the Op-
penheimer northwest deposit (within and adjacent to the interior
floor-fractured crater Oppenheimer U) could be large enough to
be considered a regional deposit ( Gaddis et al., 2003 ) and thus
may have formed by the fire fountaining or Strombolian eruption
style associated with regional deposits. Therefore, in this study
we explore the possibility that the Oppenheimer northwest de-
posit formed via a different eruptive mechanism (fire fountain-
ing/Strombolian), or that this deposit may be unique in that it is
a large deposit with a Vulcanian origin ( Gaddis et al., 2003 ).
We also note that the original effort s to classify lunar pyroclas-
tic deposits selected arbitrary areas (2500 km
2 , Gaddis et al., 20 0 0 ;
10 0 0 km
2 , Gaddis et al., 2003 ) as the cutoff between regional and
localized deposits. Oppenheimer northwest (1500 km
2 ) is only a
few hundred square kilometers above the 10 0 0 km
2 cutoff, and
Oppenheimer south (674 km
2 ) is only a few hundred square kilo-
meters below this cutoff ( Gaddis et al., 2003 ). Although modeling
studies on several deposits show that the size of a deposit gener-
ally correlates with its eruption mechanism ( Gaddis et al., 2003 ), in
this study we will not assume a particular eruption mechanism for
a deposit solely based on its size, since several deposits are similar
in size to the arbitrary cutoff.
Our analysis focuses on the compositions of the pyroclastic de-
posits as a way to distinguish between a fire fountaining or Strom-
bolian vs . Vulcanian eruption style; fire fountaining and Strombo-
lian activity should generally produce a deposit with more juve-
nile material and a more glass-rich composition. In this study, we
test the prediction of compositional heterogeneity between the de-
posits using a variety of data. In contrast to previous studies, we
utilize new spectral analysis methods that allow us to assess and
map the relative glass content in these deposits. We use thermal-
and near-infrared data in tandem, which yields more insight than
separate analyses. Thermal infrared data are useful for deriving
thermophysical properties and constraining the silicate composi-
tion of a material ( Vasavada et al., 2012; Greenhagen et al., 2010 ).
The thermal inertia yields information about the physical charac-
teristics of a material; higher thermal inertia indicates blocky ma-
terial while lower thermal inertia indicates finer grained particles.
The Christensen Feature (CF) value, the emissivity maximum near
8 μm, constrains whether a material is dominantly composed of
olivine, pyroxene or plagioclase, the major minerals on the lunar
surface. However, the CF value cannot determine whether a ma-
terial is crystalline or glassy. Also, CF values can be non-unique
– for example, a material that is primarily pyroxene would have
the same CF value as a material that is a mixture of olivine and
plagioclase. Near infrared spectra are thus also used for improved
etectability of several iron-bearing minerals (one cannot use near
nfrared spectra to easily detect an iron-poor mineral such as pla-
ioclase). Near infrared spectra are also used to detect glass, which
xhibits iron absorption bands at different wavelengths than more
rystalline minerals ( Section 4.2 ). Therefore, in this study we use
ear infrared data to help determine whether or not a pyroclas-
ic deposit is glassy, and use thermal infrared data to constrain
he composition of the glass. However, it is important to note that
hese infrared datasets only yield information on the composition
nd mineralogy of the surface of each deposit.
. Eruption style and resulting deposits
Our aim in this study is to use the composition and mineralogy
f the pyroclastic deposits to constrain the eruption style that pro-
uced the deposits (Vulcanian vs . Strombolian/fire fountaining) and
hus to reconstruct the volcanic history of Oppenheimer crater. In
ig. 2 , we illustrate several different types of eruptions and the re-
ulting deposits. We discuss a single Vulcanian eruption, multiple
ulcanian eruptions, a Vulcanian eruption followed by a continu-
us Hawaiian-style eruption, and a single continuous eruption.
(1) Single Vulcanian eruption: Previous models suggest that de-
posits from Vulcanian eruptions should consist of both crys-
talline material that has a similar composition as the sur-
rounding terrain and glassy or crystalline juvenile mate-
rial ( Head and Wilson, 1979 ). However, in considering the
mechanics of a Vulcanian eruption, we hypothesize that it
is necessary to invoke the concept of superposition and
that the deposits may exhibit some stratification. In partic-
ular, the country rock and crystalline juvenile material that
formed the initial plug should be located at the base of the
pyroclastic deposit as it was the first material to be ejected.
Due to break up of the solid plug, this initial deposit should
be blocky at LROC resolution. Above this would be crys-
talline to glassy juvenile material that was ejected after the
plug exploded. However, due to the rapid decrease in pres-
sure once the overlying cap fails, an extended eruption of
juvenile material is not expected in a purely Vulcanian erup-
tion ( Head and Wilson, 1979 ). Thus, we expect that the fine-
grained overlying juvenile material should be a thin deposit,
and that the blocky underlying crystalline juvenile material
and country rock should be visible. At the resolution of our
spectral datasets, this scenario would manifest as a mixture
of country rock and juvenile material.
(2) Multiple Vulcanian eruptions: It is also possible that some
vents experienced multiple cycles of Vulcanian activity. In
this scenario, after the initial Vulcanian eruption, magma
that was still slowly rising once again cooled to form a
plug and increased the pressure in the conduit. The explo-
sion caused by the overpressure in the conduit would create
a deposit that is indistinguishable from a single Vulcanian
eruption.
(3) Vulcanian eruption followed by a continuous eruption : If the
initial Vulcanian eruption cleared the plug and the magma
begins rising more rapidly, a continuous Hawaiian-style
eruption could then take place. This would result in a layer
of glass-rich juvenile material above the blocky Vulcanian
deposit. Depending on how long this continuous eruption
persists, the smooth glassy layer could completely obscure
the underlying blocky material. The resulting deposit would
either appear as glass-rich or glass-rich with some crys-
talline plug material and country rock.
(4) Immediate continuous eruption: In this scenario, there is no
Vulcanian eruption. If magma reaches the surface at as-
cent rates higher than those expected to create Vulcanian

K.A. Bennett et al. / Icarus 273 (2016) 296–314 299
Fig. 2. Illustration of possible eruption styles and their resulting deposits.
300 K.A. Bennett et al. / Icarus 273 (2016) 296–314
t
f
n
F
(
t
t
m
t
m
d
t
l
c
t
F
o
H
t
u
l
p
a
p
r
l
r
l
4
c
p
m
w
p
2
B
t
a
t
(
t
f
a
a
d
t
t
n
i
t
p
v
1
g
o
l
t
t
p
eruptions, possibly emerging through fractures in the crater
floor, a plug does not form and Hawaiian-style fire fountain-
ing commences. The resulting deposit would be glass-rich
and could form a small cone around the vent. This deposit
is thus indistinguishable from a long-lived continuous erup-
tion that started with a Vulcanian eruption but completely
obscures the initial blocky deposit (scenario 3 above).
In Fig. 2 we illustrate that continuous fire fountaining would oc-
cur if a plug does not form in the conduit. However, it is also possi-
ble that Strombolian activity could occur if the mass eruption rate
is low enough. The resulting deposit from a Strombolian eruption
would be glass-rich and therefore indistinguishable from fire foun-
taining deposits in this study. Modeling efforts outside the scope of
this study would be necessary to distinguish between Strombolian
and fire fountaining activity.
4. Methods
In this study we use a variety of remote sensing datasets to
study the Oppenheimer crater pyroclastic deposits and their en-
virons, including thermal-infrared data from the Diviner Lunar Ra-
diometer Experiment (Diviner; Paige et al., 2009 ) on the Lunar Re-
connaissance Orbiter (LRO) and visible to near-infrared (VNIR) hy-
perspectral images from the Moon Mineralogy Mapper (M
3 ; Pieters
et al., 2009; Green et al., 2011 ) on Chandrayaan-1. We also include
LRO Lunar Reconnaissance Orbiter Camera (LROC; Robinson et al.,
2010 ) visible images and Clementine ultraviolet to visible color ra-
tio maps for context ( Nozette et al., 1995 ).
4.1. LRO Diviner thermal-infrared datasets
We derive silicate composition, iron abundance, and the ther-
mal inertia of Oppenheimer crater and its pyroclastic deposits from
Diviner thermal-infrared data ( Paige et al., 2009 ). We investigate
the silicate mineralogy of Oppenheimer through an analysis of
the infrared emissivity maximum, or the Christiansen Feature (CF;
Greenhagen et al., 2010 ). The CF value is the wavelength location of
the emissivity maximum (or reflectance minimum), which occurs
near 8- μm, but is strongly dependent upon the degree of poly-
merization of minerals, with framework silicate minerals such as
feldspars exhibiting CFs at shorter wavelengths than less polymer-
ized pyroxene and olivine. The Diviner instrument has three chan-
nels (3–5) near 8- μm that we use to estimate the CF value. The
parabola that fits the three emissivity values from channels 3 to
5 is calculated, and the wavelength that corresponds to the max-
imum of that parabola is estimated as the CF value. For a more
detailed explanation of calculating CF values, see Greenhagen et al.
(2010) . We use Diviner CF values to search for relative abundances
of silicate phases such as plagioclase ( Glotch et al., 2010 ) that near-
infrared spectra often cannot detect, which could indicate mixing
with country rock in Vulcanian-style eruptions.
In order to evaluate the variability of CF values within each de-
posit and to determine the CF value for the glassiest portion of
each deposit, we report CF values for several different regions of
interest. To obtain the average CF value of each pyroclastic deposit,
we created a region of interest for each deposit by outlining the
extent of the deposit using visible images and then took the av-
erage CF value of each region. To obtain the maximum CF value
of a deposit, we visually identified areas within each deposit that
exhibited higher CF values than the rest of the deposit and took
the average CF of those areas. Not every deposit exhibited areas
with enhanced CF values. We also obtained the CF value for glass-
rich areas of each deposit by averaging the CF value of all pixels
within each deposit that exhibited an M
3 glass band depth above a
threshold value. Finally, the CF values for the crater floor were ob-
ained by averaging a section of each side of the crater floor away
rom the pyroclastic deposits.
We also use Diviner data to estimate iron abundances of lu-
ar pyroclastic deposits. Allen et al. (2012) found that the bulk
eO wt% of Apollo soil samples correlated with the CF value
FeO = 74.24 ∗CF −599.9; r 2 =0.90). We use this relationship be-
ween FeO abundance and CF values for lunar glasses to estimate
he FeO wt% of each deposit ( Allen et al., 2012 ).
Finally, we use Diviner thermal-infrared data to derive the ther-
al inertia of each deposit, I =
√
kρc p , where k is thermal conduc-
ivity, ρ is density, and c p is heat capacity. We parameterize ther-
al inertia through the “H -parameter”, which describes the scale
epth of exponential increase, e.g. , ρ(z) ∼ e −z/H . Thermal conduc-
ivity is assumed to be proportional to density, and therefore fol-
ows the same exponential depth increase. The boundary values on
onductivity and density are those of Vasavada et al. (2012) , with
he exception of the surface density, which is ρd = 1100 kg m
−3 .
or each map element, we perform a least-squares minimization
n the nighttime regolith temperatures from Diviner, to derive the
-parameter. The H -parameter is inversely related to thermal iner-
ia, with larger H values indicate lower thermal inertia within the
pper ∼10 cm. Regional lunar pyroclastic deposits typically exhibit
ower nighttime temperatures than the lunar regolith, which im-
lies that they have lower thermal inertia ( Bandfield et al., 2011 )
nd can yield insight on the particle sizes and shapes in the de-
osits. For example, spherical pyroclastic beads of juvenile mate-
ial could stack in an organized way creating more pore space and
owering the thermal inertia, while deposits with higher country
ock content could have a thermal inertia similar to the average
unar regolith.
.2. M
3 visible to near-infrared spectral maps
We use M
3 visible to near-infrared spectra (0.43–3.0 μm) to
haracterize the iron-bearing minerals and glasses within Op-
enheimer crater. M
3 Level 2 reflectance data from the global
apping campaign is acquired from the Planetary Data System,
hich includes corrections for thermal emission as well as to-
ographic, photometric, and instrumental effects ( Green et al.,
011; Clark et al., 2011; Hicks et al., 2011; Boardman et al., 2011;
esse et al., 2013 ). Here we use two images from high signal
o noise ratio (SNR) operational periods (M3G20090621T022743
nd M3G20090 621T0 65503), which cover the eastern half of
he crater, and two images from low SNR operational periods
M3G20 090815T074952 and M3G20 090718T101402;), which cover
he west and the northeast rim of the crater. All images are
rom the “2C” period of the mission when the spacecraft oper-
ted from a higher orbit, so the native resolution of all four im-
ges is ∼280 m/pixel (two times lower resolution than the global
ata from earlier in the mission). There is a coverage gap between
hese images ( Figs. 4 and 5 ). There is no M
3 coverage over part of
he western half of Oppenheimer crater where the centers of the
orthwest and southwest pyroclastic deposits are located. These
mages are mapped into a mosaic with a local cylindrical projec-
ion at 140 m/pixel horizontal resolution ( Figs. 4 and 5 ).
Iron-bearing minerals can be identified in M
3 data based on the
osition and shape of the 1 and 2 μm iron absorption bands, which
ary significantly with mineralogy and composition ( e.g., Adams,
974; Cloutis and Gaffey, 1991; Sunshine and Pieters, 1993; Hor-
an et al., 2014 ). See Fig. S4 for examples of near-infrared spectra
f iron-bearing minerals typically found on the Moon. The wave-
ength range of M
3 covers both of the broad 1 and 2 μm absorp-
ion bands, and the 82 spectral band global dataset is ideal in par-
icular for analysis of the 1 μm band, with 2 × higher spectral sam-
ling in the 0.7–1.6 μm region.

K.A. Bennett et al. / Icarus 273 (2016) 296–314 301
i
b
w
s
l
r
t
a
r
a
s
r
i
p
p
2
c
U
e
s
c
c
a
t
d
(
a
b
c
0
1
f
e
i
r
c
1
t
o
t
d
m
b
i
e
t
l
b
4
a
t
g
e
r
s
w
a
2
7
i
l
t
r
m
5
5
s
a
8
t
a
r
v
a
s
b
h
(
p
c
a
t
p
r
t
o
o
h
c
i
a
a
0
i
v
t
−
a
p
e
m
a
m
a
t
p
a
5
h
m
p
a
c
a
a
p
Before the 1 and 2 μm iron absorption bands can be analyzed
n detail, however, the overall continuum slope must be suppressed
y removing an approximate continuum function. In analyzing a
ide variety of lunar terrains, we find that the simplest continuum
hape that fits most lunar spectra is a linear convex hull, where
inear continua are found independently over the 1 and 2 μm band
egions ( e.g. , Clark and Roush, 1984 ). To find the continuum func-
ion, we first smooth each spectrum with nested boxcar average
nd median smoothing functions, both 3 channels wide. Then, we
emove an initial estimate of the continuum, fit to fixed endpoints
t 0.7, 1.5, and 2.6 μm. Next we fine-tune these endpoints for each
pectrum by finding the local maxima in this initial continuum
emoved spectrum. For the 1 μm region, we find the local max-
ma between 0.6–1.0 and 1.0–1.7 μm, which become the new end-
oints. For the 2 μm region, local maxima are found between the
revious endpoint (between 1.0 and 1.7 μm) and 2.0 μm and 2.0–
.6 μm. These ranges avoid both possible long-wavelength plagio-
lase absorptions near 1.3 μm and thermal effects beyond 2.6 μm.
sing the new endpoints, the final continuum of three joined lin-
ar segments is calculated from the original spectrum.
We use the methods of Horgan et al. (2014) to map the po-
ition of the 1 and 2 μm iron absorption bands, which are indi-
ators of iron mineralogy. Band position is parameterized as band
enter, calculated as the wavelength position of the minimum of
fourth-order polynomial fit to the spectrum within 0.1 μm of
he minimum channel in each band. Band depth is the percent
epth below the continuum at the location of the band center
i.e. , one minus the value of the continuum removed spectrum
t that wavelength). The 1 and 2 μm band positions together can
e used to broadly distinguish between orthopyroxene (OPX; band
enters between 0.9–0.94 and 1.8–1.95 μm), clinopyroxene (CPX;
.98–1.06 and 2.05–2.4 μm), and iron-bearing glass (1.06–1.2 and
.9–2.05 μm). Mixtures of these minerals have band centers that
all in the intermediate regions between the endmembers ( Horgan
t al., 2014 ). Other iron-bearing minerals can also be identified us-
ng similar methods. Olivine exhibits a characteristically asymmet-
ic 1 μm band typically centered near 1.05–1.08 μm and plagio-
lase feldspars exhibit broad and shallow bands centered between
.25 and 1.35 μm, but neither exhibits a corresponding 2 μm band.
One drawback of only using band centers when trying to iden-
ify glass in a mixture is that glass is a poor absorber compared to
ther iron-bearing minerals, and thus glass only significantly shifts
he 1 and 2 μm band centers when it is present at very high abun-
ances (typically 50–80 wt%; Horgan et al., 2014 ). However, low to
oderate glass abundances can still cause additional absorption
eyond 1.1 μm, where other minerals are not as strongly absorb-
ng. Thus, we have developed a “glass band depth” spectral param-
ter to aid in identifying glass at lower abundances, which is equal
o the average of the depth below the continuum at three wave-
engths: 1.15, 1.18, and 1.20 μm. This parameter will detect glass,
ut will also detect olivine if present.
.4. Additional data sets
We use LROC wide angle camera (WAC) mosaics and narrow
ngle camera (NAC) images to provide context for our composi-
ion and mineralogy study ( Robinson et al., 2010 ). We use the
lobal WAC mosaic available on JMARS for the Moon ( Christensen
t al., 2009 ) and individual calibrated NAC images that are cur-
ently available from the PDS. These LROC products are used to
tudy the morphology and albedo variations of pyroclastic deposits
ithin Oppenheimer crater.
We also use Clementine color ratio maps that are publicly avail-
ble on JMARS for the Moon ( McEwen, 1997; Christensen et al.,
009 ). In Clementine color ratio maps, red is 750/415 nm, green is
50/950 nm, blue is 415/750 nm. These maps cancel out the dom-
nant brightness variations from albedo and topography and high-
ight color differences dues to mineralogy and maturity. We use
hese maps to provide context for Oppenheimer, especially with
espect to the influence of crater ejecta and rays on observed re-
ote sensing signatures.
. Results
.1. Diviner results
Fig. 3 b shows the CF map of Oppenheimer crater and Table 1
hows the average CF value of each pyroclastic deposit as well
s the crater floor. Observed CF values range from roughly 8.15–
.40 μm, with much of the crater floor showing comparable values
o nearby highlands, at 8.15–8.2 μm. All pyroclastic deposits have
higher CF value than the crater floor, but the large western py-
oclastic deposits (south, southwest, northwest) exhibit higher CF
alues (8.28–8.33 μm, with areas of enhanced CF values that reach
s high as 8.48 μm) than the smaller eastern deposits (north, east,
outheast, south–southeast; 8.25–8.27 μm). This may or may not
e related to the observation that the western crater floor also
as a higher CF than the eastern crater floor. A fresh impact crater
indicated by the arrow in Fig. 3 c) near the north pyroclastic de-
osit has the lowest CF value in the study area (8.07 μm). We
onverted the Diviner CF values to FeO wt% ( Table 1 ). Since iron
bundance correlates with CF values, the same trends observed in
he CF values apply to the FeO wt%. The western pyroclastic de-
osits have an FeO abundance of 15–19 wt%, while the eastern py-
oclastic deposits have 13–14%. The areas of enhanced CF within
he northwest, southwest and south deposits have FeO abundances
f 30 ± 11, 23 ± 6, and 26 ± 10 wt%, respectively.
Fig. 3 c shows the H -parameter (the inverse of thermal inertia)
f Oppenheimer crater. The thermal inertia calculations presented
ere do not fully account for slope variations, which is why the
rater walls and rim are apparent in Fig. 3 c. As we are primarily
nterested in the crater floor and pyroclastic deposits, where slopes
re small, this does not strongly affect our results. The crater floor
nd the pyroclastic deposits have H -parameter values ranging from
.08 to 0.10, and the H -parameter value for each pyroclastic deposit
s the same as its surrounding crater floor material. The largest
ariation in thermal inertia is the small, fresh impact crater near
he northern pyroclastic deposit that has an H -parameter value of
0.2 (arrow in Fig. 3 c; also see Table 1 ). Fresh impact craters usu-
lly exhibit higher thermal inertia values, and therefore lower H -
arameter values, due to the high abundance of small rocks in the
jecta. The negative value at the fresh crater implies that the ther-
al inertia in the upper ∼10 cm is higher than the maximum value
llowed by the standard model ( ∼90 J m
−2 K
−1 s −1/2 ). A different
odel, with higher limiting thermal inertia, would be needed to
ccurately describe this area. Apart from this fresh impact crater,
he largest variation in thermal inertia is between the higher H -
arameter (lower thermal inertia) western half of the crater floor
nd the lower H -parameter (higher thermal inertia) eastern half.
.2. M
3 results
Fig. 4 shows the M
3 glass band depth parameter across Oppen-
eimer crater and Fig. 5 shows an RGB composite of these three
aps, with the red channel corresponding to the glass band depth
arameter, the green channel the 1 μm band center (see Fig. S1),
nd the blue channel the 2 μm band center (see Fig. S2). In this
olor scheme, we interpret that glass-rich areas are yellow, CPX
nd glass mixtures are magenta, OPX-dominated areas are green,
nd CPX/OPX mixtures are teal or blue. See Table S1 in the Sup-
lementary material for more details about this color scheme.

302 K.A. Bennett et al. / Icarus 273 (2016) 296–314
Fig. 3. (a) LROC WAC mosaic of Oppenheimer crater from the global mosaic available on JMARS for the Moon ( Robinson et al., 2010; Christensen et al., 2009 ). The 7 largest
pyroclastic deposits are outlined and labeled. (b) Diviner CF map of Oppenheimer crater. (c) H -parameter (inverse thermal inertia) of Oppenheimer crater. The black arrow
points to a fresh crater. (d) Clementine color ratio of Oppenheimer crater available on JMARS for the Moon ( McEwen et al., 1997; Christensen et al., 2009 ). The light green
terrain in the eastern part of Oppenheimer is hypothesized to be a crater ray. (For interpretation of the references to color in this figure legend, the reader is referred to the
web version of this article.)
t
0
w
b
w
a
1
h
(
v
t
Analysis of M
3 spectra shows clear spectral differences between
the crater floor and the pyroclastic deposits, as well as within and
between the various pyroclastic deposits. All reported band center
ranges reported here are one standard deviation on either side of
the mean, for spectra with 1 and 2 μm band depths greater than
2%. Fig. 6 a shows a density plot of the 1 and 2 μm band centers of
the crater, along with approximate ranges for OPX, CPX, and glass-
dominated spectra based on our local analyses. The densest por-
tion of Fig. 6 a corresponds to the crater floor, which tends to fall
both within the OPX field and between the OPX and CPX fields.
This general range encompasses both the lateral and vertical di-
versity in the composition of the crater floor. The eastern half of
he crater floor exhibits 1 and 2 μm band centers between 0.90–
.98 and 1.99–2.06 μm, consistent with an OPX/CPX mixture. The
estern crater floor exhibits similar 1 μm band centers but 2 μm
and centers shifted lower, between 1.93 and 2.02 μm. Many crater
alls, fracture walls, and fresh craters in the eastern crater floor
lso exhibit shifted band centers, typically between 0.91–0.94 and
.96–1.99 μm. The west and central-eastern crater floor both ex-
ibit small but positive values of the glass band depth parameter
1–3%).
In comparison, the pyroclastic deposits exhibit much larger
alues of the glass band depth parameter (3–8%). This makes
he glass band depth parameter very useful for identifying

K.A. Bennett et al. / Icarus 273 (2016) 296–314 303
Table 1
Average Diviner-derived CF values, FeO, and thermal inertia for all deposits. Where
deposits are large enough to exhibit significant variation, the maximum value for the
CF and corresponding FeO are also shown in parentheses.
Deposit or unit CF value ( μm) FeO (wt%) Thermal inertia
( H -parameter)
Pyroclastic deposits
NW 8.33 ± 0.03 (8.48 ± 0.15) 19 ± 2 (30 ± 11) 0.10 ± 0.01
SW 8.31 ± 0.07 (8.39 ± 0.08) 17 ± 5 (23 ± 6) 0.10 ± 0.01
S 8.28 ± 0.06 (8.43 ± 0.16) 15 ± 4 (26 ± 10) 0.10 ± 0.01
SSE 8.25 ± 0.03 13 ± 2 0.08 ± 0.01
SE 8.25 ± 0.04 13 ± 3 0.08 ± 0.01
E 8.26 ± 0.04 13 ± 3 0.08 ± 0.01
N 8.27 ± 0.06 14 ± 4 0.10 ± 0.01
Non-pyroclastic deposits
W crater floor 8.24 ± 0.03 12 ± 2 0.10 ± 0.01
E crater floor 8.20 ± 0.03 9 ± 2 0.08 ± 0.01
Fresh crater 8.07 ± 0.06 −1 ± 4 −0.20 ± 0.10
Fig. 4. M
3 glass band depth spectral parameter mapped in Oppenheimer crater, with LROC WAC mosaic from Fig. 3 as background. See Section 4.2 for M
3 image names.
This spectral parameter indicates enhanced absorption between 1.15 and 1.20 μm in continuum removed spectra, consistent with glass. Arrows indicate sites of inferred
pyroclastic deposits based on glass detections. Boxes indicate locations of deposits shown in detail in Figs. 7, 8, 10, 12 and 13 . (For interpretation of the references to color
in this figure, the reader is referred to the web version of this article.)

304 K.A. Bennett et al. / Icarus 273 (2016) 296–314
Fig. 5. M
3 RGB composite map of Oppenheimer crater, with LROC WAC mosaic from Fig. 3 as background. Red = glass band depth ( Fig. 4 ; stretched from 0.1% to 3%),
green = 1 μm band center (Fig. S1; stretched from 0.9 to 1.05 μm), blue = 2 μm band center (Fig. S2; stretched 1.95–2.25 μm). CPX mixed with glass is magenta, glass is
yellow, OPX is green, OPX mixed with CPX is teal to blue (see Table S1 for more detailed explanation of color scheme). The five white boxes show the areas of additional
figures where further analysis is presented. (For interpretation of the references to color in this figure legend, the reader is referred to the web version of this article.)
t
p
p
y
s
t
t
T
2
t
1
w
(
p
g
(
m
b
pyroclastic deposits, even deposits smaller than a few kilometers
across. For example, the arrows in Fig. 4 point to 13 deposits that
are detectable using the glass band depth parameters. There are
also two larger deposits on the western side of the crater that
are not entirely covered with M
3 data, which brings the total of
pyroclastic deposits to 15 within Oppenheimer crater. This agrees
with the number of pyroclastic deposits identified in Gaddis et al.
(2013) . However, the glass band depth parameter alone is not suf-
ficient to uniquely identify glass, as it could also indicate olivine.
We do not observe any spectroscopic evidence for olivine in the
area, though, as all locations with greater glass band depths ex-
hibit both longer wavelength 1 μm band centers and shorter wave-
length 2 μm band centers. The shift to longer 1 μm band centers
and shorter 2 μm band centers is apparent at the scale of the map
in Figs. S1 and S2 in the Supplementary material. While olivine
would be expected to shift the 1 μm band center to longer wave-
lengths, it would not be expected to shift the 2 μm band center
at all. This shift in both bands is consistent with the presence of
iron-bearing volcanic glass in Oppenheimer crater pyroclastic de-
posits ( Horgan et al., 2014 ).
The spectral character of the central portions of the pyroclas-
ics varies from glass-rich to CPX/glass mixtures. Only one de-
osit (south) exhibits signatures of OPX in its interior. An exam-
le of a glass-rich deposit is the east deposit, and a detailed anal-
sis of this deposit is shown in Fig. 7 . The plotted M
3 spectra
how a progression from spectra consistent with an OPX/CPX mix-
ure that is representative of the eastern crater floor ( Fig. 7 , spec-
rum 1) to the glass-rich pyroclastic materials ( Fig. 7 , spectrum 3).
his progression is also shown by the clear linear trend in 1 and
μm band centers from those consistent with OPX/CPX mixtures
o those consistent with glass in Fig. 6 b. Indeed, the very high
μm band centers in this deposit (1.09–1.13 μm) are consistent
ith lab spectra of mixtures containing more than 70–80 wt% glass
Horgan et al., 2014 ).
In contrast, Fig. 8 shows a similar analysis of the southeast de-
osit, which we interpret as consisting of a mixture of CPX and
lass. Fig. 9 shows LROC NAC images of this deposit for context
discussed in more detail in Section 4. 4 ). As indicated in Fig. 6 c,
any areas within this deposit exhibit 1 and, in particular, 2 μm
and centers at longer wavelengths than the surrounding crater
K.A. Bennett et al. / Icarus 273 (2016) 296–314 305
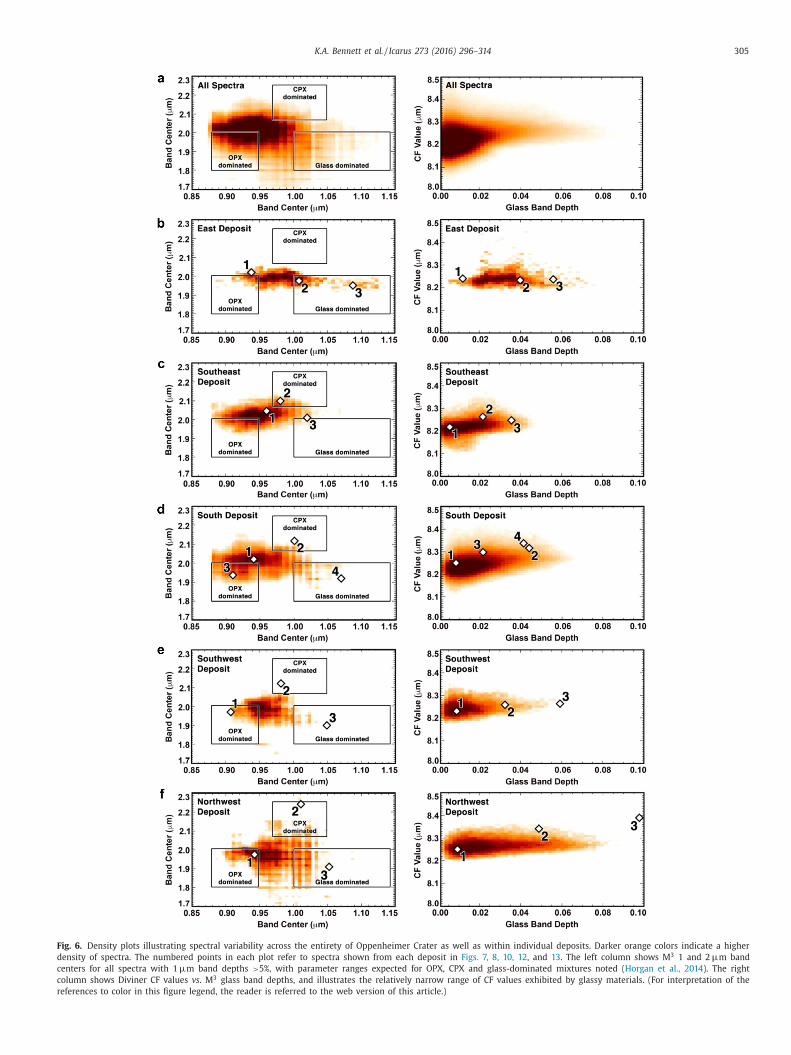
Fig. 6. Density plots illustrating spectral variability across the entirety of Oppenheimer Crater as well as within individual deposits. Darker orange colors indicate a higher
density of spectra. The numbered points in each plot refer to spectra shown from each deposit in Figs. 7, 8, 10, 12 , and 13 . The left column shows M
3 1 and 2 μm band
centers for all spectra with 1 μm band depths > 5%, with parameter ranges expected for OPX, CPX and glass-dominated mixtures noted ( Horgan et al., 2014 ). The right
column shows Diviner CF values vs . M
3 glass band depths, and illustrates the relatively narrow range of CF values exhibited by glassy materials. (For interpretation of the
references to color in this figure legend, the reader is referred to the web version of this article.)

306 K.A. Bennett et al. / Icarus 273 (2016) 296–314
Fig. 7. Detailed analysis of the eastern deposit, as indicated in Fig. 4 . This deposit
is glass-rich, with no indication of significant CPX. (a) Enlarged maps of deposit
from Figs. 3 a and b, 4 , and 5 . (b) Continuum removed spectra, with calculated band
centers noted.
Fig. 8. Detailed analysis of southeastern deposit, as indicated in Fig. 4 . This deposit
is primarily a mixture of CPX and glass. See Fig. 7 caption for description of indi-
vidual parts.
f
a
I
i
s
t
h
s
1
floor, which is consistent with the presence of CPX ( Fig. 8 , spec-
trum 2). However, these spectra also exhibit a shoulder on the
1 μm CPX band near 1.2 μm consistent with a glass component.
While this shoulder could be due to a secondary CPX band that can
occur in some very high Ca and/or Fe CPX ( Klima et al., 2011; Trang
et al., 2013 ), local context suggests that glass is more likely. Other
areas within the deposit exhibit much stronger shoulders along
with longer wavelength 1 μm band centers and shorter wavelength
2 μm band centers, all consistent with higher glass abundances, al-
beit still mixed with CPX ( Fig. 8 , spectrum 3).
The rest of the pyroclastic deposits in Oppenheimer crater vary
rom glass-rich to glass and CPX mixtures. Some deposits, such
s the south deposit, show spectral variation within the deposit.
n some areas, this deposit is glass-rich ( Fig. 10 , spectrum 4) and
n others it is a CPX/glass mixture ( Fig. 10 , spectrum 2). Fig. 11
hows LROC WAC and NAC images of the south deposit for con-
ext (discussed in more detail in Section 4.4 ). This deposit also ex-
ibits OPX signatures. A spectrum taken from a fracture within the
outh deposit is similar to the underlying OPX-rich crater floor ( Fig.
0 , spectrum 3), while central portions of the deposit are more

K.A. Bennett et al. / Icarus 273 (2016) 296–314 307
Fig. 9. (a) NAC mosaic of the SE deposit. Boxes labeled 1–3 show the location of spectra from Fig. 8 . (b) (M171632283RE ) and (c) (M1099924536RE) areas showing distinct
low albedo mantling deposits within the SE deposit. (d, e) Bench craters within the SE deposits that indicate a bolide impacted into layered material, possibly loose pyroclastic
material over a lava flow. The crater in (d) is ∼85 m in diameter and the crater in (e) is ∼65 m in diameter.
Fig. 10. Detailed analysis of complex southern deposit, as indicated in Fig. 4 . This deposit exhibits glass-rich areas, CPX/glass mixtures, as well as OPX-rich country rock. See
Fig. 7 caption for description of individual parts.
s
e
t
n
c
r
l
n
t
p
pectrally similar to the possible mixed OPX/CPX mantle in the
astern crater ( Fig. 10 , spectrum 1). In the south deposit in par-
icular, significant striping of unknown origin (but presumed to be
oise) in the M
3 data within the dark deposit makes highly lo-
al variability difficult to assess. However, there do appear to be
eal spectral variations between the main lobe and the eastern
obe of the deposit, with a more widely distributed CPX compo-
ent to the east ( Fig. 10 , spectra 2 and 4). The available data over
he northwest and southwest deposits, while also noisy, also ap-
ears to show variation in glass and CPX concentrations ( Fig. 12 ).

308 K.A. Bennett et al. / Icarus 273 (2016) 296–314
Fig. 11. (a) LROC WAC image of the S deposit. (b) NAC (M1119966094LE) of the glass-rich area that roughly corresponds to spectra 4 from Fig. 10 . (c) NAC (M110316969RE)
of the CPX-rich area that roughly corresponds to spectra 2 from Fig. 10 . The depression in the top of the image could be a vent, the depression in the bottom part of the
image is a fracture in the crater floor.
c
s
i
a
a
1
s
b
r
A
a
c
p
e
s
h
f
d
s
6
h
t
h
t
t
O
o
m
O
b
fl
e
t
fl
5.3. Synthesizing Diviner and M
3
Fig. 6 a shows a density plot comparing Diviner CF values and
our M
3 glass band depth parameter. While there is significant
spread in CF values at low glass band depths (8.1–8.4 μm), the
range in values shrinks with increasing glass band depths. In par-
ticular, CF values at glass band depths greater than 3% are re-
stricted to greater than 8.2 μm. This trend of increasing CF value
for increasing glass band depth is generally true at the scale of in-
dividual deposits as well, as is best shown in Fig. 6 f for the north-
west deposit. In this heterogeneous deposit, the glass-rich area that
we sampled ( Fig. 13 , spectrum 3) exhibits very high CF values
( Fig. 6 f; glass band depth of ∼0.10; CF value of ∼8.40 μm). The
CF values for the glassiest portions of each deposit are listed in
Table 2 . These results also show that the average CF values of each
deposit are within the margin of error for the average CF values
of the glass-rich portion of that deposit. Together, these observa-
tions suggest that the CF values tend to decrease away from the
northwest deposit. The lowest CF values for the pyroclastics are
observed in the glass-rich east deposit, where the CF values for
the nearby crater floor and the glass-rich terrain are nearly identi-
cal. This implies that CF values are not strictly correlated with the
glass content of a deposit, and thus are controlled by other factors.
6. Discussion
6.1. Crater ray
Petro et al. (2001) noted that there is a high albedo crater ray
mantling the eastern half of Oppenheimer crater. This ray is ap-
parent in several of our datasets, including the CF map ( Fig. 3 b)
and Clementine color ratio ( Fig. 3 d). Because crater rays can con-
tain both distal ejecta and local ejecta from secondary craters ( e.g. ,
Hawke et al., 2004; Dundas and McEwen, 2007 ), it is important to
know whether the ray was emplaced before or after the pyroclas-
tic deposits. If the ray was emplaced afterwards, we must account
for this in our interpretations. Fig. 14 shows a Clementine color
ratio map of part of the far side of the Moon. Oppenheimer is
ircled and the ray crossing Oppenheimer is outlined. There are
everal craters that this ray may have originated from, includ-
ng Jackson, Crookes, and Antoniadi. Jackson (22.4 °N, 163.1 °W)
nd Crookes (10.3 °S, 164.5 °W) craters are both Copernican aged
nd have visible rays ( Wilhelms, 1987 ). Antoniadi crater (69.7 °S,
72.0 °W) is late Imbrium aged, and therefore we do not expect to
ee preserved rays ( Wilhelms, 1987 ). However, there do appear to
e a few rays extending from Antoniadi. It is possible that these
ays are from a younger impact crater and they happen to cross
ntoniadi. The rays from Jackson, Crookes, and near Antoniadi all
re in line with the ray that mantles Oppenheimer crater, but we
annot determine which of these craters (if any) the ray over Op-
enheimer was sourced from. However, craters that have bright,
xtensive rays are thought to be Copernican aged (such as Jack-
on and Crookes craters), while most lunar volcanism is thought to
ave stopped ∼2 billion years ago ( Hiesinger et al., 20 0 0 ). There-
ore we can safely assume that the ray postdates the pyroclastic
eposits in eastern Oppenheimer crater. We will examine this pos-
ibility while interpreting our data.
.2. Crater floor
M
3 results showed that the ejecta covered crater floor ex-
ibits band centers between 0.90–0.98 and 1.99–2.06 μm, consis-
ent with an OPX/CPX mixture, but that the western (ray-free)
alf of the crater floor plus fracture walls and fresh craters on
he crater floor have band centers shifted slightly lower. Together,
hese observations suggest that the actual crater floor is primarily
PX mixed with minor CPX. An OPX-rich composition of the floor
f Oppenheimer crater is consistent with the general iron enhance-
ent observed throughout the basin, likely due to the existence of
PX-bearing materials ( e.g. , norite) across the South Pole–Aitken
asin interior ( Ohtake et al., 2014 ).
Both the western crater floor (8.24 μm) and the eastern crater
oor (8.20 μm) have a CF value that is consistent with pyrox-
ne, which is consistent with the M
3 results. We hypothesize that
he difference in CF value between the western and eastern crater
oors is due to the large ray across the eastern half of the crater.

K.A. Bennett et al. / Icarus 273 (2016) 296–314 309
Fig. 12. Detailed analysis of the margin of the southwestern deposit that is covered by M
3 data, as indicated in Fig. 4 . This deposit exhibits both glass-rich areas and
CPX/glass mixtures. The M
3 scene covering this portion of the crater is from a warmer operational period and thus exhibits markedly greater noise than the scenes covering
the eastern portion of the crater. See Fig. 7 caption for description of individual parts.
Fig. 13. Detailed analysis of the margin of the northwestern deposit that is covered by M
3 data, as indicated in Fig. 4 . This deposit exhibits both glass-rich areas and
CPX/glass mixtures. The M
3 scene covering this portion of the crater is from a warmer operational period and thus exhibits markedly greater noise than the scenes covering
the eastern portion of the crater. See Fig. 7 caption for description of individual parts.

310 K.A. Bennett et al. / Icarus 273 (2016) 296–314
Table 2
Average CF values and derived FeO wt% for just the glassiest materials in each deposit. Glass is defined as having a 1 μm band center
> 1.0, 1 μm band depth > 5%, a 2 μm band center < 2.07, and elevated glass band depths, which are restricted to the highest available
values in each deposit to isolate the glassiest materials. NW/SW deposits are only sampled in the more distal portions of the deposit
that are covered by M
3 .
Deposit Average CF value of glass-rich
pyroclastic materials
Standard
deviation
FeO wt% of glass-rich
pyroclastic materials
Standard
deviation
Glass band
depth range
NW 8.32 0.07 18 5 0.08–0.14
SW 8.27 0.04 14 3 0.05–0.08
S 8.28 0.05 15 4 0.07–0.09
SSE 8.28 0.07 15 5 0.05–0.08
SE 8.25 0.03 13 2 0.04–0.08
E 8.24 0.03 12 2 0.04–0.06
N 8.29 0.11 16 8 0.05–0.09
Fig. 14. Clementine color ratio map for the far side of the Moon ( McEwen, 1997 ),
showing the east central region of the South Pole–Aitken basin. Red is 750/415 nm,
green is 750/950 nm, and blue is 415/750 nm. A lighter, ∼linear feature is super-
imposed on the eastern portion of Oppenheimer crater, and this feature may be
a crater ray. The thin black latitude and longitude lines are placed every 30 °. Nearby craters include Jackson (located at 22.4 °N, 163.1 °W) and Antoniadi (located
at 69.7 °S and 172.0 °W). (For interpretation of the references to color in this figure
legend, the reader is referred to the web version of this article.)
p
h
e
e
t
c
m
w
h
m
n
M
t
6
6
e
w
fi
O
o
w
e
w
t
s
s
o
i
l
a
p
fl
e
a
f
e
c
e
r
T
p
r
h
p
a
g
Crater rays contain large numbers of secondary craters, which can
churn up fresh material ( Hawke et al., 2004; Dundas and McEwen,
2007 ). Since we observe a difference between the ray-covered east
crater floor and ray-free west crater floor (8.20 μm and 8.24 μm,
respectively), this could mean one of two things. One possibility is
that the ray covered eastern half of the crater is more immature
than the western half. Diviner CF is affected by maturity, so it is
ossible that the only difference between the two crater halves is
ow much space weathering has occurred, consistent with recent
xposure of lower CF material inside of the crater ray in the east-
rn half. Another possibility is that the western crater floor is man-
led by a material that is slightly more iron-rich than the OPX-rich
rater floor. In this scenario, the entire crater floor could have been
antled by a thin layer of iron-rich material and this thin layer
as overturned and mixed with crater floor material when the east
alf of the crater was impacted by the ejecta in the ray. The thin
antling layer could be pyroclastic material, as there are glass sig-
atures on both the western and central-eastern crater floor in the
3 mineral maps that could represent a small amount of pyroclas-
ic glass.
.3. Pyroclastic deposits
.3.1. Thermal inertia
Previous studies have shown that regional pyroclastic deposits
xhibit lower nighttime temperatures than the lunar regolith,
hich implies that they have a lower thermal inertia and are likely
ner-grained than typical lunar regolith ( e.g., Bandfield et al. , 2011 ).
ur results ( Fig. 3 c; Table 1 ) are not consistent with those previ-
us studies. The largest variation in thermal inertia is between the
estern half of the crater floor and the eastern half, which is cov-
red by a large crater ray. The many secondary craters associated
ith the ray across the eastern half of the crater likely raises the
hermal inertia of these areas. The pyroclastic deposits exhibit the
ame thermal inertia as the surrounding crater floor. The south,
outhwest, and northwest deposits are located on the western half
f the crater and all have an H -parameter value of ∼0.1, which
s similar to the western crater floor and typical of mature high-
ands regolith. The east, southeast, and south–southeast deposits
re located within the boundaries of the ray and they have an H -
arameter value of 0.08, which is the same as the eastern crater
oor.
That the eastern pyroclastic deposits exhibit similar thermal in-
rtia as the surrounding area is unsurprising since impact craters
nd rays greatly influence the thermal inertia of the lunar sur-
ace. The eastern pyroclastic deposits and crater floor are both cov-
red with small secondary craters inside of the ray and this likely
aused both areas to exhibit similar thermal inertia values. How-
ver, the western pyroclastic deposits that are not affected by the
ay also exhibit similar thermal inertia as the surrounding area.
his implies that the physical characteristics of the pyroclastic de-
osits within Oppenheimer crater are not necessarily similar to the
egional deposits that contain fine-grained, spherical beads and ex-
ibit low thermal inertia values.
There are several possible explanations for these results. A de-
osit emplaced by a Vulcanian-style eruption will contain blocks
nd ash, which would raise its thermal inertia. If an eruption be-
an with a Vulcanian-style eruption and then finished with fire

K.A. Bennett et al. / Icarus 273 (2016) 296–314 311
f
t
g
t
s
e
c
w
h
n
t
t
p
w
d
6
f
T
w
i
e
c
e
t
(
e
t
C
(
a
r
C
s
m
d
s
t
v
a
M
a
H
t
a
p
i
a
i
r
o
b
b
1
a
C
o
p
r
d
m
S
2
i
p
b
M
m
a
r
t
6
b
d
s
p
U
e
h
o
i
T
O
t
p
c
p
h
n
h
w
b
o
e
t
T
a
a
o
c
e
d
I
t
s
p
t
e
s
v
e
T
p
m
p
s
t
m
e
d
c
w
t
s
C
ountaining activity, the blocky, high thermal inertia material from
he Vulcanian eruption could cancel out the effects of the fine-
rained, low thermal inertia material from the fire fountaining ac-
ivity. However, this scenario is likely to coincidental to be a rea-
onable solution. An alternate explanation is that if a deposit was
mplaced by a Hawaiian-style eruption in which individual pyro-
lasts were still warm when they were deposited, the pyroclasts
ould have been welded together. These welded pyroclasts would
ave the effect of raising the thermal inertia of a deposit. A fi-
al explanation is localized deposits are small enough that over
ime impact gardening homogenized each deposit so that it has
he same thermal properties as the surrounding regolith. The im-
act gardening must not affect the mineralogy of the deposits, as
e observe clear differences in mineralogy between the pyroclastic
eposits and the crater floor.
.3.2. Composition
The CF values of the pyroclastic deposits (8.25–8.48 μm) range
rom being consistent with pyroxene to olivine or iron-rich glass.
he average CF value may correlate with the size of the deposit,
ith the larger deposits (south, southwest, and northwest) exhibit-
ng higher CF values and the smaller deposits (north, east, south-
ast, south–southeast) exhibiting lower CF values. However, this
ould also be due to the low CF crater ray covering the east-
rn half of the crater and mixing with the pyroclastic material
o lower the deposits’ CF value. The Clementine color ratio image
Fig. 3 d) shows the extent of the crater ray. The ray covers the
ast, southeast and south–southeast deposits, but it does not ex-
end to the north deposit. The north deposit has a slightly higher
F value than the east, southeast, and south–southeast deposits
8.27 μm vs . 8.24–8.25 μm). This implies that the east, southeast,
nd south–southeast deposits could be mixed with fresh mate-
ial that lowers each deposit’s CF value. However, the difference in
F values between the north deposit and the east, southeast, and
outh–southeast deposits is within the standard deviation of the
easurements ( ±0.03–0.04 μm), so the variation between these
eposits could also be due to noise. The larger deposits (south,
outhwest, and northwest) have CF values that range from 8.29
o 8.36 μm, although small areas within each deposit exhibit CF
alues as high as 8.48 μm. We interpret these values to represent
n iron-rich glass, as olivine is not supported by our M
3 analyses.
ost of the smaller deposits (east, southeast, and south–southeast)
re homogeneous and do not exhibit areas of enhanced CF values.
owever the north deposit shows higher CF values in the center of
he deposit and lower CF values towards the edges, which suggests
radial mixing of crater floor material with pyroclastic material.
Table 1 also shows the estimated iron abundance of each de-
osit. The high CF areas within the larger deposits have estimated
ron abundances of up to 30 wt%. The relationship between iron
bundance and CF values was calculated using Apollo samples, and
n that study the sample with the highest iron abundance was Tau-
us Littrow (22.7 FeO wt%; Allen et al., 2012 ). Therefore, the nature
f the relationship between iron abundance and CF value can only
e extrapolated linearly above 22.7 FeO wt%. The pyroclastic glass
eads from the Apollo samples have FeO contents that range from
6.5 to 24.7 wt% ( Delano et al., 1986 ). If the linear extrapolation
bove 22.7 FeO wt% is an accurate representation of the iron and
F correlation, the northwest and south deposits both have areas
f enhanced FeO content that contain more FeO than any other
reviously known lunar pyroclastic glass ( ∼30 wt% and ∼26 wt%,
espectively). The M
3 data support the presence of glass in these
eposits ( Fig. 4 ), and therefore these deposits may contain the
ost iron-rich pyroclastic glass thus far identified on the Moon.
PA shows an iron-enhancement across the basin ( Ohtake et al.,
014 ). It is possible that Oppenheimer crater’s location within the
ron-rich SPA basin contributed to the high iron abundances in the
yroclastic deposits. It is also possible that the thin crust in SPA
asin ( ∼20 km as opposed to 30–50 km thick for the rest of the
oon; Wieczorek et al., 2013 ) meant magma sourced from the
antle spent a shorter amount of time rising through the crust
nd therefore had less time to accumulate less iron-rich country
ock or evolve and preferentially crystallize iron-rich olivine out of
he melt.
.3.3. Classification of pyroclastic deposits based on mineralogy
Previous studies have generally studied pyroclastic deposits
ased on their average spectral character ( e.g. Hawke, 1989; Gad-
is et al., 2003; Jawin et al., 2015 ). A particular strength of this
tudy is that we use spectral parameter maps to determine com-
ositional and mineralogical variations at the sub-deposit level.
sing these mapping techniques, we demonstrate that the min-
ralogy varies between and within pyroclastic deposits in Oppen-
eimer crater. Our results directly address the Lunar Roadmap goal
f “map the extent and composition of lunar pyroclastic deposits,
ncluding their associated crystalline components” ( LEAG, 2011 ).
hese mapping results show that the pyroclastic deposits within
ppenheimer crater can be divided into three groups based on
heir mineralogy: small glass-rich deposits, small to medium de-
osits that are mixtures of CPX and glass, and large deposits with
omplex mineralogy. Furthermore, these mineralogical groups ap-
ear to correlate with the location of the deposits within Oppen-
eimer crater.
In the northeastern portion of Oppenheimer crater, the small
orth and east deposits are both glass-rich. The north deposit ex-
ibits the second highest glass band depths between 5% and 9%,
hile the east deposit exhibits the purest glass signatures (the
ulk of the deposit does not appear to be significantly mixed with
ther minerals). Indeed, the very high 1 μm band centers in the
ast deposit (1.09–1.13 μm) are consistent with lab spectra of mix-
ures containing more than 70–80 wt% glass ( Horgan et al., 2014 ).
hese deposits have CF values that lie roughly in the middle of
ll pyroclastic deposits, 8.27 and 8.26 μm, respectively. The miner-
logy of the east deposit is shown in detail in Fig. 7 . The center
f this deposit is glass-rich, but the edge is a mixture of glass and
rater floor material, OPX and minor CPX. While this deposit shows
vidence of crater floor material mixing with juvenile material, this
oes not necessarily imply that it is a result of Vulcanian activity.
n Vulcanian deposits, the country rock is typically mixed in with
he entire deposit. Jawin et al. (2015) used M
3 data to show that
ome pyroclastic deposits get thinner toward the edge of the de-
osit and the underlying material begins to contribute to the spec-
ral signature. Therefore it is likely that the surface material in the
ast deposit is entirely juvenile glassy material, and the OPX/CPX
ignature at the edge of the deposit is the crater floor being re-
ealed in patches or rough terrain exposed in the thin deposit.
In the southeastern portion of Oppenheimer crater, the south-
ast and south–southeast deposits are mixtures of CPX and glass.
hese deposits have the lowest CF value of all the Oppenheimer
yroclastic deposits: both are 8.25 μm. Fig. 8 shows the detailed
ineralogy and Fig. 9 shows the morphology of the southeast de-
osit. We observe evidence of multiple eruption centers in the
outheast deposit. Fig. 9 shows two locations within the deposit
hat appear to be small, distinct deposits of low albedo mantling
aterial. Thus, the southeast deposit could consist of many small
ruptions that make up the larger deposit. This could explain the
eposit’s irregular shape, as well as some of the many vent-like
raters found within the deposit.
In the western half of Oppenheimer crater, the south, south-
est, and northwest deposits are all heterogeneous in composi-
ion. The south deposit contains OPX, CPX and glass, but there are
ections of the deposit that are glass-rich and sections that are
PX/glass mixtures. The southwest and northwest deposits contain

312 K.A. Bennett et al. / Icarus 273 (2016) 296–314
p
t
h
w
i
o
O
t
o
p
p
p
s
i
c
r
S
p
l
O
e
w
t
6
s
b
fi
p
t
m
f
m
n
p
p
r
v
h
t
t
i
r
p
p
t
e
t
a
d
e
a
v
e
t
h
c
b
h
r
both CPX and glass. These three deposits exhibit the highest CF
values in Oppenheimer crater, 8.28, 8.31, and 8.33 μm. While there
is striping due to noise within the south deposit, there do appear
to be real spectral variations between the main lobe and the east-
ern lobe of the deposit. These spectral variations within the de-
posit correspond to differences in morphology. Fig. 11 shows LROC
visible images of the S deposit. The NAC image in Fig. 11 b shows a
glass-rich area of the deposit and the NAC image in Fig. 11 c shows
a CPX/glass mixture. The glass-rich area is in the center of the de-
posit, is smooth and flat, and does not have many large craters.
In contrast, the area that is a mixture of CPX and glass is at the
eastern edge of the deposit, the pyroclastic material mantles the
local topography, and is associated with a crater, possibly a vent,
along the fracture. Therefore, it is likely that there are at least two
eruptive centers within this deposit.
6.4. Inferred eruption styles
In this section we discuss how the mineralogy of the pyroclastic
deposits in Oppenheimer crater compares to the deposits drawn in
Fig. 2 and how this constrains the eruption styles that likely oc-
curred to emplace each deposit.
The first category of pyroclastic deposits (north and east de-
posits) in Oppenheimer crater is small and glass-rich. We hypoth-
esize that glass-rich areas represent pyroclastic glass beads. There
is no sign of mixing with plug material in these deposits, which
implies that the last stage of an eruption at these vents was a fire
fountaining event. If there was an initial Vulcanian eruption, the
glass-rich deposit completely obscures it in both deposits.
The second category of pyroclastic deposits (southeast and
south–southeast) is mixtures of CPX and glass. We hypothesize
that the CPX in these pyroclastic deposits is likely crystalline ju-
venile material. The CPX could be sourced from the ejection of a
solidified plug in a Vulcanian eruption. Alternatively, crystalline ju-
venile material could be emplaced if molten magma is erupted and
given enough time to crystallize instead of immediately quench-
ing and becoming glass. For example, during a high mass-eruption
rate fire-fountain event in which the eruptive column is optically
thick, magma droplets could crystallize ( Head and Wilson, 1989 ).
Lastly, if the eruption is a fire fountaining or Strombolian event,
large blebs of molten magma can accumulate near the vent and
begin to form a lava flow and crystallize. We have not directly
identified lava flows associated with these pyroclastic deposits, but
in the CPX-rich southeast deposit we have identified several bench
craters ( Fig. 9 d and e). Bench craters are associated with an impact
into layered terrain where less coherent materials overlie more co-
herent materials, such as a regolith covered mare ( Oberbeck and
Quaide, 1967; Quaide and Oberbeck, 1968 ). In the southeast de-
posit, bench craters might indicate that there was an impact into
unconsolidated pyroclastic material or regolith overlying a lava
flow. Indeed, Jozwiak et al. (2015) suggested that a lava flow could
have occurred in the crater associated with the southeast deposit
based on their model of floor-fractured craters. Alternatively, the
bench crater could have resulted from an impact into unconsol-
idated pyroclastic material that overlies a more coherent crater
floor material. Thus, CPX in the southeast deposit could either be
plug material from multiple cycles of Vulcanian eruptions, crys-
talline juvenile material from less energetic fire-fountain eruptions,
or from lava flows. Therefore, the eruption style of these deposits
is less well constrained.
The third category of pyroclastic deposits (south, southwest,
and northwest) is heterogeneous deposits. Since the composition
varies throughout the deposit, it is likely that multiple eruptions
created these deposits. The south deposit shows variation along
the fracture, with fire fountaining likely depositing the bulk of the
smooth, glass-rich pyroclastic material and Vulcanian activity de-
ositing the smaller area that is a mixture of CPX and glassy ma-
erial.
The component that is conspicuously lacking from the Oppen-
eimer pyroclastic deposits is country rock, or crater floor material,
hich is OPX-rich. As shown in Fig. 2 , the presence of country rock
mplies there was Vulcanian activity. However, we only see OPX in
ne pyroclastic deposit, the south deposit, and it is likely that the
PX signatures are coming from the vent wall. Indeed, some of
he strongest OPX signatures we observe are exposed in the wall
f a portion of the source fracture. The lack of country rock within
yroclastic deposits in Oppenheimer crater suggests that these de-
osits were not emplaced by simple Vulcanian eruptions. It is still
ossible that there is plug material in the deposits which would
upport Vulcanian activity, but the lack of country rock most likely
ndicates that there were fire fountaining events that covered the
ountry rock.
In summary, glass-rich deposits contain high abundances of py-
oclastic glass beads, most likely emplaced in fire fountaining or
trombolian-type eruptions. CPX-rich deposits could either contain
lug material from multiple cycles of Vulcanian eruptions, crystal-
ized juvenile material from fire fountaining, or lava flows. Lastly,
PX signatures would indicate country rock/crater floor material
mplaced during a classical Vulcanian eruption, but the fact that
e observe very little OPX within the pyroclastic deposits suggests
hat they were emplaced by other types of eruptions.
.5. Implication for magmatic activity
Vulcanian activity within a floor-fractured crater has been de-
cribed in detail earlier ( Head and Wilson, 1979; Head et al., 20 0 0 ),
ut the occurrence of Vulcanian activity in association with both
re fountaining and Strombolian activity has not previously been
ostulated to explain glass-rich pyroclastic deposits in such a set-
ing. This combination of eruption styles may imply variability in
agma ascent rates. It has been assumed that magma ascending
rom sills under floor-fractured craters is rising slowly, so that the
ass eruption rate is low ( Head and Wilson, 1979 ). In a Vulca-
ian eruption, this leads to a cooled plug and a slow buildup of
ressure beneath it. In this scenario, after the initial violent ex-
losion the eruption would cease quickly once the overpressure is
eleased. However, since we observe large amounts of glass-rich ju-
enile material, some eruption of juvenile magmatic material must
ave occurred. If the source magma volume was sufficiently large,
he eruption mechanism could start with an initial Vulcanian erup-
ion and then shift to a fire fountaining event Such a shift and the
nitial eruption could be triggered by an increase in magma ascent
ate after initial plug formation.
Alternatively, the slow magma ascent rates assumed to be im-
lied by the presence of a sill could still lead to a glass-rich de-
osit. If a plug does not form and magma ascends slowly to reach
he surface, this could conceivably lead to relatively low mass
ruption rate Strombolian activity rather than higher mass erup-
ion rate fire fountaining. Pyroclastic glass beads in Strombolian
ctivity are thought to be formed when bubbles within the con-
uit reach the surface and infinitely expand in the atmosphere-less
nvironment, disrupting the thin surface layer of magma caught
bove the bubble into pyroclasts and ejecting them away from the
ent ( Wilson and Head, 1981 ). However, if these models are under-
stimating sill emplacement or recharge rates and the mass erup-
ion rate of the volcanic activity within Oppenheimer crater was
igh, perhaps due to the thin crust at SPA, then fire fountaining
ould have occurred instead.
These data suggest that multiple styles of eruption, specifically
oth Vulcanian and fire fountaining or Strombolian activity, may
ave occurred within Oppenheimer crater to form the observed py-
oclastic deposits. In some cases ( e.g., the north and east deposits)

K.A. Bennett et al. / Icarus 273 (2016) 296–314 313
w
i
i
e
w
t
m
t
a
h
t
S
t
a
p
w
i
p
w
t
u
T
w
a
f
c
e
b
7
c
u
r
A
t
t
t
S
f
R
A
A
A
A
A
B
B
B
B
C
C
C
C
C
C
D
D
G
G
here there is a single central vent, crater floor material mixed
nto the deposit, and abundant glass produced by fire fountain-
ng or Strombolian activity could have followed an initial Vulcanian
ruption at the same vent. The built-up pressure from trapped gas
ithin a sill under Oppenheimer crater could have caused the ini-
ial Vulcanian explosion and created a path to the surface for the
agma. Once a pathway existed, fire fountaining or Stombolian ac-
ivity would have commenced if there were enough magma still
scending through the fractures.
The possibility of multiple styles of pyroclastic eruptions may
ave been enhanced by the location of Oppenheimer crater within
he relatively thin crust ( ∼20 km; Wieczorek et al. , 2013 ) of the
PA basin because of increased access to magma sources beneath
he fractured crust ( e.g. , Soderblom et al. , 2015 ). This could have
llowed fire fountaining or Strombolian activity to occur for longer
eriods of time as the magma was being replenished. This scenario
ould have resulted in larger, more iron- and glass-rich deposits
n addition to the smaller Vulcanian deposits. New studies of lunar
yroclastic deposits in other geologic settings with these methods
ill be necessary to address these hypotheses further. Also, addi-
ional modeling work that incorporates these results is critical for
nderstanding the ascent and eruption of magma on the Moon.
his will be especially relevant at deposits like the north deposit,
hich has been shown to have a small cone surrounding the vent
nd is glass-rich. These are characteristics of a Hawaiian-style fire
ountaining eruption, but the eruption occurred in a floor fractured
rater setting and created a smaller deposit than has been mod-
led for lunar fire fountaining events. Future modeling efforts will
e necessary to address the new questions raised in this study.
. Conclusions
Our analysis of lunar pyroclastic deposits within Oppenheimer
rater reveals a complex volcanic history and demonstrates the
sefulness of combining mid and near infrared measurements. Our
esults support the following conclusions:
1. By using mapping techniques to analyze mid- and near-infrared
datasets, we were able to analyze localized pyroclastic deposits
in more detail than previous studies. A major result of this
study was that we identified variable mineralogy within and
between pyroclastic deposits in Oppenheimer crater.
2. The pyroclastic deposits within Oppenheimer contain various
ratios of pyroxene (CPX and/or OPX) to iron-rich glass. All the
deposits contain glass; the east and northwest deposit are the
most glass-rich. Many deposits also exhibit strong CPX signa-
tures that may be crystalline juvenile products emplaced dur-
ing the pyroclastic eruptions. No olivine was identified within
Oppenheimer crater, despite its location within the deep South
Pole Aitkin basin.
3. The mineralogic variations between deposits result from a com-
bination of pyroclastic Vulcanian activity (producing glass and
CPX), fire fountaining or Strombolian activity (producing glass),
and possible lava flows related to the latter category of erup-
tions (producing CPX).
4. Morphology from visible images and variable mineralogy
within deposits imply that several of the deposits (south and
southeast) are likely the result of multiple eruption centers.
5. The variability of eruption styles and composition inferred for
these deposits suggests that the eruption mechanics of local py-
roclastic eruptions and the magmatic histories of floor-fractured
craters are more complicated than previously thought.
6. Oppenheimer crater’s location within the SPA basin could have
caused the high iron content of the deposits, and the thin crust
could have enabled magma transport to the surface.
7. From a resource standpoint, the three largest pyroclastic de-
posits within Oppenheimer (northwest, southwest and south)
would be good sites for future exploration. These deposits con-
tain the most iron-rich volcanic glass thus far identified on
the Moon (giving them a high potential to also contain signif-
icant abundances of oxygen), have large areas (the northwest
deposit is large enough to be considered a regional deposit;
< 10 0 0 km
2 ), and are not covered in impact ejecta like the de-
posits on the eastern half of the crater.
cknowledgments
We would like to thank the LRO Diviner and LROC teams and
he M
3 team for providing those datasets. We would also like to
hank Marie McBride for the helpful discussions. Finally, we thank
wo anonymous reviewers for their constructive comments.
upplementary materials
Supplementary material associated with this article can be
ound, in the online version, at doi:10.1016/j.icarus.2016.02.007 .
eferences
dams, J.B., 1974. Visible and near-infrared diffuse reflectance spectra of pyroxenesas applied to remote sensing of solid objects in the Solar System. J. Geophys.
Res. 79, 4 829–4 836. doi: 10.1029/JB079i032p04829 . llen, C.C., Morris, R.V., McKay, D.S., 1996. Oxygen extraction from lunar soils
and pyroclastic glass. J. Geophys. Res. 101 (E11), 26085–26095. doi: 10.1029/
96JE02726 . llen, C.C., Greenhagen, B.T., Donaldson Hanna, K.L., et al., 2012. Analysis of lunar
pyroclastic deposit FeO abundances by LRO Diviner. J. Geophys. Res. 117, 1–12.doi: 10.1029/2011JE0 03982 , E0 0H28 .
rndt, J. , Engelhardt, W.V. , Gonzalez-Cabeza, I. , Meier, B. , 1984. Formation of Apollo15 green glass beads. In: Proceedings of the 15th Lunar and Planetary Science
Conference, pp. C225–C232 .
rndt, J. , Engelhardt, W. , 1987. Formation of Apollo 17 orange and black glass beads.J. Geophys. Res. 92, E372–E376 .
andfield, J.L., et al., 2011. Lunar surface rock abundance and regolith fines temper-atures derived from LRO Diviner Radiometer data. J. Geophys. Res. 116, 1–18.
doi: 10.1029/2011JE0 03866 , E0 0H02 . esse, S.J., et al., 2013. A visible and near-infrared photometric correction for Moon
Mineralogy Mapper (M
3 ). Icarus 222 (1), 229–242. doi: 10.1016/j.icarus.2012.10.
036 . oardman, J.W., et al., 2011. Measuring moonlight: An overview of the spatial prop-
erties, lunar coverage, selenolocation, and related Level 1B products of theMoon Mineralogy Mapper. J. Geophys. Res. 116, 1–15. doi: 10.1029/2010JE003730 ,
E00G14 . urns, J.O., Kring, D.A., Hopkins, J.B., et al., 2013. A lunar L2-Farside exploration and
science mission concept with the Orion Multi-Purpose Crew Vehicle and a tele-
operated lander/rover. Adv. Space Res. 52 (2), 306–320. doi: 10.1016/j.asr.2012.11.016 .
ampbell, B.A., Hawke, B.R., Morgan, G.A., 2014. Improved discrimination of volcaniccomplexes, tectonic features, and regolith properties in Mare Serenitatis from
Earth-based radar mapping. J. Geophys. Res.: Planets 119, 313–330. doi: 10.1002/(ISSN)2169-9100 .
arter, L.M., Campbell, B.A., Hawke, B.R., et al., 2009. Radar remote sensing of pyro-
clastic deposits in the southern Mare Serenitatis and Mare Vaporum regions ofthe Moon. J. Geophys. Res. 114 (E11), 1–12. doi: 10.1029/20 09JE0 03406 , E110 04 .
hristensen, P.R. , Engle, E. , Anwar, S. , et al. , 2009. JMARS – A planetary GIS. In: Pro-ceedings of the AGU Fall Meeting, Abstract #IN22A-06 .
lark, R. , Roush, T. , 1984. Reflectance spectroscopy: Quantitative analysis techniquesfor remote sensing applications. J. Geophys. Res. 89, 6329–6340 .
lark, R.N., Pieters, C.M., Green, R.O., et al., 2011. Thermal removal from near-
infrared imaging spectroscopy data of the Moon. J. Geophys. Res. 116, 1–9.doi: 10.1029/2010JE0 03751 , E0 0G16 .
loutis, E.A., Gaffey, M.J., 1991. Spectral-compositional variations in the constituentminerals of mafic and ultramafic assemblages and remote sensing implications.
Earth Moon Planets 53, 11–53. doi: 10.10 07/BF0 0116217 . elano, J.W. , 1986. Pristine lunar glasses: Criteria, data, and implications. J. Geophys.
Res. 16, D201–D213 . undas, C.M., McEwen, A.S., 2007. Rays and secondary craters of Tycho. Icarus 186
(1), 31–40. doi: 10.1016/j.icarus.2006.08.011 .
addis, L.R. , Pieters, C.M. , Ray Hawke, B. , 1985. Remote sensing of lunar pyroclasticmantling deposits. Icarus 61 (3), 461–489 .
addis, L.R. , Hawke, B.R. , Robinson, M.S. , et al. , 20 0 0. Compositional analyses ofsmall lunar pyroclastic deposits using Clementine multispectral data. J. Geophys.
Res . 105 (E2), 4245–4262 .
314 K.A. Bennett et al. / Icarus 273 (2016) 296–314
J
J
K
L
M
N
O
P
P
P
Q
R
S
S
S
S
T
V
W
W
W
Gaddis, L.R., Staid, M.I., Tyburczy, J.A., et al., 2003. Compositional analyses of lu-nar pyroclastic deposits. Icarus 161 (2), 262–280. doi: 10.1016/S0019-1035(02)
0 0 036-2 . Gaddis, L.R. , Weller, L. , Barret, J. , et al. , 2013. “New” volcanic features in lunar floor-
fractured Oppenheimer crater. In: Proceedings of the 44th Lunar and PlanetaryScience Conference, p. p. 2262 .
Glotch, T.D., Lucey, P.G., Bandfield, J.L., et al., 2010. Highly Silicic Compositions onthe Moon. Science 329 (5998), 1510–1513. doi: 10.1126/science.1192148 .
Green, R.O., Pieters, C., Mouroulis, P., et al., 2011. The Moon Mineralogy Mapper
imaging spectrometer for lunar science: Instrument description, calibration, on-orbit measurements, science data calibration and on-orbit validation. J. Geophys.
Res. 116, 1–31. doi: 10.1029/2011JE0 03797 , E0 0G19 . Greenhagen, B.T., Lucey, P.G., Wyatt, M.B., et al., 2010. Global silicate mineralogy of
the Moon from the Diviner Lunar Radiometer. Science 329 (5998), 1507–1509.doi: 10.1126/science.1192196 .
Gustafson, J.O., Bell III, J.F., Gaddis, L.R., et al., 2012. Characterization of previ-
ously unidentified lunar pyroclastic deposits using Lunar Reconnaissance Or-biter Camera data. J. Geophys. Res. 117 (E12), 1–21. doi: 10.1029/2011JE003893 ,
E00H25 . Hauri, E.H., Weinreich, T., Saal, A.E., et al., 2011. High pre-eruptive water contents
preserved in lunar melt inclusions. Science 333 (6039), 213–215. doi: 10.1126/science.1204626 .
Hauri, E.H., Saal, A.E., Rutherford, M.J., et al., 2015. Water in the Moon’s interior:
Truth and consequences. Earth Planet. Sci. Lett. 409 (C), 252–264. doi: 10.1016/j.epsl.2014.10.053 .
Hawke, B.R. , Coombs, C.R. , Gaddis, L.R. , et al. , 1989. Remote sensing and geologicstudies of localized dark mantle deposits on the moon. In: Proceedings of the
20th Lunar and Planetary Science Conference, pp. 255–268 . Hawke, B.R. , Coombs, C.R. , Clark, B. , 1990. Ilmenite-rich pyroclastic deposits: An
ideal lunar resource. In: Proceedings of the 20th Lunar and Planetary Science
Conference, pp. 249–258 . Hawke, B.R., Blewett, D.T., Lucey, P.G., et al., 2004. The origin of lunar crater rays.
Icarus 170 (1), 1–16. doi: 10.1016/j.icarus.2004.02.013 . Head, J.W. , 1974. Lunar dark-mantle deposits – Possible clues to the distribution
of early mare deposits. In: Proceedings of the 5th Lunar and Planetary ScienceConference, pp. 207–222 .
Head III, J.W. , Wilson, L. , 1979. Alphonsus-type dark-halo craters – Morphology,
morphometry and eruption conditions. In: Proceedings of the 5th Lunar andPlanetary Science Conference, pp. 2861–2897 .
Head, J.W. , Wilson, L. , 1989. Basaltic pyroclastic eruptions: influence of gas-releasepatterns and volume fluxes on fountain structure, and the formation of cinder
cones, spatter cones, rootless flows, lava ponds and lava flows. J. Volcan. Geoth.Res. 37 (3), 261–271 .
Head III, J.W. , Wilson, L. , Pieters, C.M. , 20 0 0. Pyroclastic eruptions associated with
the floor-fractured lunar farside crater Oppenheimer in the South Pole AitkenBasin. In: Proceedings of the 31st Lunar and Planetary Science Conference,
p. 1280 . Heiken, G.H. , McKay, D.S. , Brown, R.W. , 1974. Lunar deposits of possible pyroclastic
origin. Geochim. Cosmochim. Acta 38, 1703–1718 . Hicks, M.D., Buratti, B.J., Nettles, J., et al., 2011. A photometric function for analysis
of lunar images in the visual and infrared based on Moon Mineralogy Mapperobservations. J. Geophys. Res. 116 (E12), E00G15. doi: 10.1029/2010JE003733 .
Hiesinger, H., Jaumann, R., Neukum, G., et al., 20 0 0. Ages of mare basalts on
the lunar nearside. J. Geophys. Res. 105 (E12), 29239–29275. doi: 10.1029/20 0 0JE0 01244 .
Hiesinger, H. , Van Der Bogert, C.H. , Jolliff, B.L. , et al. , 2012. Stratigraphy of the SouthPole–Aitken Basin based on crater size-frequency distribution measurements.
In: Proceedings of the GSA Annual Meeting, GSA #30953-212430 . Horgan, B.H.N., Cloutis, E.A., Mann, P., et al., 2014. Near-infrared spectra of ferrous
mineral mixtures and methods for their identification in planetary surface spec-
tra. Icarus 234 (C), 132–154. doi: 10.1016/j.icarus.2014.02.031 .
awin, E.R., Besse, S., Gaddis, L.R., et al., 2015. Examining spectral variations in lo-calized lunar dark mantle deposits. J. Geophys. Res.: Planets 120, 1310–1331.
doi: 10.10 02/2014JE0 04759 . ozwiak, L.M., Head, J.W., Wilson, L., 2015. Lunar floor-fractured craters as magmatic
intrusions: Geometry, modes of emplacement, associated tectonic and volcanicfeatures, and implications for gravity anomalies. Icarus 248 (C), 424–447. doi: 10.
1016/j.icarus.2014.10.052 . lima, R.L., Dyar, D.M., Pieters, C.M., 2011. Near-Infrared spectra of clinopyroxenes:
Effects of calcium content and crystal structure. Meteor. Planet. Sci. 46, 379–
395. doi: 10.1111/j.1945-5100.2010.01158 . unar Exploration Analysis Group , 2011. The Lunar Exploration Roadmap: Exploring
the Moon in the 21st Century: Themes, Goals, Objectives, Investigations, andPriorities. Lunar Exploration Analysis Group .
cEwen, A.S. , Robinson, M.S. , 1997. Mapping of the Moon by Clementine. Adv. SpaceRes. 19 (10), 1523–1533 .
ozette, S., 1995. The Clementine mission: Past, present, and future. Acta Astronau-
tica 35 (Suppl. 1), S161–S169. doi: 10.1016/0094-5765(94)00181-K . berbeck, V.R. , Quaide, W.L. , 1967. Estimated thickness of a fragmental surface layer
of Oceanus Procellarum. J. Geophys. Res 72 (18), 4697–4704 . Ohtake, M., Uemoto, K., Yokota, Y., et al., 2014. Geologic structure generated by
large-impact basin formation observed at the South Pole–Aitken basin on theMoon. Geophys. Res. Lett. 41 (8), 2738–2745. doi: 10.10 02/(ISSN)1944-80 07 .
aige, D.A., Foote, M.C., Greenhagen, B.T., et al., 2009. The Lunar Reconnaissance
Orbiter Diviner Lunar Radiometer Experiment. Space Sci. Rev. 150 (1–4), 125–160. doi: 10.10 07/s11214-0 09-9529-2 .
Petro, N.E. , Gaddis, L.R. , Staid, M.I. , 2001. Analysis of the Oppenheimer pyroclasticdeposits using Clementine UVVIS data. LPSC 32 #1953 .
ieters, C.M. , McCord, T.B. , Charette, M.P. , et al. , 1974. Lunar surface: Identificationof the dark mantling material in the Apollo 17 soil samples. Science 183, 1191–
1194 .
ieters, C.M. , Boardman, J. , Buratti, B. , et al. , 2009. The Moon mineralogy mapper(M
3 ) on Chandrayaan-1. Curr. Sci 96 (4), 500–505 .
uaide, W.L. , Oberbeck, V.R. , 1968. Thickness determinations of the lunar surfacelayer from lunar impact craters. J. Geophys. Res. 73 (16), 5247–5270 .
obinson, M.S. , Brylow, S.M. , Tschimmel, M. , et al. , 2010. Lunar Reconnaissance Or-biter Camera (LROC) instrument overview. Space Sci. Rev. 150 (1–4), 81–124 .
chultz, P.H. , 1976. Floor-fractured lunar craters. Moon 15 (3–4), 241–273 .
Shearer, C.K., Papike, J.J., 1993. Basaltic magmatism on the Moon: A perspectivefrom volcanic picritic glass beads. Geochim. Cosmochim. Acta 57 (19), 4785–
4812. doi: 10.1016/0016- 7037(93)90200- G . mith, D.E., Zuber, M.T., Jackson, G.B., et al., 2010. The Lunar Orbiter Laser Altimeter
investigation on the Lunar Reconnaissance Orbiter Mission. Space Sci. Rev. 150(1–4), 209–241. doi: 10.10 07/s11214-0 09-9512-y .
oderblom, J.M. , Evans, A.J. , Johnson, B.C. , et al. , 2015. The fractured Moon: Produc-
tion and saturation of porosity in the lunar highlands from impact cratering.Geophys. Res. Lett. 42, 6939–6944 .
unshine, J.M. , Pieters, C.M. , 1993. Estimating modal abundances from the spectra ofnatural and laboratory pyroxene mixtures using the modified Gaussian model.
J. Geophys. Res. 98 (E5), 9075–9087 . rang, D., Lucey, P.G., Gillis-Davis, J.J., et al., 2013. Near-infrared optical constants
of naturally occurring olivine and synthetic pyroxene as a function of mineralcomposition. J. Geophys. Res.: Planets 118, 708–732. doi: 10.10 02/jgre.20 072 .
asavada, A.R., Bandfield, J.L., Greenhagen, B.T., et al., 2012. Lunar equatorial surface
temperatures and regolith properties from the Diviner Lunar Radiometer Ex-periment. Journal of Geophysical Research 117, 1–12. doi: 10.1029/2011JE003987 ,
E00H18 . ieczorek, M.A ., Neumann, G.A ., Nimmo, F., et al., 2013. The crust of the Moon as
seen by GRAIL. Science 339, 671–675. doi: 10.1126/science.1231530 . ilhelms, D.E. , 1987. The Geologic History of the Moon. United States Geological
Survey Professional Paper 1348 .
ilson, L. , Head III, J.W. , 1981. Ascent and eruption of basaltic magma on the Earthand Moon. J. Geophys. Res. 86 (B4), 2971–3001 .