complex modulation of androgen responsive gene expression
TRANSCRIPT
RESEARCH Open Access
Complex modulation of androgen responsivegene expression by methoxyacetic acidGargi Bagchi†, Yijing Zhang†, Kerri A Stanley and David J Waxman*
Abstract
Background: Optimal androgen signaling is critical for testicular development and spermatogenesis.Methoxyacetic acid (MAA), the primary active metabolite of the industrial chemical ethylene glycol monomethylether, disrupts spermatogenesis and causes testicular atrophy. Transcriptional trans-activation studies have indicatedthat MAA can enhance androgen receptor activity, however, whether MAA actually impacts the expression ofandrogen-responsive genes in vivo, and which genes might be affected is not known.
Methods: A mouse TM3 Leydig cell line that stably expresses androgen receptor (TM3-AR) was prepared andanalyzed by transcriptional profiling to identify target gene interactions between MAA and testosterone on aglobal scale.
Results: MAA is shown to have widespread effects on androgen-responsive genes, affecting processes rangingfrom apoptosis to ion transport, cell adhesion, phosphorylation and transcription, with MAA able to enhance, aswell as antagonize, androgenic responses. Moreover, testosterone is shown to exert both positive and negativeeffects on MAA gene responses. Motif analysis indicated that binding sites for FOX, HOX, LEF/TCF, STAT5 and MEF2family transcription factors are among the most highly enriched in genes regulated by testosterone and MAA.Notably, 65 FOXO targets were repressed by testosterone or showed repression enhanced by MAA withtestosterone; these include 16 genes associated with developmental processes, six of which are Hox genes.
Conclusions: These findings highlight the complex interactions between testosterone and MAA, and provideinsight into the effects of MAA exposure on androgen-dependent processes in a Leydig cell model.
BackgroundAndrogen signaling is critical for development of themale sexual phenotype, maturation of secondary sexcharacteristics and maintenance of muscle mass andbone density [1]. Disruption of androgen signaling canlead to a spectrum of developmental problems in malesexual characteristics and reproductive behavior [2].Androgen action is mediated by androgen binding toandrogen receptor (AR), a ligand-activated transcriptionfactor that binds genomic regulatory elements associatedwith androgen responsive genes [3]. AR binding sites areoften far (>10 kb) from transcription start sites ofandrogen-regulated genes, and many AR binding sitescontain non-canonical androgen response elements[4-6]. Many transcription factors interact with AR,
including GATA factors [7], STAT5 [8], NF1 and SP1[9], which can increase AR transcriptional activity, aswell as Forkhead proteins [10-12], P53 [13] and LEF/TCF factors [14], which are reported to exert bothrepression and enhancement of AR transcriptional activ-ity. Some of these effects may involve local interactions,as binding sites for GATA and Forkhead, as well asOCT family factors are often enriched nearby AR bind-ing sites [4-6]. These findings suggest that physiologicalor pathophysiological conditions that affect the expres-sion or activity of AR-interacting transcription factorssuch as these may impact AR activity.Many foreign chemicals can modulate AR activity;
these include drugs and environmental chemicals thatbind directly to AR and antagonize its transcriptionalactivity [15,16]. AR activity can also be modulated byforeign chemicals that exert effects on AR indirectly, viaintracellular signaling [17,18]. One example is methox-yacetic acid (MAA), a testicular toxicant and the
* Correspondence: [email protected]† Contributed equallyDivision of Cell and Molecular Biology, Department of Biology, BostonUniversity, Boston, MA 02215, USA
Bagchi et al. Reproductive Biology and Endocrinology 2011, 9:42http://www.rbej.com/content/9/1/42
© 2011 Bagchi et al; licensee BioMed Central Ltd. This is an Open Access article distributed under the terms of the Creative CommonsAttribution License (http://creativecommons.org/licenses/by/2.0), which permits unrestricted use, distribution, and reproduction inany medium, provided the original work is properly cited.
primary, active metabolite of the industrial chemicalethylene glycol monomethyl ether [19,20]. MAAenhances the transcriptional activity of several nuclearreceptors [21,22], including AR [19,22-24], by a mechan-ism that involves tyrosine kinase activity and requiresPI3-kinase signaling [22]. The inappropriate enhance-ment of AR transcriptional activity by MAA could con-tribute to the testicular toxicity associated with MAAexposure, given the importance of AR in somatic cellsof the testis for spermatocyte survival [25].Earlier studies of the potentiation of AR transcrip-
tional activity by MAA used AR reporter gene assays todemonstrate enhancement of androgen response [22].However, while reporter gene assays are an importanttool for studying gene regulation, transfected reportergene constructs do not always reflect the regulation ofendogenous genes in untransfected cells in vivo. More-over, in the case of MAA, artefactual effects on theCMV promoter used in one study to express estrogenreceptor required for reporter gene activity werereported [26]. It is therefore important to determine theeffects of MAA on the expression of endogenous andro-gen responsive genes to determine whether MAA can,indeed, potentiate androgen responses, to identify thespecific genes whose expression is affected, and to eluci-date the nature and extent of interactions betweenMAA and androgen, both positive and negative.In this study, we develop an androgen-responsive mouse
testicular Leydig cell line, TM3-AR, and use it to investigatethe impact of MAA on androgen responsive gene expres-sion by global transcriptional profiling. Our findings revealthat MAA alters the expression of large numbers of testos-terone-responsive genes. We also find that the androgenicenvironment can influence the effects of MAA on geneexpression, with many examples of both stimulatory andinhibitory interactions between MAA and testosterone.Motif analysis identified binding sites for transcription fac-tors whose putative targets are enriched in genes showingeither positive or negative interactions between MAA andtestosterone, providing further insight into the mechanismsthat govern these gene interactions. Enriched micro-RNAbinding sites in the 3’-untranslated region (3’-UTR) of tar-get genes were also identified. These findings demonstratethat the impact of MAA on androgen gene responses iscomplex and suggest target genes and pathways throughwhich MAA may exert toxicity to somatic cells of the testis.
MethodsChemicals and reagentsMAA, horse serum and testosterone were purchasedfrom Sigma Chemical Co, St. Louis, MO. DMEM-F12culture medium, fetal bovine serum (FBS), HEPES bufferand TRIzol reagent were purchased from InvitrogenCorp. (Carlsbad, CA).
Cell culture and TM3-AR cell preparationMouse TM3 Leydig cells and LNCaP cells were obtainedfrom American Type Culture Collection, Manassas, VA.TM3 and TM3-AR cells (see below) were grown inDMEM-F12 medium containing 5% horse serum and2.5% FBS. LNCaP cells were maintained in RPMI 1640containing 10% FBS. RNA was isolated using TRIzolreagent using the manufacturer’s protocol. Mouse TM3cells stably expressing human AR cDNA were preparedby retroviral infection of TM3 cells, as follows. The cod-ing sequence of AR was excised from plasmid pSV-ARO(Dr. A.O. Brinkmann, University Medical Center Rotter-dam, The Netherlands) and subcloned by blunt end liga-tion into the retroviral plasmid vector pWZL-Blast (Dr.D. White, Millenium Pharmaceuticals, Cambridge MA)to yield pWZL-Blast-AR. pWZL-Blast is based on thepBabe plasmid [27] and encodes a blasticidin-resistancegene transcribed from the retroviral long terminalrepeat. Retroviral particles were generated as described[28] by transfecting the packaging cell line HEK293 withpWZL-Blast-AR. Culture medium containing retroviralparticles was collected 48 h later and applied to TM3cells. Pools of blasticidin-resistant cells were selected for4 days using blasticidin S-hydrochloride and then veri-fied as expressing AR by qPCR.To obtain samples for microarray analysis, TM3-AR cells
were treated for 24 hr with either testosterone (10 nM) orMAA (5 mM), or with testosterone in combination withMAA. The concentration of testosterone was chosen tosaturate AR, and the concentration of MAA was chosenbased on considerations described in our earlier studies[22,29], and based on its correspondence to the plasmaconcentration associated with ethylene glycol monomethylether-induced germ cell toxicity in mice [30]. The concen-tration of MAA used did not alter the cell growth rate orcause any loss of cell viability over the course of at least 48hr. RNA was isolated and validated by RNA integrity num-ber >8.5, as determined using an Agilent Bioanalyzer 2100instrument (Agilent Technologies, Santa Clara, CA).
qPCRTotal RNA isolated from treated or untreated culturedcells was incubated with RQ1 RNAse-free DNAse for 1h at 37°C followed by heating at 75°C for 5 min. cDNAsynthesis and qPCR analysis using SYBR Green I-basedchemistry were performed as described [31]. Dissocia-tion curves were examined after each qPCR run toensure amplification of a single, specific product. qPCRprimers were designed using Primer Express software(Applied Biosystems) and are shown in Additional file 1,Table S1. Relative RNA levels were calculated after nor-malization to the 18S rRNA content of each sampleusing the comparative Ct method, under conditionswhere the Ct number is in its log2 linear range.
Bagchi et al. Reproductive Biology and Endocrinology 2011, 9:42http://www.rbej.com/content/9/1/42
Page 2 of 14
Microarray analysisEach RNA sample used for microarray analysis was apool prepared from three independent TM3-AR cell cul-tures (three different passages), each treated as describedabove. Two such pools of TM3-AR cell RNA (represent-ing a total of 5 independent treated cell cultures) wereprepared and used in two independent sets of microar-rays, each of which represented 3 of the 5 independentcultures. Each set of microarrays was comprised of fourseparate competitive hybridization arrays (i.e., fourmicroarray experiments): testosterone vs. control, MAAvs. control, testosterone + MAA vs. testosterone, andtestosterone + MAA vs. MAA. This approach, employ-ing pools of biological replicates, minimizes the impactof culture-to-culture variations that are unrelated to thetreatments per se. cDNAs transcribed from each pooledRNA sample were labeled with Alexa 647 or Alexa 555dyes in a fluorescent reverse pair design (dye swap) forcompetitive hybridization to Agilent Whole GenomeMouse Microarrays (Agilent Technology, array platformG4122F). Sample labeling, hybridization to microarrays,scanning, analysis of TIFF images using Agilent’s featureextraction software, calculation of linear and LOWESSnormalized expression ratios and p-value calculationusing Rosetta Resolver (version 5.1, Rosetta Biosoftware)were carried out as described [32,33]. For dye swappingexperiments, the Alexa 555-labeled RNA from one ofthe treatment conditions (testosterone and/or MAAtreated) was mixed with Alexa 647-labeled RNA for theappropriate reference control (as specified above), andvice versa. Features flagged as saturated in both fluores-cence channels or flagged as non-uniformity outliers ineither channel were excluded from analysis. The full setof normalized expression ratios and p-values is availableat the Gene Expression Omnibus web site of NCBI [34]as GEO series GSE27410.
Microarray annotation and statistical analysisAgilent mouse microarray G4122F contains 41,174mouse probes (features), each 60-nt in length. Accessionnumbers were obtained for 39,355 out of the 41,174probes, of which 33,011 were assigned gene names. Anadditional 3,570 probes were assigned gene names usingthe microarray probe annotation tool AILUN [35], whichmaps microarray probes to Entrez genes. Each probe cor-responding to a distinct mouse transcript is referred to asrepresenting a separate gene/gene product. For eachmicroarray probe, a mean fold-change and p-value wascalculated based on the set of microarray expressionratios using the Rosetta Resolver-based error model [32].The error model uses technology-specific data para-meters to stabilize intensity variation estimates, alongwith error-weighted averaging of replicates. Thisapproach has been demonstrated to provide an effective
increase in statistical power [32]. The statistical signifi-cance of differential expression of each gene was deter-mined by application of a filter (p < 0.005) to theRosetta-generated p-values. Next, a |fold-change| filter of>2-fold was combined with the above p-value filter todetermine the number of probes that were differentiallyregulated in any of the four microarray experiments. Intotal, 6,416 probes met the combined thresholds for dif-ferential expression (|fold-change| >2) and statistical sig-nificance (p < 0.005) in at least one of the fourexperiments. In those cases where two or more differen-tially expressed probes mapped to the same gene andgave the same pattern of expression across all fourmicroarrays (reflecting probe redundancy in the arrayplatform), a single representative probe was retained inthe final data set. A total of 884 redundant probes werethus eliminated, giving a total of 5,532 non-redundantprobes that met the threshold criteria for both differentialexpression (|fold-change| >2) and statistical significance(p < 0.005) in at least one of the four experiments (Addi-tional file 2, Table S2A). The number of probes expectedto meet the combined threshold by chance is 0.005 ×6,416, or 32 probes. The actual number of probes meet-ing the combined threshold was 7,811, corresponding toan apparent false discovery rate of 32/7,811, or 0.41%.Commonly used multiple testing correction methodssuch as Bonferroni or Holm step-down were not appliedas these eliminate a large number of true positives andintroduce an inappropriate overcorrection.A system of binary and decimal flags, termed total flag
sum (TFS), was used to cluster the differentially regulatedgenes into subgroups based on their patterns of expres-sion across the four microarray experiments [36]. Briefly,all genes that met the above fold-change and p-valuethreshold criteria for one or more of the four microarrayexperiments were assigned a binary flag value of 1, 2, 4and 8 respectively. The sum of these binary flag valuesdefines the whole number portion of the flag assigned toeach gene and indicates which of the four microarraysmet the specified threshold criteria in our analysis. Inaddition, decimal values of 0.1, 0.01, 0.001 and 0.0001, or0.2, 0.02, 0.002, and 0.0002 were respectively assigned toeach of the four microarrays to indicate the direction ofregulation of the genes in the array (decimal flags withvalues of 1 indicate up-regulation, whereas those with avalue of 2 indicate down-regulation). Thus, for eachgene, the TFS group designation, comprising the binarysum plus the decimal values, indicates which of the fourarrays met the threshold criteria for inclusion and thedirection of regulation, as outlined in Additional file 2,Table S2B. As an example, the 472 genes in TFS group9.1001 (see Table 1, below) all meet the combinedthreshold for up regulated expression in array experi-ments 1 and 4 (testosterone vs. control, and testosterone
Bagchi et al. Reproductive Biology and Endocrinology 2011, 9:42http://www.rbej.com/content/9/1/42
Page 3 of 14
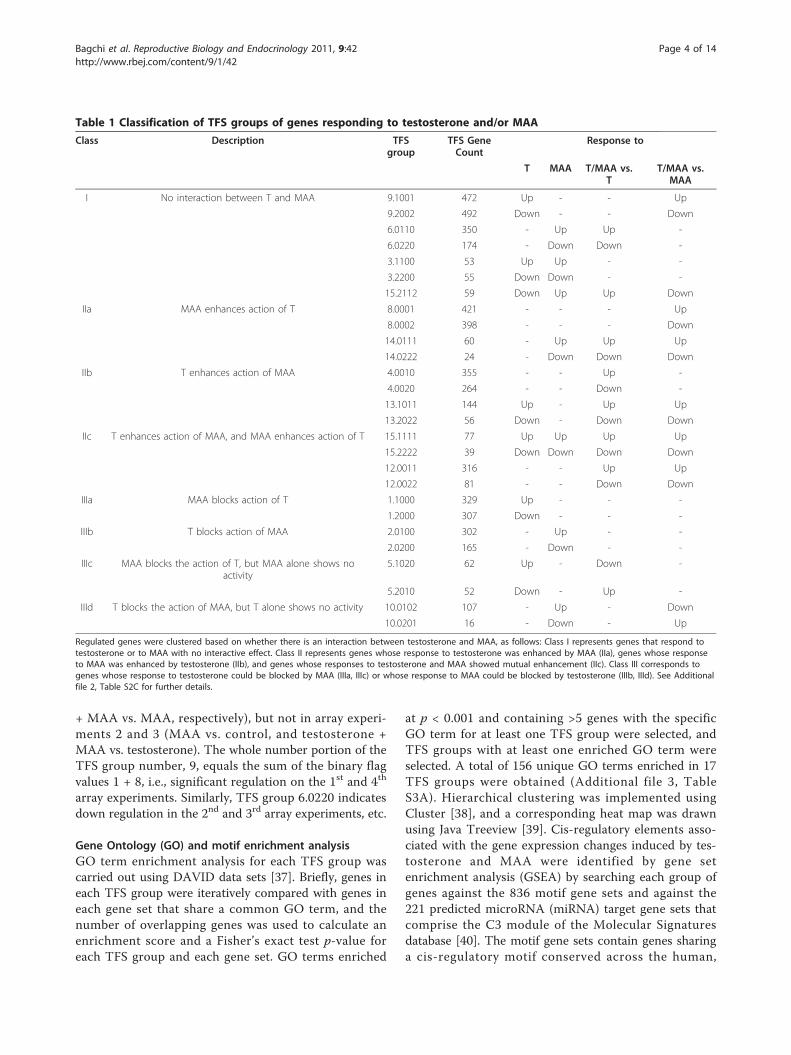
+ MAA vs. MAA, respectively), but not in array experi-ments 2 and 3 (MAA vs. control, and testosterone +MAA vs. testosterone). The whole number portion of theTFS group number, 9, equals the sum of the binary flagvalues 1 + 8, i.e., significant regulation on the 1st and 4th
array experiments. Similarly, TFS group 6.0220 indicatesdown regulation in the 2nd and 3rd array experiments, etc.
Gene Ontology (GO) and motif enrichment analysisGO term enrichment analysis for each TFS group wascarried out using DAVID data sets [37]. Briefly, genes ineach TFS group were iteratively compared with genes ineach gene set that share a common GO term, and thenumber of overlapping genes was used to calculate anenrichment score and a Fisher’s exact test p-value foreach TFS group and each gene set. GO terms enriched
at p < 0.001 and containing >5 genes with the specificGO term for at least one TFS group were selected, andTFS groups with at least one enriched GO term wereselected. A total of 156 unique GO terms enriched in 17TFS groups were obtained (Additional file 3, TableS3A). Hierarchical clustering was implemented usingCluster [38], and a corresponding heat map was drawnusing Java Treeview [39]. Cis-regulatory elements asso-ciated with the gene expression changes induced by tes-tosterone and MAA were identified by gene setenrichment analysis (GSEA) by searching each group ofgenes against the 836 motif gene sets and against the221 predicted microRNA (miRNA) target gene sets thatcomprise the C3 module of the Molecular Signaturesdatabase [40]. The motif gene sets contain genes sharinga cis-regulatory motif conserved across the human,
Table 1 Classification of TFS groups of genes responding to testosterone and/or MAA
Class Description TFSgroup
TFS GeneCount
Response to
T MAA T/MAA vs.T
T/MAA vs.MAA
I No interaction between T and MAA 9.1001 472 Up - - Up
9.2002 492 Down - - Down
6.0110 350 - Up Up -
6.0220 174 - Down Down -
3.1100 53 Up Up - -
3.2200 55 Down Down - -
15.2112 59 Down Up Up Down
IIa MAA enhances action of T 8.0001 421 - - - Up
8.0002 398 - - - Down
14.0111 60 - Up Up Up
14.0222 24 - Down Down Down
IIb T enhances action of MAA 4.0010 355 - - Up -
4.0020 264 - - Down -
13.1011 144 Up - Up Up
13.2022 56 Down - Down Down
IIc T enhances action of MAA, and MAA enhances action of T 15.1111 77 Up Up Up Up
15.2222 39 Down Down Down Down
12.0011 316 - - Up Up
12.0022 81 - - Down Down
IIIa MAA blocks action of T 1.1000 329 Up - - -
1.2000 307 Down - - -
IIIb T blocks action of MAA 2.0100 302 - Up - -
2.0200 165 - Down - -
IIIc MAA blocks the action of T, but MAA alone shows noactivity
5.1020 62 Up - Down -
5.2010 52 Down - Up -
IIId T blocks the action of MAA, but T alone shows no activity 10.0102 107 - Up - Down
10.0201 16 - Down - Up
Regulated genes were clustered based on whether there is an interaction between testosterone and MAA, as follows: Class I represents genes that respond totestosterone or to MAA with no interactive effect. Class II represents genes whose response to testosterone was enhanced by MAA (IIa), genes whose responseto MAA was enhanced by testosterone (IIb), and genes whose responses to testosterone and MAA showed mutual enhancement (IIc). Class III corresponds togenes whose response to testosterone could be blocked by MAA (IIIa, IIIc) or whose response to MAA could be blocked by testosterone (IIIb, IIId). See Additionalfile 2, Table S2C for further details.
Bagchi et al. Reproductive Biology and Endocrinology 2011, 9:42http://www.rbej.com/content/9/1/42
Page 4 of 14
mouse, rat, and dog genomes, and the motifs representknown or likely transcription factor binding sites in a 4kb genomic region centered on the transcription startsite of each gene. The miRNA target gene sets are com-prised of genes with the corresponding miRNA bindingsites present in 3’-UTR sequences.
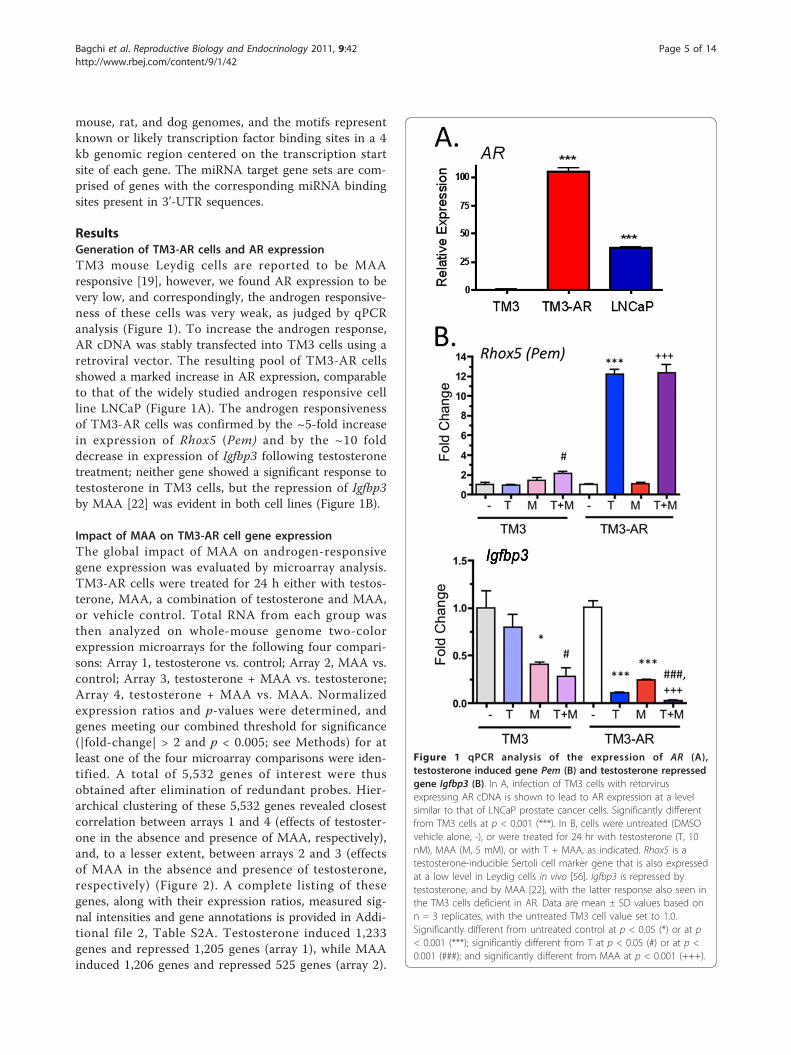
ResultsGeneration of TM3-AR cells and AR expressionTM3 mouse Leydig cells are reported to be MAAresponsive [19], however, we found AR expression to bevery low, and correspondingly, the androgen responsive-ness of these cells was very weak, as judged by qPCRanalysis (Figure 1). To increase the androgen response,AR cDNA was stably transfected into TM3 cells using aretroviral vector. The resulting pool of TM3-AR cellsshowed a marked increase in AR expression, comparableto that of the widely studied androgen responsive cellline LNCaP (Figure 1A). The androgen responsivenessof TM3-AR cells was confirmed by the ~5-fold increasein expression of Rhox5 (Pem) and by the ~10 folddecrease in expression of Igfbp3 following testosteronetreatment; neither gene showed a significant response totestosterone in TM3 cells, but the repression of Igfbp3by MAA [22] was evident in both cell lines (Figure 1B).
Impact of MAA on TM3-AR cell gene expressionThe global impact of MAA on androgen-responsivegene expression was evaluated by microarray analysis.TM3-AR cells were treated for 24 h either with testos-terone, MAA, a combination of testosterone and MAA,or vehicle control. Total RNA from each group wasthen analyzed on whole-mouse genome two-colorexpression microarrays for the following four compari-sons: Array 1, testosterone vs. control; Array 2, MAA vs.control; Array 3, testosterone + MAA vs. testosterone;Array 4, testosterone + MAA vs. MAA. Normalizedexpression ratios and p-values were determined, andgenes meeting our combined threshold for significance(|fold-change| > 2 and p < 0.005; see Methods) for atleast one of the four microarray comparisons were iden-tified. A total of 5,532 genes of interest were thusobtained after elimination of redundant probes. Hier-archical clustering of these 5,532 genes revealed closestcorrelation between arrays 1 and 4 (effects of testoster-one in the absence and presence of MAA, respectively),and, to a lesser extent, between arrays 2 and 3 (effectsof MAA in the absence and presence of testosterone,respectively) (Figure 2). A complete listing of thesegenes, along with their expression ratios, measured sig-nal intensities and gene annotations is provided in Addi-tional file 2, Table S2A. Testosterone induced 1,233genes and repressed 1,205 genes (array 1), while MAAinduced 1,206 genes and repressed 525 genes (array 2).
Figure 1 qPCR analysis of the expression of AR (A),testosterone induced gene Pem (B) and testosterone repressedgene Igfbp3 (B). In A, infection of TM3 cells with retorvirusexpressing AR cDNA is shown to lead to AR expression at a levelsimilar to that of LNCaP prostate cancer cells. Significantly differentfrom TM3 cells at p < 0.001 (***). In B, cells were untreated (DMSOvehicle alone, -), or were treated for 24 hr with testosterone (T, 10nM), MAA (M, 5 mM), or with T + MAA, as indicated. Rhox5 is atestosterone-inducible Sertoli cell marker gene that is also expressedat a low level in Leydig cells in vivo [56]. Igfbp3 is repressed bytestosterone, and by MAA [22], with the latter response also seen inthe TM3 cells deficient in AR. Data are mean ± SD values based onn = 3 replicates, with the untreated TM3 cell value set to 1.0.Significantly different from untreated control at p < 0.05 (*) or at p< 0.001 (***); significantly different from T at p < 0.05 (#) or at p <0.001 (###); and significantly different from MAA at p < 0.001 (+++).
Bagchi et al. Reproductive Biology and Endocrinology 2011, 9:42http://www.rbej.com/content/9/1/42
Page 5 of 14
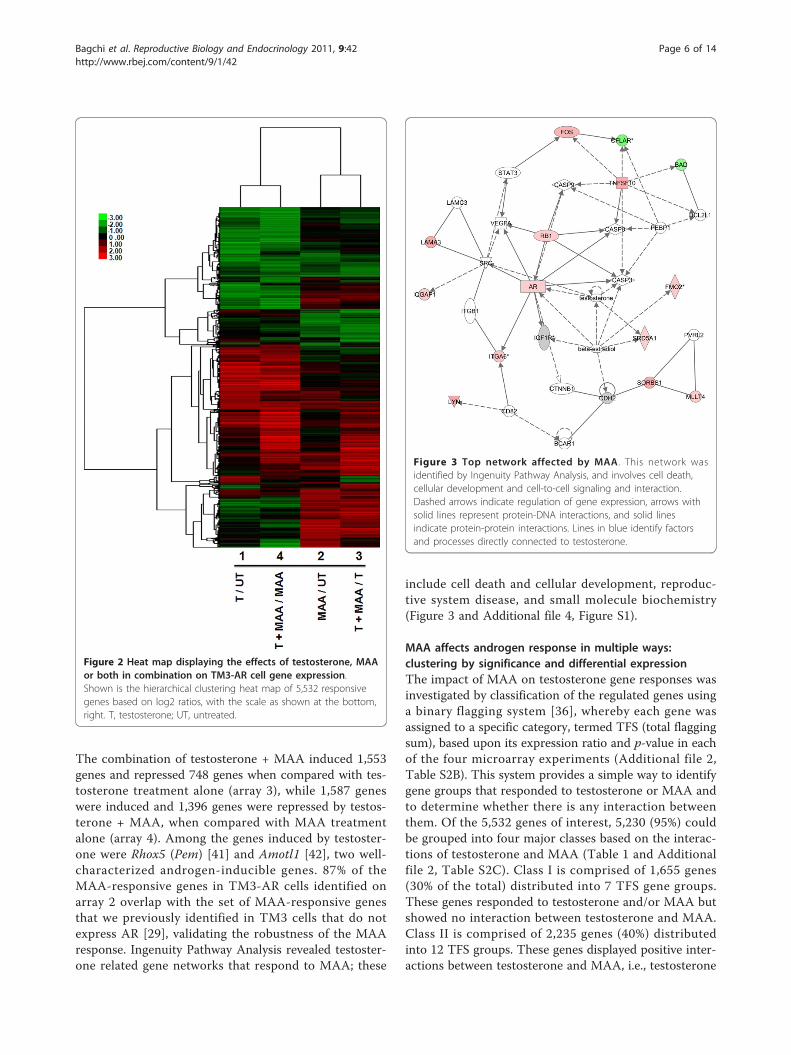
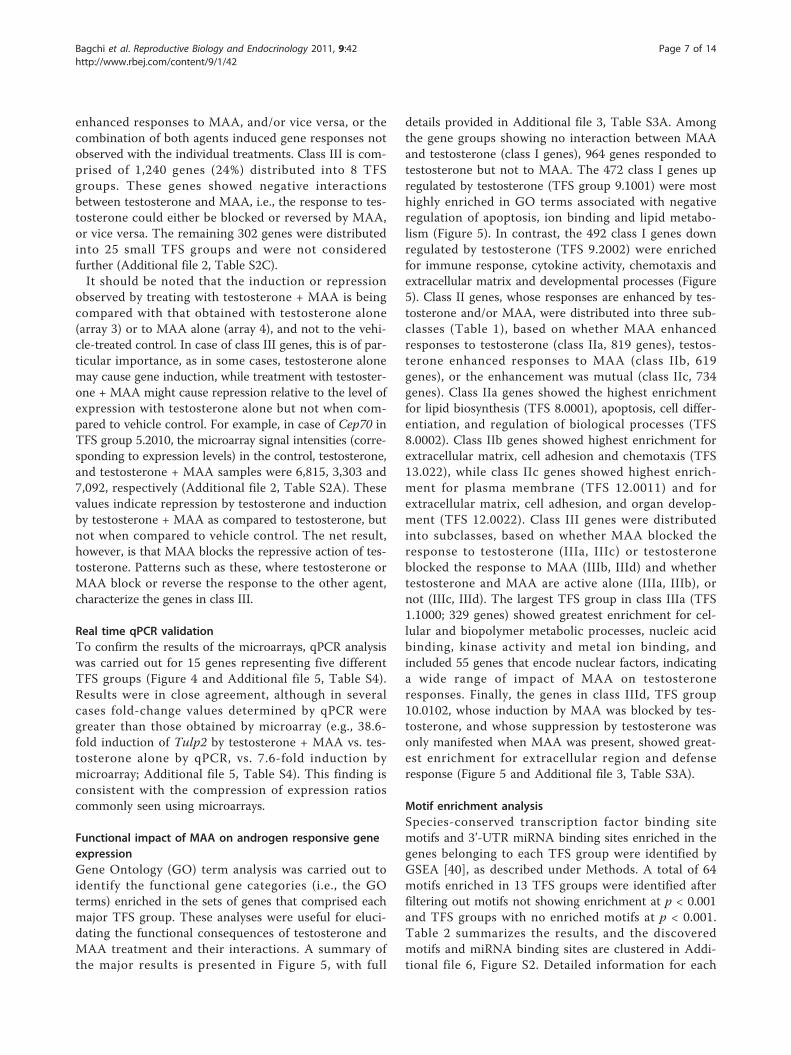
The combination of testosterone + MAA induced 1,553genes and repressed 748 genes when compared with tes-tosterone treatment alone (array 3), while 1,587 geneswere induced and 1,396 genes were repressed by testos-terone + MAA, when compared with MAA treatmentalone (array 4). Among the genes induced by testoster-one were Rhox5 (Pem) [41] and Amotl1 [42], two well-characterized androgen-inducible genes. 87% of theMAA-responsive genes in TM3-AR cells identified onarray 2 overlap with the set of MAA-responsive genesthat we previously identified in TM3 cells that do notexpress AR [29], validating the robustness of the MAAresponse. Ingenuity Pathway Analysis revealed testoster-one related gene networks that respond to MAA; these
include cell death and cellular development, reproduc-tive system disease, and small molecule biochemistry(Figure 3 and Additional file 4, Figure S1).
MAA affects androgen response in multiple ways:clustering by significance and differential expressionThe impact of MAA on testosterone gene responses wasinvestigated by classification of the regulated genes usinga binary flagging system [36], whereby each gene wasassigned to a specific category, termed TFS (total flaggingsum), based upon its expression ratio and p-value in eachof the four microarray experiments (Additional file 2,Table S2B). This system provides a simple way to identifygene groups that responded to testosterone or MAA andto determine whether there is any interaction betweenthem. Of the 5,532 genes of interest, 5,230 (95%) couldbe grouped into four major classes based on the interac-tions of testosterone and MAA (Table 1 and Additionalfile 2, Table S2C). Class I is comprised of 1,655 genes(30% of the total) distributed into 7 TFS gene groups.These genes responded to testosterone and/or MAA butshowed no interaction between testosterone and MAA.Class II is comprised of 2,235 genes (40%) distributedinto 12 TFS groups. These genes displayed positive inter-actions between testosterone and MAA, i.e., testosterone
Figure 2 Heat map displaying the effects of testosterone, MAAor both in combination on TM3-AR cell gene expression.Shown is the hierarchical clustering heat map of 5,532 responsivegenes based on log2 ratios, with the scale as shown at the bottom,right. T, testosterone; UT, untreated.
Figure 3 Top network affected by MAA . This network wasidentified by Ingenuity Pathway Analysis, and involves cell death,cellular development and cell-to-cell signaling and interaction.Dashed arrows indicate regulation of gene expression, arrows withsolid lines represent protein-DNA interactions, and solid linesindicate protein-protein interactions. Lines in blue identify factorsand processes directly connected to testosterone.
Bagchi et al. Reproductive Biology and Endocrinology 2011, 9:42http://www.rbej.com/content/9/1/42
Page 6 of 14
enhanced responses to MAA, and/or vice versa, or thecombination of both agents induced gene responses notobserved with the individual treatments. Class III is com-prised of 1,240 genes (24%) distributed into 8 TFSgroups. These genes showed negative interactionsbetween testosterone and MAA, i.e., the response to tes-tosterone could either be blocked or reversed by MAA,or vice versa. The remaining 302 genes were distributedinto 25 small TFS groups and were not consideredfurther (Additional file 2, Table S2C).It should be noted that the induction or repression
observed by treating with testosterone + MAA is beingcompared with that obtained with testosterone alone(array 3) or to MAA alone (array 4), and not to the vehi-cle-treated control. In case of class III genes, this is of par-ticular importance, as in some cases, testosterone alonemay cause gene induction, while treatment with testoster-one + MAA might cause repression relative to the level ofexpression with testosterone alone but not when com-pared to vehicle control. For example, in case of Cep70 inTFS group 5.2010, the microarray signal intensities (corre-sponding to expression levels) in the control, testosterone,and testosterone + MAA samples were 6,815, 3,303 and7,092, respectively (Additional file 2, Table S2A). Thesevalues indicate repression by testosterone and inductionby testosterone + MAA as compared to testosterone, butnot when compared to vehicle control. The net result,however, is that MAA blocks the repressive action of tes-tosterone. Patterns such as these, where testosterone orMAA block or reverse the response to the other agent,characterize the genes in class III.
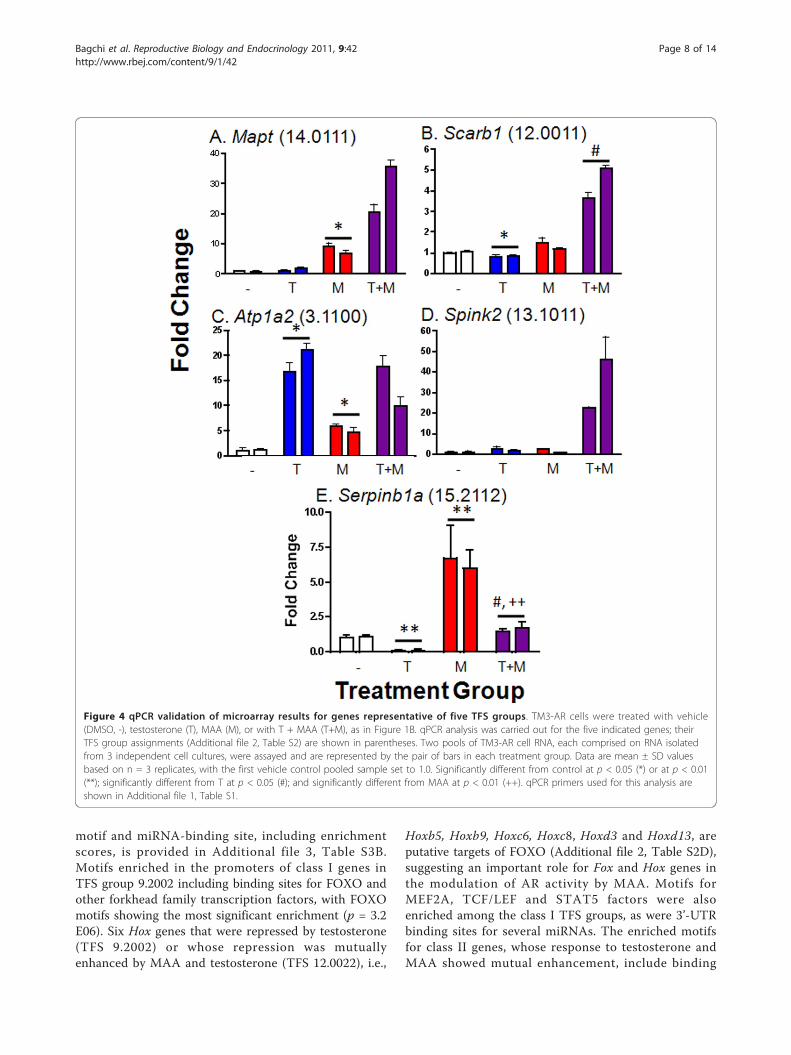
Real time qPCR validationTo confirm the results of the microarrays, qPCR analysiswas carried out for 15 genes representing five differentTFS groups (Figure 4 and Additional file 5, Table S4).Results were in close agreement, although in severalcases fold-change values determined by qPCR weregreater than those obtained by microarray (e.g., 38.6-fold induction of Tulp2 by testosterone + MAA vs. tes-tosterone alone by qPCR, vs. 7.6-fold induction bymicroarray; Additional file 5, Table S4). This finding isconsistent with the compression of expression ratioscommonly seen using microarrays.
Functional impact of MAA on androgen responsive geneexpressionGene Ontology (GO) term analysis was carried out toidentify the functional gene categories (i.e., the GOterms) enriched in the sets of genes that comprised eachmajor TFS group. These analyses were useful for eluci-dating the functional consequences of testosterone andMAA treatment and their interactions. A summary ofthe major results is presented in Figure 5, with full
details provided in Additional file 3, Table S3A. Amongthe gene groups showing no interaction between MAAand testosterone (class I genes), 964 genes responded totestosterone but not to MAA. The 472 class I genes upregulated by testosterone (TFS group 9.1001) were mosthighly enriched in GO terms associated with negativeregulation of apoptosis, ion binding and lipid metabo-lism (Figure 5). In contrast, the 492 class I genes downregulated by testosterone (TFS 9.2002) were enrichedfor immune response, cytokine activity, chemotaxis andextracellular matrix and developmental processes (Figure5). Class II genes, whose responses are enhanced by tes-tosterone and/or MAA, were distributed into three sub-classes (Table 1), based on whether MAA enhancedresponses to testosterone (class IIa, 819 genes), testos-terone enhanced responses to MAA (class IIb, 619genes), or the enhancement was mutual (class IIc, 734genes). Class IIa genes showed the highest enrichmentfor lipid biosynthesis (TFS 8.0001), apoptosis, cell differ-entiation, and regulation of biological processes (TFS8.0002). Class IIb genes showed highest enrichment forextracellular matrix, cell adhesion and chemotaxis (TFS13.022), while class IIc genes showed highest enrich-ment for plasma membrane (TFS 12.0011) and forextracellular matrix, cell adhesion, and organ develop-ment (TFS 12.0022). Class III genes were distributedinto subclasses, based on whether MAA blocked theresponse to testosterone (IIIa, IIIc) or testosteroneblocked the response to MAA (IIIb, IIId) and whethertestosterone and MAA are active alone (IIIa, IIIb), ornot (IIIc, IIId). The largest TFS group in class IIIa (TFS1.1000; 329 genes) showed greatest enrichment for cel-lular and biopolymer metabolic processes, nucleic acidbinding, kinase activity and metal ion binding, andincluded 55 genes that encode nuclear factors, indicatinga wide range of impact of MAA on testosteroneresponses. Finally, the genes in class IIId, TFS group10.0102, whose induction by MAA was blocked by tes-tosterone, and whose suppression by testosterone wasonly manifested when MAA was present, showed great-est enrichment for extracellular region and defenseresponse (Figure 5 and Additional file 3, Table S3A).
Motif enrichment analysisSpecies-conserved transcription factor binding sitemotifs and 3’-UTR miRNA binding sites enriched in thegenes belonging to each TFS group were identified byGSEA [40], as described under Methods. A total of 64motifs enriched in 13 TFS groups were identified afterfiltering out motifs not showing enrichment at p < 0.001and TFS groups with no enriched motifs at p < 0.001.Table 2 summarizes the results, and the discoveredmotifs and miRNA binding sites are clustered in Addi-tional file 6, Figure S2. Detailed information for each
Bagchi et al. Reproductive Biology and Endocrinology 2011, 9:42http://www.rbej.com/content/9/1/42
Page 7 of 14
motif and miRNA-binding site, including enrichmentscores, is provided in Additional file 3, Table S3B.Motifs enriched in the promoters of class I genes inTFS group 9.2002 including binding sites for FOXO andother forkhead family transcription factors, with FOXOmotifs showing the most significant enrichment (p = 3.2E06). Six Hox genes that were repressed by testosterone(TFS 9.2002) or whose repression was mutuallyenhanced by MAA and testosterone (TFS 12.0022), i.e.,
Hoxb5, Hoxb9, Hoxc6, Hoxc8, Hoxd3 and Hoxd13, areputative targets of FOXO (Additional file 2, Table S2D),suggesting an important role for Fox and Hox genes inthe modulation of AR activity by MAA. Motifs forMEF2A, TCF/LEF and STAT5 factors were alsoenriched among the class I TFS groups, as were 3’-UTRbinding sites for several miRNAs. The enriched motifsfor class II genes, whose response to testosterone andMAA showed mutual enhancement, include binding
Figure 4 qPCR validation of microarray results for genes representative of five TFS groups. TM3-AR cells were treated with vehicle(DMSO, -), testosterone (T), MAA (M), or with T + MAA (T+M), as in Figure 1B. qPCR analysis was carried out for the five indicated genes; theirTFS group assignments (Additional file 2, Table S2) are shown in parentheses. Two pools of TM3-AR cell RNA, each comprised on RNA isolatedfrom 3 independent cell cultures, were assayed and are represented by the pair of bars in each treatment group. Data are mean ± SD valuesbased on n = 3 replicates, with the first vehicle control pooled sample set to 1.0. Significantly different from control at p < 0.05 (*) or at p < 0.01(**); significantly different from T at p < 0.05 (#); and significantly different from MAA at p < 0.01 (++). qPCR primers used for this analysis areshown in Additional file 1, Table S1.
Bagchi et al. Reproductive Biology and Endocrinology 2011, 9:42http://www.rbej.com/content/9/1/42
Page 8 of 14
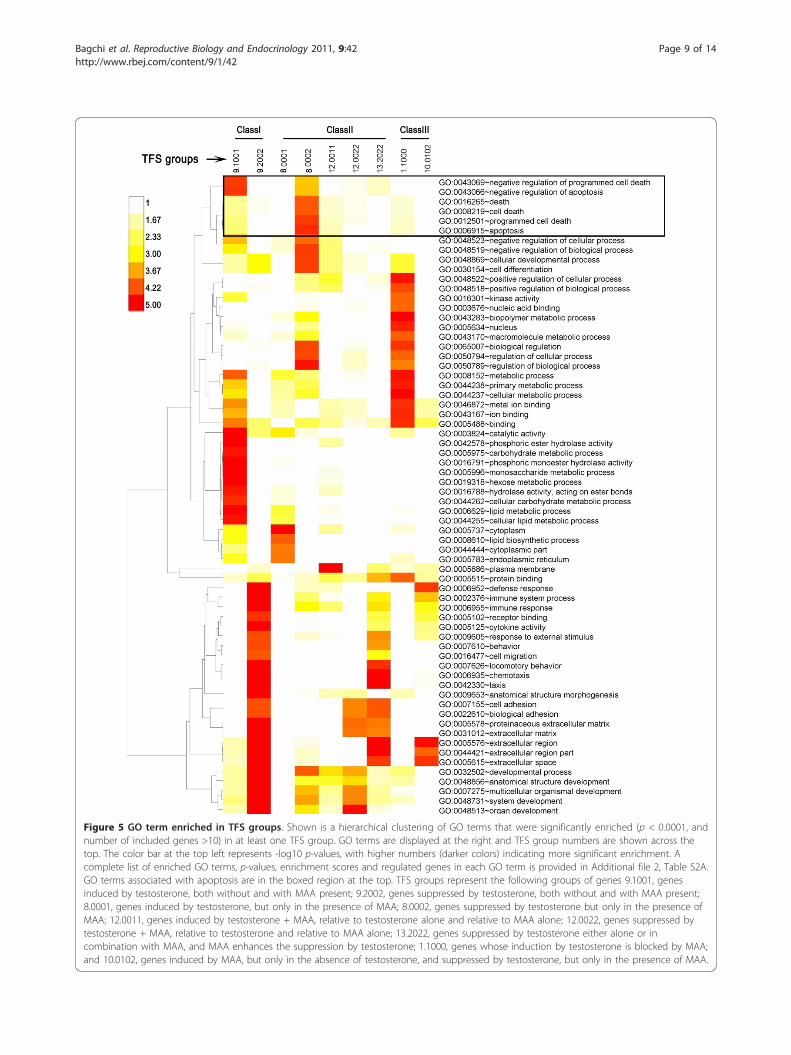
Figure 5 GO term enriched in TFS groups. Shown is a hierarchical clustering of GO terms that were significantly enriched (p < 0.0001, andnumber of included genes >10) in at least one TFS group. GO terms are displayed at the right and TFS group numbers are shown across thetop. The color bar at the top left represents -log10 p-values, with higher numbers (darker colors) indicating more significant enrichment. Acomplete list of enriched GO terms, p-values, enrichment scores and regulated genes in each GO term is provided in Additional file 2, Table S2A.GO terms associated with apoptosis are in the boxed region at the top. TFS groups represent the following groups of genes 9.1001, genesinduced by testosterone, both without and with MAA present; 9.2002, genes suppressed by testosterone, both without and with MAA present;8.0001, genes induced by testosterone, but only in the presence of MAA; 8.0002, genes suppressed by testosterone but only in the presence ofMAA; 12.0011, genes induced by testosterone + MAA, relative to testosterone alone and relative to MAA alone; 12.0022, genes suppressed bytestosterone + MAA, relative to testosterone and relative to MAA alone; 13.2022, genes suppressed by testosterone either alone or incombination with MAA, and MAA enhances the suppression by testosterone; 1.1000, genes whose induction by testosterone is blocked by MAA;and 10.0102, genes induced by MAA, but only in the absence of testosterone, and suppressed by testosterone, but only in the presence of MAA.
Bagchi et al. Reproductive Biology and Endocrinology 2011, 9:42http://www.rbej.com/content/9/1/42
Page 9 of 14
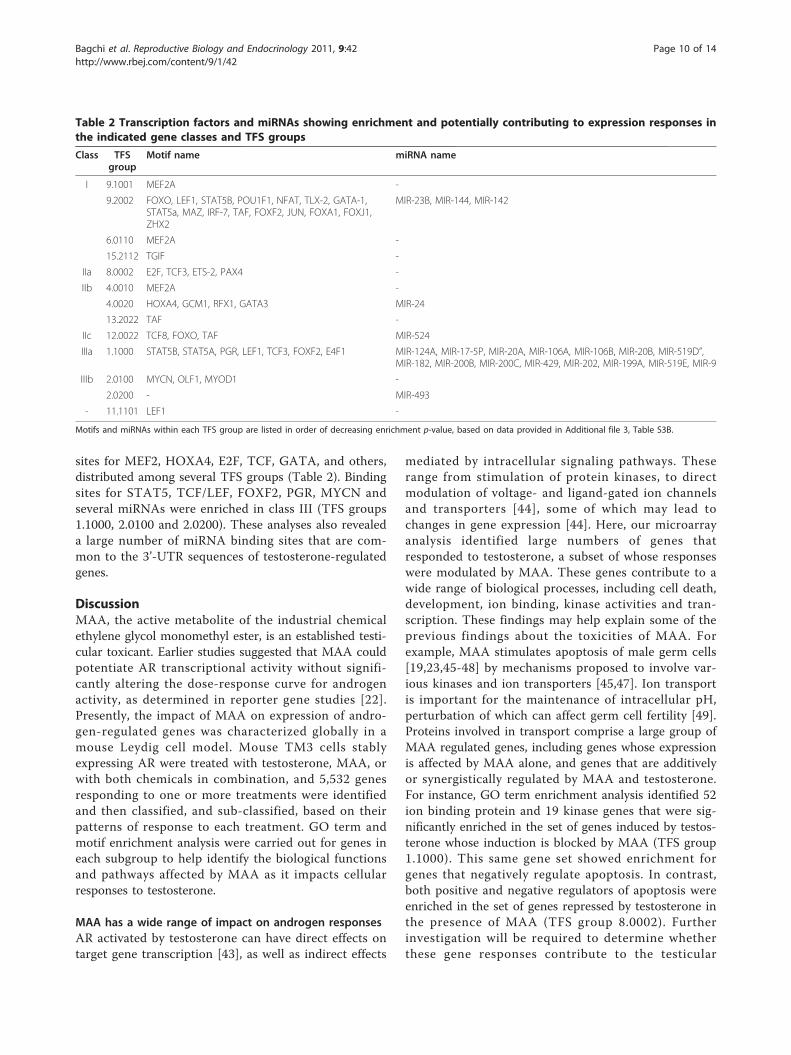
sites for MEF2, HOXA4, E2F, TCF, GATA, and others,distributed among several TFS groups (Table 2). Bindingsites for STAT5, TCF/LEF, FOXF2, PGR, MYCN andseveral miRNAs were enriched in class III (TFS groups1.1000, 2.0100 and 2.0200). These analyses also revealeda large number of miRNA binding sites that are com-mon to the 3’-UTR sequences of testosterone-regulatedgenes.
DiscussionMAA, the active metabolite of the industrial chemicalethylene glycol monomethyl ester, is an established testi-cular toxicant. Earlier studies suggested that MAA couldpotentiate AR transcriptional activity without signifi-cantly altering the dose-response curve for androgenactivity, as determined in reporter gene studies [22].Presently, the impact of MAA on expression of andro-gen-regulated genes was characterized globally in amouse Leydig cell model. Mouse TM3 cells stablyexpressing AR were treated with testosterone, MAA, orwith both chemicals in combination, and 5,532 genesresponding to one or more treatments were identifiedand then classified, and sub-classified, based on theirpatterns of response to each treatment. GO term andmotif enrichment analysis were carried out for genes ineach subgroup to help identify the biological functionsand pathways affected by MAA as it impacts cellularresponses to testosterone.
MAA has a wide range of impact on androgen responsesAR activated by testosterone can have direct effects ontarget gene transcription [43], as well as indirect effects
mediated by intracellular signaling pathways. Theserange from stimulation of protein kinases, to directmodulation of voltage- and ligand-gated ion channelsand transporters [44], some of which may lead tochanges in gene expression [44]. Here, our microarrayanalysis identified large numbers of genes thatresponded to testosterone, a subset of whose responseswere modulated by MAA. These genes contribute to awide range of biological processes, including cell death,development, ion binding, kinase activities and tran-scription. These findings may help explain some of theprevious findings about the toxicities of MAA. Forexample, MAA stimulates apoptosis of male germ cells[19,23,45-48] by mechanisms proposed to involve var-ious kinases and ion transporters [45,47]. Ion transportis important for the maintenance of intracellular pH,perturbation of which can affect germ cell fertility [49].Proteins involved in transport comprise a large group ofMAA regulated genes, including genes whose expressionis affected by MAA alone, and genes that are additivelyor synergistically regulated by MAA and testosterone.For instance, GO term enrichment analysis identified 52ion binding protein and 19 kinase genes that were sig-nificantly enriched in the set of genes induced by testos-terone whose induction is blocked by MAA (TFS group1.1000). This same gene set showed enrichment forgenes that negatively regulate apoptosis. In contrast,both positive and negative regulators of apoptosis wereenriched in the set of genes repressed by testosterone inthe presence of MAA (TFS group 8.0002). Furtherinvestigation will be required to determine whetherthese gene responses contribute to the testicular
Table 2 Transcription factors and miRNAs showing enrichment and potentially contributing to expression responses inthe indicated gene classes and TFS groups
Class TFSgroup
Motif name miRNA name
I 9.1001 MEF2A -
9.2002 FOXO, LEF1, STAT5B, POU1F1, NFAT, TLX-2, GATA-1,STAT5a, MAZ, IRF-7, TAF, FOXF2, JUN, FOXA1, FOXJ1,ZHX2
MIR-23B, MIR-144, MIR-142
6.0110 MEF2A -
15.2112 TGIF -
IIa 8.0002 E2F, TCF3, ETS-2, PAX4 -
IIb 4.0010 MEF2A -
4.0020 HOXA4, GCM1, RFX1, GATA3 MIR-24
13.2022 TAF -
IIc 12.0022 TCF8, FOXO, TAF MIR-524
IIIa 1.1000 STAT5B, STAT5A, PGR, LEF1, TCF3, FOXF2, E4F1 MIR-124A, MIR-17-5P, MIR-20A, MIR-106A, MIR-106B, MIR-20B, MIR-519D”,MIR-182, MIR-200B, MIR-200C, MIR-429, MIR-202, MIR-199A, MIR-519E, MIR-9
IIIb 2.0100 MYCN, OLF1, MYOD1 -
2.0200 - MIR-493
- 11.1101 LEF1 -
Motifs and miRNAs within each TFS group are listed in order of decreasing enrichment p-value, based on data provided in Additional file 3, Table S3B.
Bagchi et al. Reproductive Biology and Endocrinology 2011, 9:42http://www.rbej.com/content/9/1/42
Page 10 of 14
toxicities of MAA seen in mouse models, as well astheir relevance to humans exposed to MAA.
Transcription factors involved in MAA modulation oftestosterone responseTM3-AR cells showed complex patterns of response totestosterone and MAA (Table 1), indicating that multi-ple mechanisms likely contribute to MAA modulationof responses to testosterone, and to testosterone modu-lation of responses to MAA. One mechanisms couldinvolve effects of MAA on the expression of AR, whoselevels were increased ~2-fold by MAA, both in theabsence and in the presence of testosterone. While thiseffect could conceivably contribute to the positive effectsof MAA on responses to testosterone (e.g., gene classesIIa, IIc, and IIId; Table 1), it does not explain the inhibi-tory effects of MAA on responses to testosterone seenin gene classes IIIa and IIIc. Moreover, for many genesin classes IIa, IIc and IIId, where MAA enhancesresponses to testosterone, the magnitude of the effect ofMAA is greater than the observed ~2-fold increase inAR expression. These findings suggest the involvementof other transcription factors in the effects of MAA ontestosterone-responsive genes.FOXO proteins can associate with AR and other
nuclear/steroid hormone receptors, leading to eitherinhibition or enhancement of receptor transcriptionalactivity [12]. These interactions have the potential toimpact the development of hormone-dependent cancers,including prostate, breast and ovarian cancer [12]. Here,we found that FOXO motifs were enriched in 53 genesrepressed by testosterone irrespective of whether MAAwas present (11% of the genes in TFS group 9.2002),and in 12 genes down-regulated by testosterone, butonly when MAA was present, and vice versa (15% ofgenes in TFS group 12.0022) (Additional file 2, TableS2D). These findings suggest that FOXO factors playsan important role in cellular responses to testosteroneand their modulation by MAA. 18 of the potentialFOXO targets are involved in transcription regulation,including 6 Hox genes (Hoxb5, Hoxb9, Hoxc6, Hoxc8,Hoxd3 and Hoxd13) (Additional file 2, Table S2D). Ofnote, loss of Hoxc6 has been reported to induce apopto-sis [50]. Moreover, 16 of the 65 FOXO target genesdown regulated by testosterone are associated withdevelopmental processes, as indicated by their GOterms. Based on our microarray signal intensity data, atleast three FOXO genes are either highly expressed(Foxo1) or moderately expressed in untreated TM3-ARcells (Foxo6, Fox3a), suggesting these factors may med-iate the effects on FOXO target genes. FOX familygenes are primarily regulated through the phosphoinosi-tide-3-kinase (PI3k)-Akt pathway via phosphorylationand nuclear exclusion [11], which is consistent with our
earlier finding that the PI3K/Akt pathway is required forthe effects of MAA on AR transcriptional activity [22].Two other transcription factors that are expressed inTM3-AR cells and may be involved in the interactionsbetween testosterone and MAA are LEF/TCF andSTAT5. Binding sites for LEF/TCF are significantlyenriched in several sets of genes that are regulated bytestosterone and MAA, while binding sites for STAT5are enriched in genes repressed by testosterone (TFSgroup 9.2002) and in genes whose induction by testos-terone was blocked by MAA (TFS group 1.1000) (Table2; Additional file 3, Table S3B). These findings are con-sistent with reports that STAT5 and LEF/TCF can mod-ulate AR-regulated gene responses, with STAT5showing positive interactions with AR [8], and LEF/TCFeither repressing or enhancing AR activity [14]. Simi-larly, our finding that binding sites for MEF2 areenriched in TFS groups responsive to testosterone orMAA (Table 2) is consistent with the finding that bind-ing sequences for MEF2 family transcription factors arecommonly found near binding sites for AR, at least inmuscle cells [51].
Possible roles for miRNAs in MAA and testosteroneresponsesmiRNAs are short, ~22 nucleotides long RNAs that gen-erally bind to 3’-UTR sequences of target mRNAs,resulting in post-transcriptional mRNA down regulationand translational repression [52]. Here, we identifiedseveral miRNAs whose putative target sites are over-represented in genes responsive to MAA or testoster-one, suggesting a possible role for these miRNAs inmediating responses to MAA and and testosterone.Genes in TFS group 1.1000, whose induction by testos-terone was blocked by MAA, were enriched in 3’-UTRbinding sites for the largest number of miRNAs (Table2). These include mir-9 and miR-519e, which have beenreported to down regulate AR protein [53]. Conceivably,MAA could induce these two miRNAs, which in turn,would down regulate AR protein and functional activity.Two other miRNAs whose binding sites were enrichedin the genes of TFS group 1.1000, namely mir-20A andmir-202, are induced in testicular tubules following sup-pression of FSH and androgen [54], which leads to ablock in spermiation. The enrichment of these miRNAsin TFS 1.1000 genes suggests that testosterone maydown regulate these miRNAs, which would, in turn,lead to the observed up regulation (de-repression) of theTFS 1.1000 genes with mir-20A and mir-202 sites.Moreover, the inhibition of this gene induction by MAAsuggests that MAA may block or perhaps reverse thedown regulation of these miRNAs by testosterone.Further study is required to determine the effects of tes-tosterone and MAA on these and other testis-expressed
Bagchi et al. Reproductive Biology and Endocrinology 2011, 9:42http://www.rbej.com/content/9/1/42
Page 11 of 14
miRNAs, and their impact of spermatogenesis and thetoxicities associated with MAA exposure.
Impact of testosterone and MAA on expression of CYPand GST genesCYP (cytochrome P450) and GST (glutathione S-trans-ferase) enzymes metabolize a broad range of endogen-ous and exogenous compounds. Here, we found that theexpression of 20 CYP and 12 GST genes was affected byeither MAA or testosterone (Additional file 2, TableS2E). Nine of these genes were induced by MAA alone(Cyp2d22, Cyp26a1, Cyp26b1, Gstk1, Gstm6, Gstm7,Gstt2, Mgst2 and Mgst3), while four genes were inducedby MAA but down regulated by testosterone (Cyp1a1,Cyp2s1, Cyp2f2 and Mgst3). Three CYPs that showfemale-predominant expression in mouse liver [55] werefurther induced by testosterone in the presence of MAAcompared to testosterone treatment alone (Cyp2b9,Cyp2b10 and Cyp2b13). Further studies are needed todetermine whether these enzymes play a metabolic rolein MAA modulation of testosterone signaling and/or thedetoxification of MAA.
ConclusionsThis study investigated on a genome-wide basis theimpact of MAA on AR activity in a cultured Leydig cellmodel. MAA displayed widespread effects on androgen-responsive genes associated with diverse cellular pro-cesses, including apoptosis, ion transport, cell adhesion,phosphorylation and transcription. Binding sites forFOXO, HOX, LEF/TCF, STAT5 and MEF2 family tran-scription factors, as well as those of several miRNAs,were found to be enriched in various groups of genesregulated by testosterone and/or MAA. These findingshighlight the complex interactions, both positive andnegative, between androgen- and MAA-responsivegenes, and provide insight into molecular mechanismsthat may contribute to the toxicities associated withexposure to MAA in testicular cells in vivo.
Additional material
Additional file 1: Table S1: Mouse primer sequences for all genesanalyzed by qPCR.
Additional file 2: Table S2: Detailed listings, classification andsummary of genes that respond to testosterone and/or MAA.
Additional file 3: Table S3: Enrichment analysis of GO terms (A) andmotifs (B)
Additional file 4: Figure S1: Networks associated with genesimpacted by MAA, as identified by Ingenuity Pathway Analysis. (A)Network involved in reproductive system disease, small moleculebiochemistry and lipid metabolism; (B) Small molecule biochemistry, lipidmetabolism and drug metabolism. Dashed arrows indicate regulation ofgene expression, arrows with solid lines represent protein-DNAinteractions, and solid lines indicate protein-protein interactions. Lines inblue identify processes and factors directly connected to testosterone.
Additional file 5: Table S4: Comparison of gene expression ratiosdetermined by qPCR and microarray analysis for 15 genesrepresenting five TFS groups.
Additional file 6: Figure S2: Motifs enriched in different TFS groups.Shown are motifs (A) and miRNAs (B) with enrichment p-value <0.001 in at least one TFS group and TFS groups which have at leastone motif enriched with p < 0.001 are selected. TFS numbers areshown on the top of the heat map. Please refer to Additional file 2,Table S2C for the biological description of each TFS group. Numbers onthe top of the color bar represent -log10 P value, with higher numbersindicating greater enrichment.
AcknowledgementsSupported in part by National Institutes of Health grant 5 P42 ES07381,Superfund Research Program at Boston University (to D.J.W.). The authorsthank Dr. Alan Dombkowski, Wayne State University, for initial processing ofmicroarray data sets using Rosetta Resolver.
Authors’ contributionsGB and DJW conceived and designed the experiments, GB and KSperformed the experiments, YZ, GB and DJW analyzed the data and wrotethe paper, and DJW managed the overall design and execution of theproject. All authors read and approved the final manuscript.
Competing interestsThe authors declare that they have no competing interests.
Received: 10 February 2011 Accepted: 31 March 2011Published: 31 March 2011
References1. Szafran AT, Szwarc M, Marcelli M, Mancini MA: Androgen receptor
functional analyses by high throughput imaging: determination ofligand, cell cycle, and mutation-specific effects. PLoS ONE 2008, 3:e3605.
2. Quigley CA, De Bellis A, Marschke KB, el-Awady MK, Wilson EM, French FS:Androgen receptor defects: historical, clinical, and molecularperspectives. Endocr Rev 1995, 16:271-321.
3. Brinkmann AO, Blok LJ, de Ruiter PE, Doesburg P, Steketee K, Berrevoets CA,Trapman J: Mechanisms of androgen receptor activation and function. JSteroid Biochem Mol Biol 1999, 69:307-313.
4. Wang Q, Li W, Liu XS, Carroll JS, Jänne OA, Keeton EK, Chinnaiyan AM,Pienta KJ, Brown M: A Hierarchical Network of Transcription FactorsGoverns Androgen Receptor-Dependent Prostate Cancer Growth. MolecCell 2007, 27:380-392.
5. Wang Q, Li W, Zhang Y, Yuan X, Xu K, Yu J, Chen Z, Beroukhim R, Wang H,Lupien M, Wu T, Regan MM, Meyer CA, Carroll JS, Manrai AK, Jänne OA,Balk SP, Mehra R, Han B, Chinnaiyan AM, Rubin MA, True L, Fiorentino M,Fiore C, Loda M, Kantoff PW, Liu XS, Brown M: Androgen ReceptorRegulates a Distinct Transcription Program in Androgen-IndependentProstate Cancer. Cell 2009, 138:245-256.
6. Lin B, Wang J, Hong X, Yan X, Hwang D, Cho JH, Yi D, Utleg AG, Fang X,Schones DE, Zhao K, Omenn GS, Hood L: Integrated Expression Profilingand ChIP-seq Analyses of the Growth Inhibition Response Program ofthe Androgen Receptor. PLoS ONE 2009, 4:e6589.
7. Bhardwaj A, Rao MK, Kaur R, Buttigieg MR, Wilkinson MF: GATA factors andandrogen receptor collaborate to transcriptionally activate the Rhox5homeobox gene in Sertoli cells. Mol Cell Biol 2008, 28:2138-2153.
8. Tan SH, Dagvadorj A, Shen F, Gu L, Liao Z, Abdulghani J, Zhang Y,Gelmann EP, Zellweger T, Culig Z, Visakorpi T, Bubendorf L, Kirken RA,Karras J, Nevalainen MT: Transcription Factor Stat5 Synergizes withAndrogen Receptor in Prostate Cancer Cells. Cancer Res 2008, 68:236-248.
9. Darne CH, Morel L, Claessens F, Manin M, Fabre S, Veyssière G,Rombauts W, Jean CL: Ubiquitous transcription factors NF1 and Sp1 areinvolved in the androgen activation of the mouse vas deferens proteinpromoter. Molec Cell Endocrinol 1997, 132:13-23.
10. Obendorf M, Meyer R, Henning K, Mitev YA, Schröder J, Patchev VK,Wolf SS: FoxG1, a member of the forkhead family, is a corepressor of theandrogen receptor. J Steroid Biochem Mol Biol 2007, 104:195-207.
Bagchi et al. Reproductive Biology and Endocrinology 2011, 9:42http://www.rbej.com/content/9/1/42
Page 12 of 14

11. Reagan-Shaw S, Ahmad N: The role of Forkhead-box Class O (FoxO)transcription factors in cancer: A target for the management of cancer.Toxicol Appl Pharmacol 2007, 224:360-368.
12. van der Vos KE, Coffer PJ: FOXO-binding partners: it takes two to tango.Oncogene 2008, 27:2289-2299.
13. Cronauer MV, Schulz WA, Burchardt T, Ackermann R, Burchardt M:Inhibition of p53 function diminishes androgen receptor-mediatedsignaling in prostate cancer cell lines. Oncogene 2004, 23:3541-3549.
14. Chesire DR, Isaacs WB: Ligand-dependent inhibition of beta-catenin/TCFsignaling by androgen receptor. Oncogene 2002, 21:8453-8469.
15. Mohler ML, Bohl CE, Jones A, Coss CC, Narayanan R, He Y, Hwang DJ,Dalton JT, Miller DD: Nonsteroidal selective androgen receptormodulators (SARMs): dissociating the anabolic and androgenic activitiesof the androgen receptor for therapeutic benefit. J Med Chem 2009,52:3597-3617.
16. Gray LE Jr, Wilson VS, Stoker T, Lambright C, Furr J, Noriega N,Howdeshell K, Ankley GT, Guillette L: Adverse effects of environmentalantiandrogens and androgens on reproductive development inmammals. Int J Androl 2006, 29:96-104, discussion 105-108.
17. Wilson VS, Blystone CR, Hotchkiss AK, Rider CV, Gray LE Jr: Diversemechanisms of anti-androgen action: impact on male rat reproductivetract development. Int J Androl 2008, 31:178-187.
18. Henley DV, Korach KS: Endocrine-disrupting chemicals use distinctmechanisms of action to modulate endocrine system function.Endocrinology 2006, 147:S25-32.
19. Bagchi G, Waxman DJ: Toxicity of ethylene glycol monomethyl ether:impact on testicular gene expression. Int J Androl 2008, 31:269-274.
20. Welsch F: The mechanism of ethylene glycol ether reproductive anddevelopmental toxicity and evidence for adverse effects in humans.Toxicol Lett 2005, 156:13-28.
21. Jansen MS, Nagel SC, Miranda PJ, Lobenhofer EK, Afshari CA, McDonnell DP:Short-chain fatty acids enhance nuclear receptor activity throughmitogen-activated protein kinase activation and histone deacetylaseinhibition. Proc Natl Acad Sci USA 2004, 101:7199-7204.
22. Bagchi G, Hurst CH, Waxman DJ: Interactions of methoxyacetic acid withandrogen receptor. Toxicol Appl Pharmacol 2009, 238:101-110.
23. Tirado OM, Martinez ED, Rodriguez OC, Danielsen M, Selva DM, Reventos J,Munell F, Suarez-Quian CA: Methoxyacetic acid disregulation of androgenreceptor and androgen-binding protein expression in adult rat testis.Biol Reprod 2003, 68:1437-1446.
24. Tirado OM, Selva DM, Toran N, Suarez-Quian CA, Jansen M, McDonnell DP,Reventos J, Munell F: Increased expression of estrogen receptor beta inpachytene spermatocytes after short-term methoxyacetic acidadministration. J Androl 2004, 25:84-94.
25. Wang RS, Yeh S, Tzeng CR, Chang C: Androgen receptor roles inspermatogenesis and fertility: lessons from testicular cell-specificandrogen receptor knockout mice. Endocr Rev 2009, 30:119-132.
26. Henley DV, Mueller S, Korach KS: The short-chain fatty acid methoxyaceticacid disrupts endogenous estrogen receptor-alpha-mediated signaling.Environ Health Perspect 2009, 117:1702-1706.
27. Morgenstern JP, Land H: Advanced mammalian gene transfer: high titreretroviral vectors with multiple drug selection markers and acomplementary helper-free packaging cell line. Nucleic Acids Res 1990,18:3587-3596.
28. Jounaidi Y, Hecht JE, Waxman DJ: Retroviral transfer of humancytochrome P450 genes for oxazaphosphorine-based cancer genetherapy. Cancer Res 1998, 58:4391-4401.
29. Bagchi G, Zhang Y, Waxman DJ: Impact of methoxyacetic acid on mouseLeydig cell gene expression. Reprod Biol Endocrinol 2010, 8:65.
30. Terry KK, Elswick BA, Stedman DB, Welsch F: Developmental phase altersdosimetry-teratogenicity relationship for 2-methoxyethanol in CD-1mice. Teratology 1994, 49:218-227.
31. Holloway MG, Laz EV, Waxman DJ: Codependence of growth hormone-responsive, sexually dimorphic hepatic gene expression on signaltransducer and activator of transcription 5b and hepatic nuclear factor4alpha. Mol Endocrinol 2006, 20:647-660.
32. Weng L, Dai H, Zhan Y, He Y, Stepaniants SB, Bassett DE: Rosetta errormodel for gene expression analysis. Bioinformatics 2006, 22:1111-1121.
33. Holloway MG, Miles GD, Dombkowski AA, Waxman DJ: Liver-specifichepatocyte nuclear factor-4alpha deficiency: greater impact on gene
expression in male than in female mouse liver. Mol Endocrinol 2008,22:1274-1286.
34. Barrett T, Troup DB, Wilhite SE, Ledoux P, Evangelista C, Kim IF,Tomashevsky M, Marshall KA, Phillippy KH, Sherman PM, Muertter RN,Holko M, Ayanbule O, Yefanov A, Soboleva A: NCBI GEO: archive forfunctional genomics data sets–10 years on. Nucleic Acids Res 2011, 39:D1005-1010[http://www.ncbi.nlm.nih.gov/geo/].
35. Chen R, Li L, Butte AJ: AILUN: reannotating gene expression dataautomatically. Nat Methods 2007, 4:879.
36. Clodfelter KH, Holloway MG, Hodor P, Park SH, Ray WJ, Waxman DJ: Sex-dependent liver gene expression is extensive and largely dependentupon signal transducer and activator of transcription 5b (STAT5b):STAT5b-dependent activation of male genes and repression of femalegenes revealed by microarray analysis. Mol Endocrinol 2006,20:1333-1351.
37. Huang da W, Sherman BT, Lempicki RA: Systematic and integrativeanalysis of large gene lists using DAVID bioinformatics resources. NatProtoc 2009, 4:44-57.
38. Eisen MB, Spellman PT, Brown PO, Botstein D: Cluster analysis and displayof genome-wide expression patterns. Proc Natl Acad Sci USA 1998,95:14863-14868.
39. Saldanha AJ: Java Treeview–extensible visualization of microarray data.Bioinformatics 2004, 20:3246-3248.
40. Subramanian A, Tamayo P, Mootha VK, Mukherjee S, Ebert BL, Gillette MA,Paulovich A, Pomeroy SL, Golub TR, Lander ES, Mesirov JP: Gene setenrichment analysis: a knowledge-based approach for interpretinggenome-wide expression profiles. Proc Natl Acad Sci USA 2005,102:15545-15550.
41. Sutton KA, Maiti S, Tribley WA, Lindsey JS, Meistrich ML, Bucana CD,Sanborn BM, Joseph DR, Griswold MD, Cornwall GA, Wilkinson MF:Androgen regulation of the Pem homeodomain gene in mice and ratSertoli and epididymal cells. J Androl 1998, 19:21-30.
42. Zhou Q, Shima JE, Nie R, Friel PJ, Griswold MD: Androgen-regulatedtranscripts in the neonatal mouse testis as determined throughmicroarray analysis. Biol Reprod 2005, 72:1010-1019.
43. Cheung E, Kraus WL: Genomic Analyses of Hormone Signaling and GeneRegulation. Annual Review of Physiology 2010, 72:191-218.
44. Michels G, Hoppe UC: Rapid actions of androgens. Front Neuroendocrinol2008, 29:182-198.
45. Barone F, Aguanno S, D’Agostino A: Modulation of MAA-inducedapoptosis in male germ cells: role of Sertoli cell P/Q-type calciumchannels. Reprod Biol Endocrinol 2005, 3:13.
46. Barone F, Aguanno S, D’Alessio A, D’Agostino A: Sertoli cell modulatesMAA-induced apoptosis of germ cells throughout voltage-operatedcalcium channels. FASEB J 2004, 18:353-354.
47. Jindo T, Wine RN, Li LH, Chapin RE: Protein kinase activity is central to ratgerm cell apoptosis induced by methoxyacetic acid. Toxicol Pathol 2001,29:607-616.
48. Li LH, Wine RN, Chapin RE: 2-Methoxyacetic acid (MAA)-inducedspermatocyte apoptosis in human and rat testes: an in vitrocomparison. J Androl 1996, 17:538-549.
49. Roos A, Boron WF: Intracellular pH. Physiol Rev 1981, 61:296-434.50. Ramachandran S, Liu P, Young AN, Yin-Goen Q, Lim SD, Laycock N,
Amin MB, Carney JK, Marshall FF, Petros JA, Moreno CS: Loss of HOXC6expression induces apoptosis in prostate cancer cells. Oncogene 2005,24:188-198.
51. Wyce A, Bai Y, Nagpal S, Thompson CC: Research Resource: The androgenreceptor modulates expression of genes with critical roles in muscledevelopment and function. Mol Endocrinol 2010, 24:1665-1674.
52. Djuranovic S, Nahvi A, Green R: A parsimonious model for generegulation by miRNAs. Science 2011, 331:550-553.
53. Ostling P, Leivonen SK, Aakula A, Kohonen P, Makela R, Hagman Z, Edsjo A,Kangaspeska S, Edgren H, Nicorici D, Bjartell A, Ceder Y, Perala M,Kallioniemi O: Systematic Analysis of MicroRNAs Targeting the AndrogenReceptor in Prostate Cancer Cells. Cancer Res 2011, 71(5):1956-1967.
54. Nicholls PK, Harrison CA, Walton KL, McLachlan RI, O’Donnell L, Stanton PG:Hormonal Regulation of Sertoli Cell Micro-RNAs at Spermiation.Endocrinology 2011, 152(4):1670-1683.
55. Waxman DJ, Holloway MG: Sex differences in the expression of hepaticdrug metabolizing enzymes. Mol Pharmacol 2009, 76:215-228.
Bagchi et al. Reproductive Biology and Endocrinology 2011, 9:42http://www.rbej.com/content/9/1/42
Page 13 of 14
56. Lindsey JS, Wilkinson MF: Pem: a testosterone- and LH-regulatedhomeobox gene expressed in mouse Sertoli cells and epididymis. DevBiol 1996, 179:471-484.
doi:10.1186/1477-7827-9-42Cite this article as: Bagchi et al.: Complex modulation of androgenresponsive gene expression by methoxyacetic acid. Reproductive Biologyand Endocrinology 2011 9:42.
Submit your next manuscript to BioMed Centraland take full advantage of:
• Convenient online submission
• Thorough peer review
• No space constraints or color figure charges
• Immediate publication on acceptance
• Inclusion in PubMed, CAS, Scopus and Google Scholar
• Research which is freely available for redistribution
Submit your manuscript at www.biomedcentral.com/submit
Bagchi et al. Reproductive Biology and Endocrinology 2011, 9:42http://www.rbej.com/content/9/1/42
Page 14 of 14