complex networks: comparison of network robustness
TRANSCRIPT

PDPM Indian Institute of Information Technology,
Design & Manufacturing Jabalpur
Comparative Study of Network
Robustness of Different Complex
Network Models subjected to Edge-
Attack
Complex Network Project (ES 306b)
Group No.: 15
Ankit Upadhyay 2011020
Laxman Sharma 2011072
Pranjal Nautiyal 2011104
Praveen Kumar 2011107
Ashish Panchal 2011205
4/18/2014

1 Comparative Study of Network Robustness of Different Complex Network Models subjected to Edge-Attack
1
ABSTRACT
Robustness and resilience are extremely important parameters that decide overall
performance, reliability and safety of a complex network. In this project, we propose to
analyze how geometric characteristics and performance of the network is affected by
imposition of certain restrictions. We propose to measure and compare the attack
vulnerability of following complex network models with respect to edge attack:
(1) Erdos-Renyi model of random networks
(2) Watts Strogatz model of small world network
We shall be comparing the attack robustness of these complex network models.

2 Comparative Study of Network Robustness of Different Complex Network Models subjected to Edge-Attack
2
INTRODUCTION
A network is a set of items, which we will call vertices or sometimes nodes, with
connections between them, called edges. A set of vertices joined by edges is the simplest
type of network. A complex network is a graph (network) with non-trivial topological
features, which do not occur in simple networks such as lattices or random graphs but often
occur in real graphs.
Complex Network study and analysis is essentially falls under statistical studies.
Removal of a particular vertex or edge does not affect the network in any significant way;
rather, the percentage of vertices or edges removed is of relevance.
Most of the complex networks depend to a huge extent on their interconnectivity.
The paths connecting various nodes/ vertices of such complex networks form their lifeline.
These paths are called the edges of the complex network. On removal of these edges, at
first, any information flow will have to take alternate longer path; but ultimately, vertex
pairs will become disconnected. In such a scenario, communication between the nodes will
get disrupted, thereby hampering the performance of the network severely. A similar
hampering of communication results on removal of vertices. The extent to which network
remains unaffected by edge/ vertex removal is called the resilience of the network.
“Attack Vulnerability” denotes the decrease of network performance due to a
selected removal of vertices or edge. We measure the attack vulnerability of various
complex network models. We compare different ways of attacking the network and use
various ways of measuring the resulting damage. In general, this gives a measure of the
decrease of network functionality under a sinister attack. The meaningful purpose for attack
vulnerability studies is for the sake of protection: If one wants to protect the network by
guarding or by a temporary isolation of some edges, the most important edges, breaking of
which makes the whole network malfunctioning, should be identified. Thus, by spotting the
critical component of the network the security of the network can be improved.

3 Comparative Study of Network Robustness of Different Complex Network Models subjected to Edge-Attack
3
We will study the vulnerability of complex networks subject to edge attack. For
example, in computer networks, this can be interpreted as the malfunctioning or the loss of
the communication cables. In the context of social networks, the attack on an edge can be
interpreted as prohibition of contact between two individuals.
The edges in a complex network can be attacked in different ways:
1. ID Removal: This strategy uses initial distribution of degree for attacking edge. Edges are
selected in descending order of degrees in the initial network & then removing the
edges one by one starting from edge of highest degree. Note that degree of the edge
does not make a direct sense as degree of a vertex makes; however, it could be
understood as the importance of an edge in terms of the degree of two vertices it
connects.
2. IB Removal: This methodology of attack uses initial distribution of betweenness.
3. RD Removal: It uses re-calculated degree distribution for removal of edges.
4. RB Removal: It uses re-calculated distribution of betweenness for removing edges.
For calculations, edge degree (ke) can be found in following ways:
ke = kvkw
ke = kv + kw
ke = min(kv,kw)
ke = max(kv, kw)
It is noteworthy that while ID and RD removals are local strategies, the other two
strategies based on the betweenness are global ones, which makes the applications of ID
and RD O(N) algorithms, while IB and RB are O(NL) even with the best to the betweenness
of the corresponding edge known algorithm.
Both the degree and betweenness indicate the importance of an edge in a network.
While betweenness is based on the global information on paths connecting all pairs of
vertices, degree depends only on local information. Scale free networks show clear signs of

4 Comparative Study of Network Robustness of Different Complex Network Models subjected to Edge-Attack
4
correlation between the degree and betweenness. This correlation is not observed in WS
and ER models, because vertices with very high degrees are generally absent.
It is noteworthy that an edge does not necessarily become central just because it
connects to one central vertex; rather it has to be a bridge between two central vertices.
APPROACH & METHODS
In this project, we have analyzed and compared the impact of edge attack on
robustness of 2 models: (1) Erdos-Renyi model of random networks, and (2) Watts Strogatz
model of small world network.
In the Erd¨os-R´enyi (ER) model, we start from N vertices without edges.
Subsequently, edges connecting two randomly chosen vertices are added until the total
number of edges becomes L. It generates random networks with no particular structural
bias: The only restriction in the model is that no multiple edges are allowed between two
vertices. In this study, we choose the average degree <k>= 2L/N as a control parameter in
the ER model. The ER model graphs have a logarithmically increasing `, a Poisson-type
degree distribution, and a clustering coefficient close to zero.
In the WS model, a regular one-dimensional network is constructed with only local
connections of range r. Then, each edge is visited once, and with the rewiring probability p
is detached at the opposite vertex and reconnected to a randomly chosen vertex forming a
‘shortcut’. For p = 0 the network is a regular local network, with high clustering, but without
the small-world behavior: The average geodesic length in this case grows linearly with the
network size. In the opposite limit of P = 1, where every edge has been rewired, the
generated random graph has vanishing clustering, but shows a logarithmic behavior of the
average geodesic length α logN. In an intermediate range of P (typically P ~ O(1/N)), the
network generated by the WS model displays both high clustering and small world
behavior—the commonly found characteristics of real social networks.
5 Comparative Study of Network Robustness of Different Complex Network Models subjected to Edge-Attack
5
We began with sample adjacency matrix for both: ER and WS model. Edges were
attacked and removed one by one. Average path length of the network is an important
measure of its robustness. The lower the value of average path length, the more robust is
the complex network. After removing each edge, we evaluated the modified path length of
the network to see the impact of edge attack.
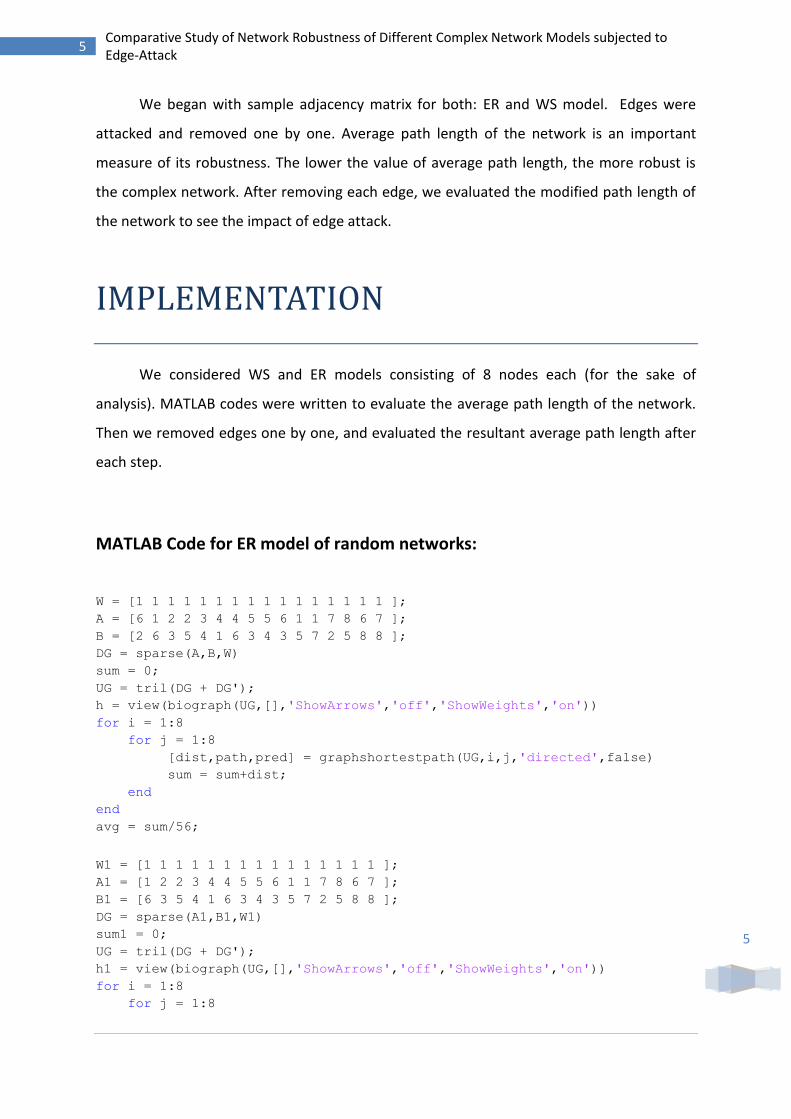
IMPLEMENTATION
We considered WS and ER models consisting of 8 nodes each (for the sake of
analysis). MATLAB codes were written to evaluate the average path length of the network.
Then we removed edges one by one, and evaluated the resultant average path length after
each step.
MATLAB Code for ER model of random networks:
W = [1 1 1 1 1 1 1 1 1 1 1 1 1 1 1 1 ];
A = [6 1 2 2 3 4 4 5 5 6 1 1 7 8 6 7 ];
B = [2 6 3 5 4 1 6 3 4 3 5 7 2 5 8 8 ];
DG = sparse(A,B,W)
sum = 0;
UG = tril(DG + DG');
h = view(biograph(UG,[],'ShowArrows','off','ShowWeights','on'))
for i = 1:8
for j = 1:8
[dist,path,pred] = graphshortestpath(UG,i,j,'directed',false)
sum = sum+dist;
end
end
avg = sum/56;
W1 = [1 1 1 1 1 1 1 1 1 1 1 1 1 1 1 ];
A1 = [1 2 2 3 4 4 5 5 6 1 1 7 8 6 7 ];
B1 = [6 3 5 4 1 6 3 4 3 5 7 2 5 8 8 ];
DG = sparse(A1,B1,W1)
sum1 = 0;
UG = tril(DG + DG');
h1 = view(biograph(UG,[],'ShowArrows','off','ShowWeights','on'))
for i = 1:8
for j = 1:8

6 Comparative Study of Network Robustness of Different Complex Network Models subjected to Edge-Attack
6
[dist1,path1,pred1] = graphshortestpath(UG,i,j,'directed',false)
sum1 = sum1+dist1;
end
end
avg1 = sum1/56;
W2= [1 1 1 1 1 1 1 1 1 1 1 1 1 1 ];
A2 = [2 2 3 4 4 5 5 6 1 1 7 8 6 7 ];
B2 = [3 5 4 1 6 3 4 3 5 7 2 5 8 8 ];
DG = sparse(A2,B2,W2)
sum2 = 0;
UG = tril(DG + DG');
h2 = view(biograph(UG,[],'ShowArrows','off','ShowWeights','on'))
for i = 1:8
for j = 1:8
[dist2,path2,pred2] = graphshortestpath(UG,i,j,'directed',false)
sum2 = sum2+dist2;
end
end
avg2 = sum2/56;
W3= [1 1 1 1 1 1 1 1 1 1 1 1 1 ];
A3 = [2 3 4 4 5 5 6 1 1 7 8 6 7 ];
B3 = [5 4 1 6 3 4 3 5 7 2 5 8 8 ];
DG = sparse(A3,B3,W3)
sum3 = 0;
UG = tril(DG + DG');
h3 = view(biograph(UG,[],'ShowArrows','off','ShowWeights','on'))
for i = 1:8
for j = 1:8
[dist3,path3,pred3] = graphshortestpath(UG,i,j,'directed',false)
sum3 = sum3+dist3;
end
end
avg3 = sum3/56;
MATLAB Code for WS model of small world network:
W = [ 1 1 1 1 1 1 1 1 1 1 1 1 1 1 1 1];
A = [ 1 1 1 1 2 2 2 3 3 4 4 5 5 5 6 8];
B = [ 2 3 6 8 3 4 8 4 7 5 6 6 7 8 7 7];
DG = sparse(A,B,W)
sum = 0;
UG = tril(DG + DG');
h = view(biograph(UG,[],'ShowArrows','off','ShowWeights','on'))
for i = 1:8
for j = 1:8
[dist,path,pred] = graphshortestpath(UG,i,j,'directed',false)
sum = sum+dist;
end

7 Comparative Study of Network Robustness of Different Complex Network Models subjected to Edge-Attack
7
end
avg = sum/56;
W1 = [ 1 1 1 1 1 1 1 1 1 1 1 1 1 1 1];
A1 = [ 1 1 1 2 2 2 3 3 4 4 5 5 5 6 8];
B1 = [ 3 6 8 3 4 8 4 7 5 6 6 7 8 7 7];
DG = sparse(A1,B1,W1)
sum1 = 0;
UG = tril(DG + DG');
h1 = view(biograph(UG,[],'ShowArrows','off','ShowWeights','on'))
for i = 1:8
for j = 1:8
[dist1,path1,pred1] = graphshortestpath(UG,i,j,'directed',false)
sum1 = sum1+dist1;
end
end
avg1 = sum1/56;
W2 = [ 1 1 1 1 1 1 1 1 1 1 1 1 1 1];
A2 = [ 1 1 2 2 2 3 3 4 4 5 5 5 6 8];
B2 = [ 6 8 3 4 8 4 7 5 6 6 7 8 7 7];
DG = sparse(A2,B2,W2)
sum2 = 0;
UG = tril(DG + DG');
h2 = view(biograph(UG,[],'ShowArrows','off','ShowWeights','on'))
for i = 1:8
for j = 1:8
[dist2,path2,pred2] = graphshortestpath(UG,i,j,'directed',false)
sum2 = sum2+dist2;
end
end
avg2 = sum2/56;
W3 = [1 1 1 1 1 1 1 1 1 1 1 1 1];
A3 = [1 2 2 2 3 3 4 4 5 5 5 6 8];
B3 = [8 3 4 8 4 7 5 6 6 7 8 7 7];
DG = sparse(A3,B3,W3)
sum3 = 0;
UG = tril(DG + DG');
h3 = view(biograph(UG,[],'ShowArrows','off','ShowWeights','on'))
for i = 1:8
for j = 1:8
[dist3,path3,pred3] = graphshortestpath(UG,i,j,'directed',false)
sum3 = sum3+dist3;
end
end
avg3 = sum3/56;
8 Comparative Study of Network Robustness of Different Complex Network Models subjected to Edge-Attack
8
RESULTS
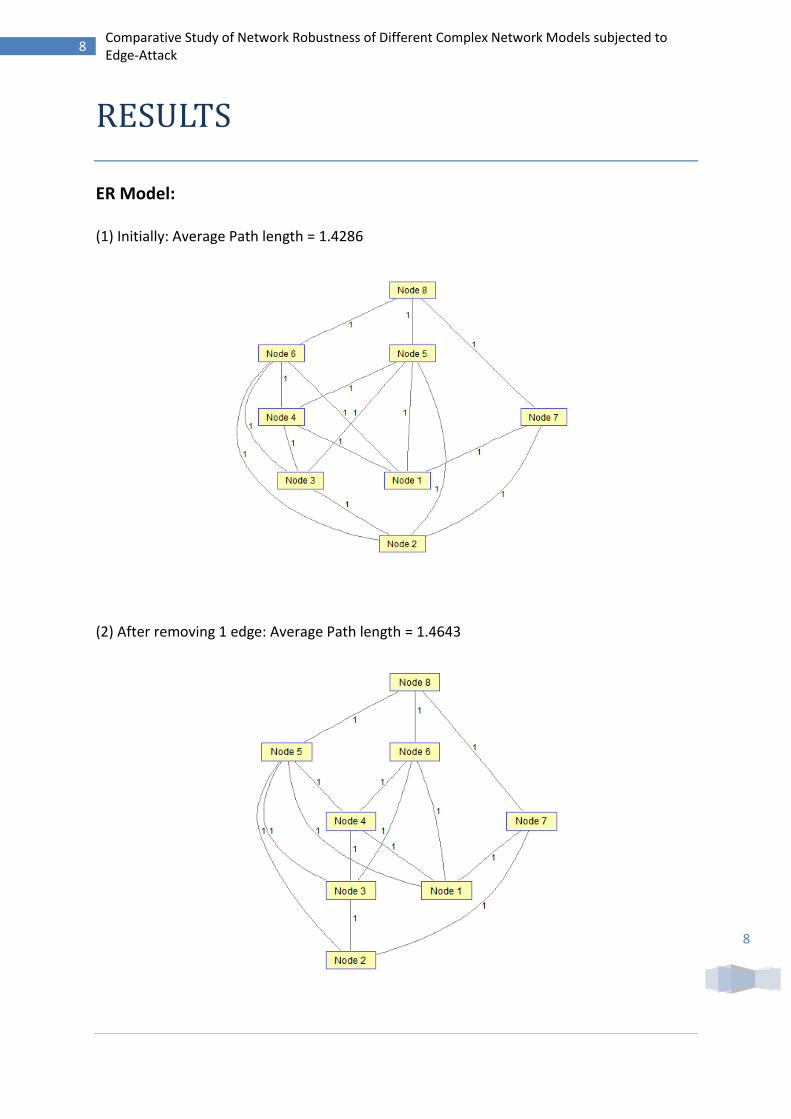
ER Model:
(1) Initially: Average Path length = 1.4286
(2) After removing 1 edge: Average Path length = 1.4643

9 Comparative Study of Network Robustness of Different Complex Network Models subjected to Edge-Attack
9
(3) After removing 2 edges: Average Path length = 1.5000
(4) After removing 3 edges: Average Path length = 1.6071
10 Comparative Study of Network Robustness of Different Complex Network Models subjected to Edge-Attack
10
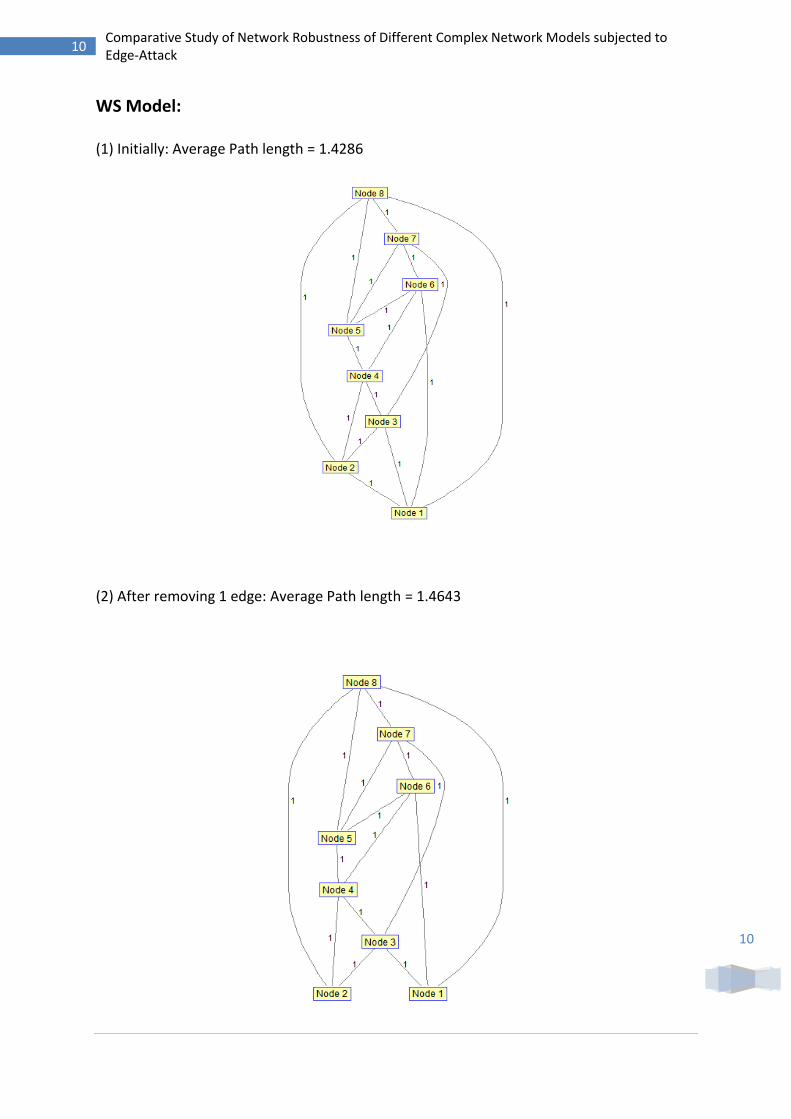
WS Model:
(1) Initially: Average Path length = 1.4286
(2) After removing 1 edge: Average Path length = 1.4643

11 Comparative Study of Network Robustness of Different Complex Network Models subjected to Edge-Attack
11
(3) After removing 2 edges: Average Path length = 1.5357
(4) After removing 2 edges: Average Path length = 1.6429

12 Comparative Study of Network Robustness of Different Complex Network Models subjected to Edge-Attack
12
CONCLUSION
As expected, the average path length (l) increased on removing edges for both: ER as
well as WS complex network models. Increase in l signifies that the robustness of the
network is being compromised by each edge attack. Also, we observed that increase in path
length was more or less same for both WS and ER models for initial removal of edges. But as
the No. of edges removed increased, the increase in the value of path length for WS model
far exceeded the increase in value for ER model. This suggests that ER model is more
robust, as compared to WS model of complex network.

13 Comparative Study of Network Robustness of Different Complex Network Models subjected to Edge-Attack
13
REFERENCES
D L H Wang and P V Mieghem, Spectral perturbation and reconstructability of complex
networks, Phys Rev E 81, 016101 (2010).
P Holme, B J Kim, C N Yoon, and S K Han, Attack vulnerability of complex networks, Phys
Rev E 65, 056109 (2002).
Reka Albert and Albert Laszlo Barabasi, Statistical mechanics of complex networks,
Revs Mod Phys 74, 47 (2002).
I Mishkovski, R Kojchev, D Trajanov, and L Kocarev, ICT Innovations, Ch 10, Springer.
Regino Criado, Julio Flores, Benito Hern´andez-Bermejo, Javier Pello and Miguel
Romance, Vulnerability of complex networks under random and intentional attacks,
Proceedings of the International Conference on Computational and Mathematical
Methods in Science and Engineering, CMMSE-2004 Uppsala, pp. 1–8 (2004).
U. Brandes, J. Math. Sociol. 25, 163 (2001).
M. E. J. Newman, Phys. Rev. E 64, 016131 (2001).
D. J. Watts and S. H. Strogatz, Nature 393, 440 (1998).
P. Erdos and A. Renyi, Publ. Math. Inst. Hung. Acad. Sci. 5, 17 (1960).