complexity, contingency, and criticality · lanches, of all sizes (2-5). the system exhibits...
TRANSCRIPT

Proc. Natl. Acad. Sci. USAVol. 92, pp. 6689-6696, July 1995Colloquium Paper
This paper was presented at a colloquium entitled "Physics: The Opening to Complexity," organized by Philip W.Anderson, held June 26 and 27, 1994, at the National Academy of Sciences, in Irvine, CA.
Complexity, contingency, and criticality(macroevolution/macroeconomics/punctuated equilibrium)
PER BAK AND MAYA PACZUSKIDepartment of Physics, Brookhaven National Laboratory, Upton, NY 11973
ABSTRACT Complexity originates from the tendency oflarge dynamical systems to organize themselves into a criticalstate, with avalanches or "punctuations" of all sizes. In thecritical state, events which would otherwise be uncoupledbecome correlated. The apparent, historical corntingency inmany sciences, including geology, biology, and economics,finds a natural interpretation as a self-organized criticalphenomenon. These ideas are discussed in the context ofsimple mathematical models of sandpiles and biological evo-lution. Insights are gained not only from numerical simula-tions but also from rigorous mathematical analysis.
I. Introduction
Complexity lies in the details, but science deals with general-ities. How, then, can one possibly imagine a science of com-plexity? The eminent biologist and science writer, Steven JayGould, has articulated this paradoxical question in his book"Wonderful Life" (1).
How should scientists operate when they must try to explain theresults of history, those inordinately complex events that canoccur but once in detailed glory? Many large domains ofnature-cosmology, geology, and evolution among them-must be studied with the tools of history. The appropriatemethods focus on narrative, not experiment as usually con-ceived.
Here, we present a different approach, which invokes thetraditional scientific method, rather than narrative, to studycomplex phenomena. We shall argue that self-organized crit-icality (SOC) (2-5) underlies the widespread appearance ofcontingency and complexity in nature. In particular, the sta-tistics of large-scale behavior obeys fundamental laws ofnature, even though the individual events themselves areunique. These fundamental laws are "universal" and describemany different types of systems. We will apply this analysis totwo domains referred to by Gould-namely, geology andevolution-as well as macroeconomics. This approach asksdifferent types of questions than the narrative method andleads to a complementary way of understanding complexity innature. This is achieved by rigorous mathematical analysis, aswell as numerical studies, of simple models. Before going intothe details of our method, we will explore, in general terms,what a science of complexity could be.
History Versus Science. Traditionally, sciences may begrouped into two categories: "hard" sciences, where repeat-able events can be predicted from a mathematical formalismexpressing the laws of nature, and "soft" sciences of complexsystems, where only a narrative account of distinguishableevents, in hindsight, is possible. Physics is simple but relatively
The publication costs of this article were defrayed in part by page chargepayment. This article must therefore be hereby marked "advertisement" inaccordance with 18 U.S.C. §1734 solely to indicate this fact.
difficult; history is complicated but perhaps easier. Historicalevents depend on freak accidents, so that if the tape of historywere replayed many times, the outcome would differ vastlyeach time. The mysterious occurrence of incidents leading todramatic outcomes has fascinated historians as well as fictionwriters. Would the Second World War have occurred if Hitlerhad not been born? Historians explain events in a narrativelanguage where event A leads to event B because event Cpreviously had led to events D and E. But suppose that eventC did not happen; then, the course of history would havechanged into another series of events. These would have beenequally well explainable, in hindsight, with a different narra-tive. History (including that of evolution or geology) dependson contingency. There is nothing wrong with this way of doingscience, where the goal is an accurate, narrative account ofspecific events.
Similarly, as explained by Gould (1), biological evolutiondepends on one accidental event after another. If the tape ofbiological evolution were to be replayed millions of times, notonce would we see a life form vaguely similar to ours. Con-tingency rules in the soft sciences, where the concept ofdetailed predictability is utterly irrelevant. Thus, the goal of ascience of evolutionary biology cannot be to explain why wehave elephants or humans. Life as we see it today is just onevery unlikely outcome among myriads of other equally unlikelypossibilities. For example, life on earth would probably betotally different if the dinosaurs had not become extinct,perhaps as a consequence of a meteor hitting the earth insteadof continuing its benign periodic orbit.
Similar considerations apply to economics, where largecatastrophes may depend on subtle decisions. For example,Black Tuesday in 1987, when the stock market crashed, may beattributed to the introduction of programmed trading. Theeconomist Brian Arthur has beautifully explained how thedominance of one product over another, such as the VHSsystem versus the Betamax system for video recording, de-pends on minor accidental events (6). These events are unre-lated to the ultimate performance of the competing systems. Ifthe tape of technological innovation were to be shown again,the resulting technology might well be different. Contingency,again, is the key issue.A Nonequilibrium Approach. What underlying properties of
history, biology, and economics make them sensitive to con-tingency? In other words, what common features lead tointerdependence and complexity? Why can accidents occurthat have dramatic global consequences? These questions havebeen raised rarely; the narrative account has been consideredto be sufficient explanation.From a physicist's viewpoint, though, biology, history, and
economics can be viewed as dynamical systems. Each systemconsists of many individual parts that interact with each other.In economics there are many agents, such as consumers,
Abbreviation: SOC, self-organized criticality.
6689

6690 Colloquium Paper: Bak and Paczuski
producers, governments, thieves, and economists. Theseagents each make decisions optimizing their own idiosyncraticgoals. The actions of one agent affect other agents. In biology,individual organisms-or from a more general perspective,individual species-interact with one another. The actions ofone organism affect the survivability, or fitness, of others. Ifone species changes by mutation to improve its own fitness,other species in the ecology are also affected.
In the past, it has usually been tacitly assumed that thesetypes of large systems are in stable equilibrium. The leadingeconomic theory up to now, "general equilibrium theory,"assumes that perfect markets, perfect rationality, and so on,bring economic systems into stable "Nash" equilibria. In theequilibrium state, small perturbations, or shocks, will causeonly small disturbances that eventually dissipate. In this theory,the system's response to a small impact is proportional to thesize of the impact; equilibrium systems are linear. Largefluctuations in equilibrium, noisy, systems can occur only ifmany random events accidentally pull in the same direction.This type of accidental concurrence is exponentially unlikely.As a result, the distribution of fluctuations in equilibriumsystems is Gaussian; large events are sharply cut off.The general equilibrium paradigm seems to us to be a deeply
flawed picture of economics. The general equilibrium theoryhas not been explicitly formulated for biology, but the pictureof nature as being in "balance" prevails in many circles. Natureis something that can, in principle, be conserved; this ideamotivates environmentalists and conservationists. No won-der-in a human lifetime very little changes, so equilibriumconcepts may seem natural or intuitive. As pointed out byGould and Eldredge (7, 8), though, this apparent equilibriumis only a period of relative tranquility, or stasis, betweenintermittent bursts of activity and volatility.Although we disagree with Gould's view that the traditional
scientific method is not appropriate to study complex phe-nomena (1), we completely agree with Gould and Eldredge'spicture of "punctuated equilibrium" (7, 8). We go further, andpropose that physical theories of nonequilibrium behavior inevolution and economics, for example, can be constructed.Von Neumann once referred to the theory of nonequilibriumsystems as the "theory of non-elephants." Nevertheless, weshall attempt such a theory of non-elephants.SOC. The basic idea is that large dynamical systems naturally
evolve, or self-organize, into a highly interactive, critical statewhere a minor perturbation may lead to events, called ava-lanches, of all sizes (2-5). The system exhibits punctuatedequilibrium behavior, where periods of stasis are interruptedby intermittent bursts of activity. Since these systems are noisy,the actual events cannot be predicted; however, the statisticaldistribution of these events is predictable. Thus, if the tape ofhistory were to be rerun, with slightly different random noise,the resulting outcome would be completely different. Somelarge catastrophic events would be avoided, but others wouldinevitably occur. No "quick-fix" solution can stabilize thesystem and prevent fluctuations. If this picture is correct forthe real world, then we must accept fluctuations and change asinevitable. They are intrinsic to the dynamics of biology,history, and economics. For the same reasons, we also abandonany idea of detailed predictability. In economics, the best wecan do, from a selfish point of view, is to shift disasters to ourneighbors. Large, catastrophic events occur as a consequenceof the same dynamics that produces small, ordinary events.This observation runs counter to the usual way of thinkingabout large events.
Empirically, it was pointed out by Mandelbrot (9-11) that,for many systems, the statistical probability distribution oflarge events is given by the same distribution functions as smallevents, implying a common dynamical origin. These distribu-tion functions are known as Pareto-Levy functions. The prob-ability of large events is given by the tails of those distributions,
which fall off as power laws-i.e., much slower than Gaussiandistributions. Mandelbrot (12) coined the term "fractal" todescribe scale-free, or power-law, behavior, although he didnot consider the physical origins of these fractals. Neverthe-less, scientists and others studying the fluctuations of marketswould consistently discard large events as anomalous, sinceeach could be attributed to specific "abnormal" circumstances.Contingency was used as an argument for statistical exclusion.Once the large events are discarded, the remaining eventstrivially obey Gaussian statistics, and the general equilibriumtheory can be preserved. As Mandelbrot pointed out, though,this is like throwing out the baby with the bathwater!A similar blind spot is found in the field of geology. When
studying earthquakes, scientists almost universally look forspecific mechanisms for large events-again using a narrative,historical description for each earthquake in isolation. Thisoccurs despite the fact that earthquakes follow a glaringlysimple distribution function known as the Gutenberg-Richterlaw (13). The Gutenberg-Richter law, as shown in Fig. 1, is apower law for the probability distribution of earthquakes. Theprobability to have an earthquake of energy E, P(E), isproportional to E-b, where b is a characteristic exponent.When plotted on a log-log scale, such power laws appear asstraight lines where the slope is -b. For comparison, aGaussian distribution is also plotted in Fig. 1, and the sharpcutoff in the tail of the distribution is apparent. The power lawhas no cutoff; it is a signature of scale-free, fractal phenomena.Of course, the statistics of the few large events in the tail of
the earthquake distribution is obviously poor, leading to asuperficial justification for a different treatment of theseevents. Similarly, Raup (15, 16) has pointed out that thedistribution of extinction events in biology follows a smoothdistribution where large events, such as the Cretaceous extinc-tion of dinosaurs, occur with fairly well-defined probability.Finally, the occurrence of large-scale structure in the distri-bution of galaxies in the universe has been taken as anargument against a statistical description of this distribution interms of fractals (17). On the contrary, we shall see thatinhomogeneities occur at any scale, including the largest, forcomplex dynamical systems. In our view, the present universeis one ofmany possible outcomes that would emerge if the tapeof the history of the universe were to be run again and again.Somewhat counterintuitively, the fact that one can come upwith specific narrative explanations for large events does notpreclude the possibility that the statistics of these events followregular laws of nature.The canonical model of SOC is a sandpile onto which sand
is dropped randomly (2-5). The sandpile model will be pre-
2.0-
1.0
0000
-1.0-
-2.01 2 3 4 5 6
m = log E
FIG. 1. Distribution of earthquakes in the New Madrid zone in thesoutheasternUnited States during the period 1974-1983,collected byJohnson and Nava (14). This power-law, scale-free behavior is com-pared to a Gaussian curve, which has a sharp cutoff.
Proc. Natl. Acad Sci. USA 92 (1995)

Proc. Natl. Acad. Sci. USA 92 (1995) 6691
sented and discussed in Section II. This model can also beviewed as a model of earthquakes, but more appropriatemodels of this and other geophysical and astrophysical phe-nomena have been constructed. In Section III, a simple modelof biological evolution (18) will be presented and discussed.With a change of language, this model can be thought of asrepresenting an economy of interacting, evolving agents. Muchprogress has come from numerical simulations of these andother models, but the model of biological evolution has theadded advantage that it is amenable to analytical studies, asdiscussed in Section IV. In collaboration with Sergei Maslov,we have derived explicit formulae for the self-organizationprocess (19) and for the statistical properties of the resultingcritical state (20, 21). Progress from this model has beenextended to other self-organized critical models representinggrowth phenomena (20-23). We believe that it provides ageneral phenomenology for dealing with contingency andcomplexity in nature.
II. The Sandpile Paradigm
Can there be a theory of contingency in complex systems? In1987 one of us, together with Chao Tang and Kurt Wiesenfeld,constructed a model which has become the paradigm ofself-organized critical behavior. The model represents thefollowing situation. Consider a pile of sand on a table, wheresand is added slowly, starting from a flat configuration. This isa dynamical system with many interacting degrees of freedom,represented by the grains of sand. The flat state represents thegeneral equilibrium state; this state has the lowest energy.Initially, the grains of sand will stay more or less where theyland. Eventually, the pile becomes steeper, and small ava-lanches, or sandslides, occur. The addition of a single grain ofsand can cause a local disturbance, but nothing dramatichappens. Eventually, the system reaches a statistically station-ary state, where the amount of sand added is balanced, onaverage, by the amount of sand leaving the system along theedges of the table. In this stationary state, there are avalanchesof all sizes, up to the size of the entire system.The collection of grains of sand has been transformed from
one where the individual grains follow their own independentdynamics, to one where the dynamics is global. In the station-ary state, there is one complex system, the sandpile, rather thanmany separate simple grains of sand. Note that in the inter-mediate state this is not the case. A simple change of theposition where sand is added results only in small, local changesto the configuration. The response, a small avalanche, isproportional to the impact. Contingency is irrelevant. Shift acouple of grains left or right, and the resulting state is onlymarginally affected. The flat sandpile (general equilibrium) orthe shallow sandpile does not describe the remarkable, seem-ingly accidental, occurrence of events; near equilibrium, theoutcome is not contingent on specific minor details.
In the resulting stationary state, though, the situation isentirely different. A single grain of sand might cause anavalanche involving the entire pile. A small change in theconfiguration might cause what would otherwise be an insig-nificant event to become a catastrophe. Suppose that at somepoint in time there happens to be a large avalanche, causingdevastating destruction to the pile. How would the historiandescribe what has happened, and how would the physicist? Letus first hear the historian's account of the event.A Historian Describes a Sandslide. "On December 16, 1994,
a grain of sand landed at the site with coordinates [14, 17] onthe pile. Adding to the grains of sand already accumulated atthis site, this addition caused a toppling of that site, spillingover to the neighboring sites. Unfortunately, one of these sites[14, 18] happened to be near an instability so that the topplingcaused this site to topple also. This toppling destabilized sites
[14, 19] and [15, 18] and eventually led to the collapse of a largepart of the pile.
"Clearly, the event was contingent on several factors. First,had the initial grain of sand fallen elsewhere, nothing dramaticwould have happened. Also, if the configuration at position[14, 19] had been slightly different, the sandslide would havestopped sooner, without devastating consequences. While wecan give an accurate and complete account of what actuallyhappened, we are at a loss to explain how these many acci-dental features could possibly have conspired to produce anevent of such magnitude. The event was contingent upon manyseparate, freak occurrences and could clearly have been pre-vented. Furthermore, we are baffled by the fact that eventhough sand had been added to the system for a longtime, onlyminor events had occurred before the devastating collapse,and we had every right to expect the system to be stable.Clearly, the event was a freak one caused by very unusual andunfortunate circumstances in an otherwise stable system thatappeared to be in balance. Precautions should and could betaken to prevent such events in the future."The physicist now would give a much more boring and
prosaic account of what happened.A Physicist Describes a Sandslide. "During a long transient
period, the pile evolved to a critical state with avalanches of allsizes. We were able to make a rough identification of thetoppling rule and to construct a computer model of thephenomenon. Actually, the particular rule that we use is notvery important. In any case, we do not have sufficient infor-mation about the details of the system to be able to makelong-term predictions.
"Nevertheless, our model exhibits some general features ofthe sandpile. We monitored how many avalanches of each sizeoccurred, after the addition of a single grain to the pile. Wemade a histogram (Fig. 2), and found that the distribution ofevents where a total of s sites topple obeys a power law, P(s)- s-T. Thus, if one waits long enough, one is bound to seeevents that are as large as one has the patience to wait for. Weran our simulations (the tape of evolution) several times.Eliminating the particular grain of sand that caused a partic-ular avalanche only made the system produce large avalanchessomewhere else at different times. Changing the rules slight-ly-for instance, by planting snow screens here and there-does not have any effect on the general pattern. Avalanches arean unavoidable and intrinsic part of the sandpile dynamics.
"Actually, I'm not interested in the specific details of theevent which Prof. Historian is so excited about and gives sucha vivid account of. What the professor sees as a string of freakevents appearing accidentally and mysteriously by an apparent
100
10-1
10-2
la10-3\z1'
s
FIG. 2. Power law distribution for avalanches in the sandpilemodel. Power laws appear as straight lines in double logarithmic plots.
Colloquium Paper: Bak and Paczuski

6692 Colloquium Paper: Bak and Paczuski
'act of God' and leading to a catastrophe is simply a manifes-tation of the criticality of the system. History has prepared thesandpile in a state that is far from equilibrium, and the matrixthrough which the avalanche propagates is predisposed toaccommodate events of large sizes. The complex dynamicswhich is observed in the 'historical science,' where the outcomeappears contingent on many different, specific events, repre-sents the dynamics of self-organized critical systems."
Universality. Incidentally, the historian is able to makeshort-term predictions by carefully identifying the rules andmonitoring his local environment. If he sees an avalanchecoming he can predict when it will hit with some degree ofaccuracy. His situation is similar to that of the weatherman: byexperience and data collection he can make forecasts, but thisgives him no insight into how the climate works. For instance,he does not understand the statistical fluctuations of sunshine,rain, etc.A computer sandpile model, like the one mentioned above,
can easily be constructed. The underlying philosophy is thatgeneral features, like the appearance of large catastrophes, andperhaps critical exponents, are not sensitive to the details ofthe model. Since we understand so little about these kinds ofsystems, we allow ourselves to study the simplest models thatcould possibly represent the phenomena under consideration.One guiding principle of physics is the concept of universality.What this means is that important features of large-scale
phenomena are grossly insensitive to the particular details ofthe models and are shared between seemingly disparate kindsof systems. This concept of universality has served well in thestudy of equilibrium phenomena; in particular, it has beencrucial to understanding phase transitions. Of course, we haveto demonstrate that our models are robust and insensitive tochanges in the rules. If, unfortunately, it turns out that they arenot, we are back to the messy situation where detailed engi-neering-type models of the horrendously complex phenomenais the only possible approach (i.e., the weatherman's ap-proach), and the field is no place for a physicist to be.The Sandpile Model. The sandpile model is defined as
follows. The height of the pile at the point with coordinates (i,j) is denoted Z(i, j). Each height has an integer value. At eachtime step, the height at some random point is increased byunity, Z -* Z + 1. If the height at that site now exceeds anarbitrary critical height, Zcr, then a toppling event occurs,where the height of the unstable site is reduced by 4 units andthe height at each of the four neighbors on the square latticeis increased by 1 unit. This is true except along the boundarieswhere sand is thrown out of the pile. If any of the neighboringsites are now unstable (Z > Zcr), the process continues untilnone of the Z values in the system exceeds the critical value.Then the avalanche is over, and a new avalanche can be startedby adding another grain of sand to the system. The totalnumber of topplings during the avalanche is counted; this
FIG. 3. Evolving avalanche in sandpile model. (A) The configuration before a grain of sand is dropped. The various colors indicate heights 0-3,with 3 being the critical height. (B-D) Snapshots during the avalanche. The red color indicates sites that have toppled. Yellow sites are active, topplingsites. (Figure courtesy of M. Creutz.)
Proc. Natl. Acad. Sci. USA 92 (1995)

Proc. Natl. Acad. Sci. USA 92 (1995) 6693
A60
0
= 40xL1J
C
, 20cL-
number, s, is the size of the avalanche. That is all! Fig. 3 showssnapshots of a propagating large avalanche.The sandpile model has been generalized to represent
earthquakes (24) or even starquakes (26). A modified versionhas been applied to economics (27). It was demonstrated thatsmall shocks may lead to large avalanches of economic activity.The SOC behavior of these models has been documented bycomputer simulations. A few interesting analytical results havealso been obtained, mostly by Deepak Dhar (28, 29). Forexample, Dhar was able to count the number of configurationsin the stationary state. However, no analytical results forcritical behavior, such as the value of the exponent T, exist.Nevertheless, the sandpile picture has served well in providingan intuitive picture of SOC, traveling far beyond the physicscommunity, and applied to many different kinds of situations.As Vice President Albert Gore has observed in his recent book(30), "The sandpile theory-self-organized criticality-is irre-sistible as a metaphor..."
0I -A S ID C I P J K T
l400 200
Geologic Time
B
50
III. Punctuated Equilibrium and SOC in Evolution
Some empirical observations indicate that biology operates ina critical state. This has been documented recently in greatdetail, and we refer the interested reader to that paper (31) fora more complete discussion. Fig. 44 shows the pattern ofextinction events from the fossil history, as recorded by J. J.Sepkoski (32). There are long periods of relatively little activityinterrupted by narrow intervals, or bursts, with large activity.Raup (15, 16, 33, 34) has plotted the data for the bursts as ahistogram, as shown in Fig. 4B; this histogram suggests that thefrequency of large events follows smoothly from the proba-bility of small events. The histogram indicates that both largeand small extinction events have a common dynamic origin.The distribution of extinction events of size s can roughly beinterpreted as a power law, P(s) - s T, where 1 , X S 2. Also,the distribution of lifetimes of fossil genera appears to obey apower law. The apparent punctuated equilibrium behaviorboth with respect to behavior of many species (or massextinction events) and with respect to the behavior of singlespecies indicates that both are collective effects involving manyinteracting degrees of freedom. They are two sides of the samecoin.A general theory or model of biological evolution must
necessarily be abstract. It must, in principle, be able to describeall possible scenarios for evolution. For instance, it should beable to describe life on Mars, if it were to occur. This, of course,is an extremely precarious step. Only intuition can tell us whatis important and what is not. The model cannot have anyspecific reference to actual species. It may, perhaps, not evenrefer to basic chemical processes or to DNA. It is preciselybecause of contingency that we cannot expect the theory toproduce anything specific that is actually observed, in markedcontrast to traditional theories. Biologists will complain thatour models do not produce elephants.We shall discuss a particularly simple toy model of an
ecology of evolving species, the Bak-Sneppen (BS) model(18). The underlying picture is one where species interact witheach other. When evolving to improve their fitness, presumablythrough random mutations, followed by selection of the fittervariants, they affect the fitness of other species in the globalecology. For a discussion of the general philosophy, seeKauffman's book (35).For simplicity and bookkeeping, species are placed on a
d-dimensional square lattice. The function of the lattice is todefine who is interacting with whom: each species interactswith its 2d nearest neighbors. The one-dimensional case can bethought of as a food chain. Initially, the species are assignedrandom numbers, fi, from 0 to 1. fi represents the fitness ofspecies i. It does not really matter what the starting point is. Ateach step the site i with the lowest fitness is chosen, and its
gi 40cm
co°0)
0
-o
z 20
10
0 20 40 60Percent Extinction
80 100
FIG. 4. (A) Extinction events recorded over 600 million years[reproduced from Sepkoski (32) with permission (copyright Paleobi-ology)]. The curve shows the estimated percentage of species thatbecame extinct during consecutive intervals of 5 million years. Geo-logic periods are indicated: C, Cambrian; 0, Ordovician, S, Silurian;D, Devonian; C, Carboniferous; P, Permian; TR, Triassic; J, Jurassic;K, Cretaceous; T, Tertiary. (B) Histogram of the same events [repro-duced from Raup (15) with permission (copyright AAAS)].
number fi is replaced by a different random number, which issomewhere between 0 and 1. This step represents either amutation to a different species, or the extinction of a speciesfollowed by replacement of another species in the sameecological niche. It mimics the Darwinian principle (36) thatthe least fit species become extinct. The random numbers atthe 2d nearest neighbor sites are also replaced with newrandom numbers between 0 and 1. The fitness of the neighborsis contingent upon the properties of the species with which theyinteract. Thus, their happy and stable life (with maybe highrandom numbers) might become undermined by weak neigh-bors, so that they become next in line for extinction.The model is so general that it can also be thought of as a
model for macroeconomics. The individual sites representeconomic agents, and the random numbers f1 represent their"utility functions." Agents modify their behavior to increasetheir wealth. The agents with lowest utility functions disappearand are replaced by others. This, in turn, affects other agentsand changes their utility functions.What could be simpler and have less structure than replacing
some random numbers with other random numbers? Despitethe simplicity of the model, its analysis is amazingly rich. Aftermany updates have occurred, the ecology reaches a state in
I
Colloquium Paper: Bak and Paczuski

6694 Colloquium Paper: Bak and Paczuski
1 .-U . . . _- -
100 200x
)nn
.5
0
E 00
4.4
U300 0 100
lime
200
FIG. 5. Snapshot of f vs. position x during an avalanche in theevolution model. Mostfvalues are above the critical value. The clusterof active sites with f < f, participate in the avalanche and undergofrequent changes.
which the density of species with fitnesses below a critical valuefc is zero. Species are uniformly distributed with fitness abovef,. No random number abovefc is ever chosen to mutate on itsown. This stationary state is punctuated by avalanches, where,locally, the random numbers are less thanf,; see Fig. 5. Duringan avalanche, a great deal of rapid activity occurs in whichspecies come and go at a fast pace. Nature "experiments" untilit finds another "stable" ecology with high fitnesses. TheCambrian explosion 500 million years ago can be thought of asthe grandmother of all such avalanches.
Fig. 6 shows the activity pattern in the ld model. It is a
fractal in space and time. Note the appearances of holes of allsizes between subsequent returns of activity to a given site.These holes represent periods of stasis where a species does notmutate or become extinct. Fig. 7 shows the integrated activityalong the time axis at one particular site. This figure illustratespunctuated equilibrium behavior for a single species. Webelieve that this punctuated equilibrium behavior, first notedby Gould and Eldredge (7, 8), is common to all complexdynamical systems. The punctuations for single species are
correlated to the avalanches in the global ecology.In contrast to real biological evolution, in the computer
evolution model the tape of Life may be rerun many times. Itis easy to go back and find the event which triggered thepunctuation starting at s 100 in Fig. 7. What would have
10,000, I
8,0(
6,0(
4,0(
2,0(
...........!!.1.
-30 -20 -10 0 10 20R
FIG. 6. Fractal cluster of activity in the ld evolution model. Thehorizontal axis is a row of lattice sites; the vertical axis is time, s, or thenumber of update steps (22, 23).
FIG. 7. Accumulated number of changes, or mutations, at a singlesite in the stationary state. The curve exhibits punctuated equilibriumbehavior, with periods of stasis interrupted by intermittent bursts. Thelarge bursts are correlated with large avalanches. The lower curveshows the result of rerunning the tape of evolution. A single updateevent, at the beginning of a large avalanche, was cancelled. This led todramatically different behavior in the replay, demonstrating contin-gency.
happened if that event had not occurred? Thus, we simply skipone update step in our simulation but choose the same randomnumbers as before for all subsequent updates. Fig. 7 also showsthe alternative run. Indeed, this change prevented the largeavalanche, but other disasters happened instead, at a differentpoint in time. In a noncritical, noninteractive biology, theeffects of contingency are much less dramatic. So if we studythe evolution model during the transient period before thesystem reaches criticality, we find evolution to be gradual,without large punctuations, and rerunning the tape with smallmodifications leads to the same history. In a noncriticalbiology, a meteor may not have been sufficient to trigger a
major extinction event.
IV. Analytical Results
The evolution model is fascinating to theorists wanting tounderstand self-organized criticality. In contrast to sandpileand earthquake models, it has yielded to analytical mathe-matical efforts. These efforts include mean-field results byFlyvbjerg and coworkers (37, 38), a conjecture that themodel can be related to Reggeon field theory (39) fromhigh-energy physics that was made independently by us (19)and by Ray and Jan (25), and, finally, exact results, which wediscuss here. In collaboration with Sergei Maslov, we havederived three fundamental equations that describe the pro-cess of self-organization (19), the hierarchical structure ofthe avalanches, and the stationarity condition (20, 21),respectively.The Self-Organization Process: The Gap Equation. The
critical stationary state is approached algebraically, throughtransient states. Let us consider the situation where thedistribution off values initially is uniform in the interval 0to 1 in a d-dimensional system of linear size L. The first valueoff to be chosen for updating is O(L-d). Eventually, after s
time steps, a gap G(s) opens up in the distribution off values.We define the current gap, G(s), to be the maximum of allminimum random numbers chosen, fmin(s'), for all 0 c s' <s. Fig. 8 shows fmin as a function of s during the transient fora small system. The full line shows the gap G(s) as a
monotonically increasing function of s. By definition, theseparate instances when the gap G(s) jumps to its next highervalue are separated by avalanches. The average size of thejump in the gap at the completion of each avalanche is [1 -G(s)]/Ld. Consequently, the growth of the gap versus time,s, obeys the following gap equation (19):
16 *._0.8-
R 0.64
0.4-
0
r
.-r_
.P.
.. In..,
Proc. Natl. Acad. Sci. USA 92 (1995)
A
Proc. Natl. Acad. Sci. USA 92 (1995) 6695
0.6 -
0.4-a
0.2-
0.0-~*0 S1 00 2600
s
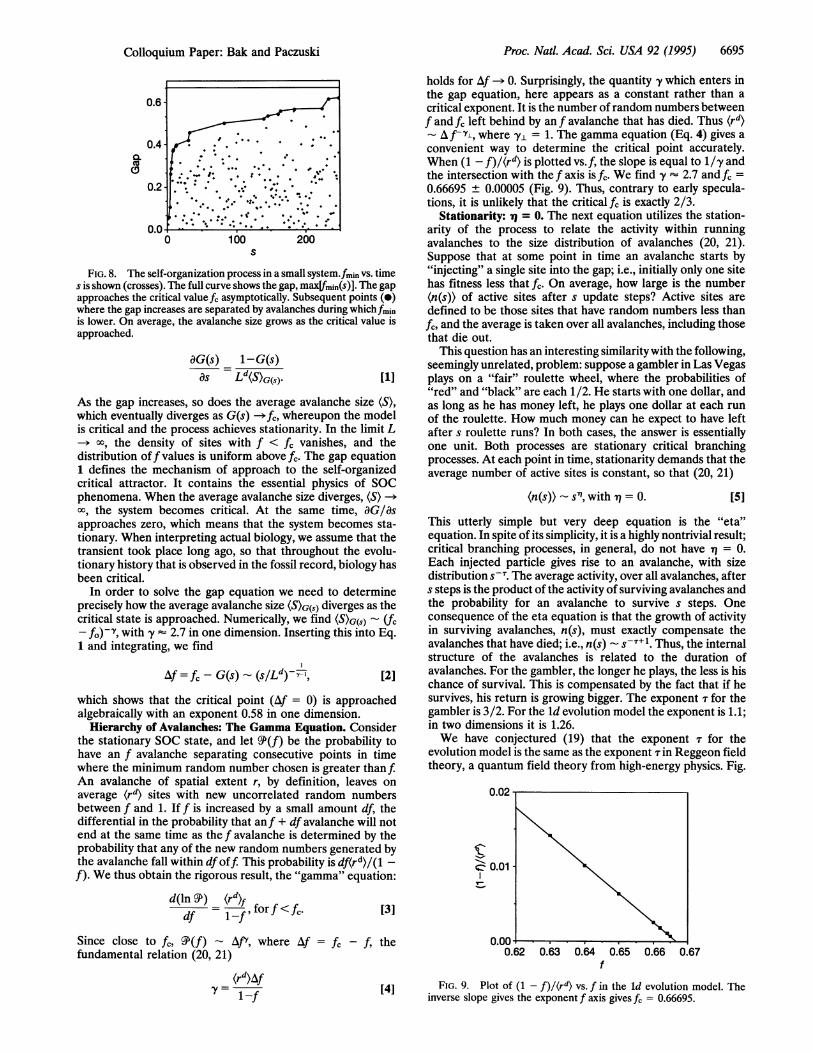
FIG. 8. The self-organization process in a small system.fmin vs. times is shown (crosses). The full curve shows the gap, max[fmin(s)]. The gapapproaches the critical value fc asymptotically. Subsequent points (0)where the gap increases are separated by avalanches during whichfminis lower. On average, the avalanche size grows as the critical value isapproached.
aG(s) 1-G(s)as Ld(S)G(s)- [1]
As the gap increases, so does the average avalanche size (S),which eventually diverges as G(s) *,, whereupon the modelis critical and the process achieves stationarity. In the limit L
00, the density of sites with f < f, vanishes, and thedistribution off values is uniform above fc. The gap equation1 defines the mechanism of approach to the self-organizedcritical attractor. It contains the essential physics of SOCphenomena. When the average avalanche size diverges, (S)a), the system becomes critical. At the same time, aG/asapproaches zero, which means that the system becomes sta-tionary. When interpreting actual biology, we assume that thetransient took place long ago, so that throughout the evolu-tionary history that is observed in the fossil record, biology hasbeen critical.
In order to solve the gap equation we need to determineprecisely how the average avalanche size (S)G(s) diverges as thecritical state is approached. Numerically, we find (S)G(s) - (fC- fo)-Y, with y 2.7 in one dimension. Inserting this into Eq.1 and integrating, we find
Af = fc - G(s) - (S/Ld) T-, [2]
which shows that the critical point (Af = 0) is approachedalgebraically with an exponent 0.58 in one dimension.
Hierarchy of Avalanches: The Gamma Equation. Considerthe stationary SOC state, and let QP(f) be the probability tohave an f avalanche separating consecutive points in timewhere the minimum random number chosen is greater than fAn avalanche of spatial extent r, by definition, leaves onaverage (rd) sites with new uncorrelated random numbersbetween f and 1. If f is increased by a small amount df, thedifferential in the probability that anf + df avalanche will notend at the same time as the f avalanche is determined by theprobability that any of the new random numbers generated bythe avalanche fall within dfoff This probability is df(rd)/(1 -
f). We thus obtain the rigorous result, the "gamma" equation:
d(ln QI) (rd)fd =I91 rfforf<fc. [3]df 1-f'Since close to fc, ?P(f) AAfY, where Af = fc - f, thefundamental relation (20, 21)
(rd)Af r
[4]
holds for Af -O 0. Surprisingly, the quantity y which enters inthe gap equation, here appears as a constant rather than acritical exponent. It is the number of random numbers betweenf and fc left behind by an f avalanche that has died. Thus (rd)- A f-'Y, where y± = 1. The gamma equation (Eq. 4) gives aconvenient way to determine the critical point accurately.When (1 - f)/(rd) is plotted vs.f, the slope is equal to 1/y andthe intersection with the f axis is f. We find y- 2.7 and fc =0.66695 ± 0.00005 (Fig. 9). Thus, contrary to early specula-tions, it is unlikely that the critical fc is exactly 2/3.
Stationarity: q = 0. The next equation utilizes the station-arity of the process to relate the activity within runningavalanches to the size distribution of avalanches (20, 21).Suppose that at some point in time an avalanche starts by"injecting" a single site into the gap; i.e., initially only one sitehas fitness less that fc. On average, how large is the number(n(s)) of active sites after s update steps? Active sites aredefined to be those sites that have random numbers less thanfc, and the average is taken over all avalanches, including thosethat die out.
This question has an interesting similarity with the following,seemingly unrelated, problem: suppose a gambler in Las Vegasplays on a "fair" roulette wheel, where the probabilities of"red" and "black" are each 1/2. He starts with one dollar, andas long as he has money left, he plays one dollar at each runof the roulette. How much money can he expect to have leftafter s roulette runs? In both cases, the answer is essentiallyone unit. Both processes are stationary critical branchingprocesses. At each point in time, stationarity demands that theaverage number of active sites is constant, so that (20, 21)
(n(s)) - s', with 7q = 0. [5]
This utterly simple but very deep equation is the "eta"equation. In spite of its simplicity, it is a highly nontrivial result;critical branching processes, in general, do not have q = 0.Each injected particle gives rise to an avalanche, with sizedistribution s-T. The average activity, over all avalanches, afters steps is the product of the activity of surviving avalanches andthe probability for an avalanche to survive s steps. Oneconsequence of the eta equation is that the growth of activityin surviving avalanches, n(s), must exactly compensate theavalanches that have died; i.e., n(s) S-T+1. Thus, the internalstructure of the avalanches is related to the duration ofavalanches. For the gambler, the longer he plays, the less is hischance of survival. This is compensated by the fact that if hesurvives, his return is growing bigger. The exponent T for thegambler is 3/2. For the ld evolution model the exponent is 1.1;in two dimensions it is 1.26.We have conjectured (19) that the exponent T for the
evolution model is the same as the exponent Tin Reggeon fieldtheory, a quantum field theory from high-energy physics. Fig.
0.62 0.63 0.64 0.65 0.66f
FIG. 9. Plot of (1 -f)/(rd) vs. f in the Id evolution model. Theinverse slope gives the exponent f axis gives f, = 0.66695.
.-- . . - :.
Colloquium Paper: Bak and Paczuski
=1-

6696 Colloquium Paper: Bak and Paczuski
2
log s
FIG. 10. Average number of active sites (n) s time steps after theinitiation of a single avalanche (lower curve) in the 2d evolution model.The curve approaches a constant, indicating q = 0. The upper curve
shows the (larger) number of active sites in surviving avalanches, n(s)S-T+1 (20, 21).
10 also shows the growth of activity in surviving clusters,increasing with the exponent T = 1.26. Actually, for the randomneighbor model studies by Flyvbjerg et al, (37) and by de Boeret al. (38), the exponent is also 3/2. The equivalence of thesituation of the gambler with evolution, in "mean-field," is notaccidental. We survive by chance and coincidence rather thanby merit. Whatever fairness exists is statistical; both the fairroulette wheel and evolution have 7 = 0.
These equations, and other general considerations, lead toan alphabet soup of scaling relations for various physicalquantities, such as the fractal dimension of the avalanche, D,in Fig. 6, the fractal dimension of active sites which havefitnesses less than the critical value, df, and the power spectrumof the local activity, S(f). All of the critical exponents can beexpressed in terms of two fundamental exponents, D and T.
These two independent exponents are possibly given by Reg-geon field theory. In conclusion, we have a rather completedescription of the self-organization process and the resultingcritical properties in the stationary attractor. The hope is thatinsight derived from the detailed study of this particular modelcan be extended to produce a more general phenomenologicaltheory of complexity in nature. That theory will not bebeautiful; it trivializes all the nuances and details that makecomplex systems exciting for humans. These details becomejust one possible realization among many other possibilitiesallowed by the theory.
This work was supported by the U.S. Department of Energy,Division of Materials Science, under contract DE-AC02-76CH00016.M.P. thanks the U.S. Department of Energy Distinguished Postdoc-toral Research Program for financial support.
1. Gould, S. J. (1989) Wonderful Life (Norton, New York).2. Bak, P., Tang, C. & Wiesenfeld, K. (1987) Phys. Rev. Lett. 59,
381-384.3. Bak, P., Tang, C. & Wiesenfeld, K. (1988) Phys. Rev. A 38,
364-374.4. Bak, P. & Chen. K. (1991) Sci. Am. 264, 46-53.5. Bak, P. & Paczuski, M. (1993) Phys. World 6, 39-43.6. Arthur, B. (1990) Sci. Am. 2, 92-99.7. Gould, S. J. & Eldredge, N. (1977) Paleobiology 3, 114-151.8. Gould, S. J. & Eldredge, N. (1993) Nature (London) 366, 223-
227.9. Mandelbrot, B. (1963) J. Bus. Univ. Chicago 36, 394.
10. Mandelbrot, B. (1964) J. Bus. Univ. Chicago 37, 393.11. Mandelbrot, B. (1960) Int. Econ. Rev. 1, 79.12. Mandelbrot, B. B. (1983) The Fractal Geometry of Nature (Free-
man, New York).13. Gutenberg, B. & Richter, C. F. (1956) Ann. Geofis. 9, 1.14. Johnston, A. C. & Nava, S. J. (1985) J. Geophys Rev. B 90, 6737.15. Raup, D. M. (1986) Science 231, 1528-1533.16. Raup, D. M. (1991) Bad Genes orBad Luck (Norton, New York).17. Peebles, P. J. E. (1989) Physica D 38, 273-278.18. Bak, P. & Sneppen, K. (1993) Phys. Rev. Lett. 71, 4083-4086.19. Paczuski, M., Maslov, S., & Bak, P. (1994) Europhys. Lett. 27,
97-100.20. Paczuski, M., Maslov, S. & Bak, P. (1995) Phys. Rev. E, in press.21. Paczuski, M., Bak, P. & Maslov, S. (1995) Phys. Rev. Lett. 74,
4253-4256.22. Maslov, S., Paczuski, M. & Bak, P. (1994) Phys. Rev. Lett. 73,
2162-2165.23. Maslov, S. & Paczuski, M. (1994) Phys. Rev. E 50, 643-646.24. Olami, Z., Feder, H. J. S. & Christensen (1992) Phys. Rev. Lett.
68, 1244-1247.25. Ray, T. S. & Jan, N. (1994) Phys. Rev. Lett. 72, 4045-4048.26. Morley, P. D. & Garcia-Pelayo, R. (1993) Europhys Lett. 23,
185-189.27. Bak, P., Chen, K., Scheinkman, J. & Woodford, M. (1993) Ric.
Econ., 3-30.28. Dhar, D. (1990) Phys. Rev. Lett. 64, 1613-1616.29. Majumdar, S. N. & Dhar, D. (1992) Physica A 185, 129-145.30. Gore, A. (1992) Earth in the Balance (Houghton Mifflin, Boston).31. Sneppen, K., Bak, P., Flyvbjerg, H. & Jensen, M. H. (1995) Proc.
Natl. Acad. Sci. USA 92, 5209-5213.32. Sepkoski, J. J., Jr. (1993) Paleobiology 19, 43-51.33. Raup, D. M. & Sepkoski, J. J., Jr. (1982) Science 215, 1501-1503.34. Raup, D. M. & Boyajian, G. E. (1988) Paleobiology 14, 109-125.35. Kauffman, S. A. (1993) The Origins of Order: Self Organization
and Selection in Evolution (Oxford Univ. Press, Oxford).36. Darwin, C. (1910) The Origin of Species by Means of Natural
Selection (Murray, London), 6th Ed.37. Flyvbjerg, H., Sneppen, K. & Bak, P. (1993) Phys. Rev. Lett. 71,
4087-4090.38. de Boer, J., Derrida, B., Flyvbjerg, H., Jackson, A. & Wettig, T.
(1994) Phys. Rev. Lett. 73, 906-909.39. Grassberger, P. & de la Torre, A. (1979) Ann. Phys. (N.Y) 122,
373.
Proc. Natl. Acad. Sci. USA 92 (1995)