complexity in college admission - connecting education policy with
TRANSCRIPT

Research Findings of Parent and Student Perceptions of Complexity in College Admission
Commissioned by the Task Force on Admissions in the 21st Century
October 2010
Complexity in College Admission: Fact or Urban Myth

The College Board
The College Board is a not-for-profit membership association whose mission is to connect students to college success and opportunity. Founded in 1900, the College Board is composed of more than 5,700 schools, colleges, universities and other educational organizations. Each year, the College Board serves seven million students and their parents, 23,000 high schools, and 3,800 colleges through major programs and services in college readiness, college admission, guidance, assessment, financial aid and enrollment. Among its widely recognized programs are the SAT®, the PSAT/NMSQT®, the Advanced Placement Program® (AP®), SpringBoard® and ACCUPLACER®. The College Board is committed to the principles of excellence and equity, and that commitment is embodied in all of its programs, services, activities and concerns.
For further information, visit www.collegeboard.com.
The College Board Advocacy & Policy Center
The College Board Advocacy & Policy Center was established to transform education in America. Guided by the College Board’s principles of excellence and equity in education, we work to ensure that students from all backgrounds have the opportunity to succeed in college and beyond. We make critical connections between policy, research and real-world practice to develop innovative solutions to the most pressing challenges in education today.
www.collegeboard.com/advocacy
© 2010 The College Board. College Board, ACCUPLACER, Advanced Placement, AP, SAT, SpringBoard and the acorn logo are registered trademarks of the College Board. PSAT/NMSQT is a registered trademark of the College Board and National Merit Scholarship Corporation. All other products and services may be trademarks of their respective owners. Visit the College Board on the Web: www.collegeboard.com.
Complexity in College Admission: Fact or Urban MythResearch Findings of Parent and Student Perceptions of Complexity in College Admission Commissioned by the Task Force on Admissions in the 21st Century
October 2010

Contents
Introduction . . . . . . . . . . . . . . . . . . . . . . . . . . 1
Background and Purpose . . . . . . . . . . . . . . . . . . . . . 2
Executive Summary . . . . . . . . . . . . . . . . . . . . . . . 3
Research Method . . . . . . . . . . . . . . . . . . . . . . . . 6
Summary of Findings . . . . . . . . . . . . . . . . . . . . . . 7
I. Getting Information about Colleges . . . . . . . . . . . . . . . 7
II. Application Process: General. . . . . . . . . . . . . . . . . 10
III. Application Process: Schools to Which Students Applied . . . . . . 19
IV. Application Process: Features of the Application Process. . . . . . 24
V. Application Process: By School Type and Size . . . . . . . . . . 35
VI. Sources of Help During the College Application Process . . . . . . 44
VII. Overall Perceptions of the College Application Process . . . . . . 51
VIII. Parents’ Experiences with the College Application Process . . . . . 57
IX. Demographics . . . . . . . . . . . . . . . . . . . . . . 62


Research Findings of Parent and Student Perceptions of Complexity
in College Admission
1
Introduction
In September 2007, the College Board formed the Task Force on Admissions in the 21st Century in response to a request from the Guidance and Admission Assembly Council (GAA Council) to more closely examine the high-school-to-college transition process. Each spring, at the conclusion of the college admission cycle, there is much discussion in the media and professional circles about the problems experienced by all involved in the transition.
Students and parents complained about the lack of transparency in the process; the confusing nature of the application process; how difficult it was to secure good information about college choice and how the outcomes were unpredictable and sometimes appeared to defy logic. School counselors expressed similar concerns regarding process and outcomes, and they empathized with their students. Colleges and universities lamented the increased pressure to review a growing number of applications from students who appeared to be filing larger numbers of applications. The students also seemed to be driven to a higher level of self-promotion beyond what was required in the application process, as a response to exert more control over what they (the students) perceived to be an increasingly complex, unpredictable and opaque process.
The GAA Council was concerned that these conditions were a potential threat to access to higher education for all students. The intent of this study is to determine which part or parts of the application process are complex and cause the most significant levels of confusion and anxiety for students. The intent is also to determine if outcomes vary across subgroups of the college-bound population.
For 18 months, the Task Force on Admissions in the 21st Century examined many factors and influences that make up the secondary-school-to-college transition. The
topic of complexity came to the forefront throughout the discussions. The outcome of the task force was an overarching framework for the profession to approach solutions as a profession “at its best.” It held that the school-to-college transition should be seen as a learning opportunity, “At its best, admission is about ‘fit’ between student and institution.” Anything that interfered with that process, including unnecessary complexity, was undesirable and a barrier to access.
The task force also set forth seven action commitments, including the need to create professional development materials that addressed 10 core areas of concern, among them “complexity in the admission and financial aid process.”
A research design was developed to explore the basic elements of the actual college application process (as distinct from financial aid, which was being explored by a separate and simultaneous quantitative research effort). The focus of the research, described in detail in the following section, was to measure student and parent perceptions of the complexity of the process and to segment the research group by geography, level of family experience with postsecondary education, race/ethnicity and income. This report contains the finding of this first phase of the research.
The results of the research will be used to inform the profession — principally admission officers and school counselors — and help shape the responses to the needs of students and their parents with a clearer understanding of their experience with the school-to-college transition process. The findings provide a better understanding of which student and parent subgroups find the process the most complex and why, and how it can be made less complex to remove potential barriers to access to higher education for all students.

Complexity in College Admission: Fact or Urban Myth
2
Background and Purpose
The purpose of this research is to better understand how complicated or confusing the college application process is for students applying to college; to determine if this process is more complicated for various subgroups; and to examine its impact on college access and enrollment.
The study surveyed high school students who applied to college and the parents of students who applied to college to examine the following:
• Usefulnessofresourcesprovidedbyhighschoolstoassist with the college application process
• Howcomplicateditwastodecidetowhichcollegesstudents should apply
• Howconfusingvariousaspectsofthecollegeapplication process were (e.g., submitting test scores, completing the application form, knowing who to ask if they had questions)
•Whetherstudentscompletedadditionaltasksaspartof the college application process (e.g., writing essays, interviews) and how difficult these tasks were for students
•Whostudentsandparentsturnedtoforhelpiftheyhadquestions about the college application process
• Howstressfulthecollegeapplicationprocesswas
•Whethertherewereanydifferencesinperceptionsofthe college application process based on the type of school to which students applied (e.g., public or private school)
•Whethertherewereanydifferencesinperceptionsofthe college application process among subgroups of interest (e.g., first-generation students, low-income students)
The College Board Advocacy & Policy Center retained the independent market research firm of Anderson, Niebuhr & Associates Inc. to conduct the research.

Research Findings of Parent and Student Perceptions of Complexity
in College Admission
3
Executive Summary
This section of the report provides a summary of the core findings of the research, organized by the eight core areas from the student and parent questionnaires. Key supporting data tables, charts, graphs and additional commentary can be found in the following section of this report.
I. Getting Information About Colleges
•Seventy percent of all high schools offered classes or seminars to students to help explain the college application process, although about one-third did not. These types of classes were even more common in the western region of the country. Of those students who attended such a class, most found it helpful in clarifying the college application process.
•About three-quarters of parents reported that their child’s high school offered presentations or seminars to parents to explain the college application process to them. Of those parents who attended such a presentation, most found it helpful, especially lower-income parents and parents whose child applied to five or more colleges.
II. Application Process: General
•The decision as to which colleges students would apply was generally made by the student, or jointly between the student and the family. Fifty-seven percent of students were more likely to think that they were completely in control of the decision, whereas 50 percent of parents were more likely to think that it was a joint decision.
•Sixty-one percent of first-generation college students were the most likely to believe that the decision as to where to apply to college was made entirely on their own. In addition, lower-income parents were more likely to believe that the decision of where to apply to college was made entirely by their child.
•Deciding where to apply to college was moderately complicated for students; difficulty regarding where
to apply appeared to increase as students added more and more schools to their lists. The decision was also slightly more difficult for those in the western region compared to those located elsewhere.
•About half of students completed a common application form when applying to college, and this form made the process notably simpler for most who used one.
•Knowing how to send test scores and high school transcripts to colleges was fairly clear to students. However, those students in the western region found these tasks slightly more confusing.
III. Application Process: Schools to Which Students Applied
•On average, students applied to about four colleges or universities. About one-third applied to five schools or more, while a similar percentage reported applying to only one or two.
•Students most frequently applied to public schools and in-state schools, with considerably fewer applying to private schools and out-of-state schools. First-generation students were more likely to apply to in-state and public colleges; those from high-income families were more likely to apply to out-of-state and private colleges.
•There was greater variability regarding the size of schools to which students applied, although a majority reported applying to large schools.
IV. Application Process: Features of the Application Process
•Overall, most respondents indicated that applying to college was a fairly simple process for students. However, parents of children who applied to five or more schools indicated that the process was slightly more complex for their children.

Complexity in College Admission: Fact or Urban Myth
4
•Most students completed all their application materials online, with very few completing forms on paper.
•When asked about specific aspects of the college application process, most students found them to be fairly clear to understand, most notably knowing how to find and complete application forms, knowing application deadlines, knowing if they took the right high school classes for admission, knowing what materials were required to apply and if they submitted all required materials.
•Knowing how admission decisions were made was the most confusing aspect of the college application process for respondents, followed by being able to find information they needed on college websites and knowing who to contact at the college if they had questions. However, it should be noted that all of these were still fairly clear to respondents.
•A majority of respondents reported that writing essays and getting letters of recommendation were required as part of their college application process. More students from the eastern region, compared to those elsewhere in the country, indicated that they wrote essays and obtained letters of recommendation as part of their application process. Regardless of location, most said these tasks were fairly simple for them.
•A sizeable number of students also applied for admission to specific colleges within a university. Interviews with admission staff and submitting samples of high school course work were less common. When asked how complicated these additional tasks were, most rated them as relatively simple.
V. Application Process: By School Type and Size
•Overall, applying to college appears to be a clear and simple process for most students, regardless of their income level, geographic location or first-
generation status. There were, however, differences based on the type of school to which students applied (e.g., public or private, small or large).
VI. Sources of Help During the College Application Process
•Students relied most heavily on their parents and high school counselors for help with the college application process. However, students of first-generation status and lower-income students were less likely to receive help from their parents compared to students who had at least one parent who attended college. First-generation and lower-income students were also more likely to receive a lot of help from other resources, such as high school counselors and teachers (39 percent versus 25 percent), and friends, (27 percent versus 17 percent) during the process.
•About half of parents believed that they provided a lot of help to their child during the college application process. However, about 2 in 10 believed that they provided only a little help to their child.
•When parents had questions about the college application process, they most frequently visited the college’s website; about half spoke with their child’s school counselors or talked to college admission staff. Of those who utilized these resources, most found them helpful. Lower-income parents were more likely to talk to their child’s high school teachers compared to those who earn more. Higher-income parents were more likely than other parents to visit a college’s website and to talk to college admission staff.
VII. Overall Perceptions of the College Application Process
•Overall, it was moderately stressful for students to apply to college. The more colleges students applied to, the more stressful the experience was for them. Parents appear to have slightly underestimated how stressful the college application process was for their children.

Research Findings of Parent and Student Perceptions of Complexity
in College Admission
5
•The primary stressor for students regarding the college application process was different applications having different requirements. Other students said that being worried about deadlines and trying to balance applying to college with typical high school life are stressful to them.
•A sizeable majority of students and parents were confident that they or their child applied to the right colleges, with those in the midwestern/southern region expressing the highest level of confidence.
•When specifically asked how the college application process could be simplified, respondents most frequently said that the process was already easy and self-explanatory. Some students mentioned it would be helpful for colleges to provide better instructions or step-by-step guides, and to make their websites more informative and user-friendly.
VIII. Parents’ Experiences with the College Application Process
• In general, the college application process was fairly simple for parents. However, lower-income parents reported slightly greater confusion about the process.
•College-educated parents were split on their perceptions regarding whether the college application process has become simpler or more complicated since they themselves applied. However, parents who had children enrolled in private schools were more likely to believe that the process had become more complicated.
•While relatively simple, the college application process was moderately stressful for parents. The more colleges their child applied to, the more stressful parents perceived the process to be. Parents in the midwestern/southern region experienced the least amount of stress. The most frequently mentioned stressors for parents were financial in nature (e.g., application fees, FAFSA).
IX. Demographic Summary
•At the time of this survey, most respondents reported that they or their child had already been admitted to a college or university. Even though a sizeable majority of first-generation and lower-income students reported that they had already been admitted to a college, they were less likely to have been admitted compared to their counterparts who had wealthier parents and who were not first-generation students.
•Most students and parents were using the Internet daily or at least a couple of times a week, although lower-income parents and those parents with first-generation students accessed it less frequently.
•Roughly half of respondents reported that they or their child was a first-generation student. About one-quarter reported a parental household income of less than $40,000.
•Nearly all respondents reported taking the SAT®; considerably fewer had taken the ACT.

Complexity in College Admission: Fact or Urban Myth
6
Research Method
Populations • Highschoolseniorswhohaveappliedtoandareplanningonenrollinginafour-year college in the fall.
• Parentsofhighschoolseniorswhohaveappliedtoandareplanningonenrolling in a four-year college in the fall and who helped their child at least a little with the application process.
• Populationssplitintoeastern,westernandmidwestern/southernregions.
Number of Completed Surveys • 600 student surveys (200/region)
• 300 parent surveys (100/region)
Response Rates •Students overall: 82 percent
•Parents overall: 81 percent
Data Collection Dates March 10 through April 27, 2010
Data Collection Methodology • Telephonedatacollection.
• RespondentsweremailedaletterfromtheCollegeBoardtoinformthemabout the purpose of the study.
•Quotassettoensurerepresentationfromlower-income/first-generationrespondents.
Questionnaire Design • Anderson-NiebuhrdevelopedthequestionnairesinconsultationwiththeCollege Board representatives.
• Separatesurveysdesignedforstudentandparentrespondents.
• Pretestsurveysconductedwithbothparentsandstudents.
Data Analysis • Descriptivestatisticswerecompiledforclosed-endedquestions.
•Open-endedquestionswerecodedandgroupedforreporting.
• Comparisonswereconductedtoanalyzedifferencesinresponsesbasedonthe following:
•Whetherrespondentisaparentorstudent• First-generationstudentstatus• Numberofschoolstowhichstudentapplied• Geographicregion•Whetherthestudentattendedapublicorprivatehighschool• Student’sGPA• Parentalincome
• Comparisonswerealsoconductedtoanalyzedifferencesbasedonthetypes of colleges to which students applied:
• Publicorprivateinstitution• Small(fewerthan4,000undergraduates),medium(4,000to9,999
undergraduates) or large (10,000 undergraduates or more)
Note: Comparisons were conducted excluding “don’t know” responses.

Research Findings of Parent and Student Perceptions of Complexity
in College Admission
7
Summary of Findings
This section of the report presents selected findings based on student and parent responses. Results are displayed in figures, followed by bulleted points describing the main findings.
Selected statistically significant differences are reported in tables in this section under the heading Other Findings.
The full data set can be accessed on the College Board Advocacy & Policy Center website.
One of the primary goals of the research was to determine at what stage of the application process students and parents believe complexity or difficulty begins to manifest itself. In addition, the research was interested in determining if there were actions or activities that either diminished or elevated feelings of anxiety. An early stage of the process was to gather information about college choice and the application process. This section of the report suggests that when offered, programs designed specifically to provide such information are regarded as extremely valuable and helpful. Schools that offered even basic information sessions were given high praise by respondents.
Overall, 70 percent of students said that their high school offered a class or seminar to teach students how to find information about colleges and universities and how to apply for admission.
I. Getting Information About Colleges
Complexity in College Admission: Fact or Urban Myth
8
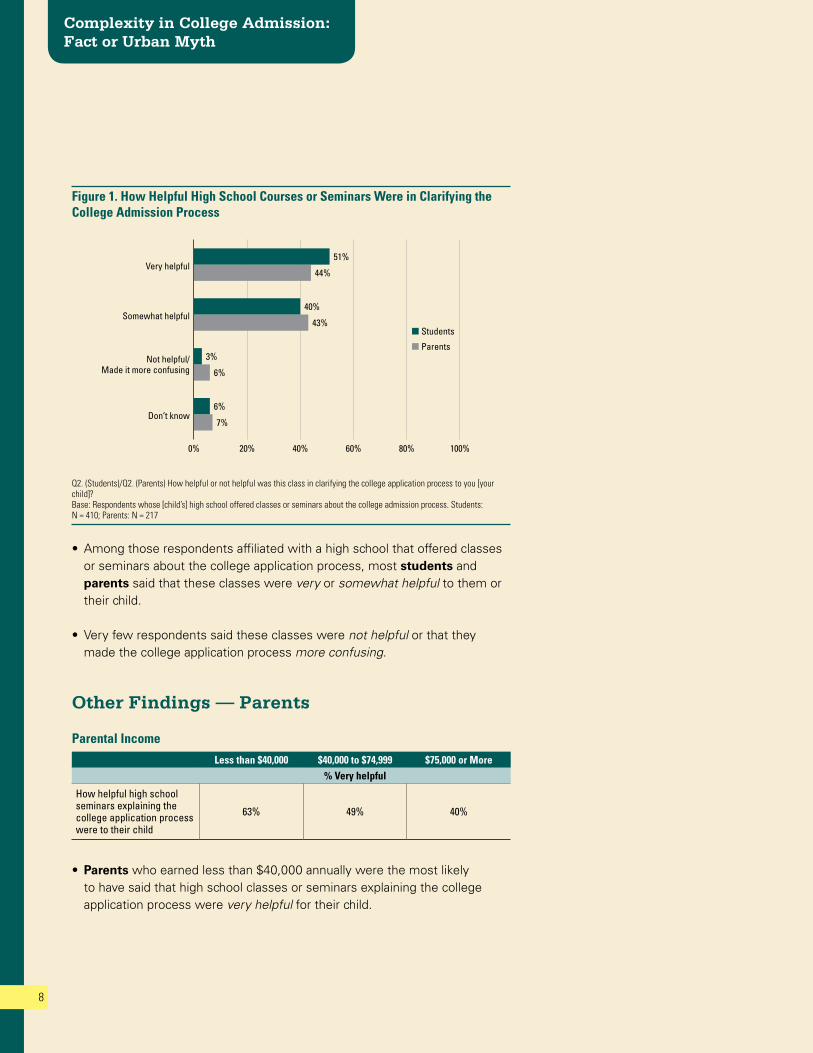
• Amongthoserespondentsaffiliatedwithahighschoolthatofferedclassesor seminars about the college application process, most students and parents said that these classes were very or somewhat helpful to them or their child.
• Veryfewrespondentssaidtheseclasseswerenot helpful or that they made the college application process more confusing.
Other Findings — Parents
Parental Income
Less than $40,000 $40,000 to $74,999 $75,000 or More% Very helpful
How helpful high school seminars explaining the college application process were to their child
63% 49% 40%
•Parents who earned less than $40,000 annually were the most likely to have said that high school classes or seminars explaining the college application process were very helpful for their child.
Figure 1. How Helpful High School Courses or Seminars Were in Clarifying the College Admission Process
0% 20% 40% 60% 80% 100%
Parents
Students
Don’t know
Not helpful/Made it more confusing
Somewhat helpful
Very helpful
6%
3%
40%
51%
7%
6%
43%
44%
Q2. (Students)/Q2. (Parents) How helpful or not helpful was this class in clarifying the college application process to you [your child]? Base: Respondents whose [child’s] high school offered classes or seminars about the college admission process. Students: N = 410; Parents: N = 217

Research Findings of Parent and Student Perceptions of Complexity
in College Admission
9
• Three-quartersofparents said that their child’s high school offers presentations or seminars for parents about the college application process.
• Nearlytwo-thirdsofparents whose child’s high school offered such seminars attended; and, of those who did, more than 9 in 10 found the experience very or somewhat helpful.
Other Findings — Parents
Parental Income
Less than $40,000 $40,000 to $74,999 $75,000 or More% Very helpful
Helpfulness of presentation about the college application process for parents
75% 67% 37%
•Parents whose children had a GPA of less than 3.25 and those who earned less than $75,000 were more likely to have found these presentations to be very helpful in clarifying the college application process.
Figure 2. Whether High Schools Offer Presentations or Seminars for Parents About the College Application Process
Q3. (Parents) Does your child’s high school offer any informational presentations or seminars for parents about how to find information about colleges and universities, and how to apply to colleges for admission? Base: Parents: N = 300
Don’tknow
6%
No18%
Yes76%
Percent of respondents attending
Percent of Respondents
(N = 228)*
% attended 64%
How helpful the seminar was to them…
Percent of Respondents (N = 145)**
Very helpful 55%
Somewhat helpful 38%
Not helpful/Made it more confusing 6%
Don’t know 1%
Q4. (Parents) Did you attend such a presentation or seminar? *Base: Parents whose child’s high school offered an informational presentation for parents about the college application process. Q5. (Parents) How helpful or not helpful was this seminar or presentation in clarifying the college application process to you? **Base: Parents who attended an informational seminar about the college application process.
Percentage of Parents Attending Such a Seminar and How Helpful It Was to Them

Complexity in College Admission: Fact or Urban Myth
10
II. Application Process: General
The actual process of choosing which schools to apply to — how many and where — was a core focus area of the research. Was complexity found in the early stages of college selection or decision making about where to apply, or did it manifest itself later on in the actual process of filling out and submitting applications and other records (standardized test scores, etc.)? The research was also interested in determining who (student, parents, others) played a role in helping to decide how to navigate this portion of the process and in determining if there were differences among the respondents based on that variable. The findings here suggest that students feel a high degree of ownership of the process but that parents express a higher level of interest and ownership of the process than students afford them. Irrespective of the level of involvement of parents, both groups did not think the process of determining where to apply, or how many schools to apply to, was very complex.
The research also explored the physical process of submitting applications and other required information. The findings suggest that there is almost universal use of some form of a “common application” or electronic version of such application instrument that diminishes potential complexity. Colleges and universities also received high marks for developing clear, concise and easy-to-access information on their websites regarding the process. There was some variation in these findings based on type of secondary school attended by the student.
Figure 3. How Families Make Decisions Regarding to Which Colleges or Universities Students Should Apply
Q3. (Students)/Q6. (Parents) Please tell me which of the following statements most accurately describes how the decision was made about which colleges and universities you [your child] would apply to. Base: Students: N = 600; Parents: N = 300
0% 20% 40% 60% 80% 100%
Parents
Students
The decision was made by the family, and the student
was not involved very much
The decision was the student’s to make based
on options given by the family
Decision was made jointly between the student and their family
The decision was the student’s entirely
0%
4%
39%
57%
0%
11%
50%
39%

Research Findings of Parent and Student Perceptions of Complexity
in College Admission
11
•Whenaskedhowdecisionsweremadeinthefamilyaboutwhichcollegesor universities students should apply to, more than half of students said the decision was entirely their own; about 4 in 10 said the decision was made jointly by themselves and their parents.
• Conversely,halfofparents said that the decision about where their child should apply was a joint decision; fewer said the decision was their child’s entirely.
• Relativelyfewparents and students said that the decision about where to apply to college was made by the student, with options given by the parents; not a single respondent said the decision was made exclusively by the parents.
Other Findings — Students
First-Generation Status
1st-Generation Student Not a 1st-Generation Student% choice was student’s entirely
How the decision of where to apply to college was made 61% 51%
% choice was made jointly by the student and the family
How the decision of where to apply to college was made 36% 43%
• Students who are of first-generation status are more likely to have said that the decision of where to attend college was entirely their own. In contrast, more respondents who were not first-generation students said the decision was made jointly by themselves and their family.
Other Findings — Parents
Parental Income
Less than $40,000 $40,000 to $74,999 $75,000 or More% Choice was student’s entirely
How the decision of where to apply to college was made
46% 44% 32%
• Parents who earned less than $75,000 annually were more likely to have said the decision of where to attend college was their child’s entirely.
Complexity in College Admission: Fact or Urban Myth
12
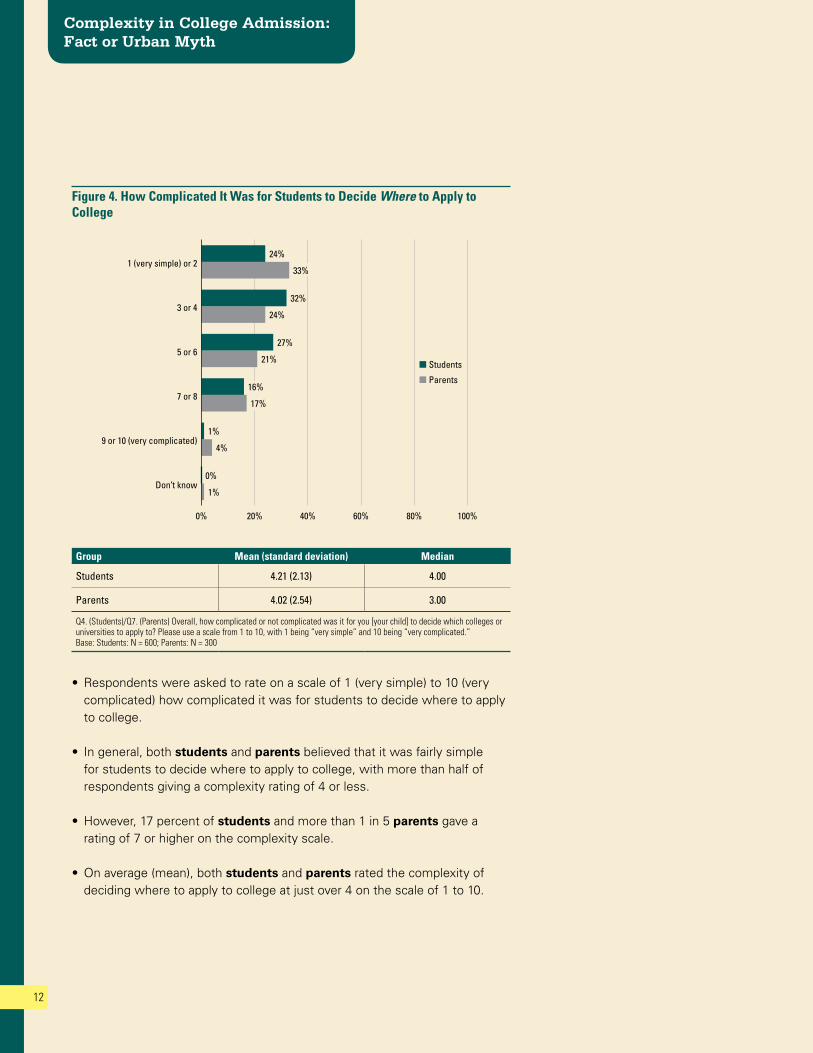
Figure 4. How Complicated It Was for Students to Decide Where to Apply to College
Group Mean (standard deviation) Median
Students 4.21 (2.13) 4.00
Parents 4.02 (2.54) 3.00
Q4. (Students)/Q7. (Parents) Overall, how complicated or not complicated was it for you [your child] to decide which colleges or universities to apply to? Please use a scale from 1 to 10, with 1 being “very simple” and 10 being “very complicated.” Base: Students: N = 600; Parents: N = 300
• Respondentswereaskedtorateonascaleof1(verysimple)to10(verycomplicated) how complicated it was for students to decide where to apply to college.
• Ingeneral,bothstudents and parents believed that it was fairly simple for students to decide where to apply to college, with more than half of respondents giving a complexity rating of 4 or less.
• However,17percentofstudents and more than 1 in 5 parents gave a rating of 7 or higher on the complexity scale.
•Onaverage(mean),bothstudents and parents rated the complexity of deciding where to apply to college at just over 4 on the scale of 1 to 10.
0% 20% 40% 60% 80% 100%
Parents
Students
Don’t know
9 or 10 (very complicated)
7 or 8
5 or 6
3 or 4
1 (very simple) or 2
1%
4%
17%
21%
24%
33%
0%
1%
16%
27%
32%
24%

Research Findings of Parent and Student Perceptions of Complexity
in College Admission
13
Other Findings — Students
Geographic Region
Eastern Western Midwestern/SouthernMean (standard deviation)
How complicated it was to decide where to apply to college
3.98 (2.07) 4.52 (2.04) 4.12 (2.24)
• Thedecisionofwheretoapplytocollegewasconsideredmorecomplicatedamong students living in the western region compared to those in the eastern region.

Complexity in College Admission: Fact or Urban Myth
14
Figure 5. Whether Students Completed a Universal or Common Application Form
Q5. (Students): When applying to colleges and universities, did you ever complete a universal or common application form, which is a single application form that you could submit to multiple colleges or universities? Base: Students: N = 600
• Justoverhalfofstudents said that they completed a universal or common application form when applying to colleges or universities.
•Ofthosewhodid,asizeablenumberofstudentsindicatedthathavingacommon form made the application process more simple, with a mean rating of 2.76 on a scale of 1 (much more simple) to 10 (much more complex).
Whether a Universal or Common Application Form Made the Application Process More Simple or More Complex
GroupMean (standard
deviation) Median
Students 2.76 (1.88) 2.00
Q6. (Students): Did having a universal application form make the application process more simple or more complex? Please use a scale from 1 to 10, with 1 being much more simple and 10 being much more complex. Base: Students who completed a common application form: N = 330
0% 20% 40% 60% 80% 100%
Don’t know
9 or 10 (much more complex)
7 or 8
5 or 6
3 or 4
1 (much more simple) or 2Don’t know
No 42%
Yes 55%
53%
27%
15%
1%
1%
3%
3%

Research Findings of Parent and Student Perceptions of Complexity
in College Admission
15
Other Findings — Students
Number of Colleges to Which Students Applied
1–2 Schools 3–4 Schools 5+ Schools% Yes
Completed a common application form 42% 51% 72%
Student’s GPA
3.24 or Lower 3.25–3.74 3.75 or Higher% Yes
Completed a common application form 45% 60% 62%
• Themorecollegestowhichstudents applied, the more likely it was that they completed a common application form; those with a GPA of 3.25 or greater were also more likely to have completed such a form during the application process.

Complexity in College Admission: Fact or Urban Myth
16
Figure 6. How Confusing It Was for Students to Know How to Send SAT® or ACT Scores to Colleges or Universities
Group Mean (standard deviation) Median
Students 2.69 (1.94) 2.00
Parents 2.80 (2.25) 2.00
Q7a. (Students)/Q8a. (Parents) Overall, how confusing or not confusing was it for you [your child] to do the following? Please use a scale from 1 to 10 with 1 being “very clear” and 10 being “very confusing”: Knowing how to send test scores, such as SAT or ACT scores, to colleges? Base: Students: N = 600; Parents: N = 300
•Overall,amajorityofstudents and parents believed that the process of knowing how to send SAT and ACT scores to schools was clear. More than half in each group gave a rating of 1 or 2 on a 1 (very clear) to 10 (very confusing) scale, with mean ratings of 2.69 and 2.80, respectively.
0% 20% 40% 60% 80% 100%
Parents
Students
Don’t know
9 or 10 (very confusing)
7 or 8
5 or 6
3 or 4
1 (very clear) or 256%
56%
3%
3%
6%
12%
20%
1%
1%
5%
13%
24%

Research Findings of Parent and Student Perceptions of Complexity
in College Admission
17
Figure 7. How Confusing It Was for Students to Know How to Send High School Transcripts to Colleges or Universities
Group Mean (standard deviation) Median
Students 2.47 (1.89) 2.00
Parents 2.61 (2.26) 2.00
Q7b. (Students)/Q8b. (Parents) Overall, how confusing or not confusing was it for you [your child] to do the following? Please use a scale from 1 to 10, with 1 being “very clear” and 10 being “very confusing”: Sending high school transcripts to colleges? Base: Students: N = 600; Parents: N = 300
• Inaddition,moststudents and parents reported that knowing how to send high school transcripts to colleges or universities was clear, with about 6 in 10 of both students and parents giving a rating of 1 or 2 on a scale of 1 (very clear) to 10 (very confusing) (Figure 7). Mean ratings were 2.47 and 2.61, respectively.
0% 20% 40% 60% 80% 100%
Parents
Students
4%
3%
6%
9%
16%
62%
4%
1%
3%
11%
21%
60%
Don’t know
9 or 10 (very confusing)
7 or 8
5 or 6
3 or 4
1 (very clear) or 2

Complexity in College Admission: Fact or Urban Myth
18
Other Findings — Students
Geographic Regions
Eastern Western Midwestern/SouthernMean (standard deviation)
How confusing it was to send high school transcripts to colleges
2.24 (1.80) 2.91 (2.05) 2.29 (1.76)
•Students in the western region reported the most confusion regarding how to send their high school transcripts to colleges.
Other Findings — Parents
Type of High School Child Attends
Child Attends Public High School Child Attends Private High SchoolMean (standard deviation)
How confusing it was for their child to send high school transcripts to colleges
2.71 (2.35) 1.82 (1.29)
•Parents whose children attended public school reported that their children were more confused about how to send their high school transcripts to colleges compared to parents whose children attended private school.

Research Findings of Parent and Student Perceptions of Complexity
in College Admission
19
III. Application Process: Schools to Which Students Applied
The purpose of this research was to discover whether or not there were different levels of confusion or complexity based on student preferences for school type (public or private), whether or not geography played any role (in-state or out-of-state selections) and if size of institution mattered. These findings were stratified by parental income, with some interesting outcomes.
Figure 8. Number of Colleges or Universities to Which Students Applied
Group Mean (standard deviation) Median
Students 4.15 (2.56) 4.00
Parents 3.95 (2.32) 4.00
Q8. (Students)/Q9. (Parents) How many four-year colleges or universities have you [has your child] applied to? Base: Students: N = 600; Parents: N = 300
• Asshownabove,thenumberofcollegesoruniversitiestowhichstudentsapplied is quite varied. Approximately one-third of students and parents reported that they or their child applied to five schools or more. However, a similar percentage reported applying to only one or two schools.
• Theaveragenumberofschoolstowhichrespondentsappliedwasapproximately four.
0% 20% 40% 60% 80% 100%
Parents
Students
17%17%
15%
14%
14%16%
19%15%
12%11%
21%23%
2%4%
10 or more
6 to 9
5
4
3
2
1
Complexity in College Admission: Fact or Urban Myth
20
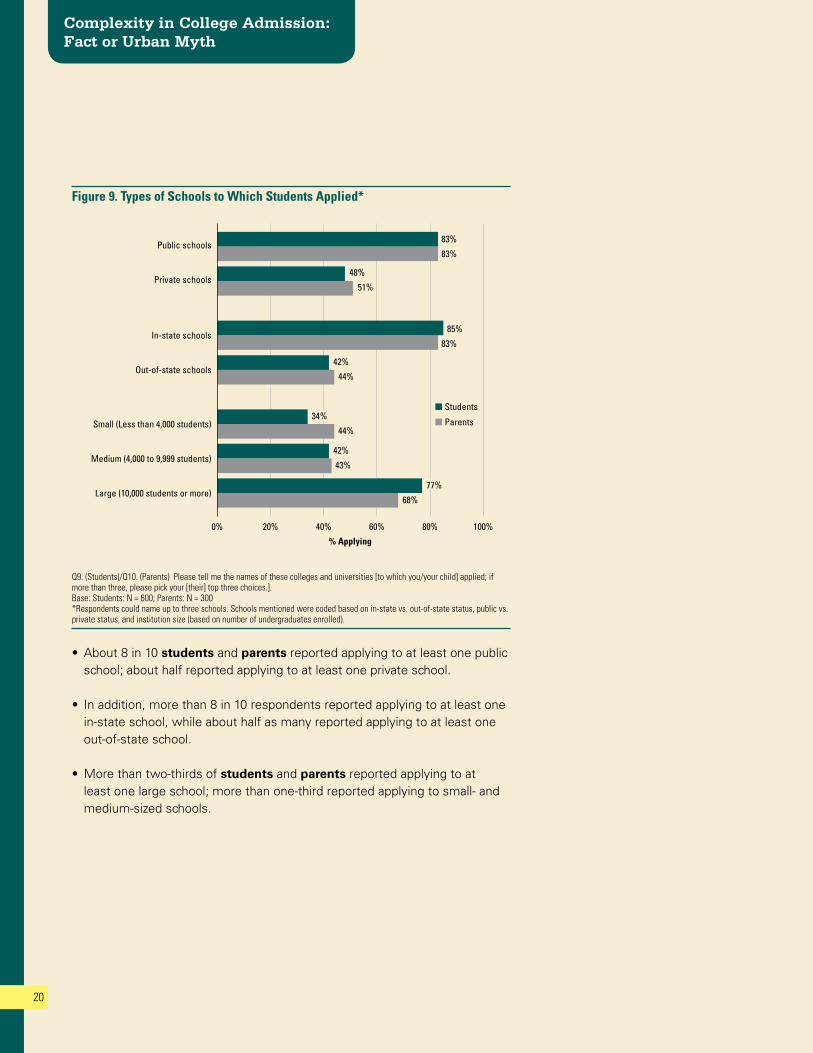
Figure 9. Types of Schools to Which Students Applied*
Q9. (Students)/Q10. (Parents) Please tell me the names of these colleges and universities [to which you/your child] applied; if more than three, please pick your [their] top three choices.]. Base: Students: N = 600; Parents: N = 300 *Respondents could name up to three schools. Schools mentioned were coded based on in-state vs. out-of-state status, public vs. private status, and institution size (based on number of undergraduates enrolled).
• About8in10students and parents reported applying to at least one public school; about half reported applying to at least one private school.
• Inaddition,morethan8in10respondentsreportedapplyingtoatleastonein-state school, while about half as many reported applying to at least one out-of-state school.
•Morethantwo-thirdsofstudents and parents reported applying to at least one large school; more than one-third reported applying to small- and medium-sized schools.
0% 20% 40% 60%
% Applying
80% 100%
Parents
Students
83%
83%
51%
48%
83%
85%
44%
42%
44%
34%
43%
42%
68%
77%Large (10,000 students or more)
Medium (4,000 to 9,999 students)
Small (Less than 4,000 students)
Out-of-state schools
In-state schools
Private schools
Public schools

Research Findings of Parent and Student Perceptions of Complexity
in College Admission
21
Other Findings — Students
First-Generation Status
1st-Generation Student Not a 1st-Generation Student% Applied to School Type
In-state college 92% 77%
Out-of-state college 30% 56%
Public college 87% 79%
Private college 41% 57%
• First-generation students were more likely to apply to in-state colleges and public schools; more students who were not of first-generation status applied to out-of-state and private colleges.
Type of High School Attended
Attend Public High School Attend Private High School% Applied to School Type
In-state college 88% 71%
Out-of-state college 39% 66%
Public college 86% 68%
Private college 46% 66%
•Students attending private high schools were more likely than those attending public high schools to have applied to out-of-state schools and private colleges; public school students were more likely to have applied to in-state and public colleges.
Parental Income
Less than $40,000 $40,000 to $74,999 $75,000 or More% Applied to School Type
In-state college 92% 88% 78%
Out-of-state college 29% 37% 56%
Private college 39% 52% 52%
• Thegreater their parents’ income, the more likely it was that students applied to out-of-state and private colleges.

Complexity in College Admission: Fact or Urban Myth
22
Other Findings — Parents
First-Generation Status
1st-Generation Student Not a 1st-Generation Student% Applied to School Type
Out-of-state college 38% 50%
Medium-sized college 52% 36%
Large-sized college 63% 74%
•Moreparents of students who are not of first-generation status reported that their child applied to out-of-state and large-sized schools.
Geographic Region
Eastern Western Midwestern/Southern% Applied to School Type
Private college 58% 40% 59%
Small-sized college 53% 34% 49%
Medium-sized college 53% 32% 46%
Large-sized college 58% 79% 71%
•Parents living in the eastern and midwestern/southern regions were more likely to have said their child applied to private colleges and to schools of small and medium size.
• Inaddition,parents in the western and midwestern/southern regions were more likely than those in the eastern region to have reported that their child applied to large-sized schools.

Research Findings of Parent and Student Perceptions of Complexity
in College Admission
23
Type of High School Child Attends
Attend Public High School Attend Private High School% Applied to School Type
Out-of-state college 42% 63%
Public college 86% 71%
Private college 48% 74%
•Parents of children who attended private high schools were more likely to have said their child applied to out-of-state and private schools.
Parental Income
Less than $40,000 $40,000 to $74,999 $75,000 or More% Applied to School Type
Out-of-state college 37% 36% 52%
•Parents who earned at least $75,000 annually were the most likely to have said that their child applied to out-of-state schools.

Complexity in College Admission: Fact or Urban Myth
24
IV. Application Process: Features of the Application Process
The actual component parts of the typical application process (essays, recommendations, interviews, etc.) are examined in this section. The purpose of this research was to determine if any one or a combination of factors appeared to create more difficulty or confusion, and for whom. This section also examines the broader array of tasks that are usually benchmarks for determining if an applicant has a clear understanding of the process (knowing how admission decisions are made, knowing what materials are required for applying, knowing deadlines, etc.) and how it will unfold through its many stages.
Figure 10. Overall Complexity of Applying to Colleges*
Group Mean (standard deviation) Median
Students 2.61 (1.49) 2.33
Parents 2.37 (1.58) 2.00
Q10. (Students)/Q11. (Parents) Overall, how complicated or not complicated was it for you [your child] to apply to this college? Please use a scale from 1 to 10, with 1 being “very simple” and 10 being “very complicated.” Base: Students: N = 600; Parents: N = 294. *Ratings are averaged across all colleges/universities named and rated by respondents. Respondents could rate up to three colleges. “Don’t know” responses were excluded from analyses.
0% 20% 40% 60% 80% 100%
Parents
Students
71%
62%
20%
28%
6%
8%
3%
2%
0%
0%9.00 to 10.00 (very complicated)
7.00 to 8.99
5.00 to 6.99
3.00 to 4.99
1.00 (very simple) to 2.99

Research Findings of Parent and Student Perceptions of Complexity
in College Admission
25
• Inaseriesofquestions,respondentswereaskedtonameuptothreecollegesor universities to which they (or their child) applied. In addition, respondents were asked to rate how complicated or confusing various aspects of the college application process were for each school named. Because respondents could provide ratings for more than one school, a mean value was calculated for each item, averaging ratings across all schools mentioned.
•Overall,applyingtocollegeappearstobeafairlysimpleprocess,withstudents and parents giving mean complexity ratings of 2.61 and 2.37, respectively, on a scale of 1 (very simple) to 10 (very complex).
Other Findings — Students vs. Parents
•Students perceived that it was more difficult to apply to college overall compared to parents.

Complexity in College Admission: Fact or Urban Myth
26
Figure 11. Use of Online Versus Paper Application Materials*
*Based on responses to Q11. (Students) How did you complete the application form for this school? Base: Students: N = 594
•Morethan8in10students reported that they completed all application forms online (Figure 11).
• About1in10completedapplicationformsorpartsofformsbothonlineandon paper; few completed forms entirely on paper.
0% 20% 40% 60% 80% 100%
Completed some forms onlineand some on paper
Completed all forms on paper
Completed all forms online
12%
5%
83%
Research Findings of Parent and Student Perceptions of Complexity
in College Admission
27
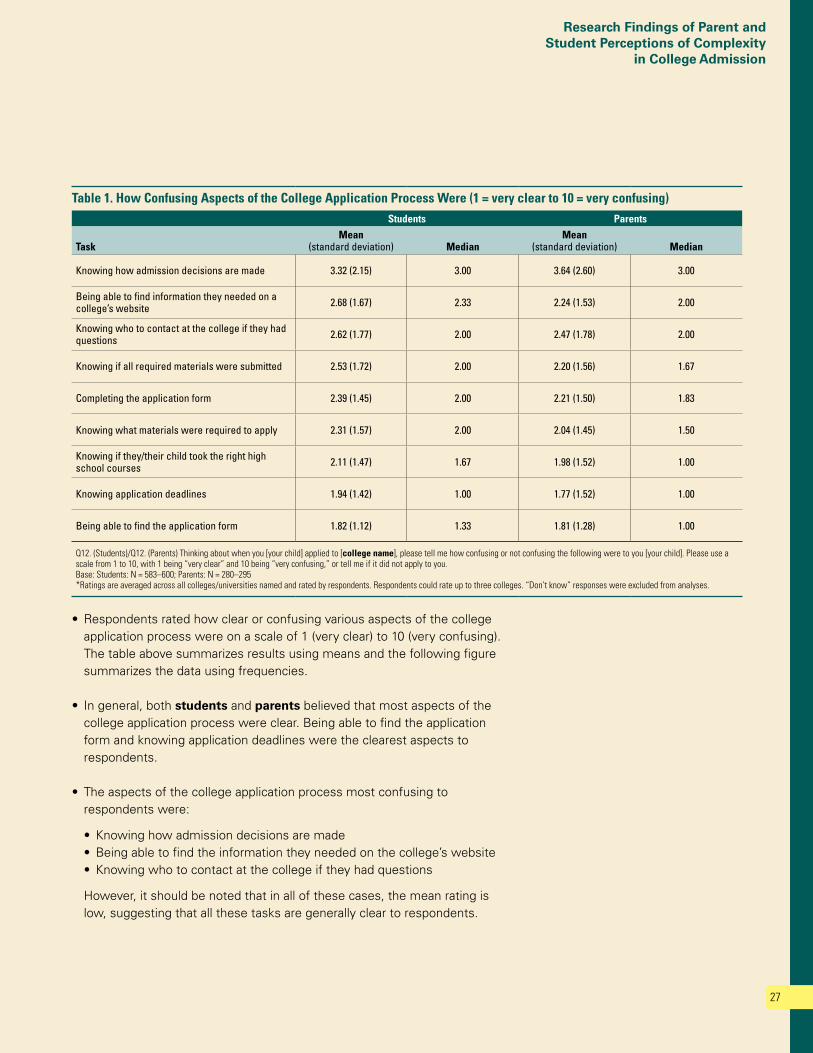
• Respondentsratedhowclearorconfusingvariousaspectsofthecollegeapplication process were on a scale of 1 (very clear) to 10 (very confusing). The table above summarizes results using means and the following figure summarizes the data using frequencies.
• Ingeneral,bothstudents and parents believed that most aspects of the college application process were clear. Being able to find the application form and knowing application deadlines were the clearest aspects to respondents.
• Theaspectsofthecollegeapplicationprocessmostconfusingtorespondents were:
• Knowinghowadmissiondecisionsaremade• Beingabletofindtheinformationtheyneededonthecollege’swebsite• Knowingwhotocontactatthecollegeiftheyhadquestions
However, it should be noted that in all of these cases, the mean rating is low, suggesting that all these tasks are generally clear to respondents.
Table 1. How Confusing Aspects of the College Application Process Were (1 = very clear to 10 = very confusing)Students Parents
Task Mean
(standard deviation) Median Mean
(standard deviation) Median
Knowing how admission decisions are made 3.32 (2.15) 3.00 3.64 (2.60) 3.00
Being able to find information they needed on a college’s website 2.68 (1.67) 2.33 2.24 (1.53) 2.00
Knowing who to contact at the college if they had questions 2.62 (1.77) 2.00 2.47 (1.78) 2.00
Knowing if all required materials were submitted 2.53 (1.72) 2.00 2.20 (1.56) 1.67
Completing the application form 2.39 (1.45) 2.00 2.21 (1.50) 1.83
Knowing what materials were required to apply 2.31 (1.57) 2.00 2.04 (1.45) 1.50
Knowing if they/their child took the right high school courses 2.11 (1.47) 1.67 1.98 (1.52) 1.00
Knowing application deadlines 1.94 (1.42) 1.00 1.77 (1.52) 1.00
Being able to find the application form 1.82 (1.12) 1.33 1.81 (1.28) 1.00
Q12. (Students)/Q12. (Parents) Thinking about when you [your child] applied to [college name], please tell me how confusing or not confusing the following were to you [your child]. Please use a scale from 1 to 10, with 1 being “very clear” and 10 being “very confusing,” or tell me if it did not apply to you. Base: Students: N = 583–600; Parents: N = 280–295 *Ratings are averaged across all colleges/universities named and rated by respondents. Respondents could rate up to three colleges. “Don’t know” responses were excluded from analyses.

Complexity in College Admission: Fact or Urban Myth
28
Figure 12. How Confusing Aspects of the College Application Process Were*
Q12. (Students)/Q12. (Parents) Thinking about when you [your child] applied to [college name] please tell me how confusing or not confusing the following were to you [your child]. Please use a scale from 1 to 10, with 1 being “very clear” and 10 being “very confusing,” or tell me if it did not apply to you. Base: Students: N = 583–600; Parents: N = 280–295 *Ratings are averaged across all colleges/universities named and rated by respondents. Respondents could rate up to three colleges. “Don’t know” responses were excluded from analyses.
• Again,mostaspectsofthecollegeapplicationprocesswereverycleartorespondents, with a majority having a rating between 1 and 2.99 on a scale of 1 (very clear) to 10 (very confusing).
• Theoneexceptiontotheaboveisknowinghowadmissiondecisionsaremade, where fewer than half of students and parents had an average rating between 1 and 2.99. Eight percent of students and 15 percent of parents had a rating of 7 to 10.
0% 20% 40% 60% 80% 100%
9.00 to 10.00 (very confusing)7.00 to 8.995.00 to 6.993.00 to 4.991.00 (very clear) to 2.99
Knowing how admissiondecisions are made
Being able to �ndinformation they needed
on a college’s website
Knowing who to contactat the college if they
had questions
Knowing if all requiredmaterials were submitted
Completing theapplication form
Knowing whatmaterials were
required to apply
Knowing if they/theirchild took the right
high school courses
Knowing applicationdeadlines
Being able to �ndthe application form
Parents
Students
Parents
Students
Parents
Students
Students
Parents
Parents
Students
Parents
Students
Parents
Students
Parents
Students
Parents
Students
46%
47%
71%
60%
69%
63%
64%
73%
73%
66%
79%
69%
79%
74%
85%
79%
84%
83%
25%
30%
21%
28%
17%
24%
24%
18%
18%
26%
14%
22%
12%
18%
9%
15%
11%
15%
14%
15%
6%
11%
10%
10%
10%
8%
8%
7%
5%
8%
8%
7%
4%
5%
4%
2%
3%
1%
1%
9%
5%
2%
1%
4%
3%
2%
1%
1%
1%
1%
1%
1%
1%
1%
1%
1%
6%

Research Findings of Parent and Student Perceptions of Complexity
in College Admission
29
Figure 13. Percentage of Students Completing Various Tasks as Part of the College Application Process*
*Based on responses to Q13. (Students)/Q13. (Parents) Next, I’m going to ask you if you [your child] completed certain tasks as part of applying to [college name]. We only want to know if you [your child] did this as part of applying for admission to [college name], not if you [your child] did these tasks as part of applying for scholarships or financial aid. Base: Students: N = 600; Parents: N = 300
• Respondentswerethenaskedifspecifictaskswererequiredaspartofthecollege application process (Figure 13). About 7 in 10 students and parents reported that writing an essay was part of the college application process.
• Inaddition,roughlytwo-thirdsineachgroupsaidthatlettersofrecommendation were required, and more than one-third said that applying to a specific college within a university was required as part of the application process.
0% 20% 40% 60%% Yes
80% 100%
Parents
Students
70%
72%
72%
65%
37%
44%
32%
23%
20%
19%Submitted samples of high school course work
Interviewed by admission staff
Applied for admission to aspeci�c college within a university
Got letters of recommendation
Wrote an essay

Complexity in College Admission: Fact or Urban Myth
30
Other Findings — Students
Students’ GPA
3.24 or Lower 3.25–3.74 3.75 or Higher% Did task as part of the college application process
Wrote an essay 51% 57% 68%
Got letters of recommendation 49% 54% 62%
Applied for admission to a specific college within the university 25% 36% 44%
•Students who were the most likely to have written essays as a part of the college application process were those who:
• Appliedtothemostschools• Livedintheeasternregion• Attendedaprivatehighschool• HadaGPAof3.75orhigher
• Inaddition,students who were the most likely to have asked for letters of recommendation as part of the application process were those who:
•Werenot of first-generation status• Appliedtothemostschools• Livedintheeasternregion• Attendedaprivatehighschool• HadahighGPA
• Thosestudents who were not of first-generation status and those with higher GPAs were the most likely to have applied for admission to a specific college within a university.

Research Findings of Parent and Student Perceptions of Complexity
in College Admission
31
Other Findings — Parents
Parental Income
Less than $40,000 $40,000 to $74,999 $75,000 or More% Child did task as part of the college application process
Submitted samples of high school course work 25% 27% 7%
• Theparents who were the most likely to have said their child wrote an essay as part of the college application process were those whose child:
•Wasnot of first-generation status• Hadappliedtoatleastthreeschools• Livedintheeasternorwesternregions• HadahigherGPA
• Theparents who were the most likely to have children who asked for letters of recommendation were those whose child:
• Appliedtoatleastthreeschools• Livedintheeasternregion
• Thoseparents who reported having an income of less than $75,000 and those whose children were of first-generation status were the most likely to have said their child submitted high school course work as part of the college application process.

Complexity in College Admission: Fact or Urban Myth
32
Table 2. How Complicated Additional Tasks Associated with the College Application Process Were* (1 = very simple to 10 = very complicated)
Students Parents
Task Mean
(standard deviation) Median Mean
(standard deviation) Median
Write an essay 3.50 (2.05) 3.00 3.14 (2.12) 3.00
Apply for admission to a specific college within the school 2.64 (1.85) 2.00 2.33 (1.86) 1.67
Submit samples of high school course work 2.49 (1.62) 2.00 2.26 (1.72) 2.00
Have an interview with admission staff 2.45 (1.78) 2.00 1.92 (1.56) 1.00
Get letters of recommendation 2.25 (1.55) 2.00 2.27 (1.74) 1.67
Q13b. (Students)/Q13b. (Parents) Overall, how complicated or not complicated was it for you [your child] to do this? Please use a scale from 1 to 10, with 1 being “very simple” and 10 being “very complicated.” Base: Respondents who completed (or whose child completed) each task. Students: N = 111–424; Parents: N = 61–215 *Ratings were averaged across all colleges/universities named and rated by respondents. Respondents could rate up to three colleges. “Don’t know” responses were excluded from analyses.
• Respondentswhocompleted(orwhosechildcompleted)varioustasksas part of the college application process were asked to rate how simple or complicated these tasks were on a scale of 1 (very simple) to 10 (very complicated). The table above summarizes results using means, and the following figure summarizes the data using frequencies.
•Writinganessayreceivedthehighestcomplexityratingamongstudents and parents, with mean ratings of 3.50 and 3.14, respectively. However, given this rating is relatively low, writing an essay still appears to be a relatively simple process.
• Allothertaskssurveyedreceivedmeancomplexityratingsoflessthan3.00, suggesting that they were simple to do.

Research Findings of Parent and Student Perceptions of Complexity
in College Admission
33
Figure 14. How Complicated Additional Tasks Associated with the College Application Process Were*
Q13b. (Students)/Q13b. (Parents) Overall, how complicated or not complicated was it for you [your child] to do this? Please use a scale from 1 to 10, with 1 being “very simple” and 10 being “very complicated.” Base: Respondents who completed (or whose child completed) each task. N’s vary (see chart). *Ratings were averaged across all colleges/universities named and rated by respondents. Respondents could rate up to three colleges. “Don’t know” responses were excluded from analyses.
•Withtheexceptionofwritinganessay,amajorityoftherespondentsratedthe various tasks they completed during the college application process as being simple, with a rating between 1.00 and 2.99 on the scale of 1 (very simple) to 10 (very complicated).
• Althoughwritinganessaywasthemostcomplicatedtaskstudentscompleted, more than 7 in 10 had a complexity rating between 1.00 and 4.99 for this task; and fewer than 1 in 10 had a rating of 7 or higher.
0% 20% 40% 60% 80% 100%
9.00 to 10.00 (very complicated)7.00 to 8.995.00 to 6.993.00 to 4.991.00 (very simple) to 2.99
Write an essay
Apply for admissionto a speci�c college
within the school
Submit samplesof high school
course work
Have aninterview with
admission staff
Get letters ofrecommendation
Parents (N=205)
Students (N=429)
Parents (N=110)
Students (N=261)
Parents (N=61)
Students (N=111)
Students (N=138)
Parents (N=215)
Parents (N=94)
Students (N=388)
50%
41%
72%
59%
67%
61%
62%
72%
82%
70%
27%
30%
14%
25%
24%
31%
26%
18%
10%
22%
16%
21%
10%
12%
5%
5%
7%
6%
5%
7%
1%
1%
2%
2%
2%3%
6%
7%
2%
4%
2%
3%
4%
3%
1%

Complexity in College Admission: Fact or Urban Myth
34
Other Findings — Students
Type of High School Attended
Attend Public High School Attend Private High SchoolMean (standard deviation)
Apply for admission to a specific college within the university 2.55 (1.80) 3.52 (2.01)
•Students who attended private high schools were more likely than those in public schools to have found the process of applying for admission to a specific college within a university to be more complicated.
Other Findings — Parents
First-Generation Status
1st-Generation Student Not a 1st-Generation StudentMean (standard deviation)
Submit samples of high school course work 2.67 (2.01) 1.67 (0.96)
•Parents whose child was a first-generation student said it was more confusing for their child to submit samples of high school course work to colleges compared to those whose child was not of first-generation status.
Type of High School Child Attends
Child Attends Public High School Child Attends Private High SchoolMean (standard deviation)
Get letters of recommendation 2.32 (1.77) 1.61 (0.79)
•Parents whose child attended public high school indicated it was more difficult for their child to get letters of recommendation compared to those whose child attended private high school.
Parental Income
Less than $40,000 $40,000 to $74,999 $75,000 or MoreMean (standard deviation)
Apply for admission to a specific college within the university
2.34 (1.64) 3.16 (2.42) 2.01 (1.60)
•Parents who earned between $40,000 and $75,000 reported that it was more difficult for their child to apply for admission to a specific college within a university compared to those who earned $75,000 or more.

Research Findings of Parent and Student Perceptions of Complexity
in College Admission
35
Once choices are made about where to apply, are there differences in the complexity of the process by type and size of school selected? This section looks at the same tasks as did the previous section on general complexity, stratified by size and type of institution.
• Forstudents, there were no statistically significant differences regarding how complicated it was overall for them to apply to college based on school type or size. Applying to college appears to be fairly simple for both public and private schools, and schools of various sizes.
• Forparents, there were no statistically significant differences in their perception regarding how difficult it was for their child to apply to college based on school type.
Other Findings — College Size
•Parents did believe it was slightly simpler for their child to apply to a small school compared to a medium-sized school.
V. Application Process: By School Type and Size
Table 3. How Complicated It Was Overall to Apply, by School Type and Size* (1 = very simple to 10 = very complicated)Students Parents
School Type** Mean
(standard deviation) Median Mean
(standard deviation) Median
Public 2.55 (1.54) 2.22 2.26 (1.51) 2.00
Private 2.51 (1.54) 2.00 2.31 (1.76) 2.00
School SizeMean
(standard deviation) Median Mean
(standard deviation) Median
Small (<4,000 undergraduates) 2.45 (1.70) 2.00 2.02 (1.62) 1.00
Medium (4,000 to 9,999 undergraduates) 2.67 (1.66) 2.25 2.52 (1.88) 2.00
Large (10,000 or more undergraduates) 2.55 (1.29) 2.35 2.32 (1.35) 2.00
Q10. (Students)/Q11. (Parents) Overall, how complicated or not complicated was it for you [your child] to apply to this college? Please use a scale from 1 to 10, with 1 being “very simple” and 10 being “very complicated.” *If a college was mentioned by more than one respondent, the average rating for that college among all students or parents was used in analyses. **For-profit schools were excluded from this analysis.

Complexity in College Admission: Fact or Urban Myth
36
• Thistablesummarizeshowclearorconfusingvariousaspectsofthecollegeapplication process were for students based on if they were applying to a public or private school.
• Thedatasuggeststhatmostaspectsofthecollegeapplicationprocesswere equally clear, regardless of if students were applying to a public or private institution.
Other Findings — Public vs. Private Colleges
• Itwasslightlymoreconfusingforstudents when applying to a private school to know if they took the right high school courses required for admission and to know application deadlines, compared to when applying to a public school.
Table 4A. How Confusing Aspects of the College Application Process Were, by School Type Among Students* (1 = very clear to 10 = very confusing)
Public Private
Task Mean
(standard deviation) Median Mean
(standard deviation) Median
Knowing how admission decisions are made 3.19 (1.86) 3.00 3.44 (2.06) 3.00
Knowing who to contact at the college if they had questions 2.52 (1.60) 2.00 2.50 (1.66) 2.00
Knowing if all required materials were submitted 2.52 (1.50) 2.23 2.60 (1.79) 2.00
Being able to find information they needed on a college’s website 2.50 (1.39) 2.33 2.68 (1.65) 2.40
Completing the application form 2.24 (1.19) 2.00 2.29 (1.33) 2.00
Knowing what materials were required to apply 2.24 (1.38) 2.00 2.37 (1.49) 2.00
Knowing if they took the right high school courses 2.02 (1.34) 1.75 2.27 (1.55) 2.00
Knowing application deadlines 1.91 (1.15) 1.52 2.15 (1.71) 1.50
Being able to find the application form 1.78 (0.99) 1.50 1.89 (1.23) 1.50
Q12. (Students) Thinking about when you applied to [college name], please tell me how confusing or not confusing the following were to you. Please use a scale from 1 to 10, with 1 being “very clear” and 10 being “very confusing,” or tell me if it did not apply to you. *If a college was mentioned by more than one respondent, the average rating for that college among all students was used in analyses. For-profit schools are excluded from this analysis.

Research Findings of Parent and Student Perceptions of Complexity
in College Admission
37
• Thistablesummarizesparents’ perceptions regarding how clear or confusing various aspects of the college application process were for their children displayed by the type of college to which their child applied.
• Similartostudents’perceptions,mostparents believe the steps required to apply to college are fairly clear for both public and private institutions; there were no statistically significant differences in parents’ perceptions based on school type.
Table 4B. How Confusing Aspects of the College Application Process Were by School Type Among Parents* (1 = very clear to 10 = very confusing)
Public Private
Task Mean
(standard deviation) Median Mean
(standard deviation) Median
Knowing how admission decisions are made 3.57 (2.30) 3.00 3.58 (2.58) 3.00
Knowing who to contact at the college if they had questions 2.48 (1.61) 2.00 2.24 (1.81) 1.50
Knowing if all required materials were submitted 2.28 (1.55) 2.00 2.04 (1.64) 1.00
Being able to find information they needed on a college’s website 2.22 (1.43) 2.00 2.19 (1.56) 2.00
Completing the application form 2.12 (1.34) 2.00 2.14 (1.61) 1.50
Knowing what materials were required to apply 2.04 (1.47) 1.67 2.12 (1.67) 1.50
Knowing if their child took the right high school courses 1.91 (1.34) 1.50 2.07 (1.66) 1.00
Being able to find the application form 1.84 (1.28) 1.50 1.71 (1.26) 1.00
Knowing application deadlines 1.66 (1.12) 1.00 1.86 (1.64) 1.00
Q12. (Parents) Thinking about when your child applied to [college name], please tell me how confusing or not confusing the following were to your child. Please use a scale from 1 to 10 with 1 being “very clear” and 10 being “very confusing,” or tell me if it did not apply to you. *If a college was mentioned by more than one respondent, the average rating for that college among all parents was used in analyses. For-profit schools are excluded from this analysis.

Complexity in College Admission: Fact or Urban Myth
38
• Asshownabove,mostadditionaltasksrequiredaspartofthecollegeapplication process were simple for students, regardless of whether students were applying to a public or private institution.
Other Findings — Public vs. Private Colleges
•Students indicated that it was slightly more complicated to apply to a particular college within a university when applying to a public rather than a private school.
Table 5A. How Complicated Additional Tasks Associated with the College Application Process Were by School Type Among Students* (1 = very simple to 10 = very complicated)
Public Private
Task Mean
(standard deviation) Median Mean
(standard deviation) Median
Write an essay 3.37 (1.70) 3.00 3.21 (1.80) 3.00
Apply for admission to a specific college within the school 2.51 (1.45) 2.33 2.12 (1.25) 2.00
Submit samples of high school course work 2.48 (1.35) 2.00 2.44 (1.65) 2.00
Have an interview with admission staff 2.43 (1.70) 2.00 2.41 (1.68) 2.00
Get letters of recommendation 2.07 (1.19) 2.00 2.31 (1.44) 2.00
Q13b. (Students) Overall, how complicated or not complicated was it for you to do this? Please use a scale from 1 to 10, with 1 being “very simple” and 10 being “very complicated.” *If a college was mentioned by more than one respondent, the average rating for that college among all students was used in analyses. For-profit schools were excluded from this analysis.

Research Findings of Parent and Student Perceptions of Complexity
in College Admission
39
• Thistablesummarizesparents’ perceptions regarding how difficult various tasks were for their children when applying to college. No statistically significant differences were found between public and private schools.
Table 5B. How Complicated Additional Tasks Associated with the College Application Process Were by School Type Among Parents* (1 = very simple to 10 = very complicated)
Public Private
Task Mean
(standard deviation) Median Mean
(standard deviation) Median
Write an essay 3.09 (2.00) 2.71 3.12 (2.18) 2.50
Submit samples of high school course work 2.58 (1.87) 2.00 2.25 (1.98) 1.00
Apply for admission to a specific college within the school 2.24 (1.55) 2.00 1.99 (1.52) 1.00
Have an interview with admission staff 2.22 (1.95) 1.00 1.89 (1.48) 1.00
Get letters of recommendation 2.20 (1.56) 2.00 2.47 (2.02) 2.00
Q13b. (Parents) Overall, how complicated or not complicated was it for your child to do this? Please use a scale from 1 to 10, with 1 being “very simple” and 10 being “very complicated.” *If a college was mentioned by more than one respondent, the average rating for that college among all parents was used in analyses. For-profit schools are excluded from this analysis.

Complexity in College Admission: Fact or Urban Myth
40
• Thistablesummarizeshowclearorconfusingvariousaspectsofthecollegeapplication process were for students based on the size of the colleges and universities to which they applied.
• Noneofthedifferenceswerestatisticallysignificant,suggestingthatcollege application procedures are equally clear to students regardless of institution size.
Table 6A. How Confusing Aspects of the College Application Process Were by School Size Among Students* (1 = very clear to 10 = very confusing)
Small(<4,000 undergraduates)
Medium (4,000–9,999 undergraduates)
Large (10,000 or more undergraduates)
Task Mean
(standard deviation) Median Mean
(standard deviation) Median Mean
(standard deviation) Median
Knowing how admission decisions are made 3.47 (2.30) 3.00 3.16 (1.83) 3.00 3.21 (1.60) 3.00
Knowing if all required materials were submitted 2.63 (2.07) 2.00 2.43 (1.46) 2.00 2.59 (1.23) 2.50
Being able to find information they needed on a college’s website 2.57 (1.74) 2.00 2.54 (1.51) 2.33 2.62 (1.25) 2.63
Knowing who to contact at the college if they had questions 2.39 (1.90) 2.00 2.63 (1.57) 2.33 2.50 (1.32) 2.32
Knowing what materials were required to apply 2.28 (1.70) 2.00 2.38 (1.49) 2.00 2.23 (1.08) 2.00
Knowing if they took the right high school courses 2.19 (1.72) 1.10 2.15 (1.38) 2.00 2.06 (1.20) 1.88
Completing the application form 2.14 (1.38) 2.00 2.37 (1.42) 2.00 2.33 (1.05) 2.19
Knowing application deadlines 2.14 (1.76) 1.00 1.93 (1.31) 1.50 1.95 (1.03) 1.71
Being able to find the application form 1.89 (1.38) 1.00 1.81 (1.07) 1.50 1.82 (0.95) 1.65
Q12. (Students) Thinking about when you applied to [college name], please tell me how confusing or not confusing the following were to you. Please use a scale from 1 to 10, with 1 being “very clear” and 10 being “very confusing,” or tell me if it did not apply to you. *If a college was mentioned by more than one respondent, the average rating for that college among all students was used in analyses.

Research Findings of Parent and Student Perceptions of Complexity
in College Admission
41
• Thistablesummarizes parents’ perceptions regarding how clear or confusing various aspects of the college application process were for their children. In general, regardless of institution size, parents perceived it to be a fairly simple process for their children.
Other Findings — Public vs. Private Colleges
•Parents believed it was slightly more difficult for their children to know who to contact at a college if they had questions when applying to a large school compared to a small school.
Table 6B. How Confusing Aspects of the College Application Process Were by School Size Among Parents* (1 = very clear to 10 = very confusing)
Small(<4,000 undergraduates)
Medium (4,000–9,999 undergraduates)
Large (10,000 or more undergraduates)
Task Mean
(standard deviation) Median Mean
(standard deviation) Median Mean
(standard deviation) Median
Knowing how admission decisions are made 3.30 (2.54) 3.00 3.50 (2.40) 3.00 3.91 (2.31) 3.78
Being able to find information they needed on a college’s website 2.13 (1.59) 1.50 2.15 (1.47) 2.00 2.29 (1.37) 2.00
Knowing who to contact at the college if they had questions 2.11 (1.80) 1.00 2.25 (1.63) 2.00 2.68 (1.59) 2.33
Knowing if their child took the right high school courses 2.07 (1.71) 1.00 1.89 (1.43) 1.00 1.96 (1.28) 1.50
Knowing if all required materials were submitted 2.03 (1.70) 1.00 2.14 (1.63) 1.56 2.29 (1.41) 2.00
Knowing what materials were required to apply 2.03 (1.70) 1.00 2.20 (1.74) 2.00 1.99 (1.20) 1.67
Completing the application form 1.95 (1.53) 1.00 2.31 (1.64) 2.00 2.18 (1.23) 2.00
Knowing application deadlines 1.88 (1.71) 1.00 1.59 (1.12) 1.00 1.73 (1.13) 1.33
Being able to find the application form 1.68 (1.31) 1.00 1.80 (1.48) 1.00 1.88 (1.01) 1.67
Q12. (Parents) Thinking about when your child applied to [college name] please tell me how confusing or not confusing the following were to your child. Please use a scale from 1 to 10 with 1 being “very clear” and 10 being “very confusing,” or tell me if it did not apply to you. *If a college was mentioned by more than one respondent, the average rating for that college among all parents was used in analyses.
Complexity in College Admission: Fact or Urban Myth
42
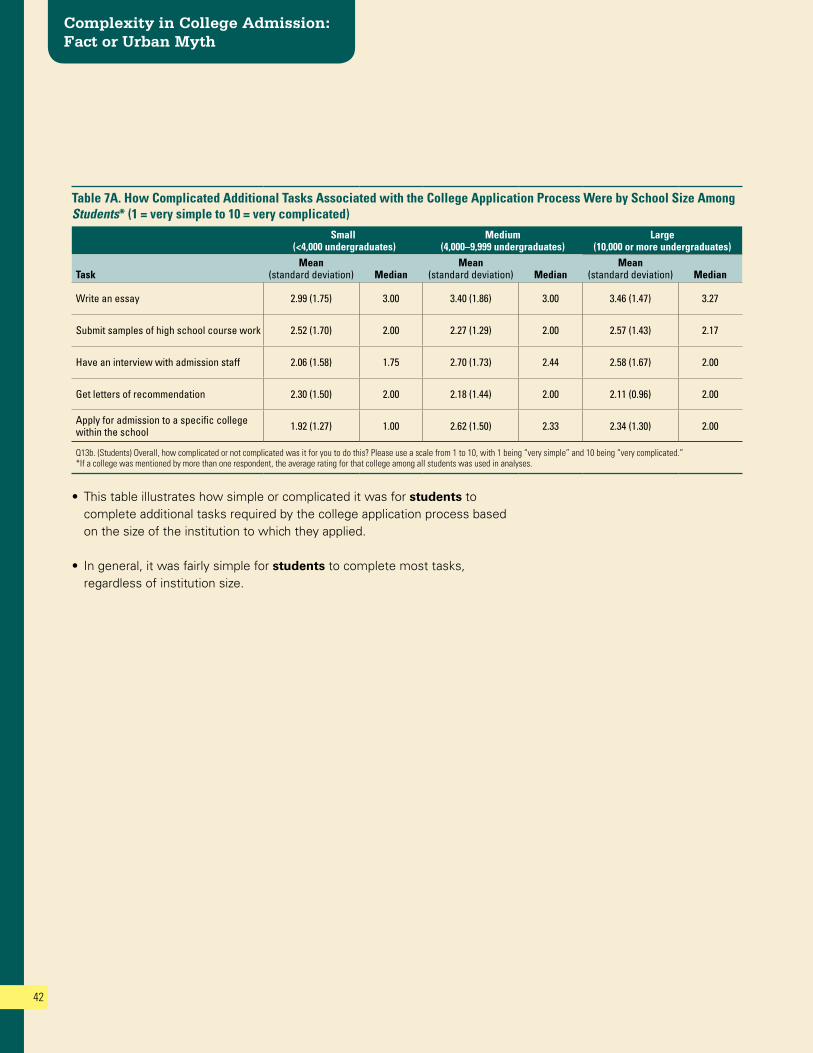
• Thistableillustrateshowsimpleorcomplicateditwasforstudents to complete additional tasks required by the college application process based on the size of the institution to which they applied.
• Ingeneral,itwasfairlysimpleforstudents to complete most tasks, regardless of institution size.
Table 7A. How Complicated Additional Tasks Associated with the College Application Process Were by School Size Among Students* (1 = very simple to 10 = very complicated)
Small (<4,000 undergraduates)
Medium (4,000–9,999 undergraduates)
Large (10,000 or more undergraduates)
Task Mean
(standard deviation) Median Mean
(standard deviation) Median Mean
(standard deviation) Median
Write an essay 2.99 (1.75) 3.00 3.40 (1.86) 3.00 3.46 (1.47) 3.27
Submit samples of high school course work 2.52 (1.70) 2.00 2.27 (1.29) 2.00 2.57 (1.43) 2.17
Have an interview with admission staff 2.06 (1.58) 1.75 2.70 (1.73) 2.44 2.58 (1.67) 2.00
Get letters of recommendation 2.30 (1.50) 2.00 2.18 (1.44) 2.00 2.11 (0.96) 2.00
Apply for admission to a specific college within the school 1.92 (1.27) 1.00 2.62 (1.50) 2.33 2.34 (1.30) 2.00
Q13b. (Students) Overall, how complicated or not complicated was it for you to do this? Please use a scale from 1 to 10, with 1 being “very simple” and 10 being “very complicated.” *If a college was mentioned by more than one respondent, the average rating for that college among all students was used in analyses.

Research Findings of Parent and Student Perceptions of Complexity
in College Admission
43
• Thistablesummarizesparents’ perceptions about how simple or complicated it was for their children to complete various additional tasks associated with the college application process based on school size. No significant differences emerged, suggesting that parents perceived these tasks to be equally simple for their children to do, regardless of the size of school to which they were applying.
Table 7B. How Complicated Additional Tasks Associated with the College Application Process Were by School Size Among Parents* (1 = very simple to 10 = very complicated)
Small (<4,000 undergraduates)
Medium (4,000–9,999 undergraduates)
Large (10,000 or more undergraduates)
Task Mean
(standard deviation) Median Mean
(standard deviation) Median Mean
(standard deviation) Median
Write an essay 2.75 (2.04) 2.00 3.17 (2.14) 3.00 3.43 (2.06) 3.00
Submit samples of high school course work 2.07 (1.84) 1.00 2.31 (1.72) 1.50 2.68 (1.99) 2.00
Apply for admission to a specific college within the school 2.06 (1.65) 1.00 2.02 (1.56) 1.50 2.18 (1.43) 2.00
Have an interview with admission staff 1.68 (1.20) 1.00 2.23 (2.00) 1.00 2.39 (1.97) 2.00
Get letters of recommendation 2.46 (2.08) 1.50 2.35 (1.92) 1.50 2.15 (1.30) 2.00
Q13b. (Parents) Overall, how complicated or not complicated was it for your child to do this? Please use a scale from 1 to 10, with 1 being “very simple” and 10 being “very complicated.” *If a college was mentioned by more than one respondent, the average rating for that college among all parents was used in analyses.

Complexity in College Admission: Fact or Urban Myth
44
VI. Sources of Help During the College Application Process
Counseling students regarding college choices and process was a significant area of interest in the research. In this context, “counseling” refers to all manner of help provided by many different parties, not just secondary school counselors. This section also focuses more on the role of parents in the process and the degree to which they sought advice and counsel and from whom. The results were stratified accordingly, as well as by income and first- or second-generation status.
Figure 15. How Helpful Various People Were to Students During the College Application Process
Q14. (Students)/Q14. (Parents) Now thinking about all the colleges to which you [your child] applied, how much did these people help with completing the application and making sure all the required materials were submitted? Base: Students: N = 600; Parents: N = 300
•Morethanhalfofstudents said their parents gave them a lot of help during the college application process, with an additional one-third saying their parents gave them a little help.
• Inaddition,aboutone-thirdormoreofstudents said their high school counselors and teachers provided a lot of help during the application process.
•Morethanone-quarterofparents said their children’s high school counselors and teachers, as well as other family members, offered a lot of help when their children were applying to college.
0% 20% 40% 60% 80% 100%
Don’t know/Not applicableNo help at allA littleA lot
Other family members
Older siblings
Friends
College admission staff
High school teachers
High school counselors
Parents
Parents
Students
Students
Students
Students
Parents
Parents
Students
Parents
Students
Students
27%
12%
14%
22%
23%
28%
32%
42%
32%
45%
53%
34%
28%
17%
43%
41%
40%
40%
42%
43%
42%
35%
38%
60%
33%
35%
30%
31%
28%
13%
19%
13%
12%
1%
36%
6%
1%
3%
6%

Research Findings of Parent and Student Perceptions of Complexity
in College Admission
45
Other Findings — Parents vs. Students
• Significantlymoreparents than students said that other family members provided a lot of help to students during the college application process.
•Students were more likely than parents to have said that other family members and their high school teachers provided no help at all during the college application process.
Other Findings — Students
First-Generation Status
1st-Generation Student Not a 1st-Generation Student% Helped a lot
Parents 46% 62%
High school teachers 39% 25%
Friends 27% 17%
•Students who were not of first-generation status were more likely than those who were first-generation students to have said their parents provided a lot of help during the college application process.
• Conversely,students who were of first-generation status were more likely to have said that high school teachers and their friends helped them a lot.
Number of Colleges to Which Their Child Applied
1–2 Schools 3–4 Schools 5+ Schools% Helped a lot
College admission staff 36% 27% 23%
•Students who applied to only one or two schools were more likely to have said that college admission staff helped a lot during the college application process.

Complexity in College Admission: Fact or Urban Myth
46
Other Findings — Students (Cont’d)
Parental Income
Less than $40,000 $40,000 to $74,999 $75,000 or More% Helped a lot
Parents 47% 52% 58%
High school counselors 51% 46% 40%
High school teachers 42% 32% 22%
Friends 31% 18% 17%
Older siblings 30% 20% 16%
• Thegreatertheirparents’incomewas,themorelikelyitwasthatstudents said their parents helped them a lot during the college application process.
• Conversely,thelowertheirparents’incomewas,themorelikelyitwasthatstudents said their high school counselors and teachers, friends and older siblings provided a lot of help to students.
Other Findings — Parents
First-Generation Status
1st-Generation Student Not a 1st-Generation Student% Helped a lot
High school counselors 50% 37%
High school teachers 42% 28%
College admission staff 34% 17%
•Moreparents of first-generation students said that high school counselors and teachers, and college admission staff, helped their child a lot during the college application process.
Parental Income
Less than $40,000 $40,000 to $74,999 $75,000 or More% Helped a lot
High school counselors 57% 54% 27%
High school teachers 40% 51% 21%
College admission staff 29% 37% 16%
•Parents who earned less than $75,000 annually were the most likely to have said their child received a lot of help from their high school counselors and teachers, and college admission staff, during the application process.

Research Findings of Parent and Student Perceptions of Complexity
in College Admission
47
Figure 16. Helpfulness of College Admission Staff
Q15. (Students) How helpful or not helpful were college admission staff to you when completing your applications? Base: Respondents who said that they received a lot or a little help from college admission staff to make sure they had all the required materials submitted. Students: N = 410
• Amongstudents who received at least a little help from college admission staff during the application process, more than 4 in 10 said they were very helpful. Few students said their assistance was not helpful to them.
Not helpful
Somewhathelpful
54%
Veryhelpful
44%
2%

Complexity in College Admission: Fact or Urban Myth
48
Figure 17. Parents’ Perceptions Regarding How Much Help They Provided Their Children During the College Application Process*
QS4. (Parents) How much help or guidance have you provided your child with the college selection and application process? Base: Parents: N = 300 *Asked as a screening question; respondents who said “none at all” were screened out of the survey. Data displayed in the graphic reflect only the responses of those parents who screened in and completed the survey.
• Amongparents surveyed, nearly half said that they helped their child a lot while they were applying to college, and an additional one-third said they provided some help.
• About2in10parents believed that they offered a little help during the process.
• Itshouldbenotedthatinorderforparents to be surveyed at all, it was required that they reported providing at least a little help to their child during the college application process.
A little18%
Some 34%
A lot48%

Research Findings of Parent and Student Perceptions of Complexity
in College Admission
49
Figure 18. Resources Used by Parents if They Had Questions about the College Application Process
Q15. (Parents) If you had questions about the college application process, what resources did you use to get information? Base: Parents: N = 300
•Parents were asked which resources they had used if they personally had questions about the college application process.
•Morethan8in10respondentssaidtheyvisitedthecollege’swebsite.Ofthose who did so, most said the information provided on the website was very or somewhat helpful to them.
• Inaddition,abouthalfofparents said that they spoke with either their child’s school counselors or college admission staff if they had questions. Of those respondents who had such contact, more than 7 in 10 said that these people were very helpful when answering their questions.
0% 20% 40% 60% 80% 100%Veryhelpful
Somewhathelpful
Nothelpful
Don’tknow
0% 20% 40% 60%
% Yes
80% 100%
85%
51%
50%
34%
32%
38%
Talk to friends/coworkers
(N=113)
Talk to theirchild’s high school
teachers (N=94)
Talk to other family members
(N=103)
Visit thecollege’s website
(N=253)
Talk to theirchild’s school
counselors (N=152)
Talk to college admission staff
(N=149)
Talk to their child’s high
school teachers
Talk to other family members
Talk to friends/coworkers
Talk to college admission staff
Talk to their child’s school
counselors
Visit thecollege’swebsite
75%
71%
62%
55%
31%
57%
24%
28%
35%
44%
65%
41%
1%
1%
1%
1%
1%
2%
2%
3%
Perceived Helpfulness of Resources Used by Parents
Q15b. How helpful or not helpful was this in answering your questions? Base: Parents who used a given resource. N’s vary (see graphic).

Complexity in College Admission: Fact or Urban Myth
50
Other Findings — Parents
Parental Income
Less than $40,000 $40,000 to $74,999 $75,000 or More% Yes
Visited the college or university’s website 77% 79% 96%
Talked to college admission staff 43% 36% 61%
Talked to child’s high school teachers 39% 43% 23%
•Parents who earned $75,000 or more annually were the most likely to have visited a college’s website or talked to college admission staff if they had questions about the college application process. They were the least likely to have talked to their child’s high school teachers.
Parental Income (Cont’d)
Less than $40,000 $40,000 to $74,999 $75,000 or More% Very helpful
Talked to child’s high school counselors 78% 79% 58%
•Parents who earned less than $75,000 annually were more likely to have said that speaking with their child’s school counselors about the college application process was very helpful to them.

Research Findings of Parent and Student Perceptions of Complexity
in College Admission
51
VII. Overall Perceptions of the College Application Process
Notions of complexity are often associated with such emotions as stress and confidence. The research sought to separate the notions of process complexity — taking steps to complete a process — from the emotions that taking such steps may have engendered. The outcomes of the research suggest that while the process was not deemed to be terribly complex, it generated an emotional response — stress. Students were asked to define which parts of the admission process generated the highest levels of stress on their part. Both students and parents were asked the penultimate question: With hindsight, how confident are they that they made the right choices in the application process? They were also asked to give advice to colleges and universities about how to make the college application process less confusing.
Figure 19. How Stressful It Was for Students to Apply to College
Group Mean (standard deviation) Median
Students 5.53 (2.56) 5.00
Parents 4.90 (2.71) 5.00
Q16. (Students)/Q17. (Parents) Overall, how stressful or not stressful has the college application process been for you [your child]? Please use a scale from 1 to 10, with 1 being “not at all stressful” and 10 being “very stressful.” Base: Students: N = 600; Parents: N = 300
•Overall,thecollegeapplicationprocesswasmoderatelystressfulforstudents (Figure 19). On average, students rated the stressfulness of the college application process as a 5.53 on a scale of 1 (not at all stressful) to 10 (very stressful). In addition, more than 6 in 10 students gave a stressfulness rating of 5 or higher.
0% 20% 40% 60% 80% 100%
Parents
Students
1%
10%
19%
23%
26%
21%
0%
13%
24%
26%
24%
13%
Don’t know
9 or 10 (very stressful)
7 or 8
5 or 6
3 or 4
1 (not at all stressful) or 2

Complexity in College Admission: Fact or Urban Myth
52
• Afterstudentsratedhowstressfulthecollegeapplicationprocesswasforthem, they were asked to explain why they gave the rating they did.
• Amongstudents who gave a stressfulness rating of 1 (not at all stressful) to 5, more than 3 in 10 said they gave this rating because the process was self-explanatory and not complicated.
• About15percentofthesestudents said they gave the rating they did because waiting for the answer is the stressful part or because different applications having different requirements was stressful for them.
Table 8A. Why Students Thought the College Application Process Was Stressful or Not Stressful for ThemReason* Percent of RespondentsStressfulness rating of 1 (not at all stressful) to 5 N = 304
Was not complicated/All information needed in one place/Process was self-explanatory 32%
Waiting for the answer was the stressful part/Not knowing if they would be accepted 15%
Different applications have different requirements/Difficult to gather all the required items 14%
Worried about deadlines/Difficult to meet deadlines 12%
Had help with their application (teachers, school counselors, parents, college students) 12%
Very time consuming/Hard to balance with work, school and extracurricular activities 11%
Unsure about which college to attend/Wanted to pick the right college and major 6%
Already knew where they wanted to go to school/Applied to few colleges 6%
Technology issues/Website not updated/College did not get materials submitted electronically 5%
Q17. (Students) Why did you give this rating [regarding how stressful the college application process was for them]? Base: Students: N = 600 *Respondents could offer more than one response. Only responses mentioned by at least 5 percent of respondents are shown.
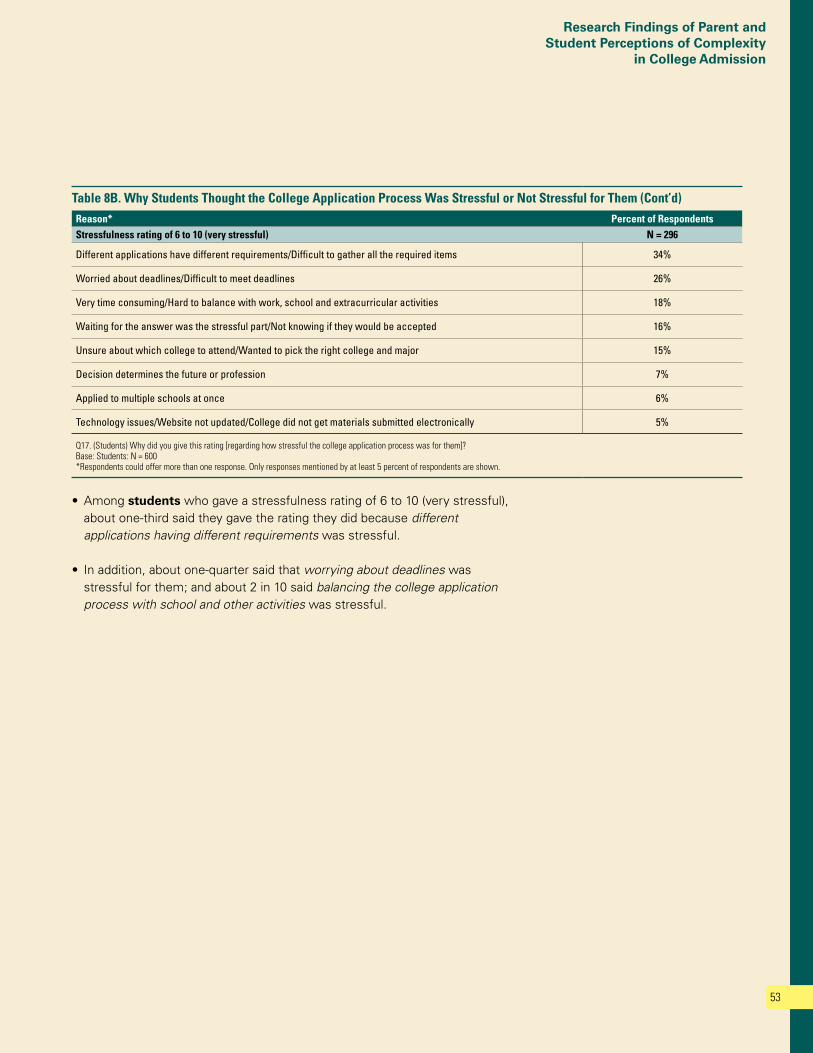
Research Findings of Parent and Student Perceptions of Complexity
in College Admission
53
• Amongstudents who gave a stressfulness rating of 6 to 10 (very stressful), about one-third said they gave the rating they did because different applications having different requirements was stressful.
• Inaddition,aboutone-quartersaidthatworrying about deadlines was stressful for them; and about 2 in 10 said balancing the college application process with school and other activities was stressful.
Table 8B. Why Students Thought the College Application Process Was Stressful or Not Stressful for Them (Cont’d)Reason* Percent of RespondentsStressfulness rating of 6 to 10 (very stressful) N = 296
Different applications have different requirements/Difficult to gather all the required items 34%
Worried about deadlines/Difficult to meet deadlines 26%
Very time consuming/Hard to balance with work, school and extracurricular activities 18%
Waiting for the answer was the stressful part/Not knowing if they would be accepted 16%
Unsure about which college to attend/Wanted to pick the right college and major 15%
Decision determines the future or profession 7%
Applied to multiple schools at once 6%
Technology issues/Website not updated/College did not get materials submitted electronically 5%
Q17. (Students) Why did you give this rating [regarding how stressful the college application process was for them]? Base: Students: N = 600 *Respondents could offer more than one response. Only responses mentioned by at least 5 percent of respondents are shown.

Complexity in College Admission: Fact or Urban Myth
54
Figure 20. How Confident Respondents Are that the Student Applied to the Right Colleges and Universities
Q18. (Students)/Q20. (Parents) Overall, how confident or not confident are you that you [your child] applied to the right colleges and universities? Base: Students: N = 600; Parents: N = 300
• Aboutthree-quartersofstudents and parents are very confident that they or their child applied to the right colleges and universities.
• Veryfewstudents or parents said that they are not confident that they or their child applied to the colleges or universities right for them.
0% 20% 40% 60% 80% 100%
Parents
Students
Don’t know
Not very con�dent/Not at all con�dent
Somewhat con�dent
Very con�dent
0%
2%
23%
75%
1%
2%
23%
74%

Research Findings of Parent and Student Perceptions of Complexity
in College Admission
55
Other Findings — Students
Geographic Region
Eastern Western Midwestern/Southern% Very confident
How confident respondents are that they applied to the right colleges for them
72% 71% 82%
•Students in the midwestern/southern region are the most likely to be very confident that they applied to the right schools for them.
Other Findings — Parents
Geographic Region
Eastern Western Midwestern/Southern% Very confident
How confident respondents are that their child applied to the right colleges for them
76% 62% 83%
•Parents in the eastern and midwestern/southern regions were more likely to be very confident that their children applied to the right schools.

Complexity in College Admission: Fact or Urban Myth
56
• Respondentswereaskedwhattheythoughtcollegesanduniversitiescoulddo to make the college application process less confusing for students.
• Amongbothstudents and parents, the most frequently mentioned response was the process is self-explanatory and does not need to be changed.
• About15percentofstudents said that better instructions or checklists and better and more user-friendly information on college websites would be helpful.
Table 9. Respondents’ Suggestions About Making the College Application Process Less Confusing for StudentsResponse* Students Parents
Better instructions/Step-by-step guides/Clear checklist 15% 9%
Improve college websites/Make websites more user-friendly/Better information on websites 14% 10%
Use a common application/Have everything in one place or on one website 10% 7%
Better communication between colleges and students, parents, high school staff/Better or more timely notification when items are missing 9% 11%
Support tools (telephone hotline, online chat, online forum) 6% 4%
Clearer deadlines/Longer deadlines 6% 2%
Make the application shorter/Less personal questions 5% 6%
More school representatives to help go over process/More college fairs/Workshops at colleges/Peer mentoring from college students 5% 5%
Teach application process in high school/Teach application process earlier/More help from school counselors 3% 5%
Nothing/Process is easy or self-explanatory 24% 31%
Q19. (Students)/Q21. (Parents) Taking everything into consideration, what do you think colleges and universities could do to make the college application process less confusing for students. Base: Students: N = 600; Parents: N = 300 *Respondents could offer more than one response. Only responses mentioned by at least 5 percent of respondents in either group are shown.
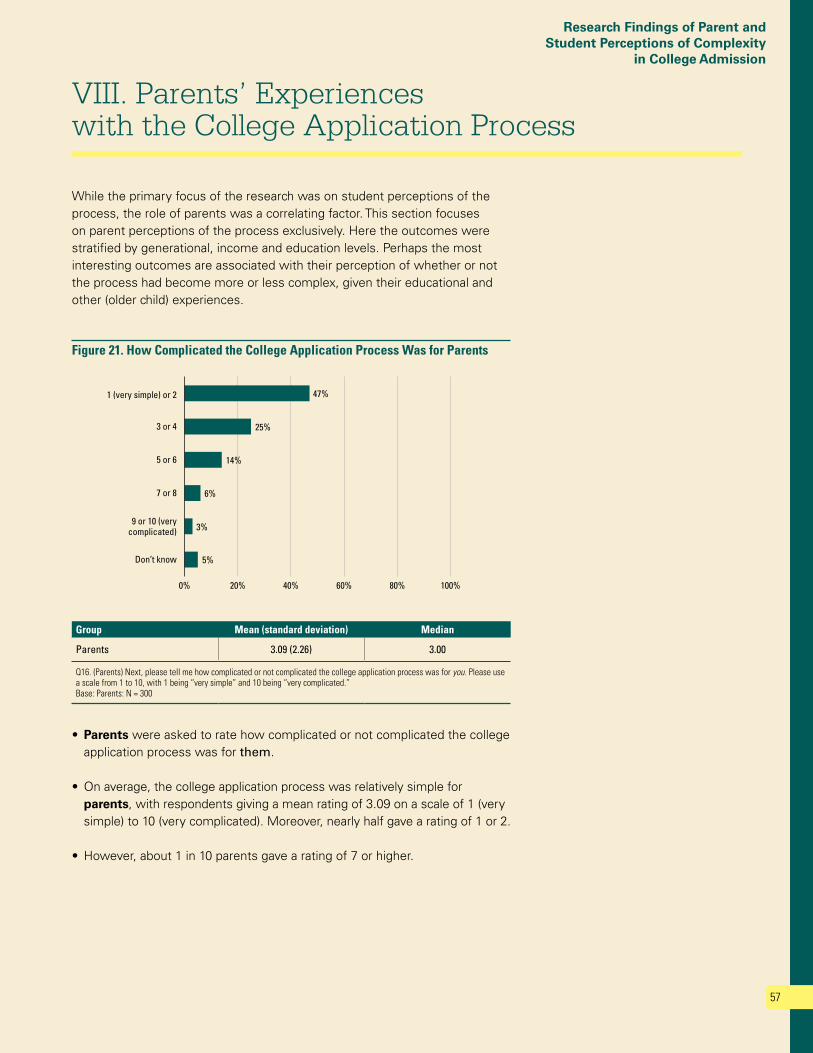
Research Findings of Parent and Student Perceptions of Complexity
in College Admission
57
VIII. Parents’ Experiences with the College Application Process
While the primary focus of the research was on student perceptions of the process, the role of parents was a correlating factor. This section focuses on parent perceptions of the process exclusively. Here the outcomes were stratified by generational, income and education levels. Perhaps the most interesting outcomes are associated with their perception of whether or not the process had become more or less complex, given their educational and other (older child) experiences.
Figure 21. How Complicated the College Application Process Was for Parents
Group Mean (standard deviation) Median
Parents 3.09 (2.26) 3.00
Q16. (Parents) Next, please tell me how complicated or not complicated the college application process was for you. Please use a scale from 1 to 10, with 1 being “very simple” and 10 being “very complicated.” Base: Parents: N = 300
•Parents were asked to rate how complicated or not complicated the college application process was for them.
•Onaverage,thecollegeapplicationprocesswasrelativelysimpleforparents, with respondents giving a mean rating of 3.09 on a scale of 1 (very simple) to 10 (very complicated). Moreover, nearly half gave a rating of 1 or 2.
• However,about1in10parentsgavearatingof7orhigher.
0% 20% 40% 60% 80% 100%
6%
47%
5%
3%
14%
25%
Don’t know
9 or 10 (verycomplicated)
7 or 8
5 or 6
3 or 4
1 (very simple) or 2

Complexity in College Admission: Fact or Urban Myth
58
Figure 22. Whether College-Educated Parents Believed the Application Process Had Become More Simple or More Complicated
Group Mean (standard deviation) Median
Parents 4.86 (3.09) 5.00
Q27. (Parents) Thinking back to when you applied to college, do you think the college application process has become more simple or more complicated? Please use a scale from 1 to 10, with 1 being “much more simple” and 10 being “much more complicated.” Base: Respondents who have a four-year college degree. Parents: N = 128
•Parents who had at least a four-year college degree were asked if they believed that the application process had become simpler or more complicated since they applied to college.
• Respondentsweresplitintheiropinionsregardingiftheapplicationprocesshad become more complicated, with a mean rating of 4.86 on a scale of 1 (much more simple) to 10 (much more complicated).
•One-quarteroftheseparents believed that the process was much simpler now (rating of 1 or 2); however, a similar percentage believed that it had become more complicated (rating of 7 to 10).
0% 20% 40% 60% 80% 100%
13%
25%
17%
13%
21%
11%
Don’t know
9 or 10 (much more complicated)
7 or 8
5 or 6
3 or 4
1 (much more simple) or 2

Research Findings of Parent and Student Perceptions of Complexity
in College Admission
59
Figure 23. How Stressful the College Application Process Was for Parents
Group Mean (standard deviation) Median
Parents 4.45 (2.80) 4.00
Q18. (Parents) Overall, how stressful or not stressful has the college application process been for you? Please use a scale from 1 to 10, with 1 being “not at all stressful” and 10 being “very stressful.” Base: Parents: N = 300
•Parents were also asked to rate how stressful the college application process was for them (Figure 23). Parents found the process to be moderately stressful, with a mean rating of 4.45 on a scale of 1 (not at all stressful) to 10 (very stressful).
• Nearly3in10respondentsgaveastressfulnessratingof1or2;incontrast,one-quarter gave a rating of 7 or higher.
0% 20% 40% 60% 80% 100%
14%
29%
1%
11%
21%
24%
Don’t know
9 or 10 (very stressful)
7 or 8
5 or 6
3 or 4
1 (not at all stressful) or 2

Complexity in College Admission: Fact or Urban Myth
60
• Afterratinghowstressfulornotstressfulthecollegeapplicationprocesswas for them, parents were asked to explain their rating.
• Amongthoseparents who gave a rating of 1 (not at all stressful) to 5, more than 2 in 10 said they gave the rating they did because their child was responsible for everything or because they found the process uncomplicated and self-explanatory.
Table 10A. Why Parents Thought the College Application Process Was Stressful or Not Stressful for ThemReason* Percent of RespondentsStressfulness rating of 1 (not at all stressful) to 5 N = 211
Students responsible for everything/Parent did not help much 22%
Was not complicated/All information needed in one place/Process was self-explanatory 20%
Worried about deadlines/Difficult to meet deadlines 9%
Someone else helped with application (teachers, school counselors, college students) 9%
Application fees too high/Financially stressful/FAFSA stressful 8%
Different applications have different requirements/Difficult to gather all the required items 8%
Unsure about which college their child should attend/Wanted their child to pick the right college and major 7%
Waiting for the answer was the stressful part/Not knowing if child was accepted 7%
Very time consuming for child/Hard to balance with work, school and extracurricular activities 5%
Q19. (Parents) Why did you give this rating [regarding how stressful the college application process was for them]? Base: Parents: N = 300 *Respondents could offer more than one response. Only responses mentioned by at least 5 percent of respondents are shown.

Research Findings of Parent and Student Perceptions of Complexity
in College Admission
61
• Amongparents who found the college application process more stressful (rating of 6 to 10), the primary reason was application fees and other financial issues.
• Roughly15percentoftheserespondentsratedtheexperienceasstressfulbecause of the following:
• Unsureaboutwhichcollegetheirchildshouldattend/Wantingtheirchildto pick the right college
• Difficultforchildtobalancethecollegeapplicationprocesswithschooland other commitments
• Parentswerenewtotheprocess(childisafirst-generationstudent)
Table 10B. Why Parents Thought the College Application Process Was Stressful or Not Stressful for Them (Cont’d)Reason* Percent of RespondentsStressfulness rating of 6 to 10 (very stressful) N = 87
Application fees too high/Financially stressful/FAFSA stressful 24%
Unsure about which college their child should attend/Wanted their child to pick the right college and major 16%
Very time consuming for child/Hard to balance with work, school and extracurricular activities 14%
Never been through process before/Child is a first-generation college student 14%
Waiting for the answer was the stressful part/Not knowing if child was accepted 10%
Stressful in general/Overwhelming 10%
Worried about deadlines/Difficult to meet deadlines 8%
Different applications have different requirements/Difficult to gather all the required items 8%
Applied to multiple schools at once 6%
Decision determines their child’s future or profession 6%
Students responsible for everything/Parent did not help much 6%
Applications were unclear or confusing 5%
Q19. (Parents) Why did you give this rating [regarding how stressful the college application process was for them]? Base: Parents: N = 300 *Respondents could offer more than one response. Only responses mentioned by at least 5 percent of respondents are shown.
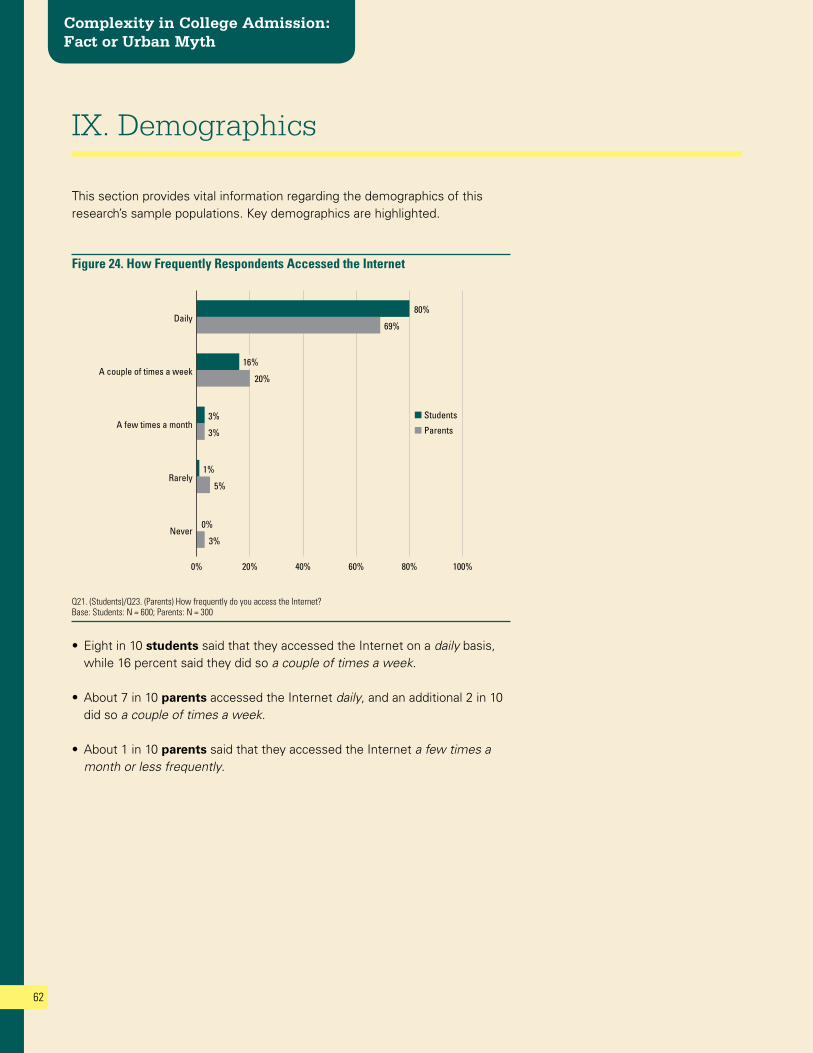
Complexity in College Admission: Fact or Urban Myth
62
IX. Demographics
This section provides vital information regarding the demographics of this research’s sample populations. Key demographics are highlighted.
Figure 24. How Frequently Respondents Accessed the Internet
Q21. (Students)/Q23. (Parents) How frequently do you access the Internet? Base: Students: N = 600; Parents: N = 300
• Eightin10students said that they accessed the Internet on a daily basis, while 16 percent said they did so a couple of times a week.
• About7in10parents accessed the Internet daily, and an additional 2 in 10 did so a couple of times a week.
• About1in10parents said that they accessed the Internet a few times a month or less frequently.
0% 20% 40% 60% 80% 100%
Parents
Students
3%
5%
3%
20%
0%
1%
3%
16%
69%
80%
Never
Rarely
A few times a month
A couple of times a week
Daily
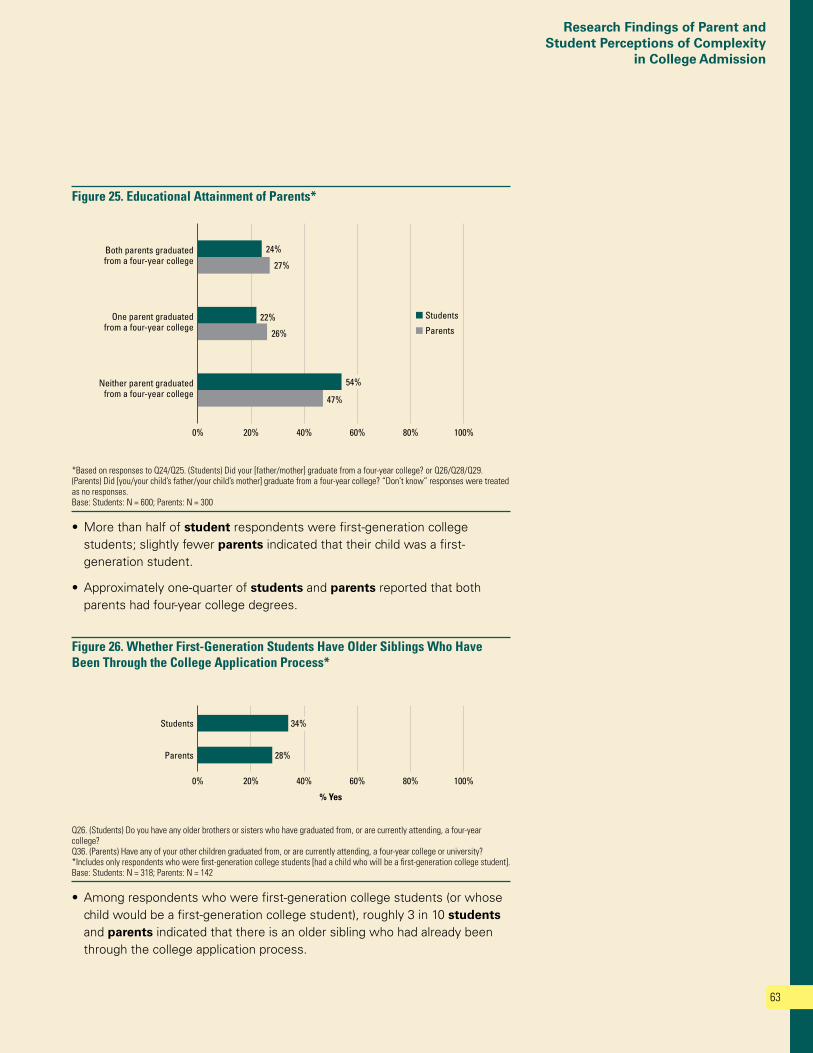
Research Findings of Parent and Student Perceptions of Complexity
in College Admission
63
Figure 25. Educational Attainment of Parents*
*Based on responses to Q24/Q25. (Students) Did your [father/mother] graduate from a four-year college? or Q26/Q28/Q29. (Parents) Did [you/your child’s father/your child’s mother] graduate from a four-year college? “Don’t know” responses were treated as no responses. Base: Students: N = 600; Parents: N = 300
•Morethanhalfofstudent respondents were first-generation college students; slightly fewer parents indicated that their child was a first-generation student.
• Approximatelyone-quarterofstudents and parents reported that both parents had four-year college degrees.
Figure 26. Whether First-Generation Students Have Older Siblings Who Have Been Through the College Application Process*
Q26. (Students) Do you have any older brothers or sisters who have graduated from, or are currently attending, a four-year college? Q36. (Parents) Have any of your other children graduated from, or are currently attending, a four-year college or university? *Includes only respondents who were first-generation college students [had a child who will be a first-generation college student]. Base: Students: N = 318; Parents: N = 142
• Amongrespondentswhowerefirst-generationcollegestudents(orwhosechild would be a first-generation college student), roughly 3 in 10 students and parents indicated that there is an older sibling who had already been through the college application process.
0% 20% 40% 60% 80% 100%
Parents
Students
54%
22%
24%
47%
26%
27%
Neither parent graduated from a four-year college
One parent graduated from a four-year college
Both parents graduated from a four-year college
0% 20% 40% 60%
% Yes
80% 100%
Parents
Students
28%
34%

Complexity in College Admission: Fact or Urban Myth
64
•Morethan8in10respondentsindicatedthatthestudentattendedapublichigh school. About one-quarter of students and 2 in 10 parents reported a GPA of 3.24 or less, while one-third or more reported a GPA of 3.75 or greater.
• NearlyallrespondentsreportedtakingtheSAT,withameanscoreinthemid-1500s. Considerably fewer reported taking the ACT; those who did had a mean score of 24 to 25.
• Theprospectivecollegemajorsforrespondents(orrespondents’children)were varied.
Table 11. Student DemographicsType of High School Student Attends Students (N = 600) Parents (N = 300)
Public school 88% 86%
Private school 11% 12%
Home school 1% 2%
Student’s Anticipated Major Field* Students (N = 600) Parents (N = 300)
Life sciences 19% 14%
Physical sciences 17% 17%
Social sciences 17% 11%
Business 16% 14%
Medical sciences 11% 13%
Liberal arts 10% 9%
Education 8% 10%
Communications 4% 6%
Undecided 9% 6%
*Respondents could offer up to two responses. Only responses mentioned by at least 5 percent of respondents in either group are shown.
High School GPA Students (N = 600) Parents (N = 300)
2.99 or less 11% 6%
3.00 to 3.24 13% 13%
3.25 to 3.49 12% 10%
3.50 to 3.74 19% 21%
3.75 to 3.99 19% 19%
4.00 or greater 18% 14%
Don’t know 8% 17%
Standardized Tests Taken Students (N = 600) Parents (N = 300)
% taking SAT 98% 97%
% taking ACT 48% 61%
Combined SAT Score Students (N = 457) Parents (N = 138)
Mean SAT score (std. deviation) 1574 (306.50) 1529 (351.09)
Median 1570 1540
Combined ACT Score Students (N = 237) Parents (N = 76)
Mean ACT score (std. deviation) 24.37 (5.23) 25.08 (5.93)
Median 24.00 25.00
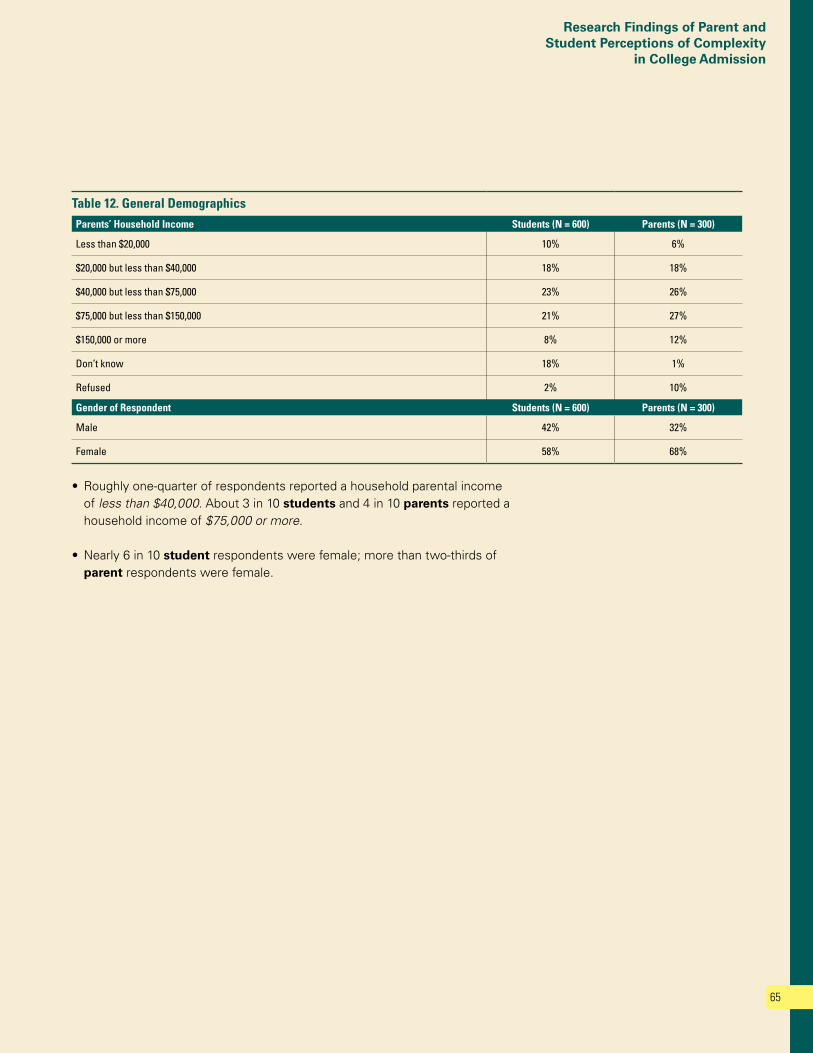
Research Findings of Parent and Student Perceptions of Complexity
in College Admission
65
• Roughlyone-quarterofrespondentsreportedahouseholdparentalincomeof less than $40,000. About 3 in 10 students and 4 in 10 parents reported a household income of $75,000 or more.
• Nearly6in10student respondents were female; more than two-thirds of parent respondents were female.
Table 12. General DemographicsParents’ Household Income Students (N = 600) Parents (N = 300)
Less than $20,000 10% 6%
$20,000 but less than $40,000 18% 18%
$40,000 but less than $75,000 23% 26%
$75,000 but less than $150,000 21% 27%
$150,000 or more 8% 12%
Don’t know 18% 1%
Refused 2% 10%
Gender of Respondent Students (N = 600) Parents (N = 300)
Male 42% 32%
Female 58% 68%


10b-2541 AD
VOCA
CY