complexity in structured finance: financial wizardry or ... · complexity in structured finance:...
TRANSCRIPT

Complexity in Structured Finance:Financial Wizardry or Smoke and Mirrors?∗
Andra Ghent Walter Torous Rossen ValkanovASU MIT UCSD
[email protected] [email protected] [email protected]
This draft: May 25, 2014.First draft: September 13, 2013
Abstract
We use data from prospectus supplements to create measures of the complexityof securitized products. We find that securities in more complex deals default more.However, yields of more complex securities are not higher at issuance indicating thatinvestors do not perceive such assets as more likely to default. The relation betweencomplexity and default is not primarily due to issuers masking low quality loans asit persists after controlling for the collateral default rate. Rather than creating safersecurities, complexity disadvantages more senior securities within a deal. Rating agen-cies are more lenient in rating complex deals.
JEL Codes: G12, G14, G21, G24.
∗We thank Mark Adelson, Andy Davidson, Sean Flynn, John Griffin, Harrison Hong, Kjell Nybor, PerOstberg, Chris Parsons, Amit Seru, Kumar Venkataraman, Sunil Wahal, Joseph Zechner, and seminaraudiences at ASU, the Greater Boston Urban and Real Estate Economics Seminar, McGill University’sFifth Annual Risk Management Conference, University of California (Berkeley), University of Luxemburg,and University of Zurich for helpful suggestions. Yue Cao and Andrew Farber provided excellent researchassistance. Valkanov benefited from the hospitality of the University of Zurich while writing parts of thispaper.

1 Introduction
Mortgage-backed securities (MBS) are created by the pooling and tranching of loans into
multiple securities oftentimes with various credit enhancements. Their structures are de-
tailed in lengthy prospectuses and prospectus supplements (many of them hundreds of pages
long) describing the collateral, the allocation of cashflows from the pool of loans to the se-
curities in various states of nature, the rating of the securities, and other structural features
(e.g., collateral groups, subordination, and cross-collateralization). These non-standardized
contingent contracts place considerable informational demands on investors. In other words,
they are complex.
The fundamental question we address in this paper is whether complexity is a byproduct
of issuers’ attempts to tailor new securities to investors’ preferences and improve risk sharing
or whether it is used as smoke and mirrors to sell risky securities at inflated prices. The
promise of complex structuring is that it enables the creation of low-risk securities from
collateral of variable quality (Gorton and Metrick (2013)). Indeed, markets for sophisticated
structured products have historically emerged as a way to disseminate high risk collateral.1
The lower the quality of the collateral, the more elaborate the structuring must be to create
securities that have extremely low default probabilities such as investors require for AAA-
rated securities. Under this view, while complexity may be negatively correlated with the
quality of the collateral, there should not be a correlation between the default of securities in
MBS deals and complexity. If complex structuring fulfills its promise, there may be welfare
gains from the creation of new securities.
A less sanguine view of complexity is that it is used by more informed market participants
to exploit less informed investors. For example, discussions of security complexity feature
1For example, the modern CMBS market developed to find investors for the assets of failed savings andloans (Jacobs, Manzi, and Fabozzi (2006)). Similarly, the collateral for the earliest Collateralized DebtObligations (CDOs), which are particularly sophisticated structured securities, was high risk debt issuedby corporations and governments in emerging market countries (Lucas, Goodman, Fabozzi, and Manning(2007), p. 4). Most notably, and most importantly from a macroeconomic perspective, was the explosion inthe market for complex MBS collateralized by subprime mortgages in the years preceding the financial crisisof 2008-2009.
1

prominently in the 2011 Financial Crisis Inquiry Commission’s Report as a contributing
factor to the financial crisis. If investors face constraints, including high costs, in acquiring
or processing information then complexity may play a role in the pricing and performance
of MBS. As sophisticated MBS were at the center of the 2007-2009 financial crisis and
markets for many securitized products collapsed, it is important to empirically test whether
complexity is related to default of these securities.
We start by constructing five variables that proxy for the complexity of structured prod-
ucts. For each deal, we collect data on (i) the number of collateral groups and (ii) the
number of securities (i.e., tranches). In addition, using the prospectus supplement of a deal,
we count (iii) the total number of pages in the prospectus supplement, (iv) the number of
pages specifically describing the collateral, and (v) the number of pages specifically describing
the division of cashflows from the pool of loans to the securities. The prospectus-based vari-
ables are hand-collected and their ability to proxy for complexity is supported by Loughran
and McDonald (forthcoming). The five variables are designed to measure the informational
demands MBS deals impose on investors and the intricacies in structure across deals. While
correlated, they capture different facets of the MBS products. Thus, we also provide a sum-
mary measure of complexity – an index of complexity – that synthesizes the information
available in our five individual variables.
We then use data from the home equity asset-backed securities (ABS) market, a sub-
segment of the larger MBS market that consists of most subprime MBS, together with our
measures of complexity to establish the following facts. Our most important finding is that,
controlling for the year the security is issued, securities of more complex deals default more
ex post and are hence riskier. A one standard deviation increase in the complexity index is
associated with a three percentage point increase in the risk of default. The relation between
complexity and security performance is particularly strong for securities rated AAA at is-
suance. For these securities, a one standard deviation increase in complexity is associated
with a seven percentage point higher likelihood of default. The higher likelihood of default
2

is economically meaningful as it represents a 19% increase relative to the mean default level
on AAA securities.2
Our default results do not solely reflect issuers masking low quality collateral with com-
plexity. We arrive at this conclusion for two reasons. First, we find that the relation between
complexity and collateral performance is substantially less robust than the one between com-
plexity and security performance. More importantly, we find that controlling for collateral
performance directly in our regressions does not substantially alter the magnitude of the
relation between complexity and security default.This suggests that one channel by which
complexity may impact security default is facilitating the diversion of collateral cash to
lower-rated tranches to the disadvantage of senior tranches. Issuers, who usually own the
residual tranche (see, for example, Demiroglu and James (2012) and Begley and Purnanan-
dam (2012)), benefit as a result.
The finding that securities in more complex deals default more is not, in and of itself,
evidence that complexity disadvantages investors. If investors receive higher spreads in
exchange for assuming the higher default risks, the complexity may not harm investors.
However, we find that securities of more complex deals have lower spreads at issuance
indicating that, ex ante, investors did not perceive them as riskier. This finding is intriguing
because, in light of the higher default rates of complex deals, we anticipate observing higher,
rather than lower, spreads as compensation for additional credit risk.
Furthermore, credit rating agencies (CRAs) rate more complex deals more favorably from
the perspective of issuers. The favorable ratings do not, however, explain the greater default
propensities since we control for the treatment of the security by the CRAs in our regressions.
Finally, we find that the level of complexity in ABS deals increased steadily throughout the
2000s.
The findings that more complex securities default more, and that this greater default risk
is not priced, indicate that large institutional investors, who are the primary participants in
2The mean default rate in our AAA subsample is 36 percentage points. A seven percentage point increasein the likelihood of default therefore represents a 19% (7/36) higher likelihood of default.
3

the ABS market, do not fully process the information in elaborate securities. As such, they
do not demand a risk premium to hold more complex securities that will default more often.
Issuers, aware of the limitations of market participants, can use complexity to price low
quality securities at par with high quality securities. In other words, it literally pays issuers
to be complex. If, alternatively, investors fully process information about the securities,
issuers would either have to accept a lower price for more complex securities or would not
be able to sell them at all.
Our findings are important for understanding the boom and bust in subprime securities.
As of summer 2013, the majority of these securities defaulted, including more than a third of
securities rated AAA at issuance (see Table 1). Why did investors pour so much money into
assets that ultimately proved so disastrous? One explanation is that, as argued by Gennaioli,
Shleifer, and Vishny (2012), they neglected the risk of a widespread decline in home prices.
Indeed, there is evidence that subprime executives themselves did not expect that home
prices would fall substantially (Cheng, Raina, and Xiong (forthcoming)). Such neglect likely
decreased investors’ willingness to allocate the resources required to fully understand the
structure of these securities. Our results imply that a contributing factor to the subprime
boom was the complexity of the securities. Our findings also help to explain the collapse
in trading of PLMBS during the crisis (see Gorton and Metrick (2012)) as they provide
evidence of asymmetric information between different types of investors in the ABS market.
Theoretical literature (e.g., Bhattacharya, Reny, and Spiegel (1995), Rahi (1996), Hanson
and Sunderam (2013)) shows that such asymmetric information can cause trading to collapse.
Our results are important for several additional reasons. First, the finding that more
complex deals are rated more favorably shows that the CRAs do not simplify the structure
of complex securities into one meaningful metric, the credit rating, which in turn drives
prices. Hence, CRAs do not obviate the need for investors to understand complex securi-
ties. Without knowing more about the intricacies of how CRAs rate these securities, we
cannot conclude that credit analysts were confused by the complexity of deals. Nevertheless,
4

our findings suggests that during the subprime boom, the CRAs exacerbated rather than
mitigated problems investors had in understanding complex securities.
Second, the failure of both spreads and credit ratings to reflect the greater risks associated
with complexity indicates that there may be welfare benefits from standardizing securitized
products in the sense of Gale (1992). Such standardization may be particularly important
if Fannie Mae and Freddie Mac play less of a role in the mortgage market going forward.
Securities issued by the GSEs (agency MBS) are quite simple by our measures: their offering
circulars are short, there are few securities within a deal, and they usually only have one
collateral group.3
Third, our results contribute to a growing literature documenting that market partici-
pants ignore publicly available information. In the context of the stock market, this results
in stock return predictability (e.g., DellaVigna and Pollet (2007, 2009), Hong, Torous, and
Valkanov (2007), Hirshleifer, Lim, and Teoh (2009), and Cohen and Lou (2012)).4 Impor-
tantly, that literature focuses mainly on unsophisticated retail investors and their boundedly
rational decision-making. Our results show that sophisticated market participants can also
be boundedly rational when the processing of intricate financial information is excessively
costly. The evidence also suggests that, rather than only facing difficulties processing infor-
mation about the underlying assets in a timely fashion, investors either lack the incentives for
or have problems understanding the structure of securities themselves. In sum, the evidence
from the ABS market makes it clear that the complexity of financial information ought to
play a role in defining and understanding bounded rationality.
Our results are quite distinct from those that Furfine (2014) finds in the Commercial
MBS (CMBS) market. Furfine (2014) finds that loans in more complex deals default more
and concludes from this that issuers used complexity to distract investors from the low
3Although agency MBS investors do not face default risk, they face substantial prepayment risk and, assuch, there is still scope for structuring.
4Barberis and Thaler (2003) survey work demonstrating bounded rationality in financial markets. Addi-tional recent papers in this literature include Huberman and Regev (2001), Hou (2007), Barber and Odean(2008), Cohen and Frazzini (2008), and Menzly and Ozbas (2010). These papers are based on theoreticalwork by Merton (1987), Hong and Stein (1999), Sims (2003), and Hirshleifer and Teoh (2003).
5

quality collateral in the deals. However, structured finance investors hold securities rather
than the collateral directly. Without further evidence, a finding that high risk collateral
goes into more complex deals is entirely consistent with the efficient view of complexity in
which issuers use complexity to create high quality securities from lower quality collateral.
While Furfine (2014) claims that his paper is about security design, absent any analysis of
the securities, his claim is speculative.
Our paper is more narrowly related to a small but growing literature on security com-
plexity. Carlin, Kogan, and Lowery (2013) look at the effect of complexity on trading in a
laboratory setting. Celerier and Vallee (2013) study complexity in the market for French
retail structured products. Carlin (2009), Ellison and Ellison (2009), Carlin and Manso
(2011), and Ellison and Wolitzky (2012) provide theoretical models of complexity.
The remainder of the paper proceeds as follows. In the next section, we describe the
structure of the US RMBS market and our measures of complexity. In Section 3, we de-
scribe our dataset and the complexity we observe in the ABS market. Section 4 documents
how complexity relates to security performance. In Section 5, we test whether investors
understand that more complex deals are more likely to underperform and whether ratings
reflect the greater risk associated with complexity. In Section 6, we discuss how well theories
of security design can explain our results. Section 7 concludes.
2 The Structure of MBS and Measuring Complexity
The US RMBS market can be divided into two main asset classes: 1) RMBS issued by the
GSEs or that use securities issued by the GSEs as collateral, and 2) RMBS issued by non-
government entities that are backed by mortgages or securities not guaranteed by the GSEs.
The first market is commonly known as the agency market while the second is usually referred
to as the private label MBS market. In this paper we focus exclusively on the PLMBS market
as agency securities are simpler to understand and did not see nearly the same amount of
6

distress as the PLMBS market during the 2007-2009 crisis and its aftermath. Within the
PLMBS market, we confine our attention to an asset class known as home equity ABS.
Market participants use this term to refer to securities backed by residential mortgage loans
including first lien loans, home equity loans, and home equity lines of credit. Securities from
the typical home equity ABS deal are marketed to investors as subprime (e.g., “RES B/C”)
or Alt-A.
Institutions are the dominant investors in this market and the securities are extremely
illiquid: Bessembinder, Maxwell, and Venkataraman (2013) find that only about one fifth
of non-agency structured finance securities trade in the 21 month period beginning in May
2011. The issuers and underwriters of ABS are usually large investment banks. For instance,
in 2006, the peak of the ABS market, the largest three lead deal managers by issuance value
were Lehman Brothers, RBS Greenwich Capital, and Goldman Sachs.
A typical ABS deal has many securities in it with a prioritization of cashflows from the
underlying collateral to the top tranche (i.e., security) first, then to the second tranche, and
so forth. In contrast, losses on the underlying collateral are typically applied to the lowest
tranche first, then the next lowest, and so forth. Most securities within a deal are rated by
multiple CRAs. The lowest tranches are usually unrated and are commonly referred to as
the residual or equity piece since they behave much like equity in a firm.
Some ABS securities are used as collateral for Collateralized Debt Obligations (CDOs).
As Coval, Jurek, and Stafford (2009) and Griffin, Lowery, and Saretto (2013) argue, CDOs
are even more complex than ABS. The typical ABS-backed CDO usually consists of either
investment grade ABS securities or mezzanine (e.g., BB or residual) ABS securities. We do
not include CDOs backed by ABS in our dataset for three reasons. First, CDOs backed by
RMBS are a much smaller asset class than ABS. Second, getting data on these securities
is far more challenging than gathering data on ABS. Bloomberg rarely has cashflows for
CDOs backed by RMBS and even less frequently has prospectus supplements for these deals.
Finally, as we show, there is more than enough complexity in ABS for us to understand,
7

explain, and exploit.
ABS deals often subdivide the overall loan pool backing a deal into multiple loan groups.
In a typical deal structure, a loan group primarily supports a series of senior securities but
potentially with cross-collateralization from other loan groups within the same deal. For
example, the issuer divides the loans in deal ABC into loan groups 1 and 2. The loans
in group 1 collateralize securities AAA-1, AA-1, and A-1. Group 2 collateralizes securities
AAA-2, AA-2, and A-2. If the deal has a cross-collateralization provision, in the event
securities AAA-1, AA-1, and A-1 are at serious risk of default due to poor performance of
the loans in group 1, cash flows from group 2 loans would be diverted to securities AAA-
1, AA-1, A-1 provided that the securities group 2 collateralizes (AAA-2, AA-2, and A-2)
are at little risk of default or the prepayment rate on group 2 is such that, for example,
AAA-2 has been entirely paid off. Regardless of whether a multiple loan group deal has
cross-collateralization, more junior tranches within the deal are typically supported by the
entire loan pool (i.e., all loan groups).
2.1 Measuring Complexity
We measure complexity at the deal level. The idea is to proxy for the heterogeneity in the
structure of a securitization and the amount of information investors and CRAs need to
process in order to trade and rate these assets, respectively. For a given deal, we define
the following variables: (i) the number of collateral groups (nloangroups); (ii) the number of
securities or tranches (ntranches); (iii) the number of pages in the prospectus supplement
(pagesprosup); (iv) the number of pages in the prospectus specifically describing the collateral
(pagesmpool); and (v) the number of pages in the prospectus specifically describing the
division of cashflows from the collateral to the securities in the deal (i.e., the waterfall) and
details of the security more generally (pageswaterfall). All these variables are observable at
issuance of the security. The results in Loughran and McDonald (forthcoming) support our
use of the prospectus-based proxies for complexity.
8

The first two variables are self-explanatory. The portions of the prospectus supplement we
use to define pagesmpool are the part of the supplement under the heading “Description of the
Mortgage Pool” or a similar heading and any annex, schedule, or appendix that has tables
detailing the characteristics of the loans. Some deals include tables of statistics detailing
the mortgages directly in the section of the prospectus supplement labeled “Description of
the Mortgage Pool” while others include these tables in an annex, schedule, or appendix.
The portion of the prospectus supplement we use to define pageswaterfall is the part of
the supplement under the heading “Description of the Certificates” or “Description of the
Securities”. Included in the waterfall are, for example, calculation of the principal and
interest overcollateralization triggers and precise details regarding the mechanics of cross-
collateralization. In defining pagesmpool and pageswaterfall, we do not include subsections
of the section at the beginning of the supplement section typically headed “Summary” even
if they include descriptions of the collateral or the waterfall as these subsections are less
clearly demarcated than the main sections of the prospectus supplement.
While we anticipate that our complexity variables will be correlated with one another,
each variable captures a different dimension of complexity. We thus construct an index of
complexity, denoted by complexityindex, by extracting the first principal component across
our five complexity variables at each point in time. The higher the index of complexity is,
the greater the complexity of a deal. Measuring complexity using an index is also convenient
because we can include in our estimation information contained in all five variables jointly
without facing the issue of collinearity. The drawback of using an index is that we lose
the ease of economic interpretation. In the empirical analysis, we present results using the
underlying five complexity variables as well as the complexity index.
9

3 Data
We collected information on all PLMBS deals available on Bloomberg that were originated
between 1999 and 2007. We restrict our attention to USD-denominated ABS backed by
US assets for which Bloomberg has information on cashflows since the data quality is much
higher for these securities. Our sample includes roughly half the ABS deals on Bloomberg.
We manually collected all relevant information on our securities available from Bloomberg,
including the prospectus supplement if it was available. All of our variables are measured at
the time the security was issued except for security default and the foreclosure rate on the
collateral group. Security default is a binary variable that takes a value of 1 if the security
had defaulted by August 2013. The foreclosure rate on the loan group is also measured in
August 2013. Our data contains variables that vary by deal, by security, and by collateral
group. Most of our analysis is at the security level; in robustness exercises, we cluster our
standard errors at the deal level to be adequately conservative.
Our sample starts in 1999 and ends in 2007 as the ABS market was quite small until the
2000s and there was very little issuance of ABS from 2008 onwards.5 Figure 1 illustrates the
size of the market in our sample on an annual basis. Issuance peaks in 2006 at more than
half a trillion USD and, in 2007, is less than half of what it is in 2006 both in terms of dollar
volume and number of deals. Issuance is less than $100B in every year before 2002.
Most securities issued are adjustable rate and, following Ashcraft, Goldsmith-Pinkham,
Hull, and Vickery (2011), we drop fixed rate securities to focus on credit risk rather than
prepayment risk. However, all of our results are qualitatively the same when we include fixed
rate securities in our sample.
5Although there are a few ABS deals available on Bloomberg in the 1990s, we begin our sample in 1999so that we can adequately control for heterogeneity in the year of issuance.
10

3.1 Deal-Level Variables
3.1.1 Complexity Variables
Panel A of Table 1 summarizes our deal level variables. Although the modal deal has 2 loan
groups, 12% of deals have 3 or more loan groups. The largest number of loan groups in a
deal is the 11 groups in BSABS 2007-SD1. The average number of securities per deal is 16
and one deal, CSAB 2007-1, contains 75 separate securities.
We have prospectus supplements for 62% of the deals. We use the prospectus supplements
to derive several key deal-level characteristics, including three of our complexity variables.
The average number of pages in the prospectus supplement is 143 but there is substantial
variation across deals: one has only 27 pages while another, LXS 2007-3, has almost 400
pages. Roughly 60 pages of the average prospectus supplement describe the collateral and
the waterfall.
The complexity index is normalized to have a standard deviation of one for ease of
interpretation. To make it easier to see the time series pattern, we normalize complexityindex
to have a mean of 0 in 1999 by subtracting the mean of complexityindex in 1999.6 As Figure
2 illustrates, complexity increases over time. For example, in 1999 the average number of
securities in a deal is 9 but, by 2006, it doubles to 18. Over our sample period, pagesprosup,
pagesmpool, and pageswaterfall all grow by magnitudes similar to that of the number of
securities. Deal size also doubles over our sample. The number of loan groups in each deal
is roughly stable over time.
While we document increases in complexity over the sample period, we do not interpret
increased complexity as evidence of substantial financial innovation in securitization over
the 2000s. We have no evidence that any of the features of ABS deals that increase their
complexity were invented or even diffused during the 2000s. As Foote, Gerardi, and Willen
(2012) point out, markets for structured MBS had existed for a long time before the subprime
6The normalization is done at the security level as this is the unit of observation for our analysis, ratherthan at the deal level for which we show results in Table 2 and summary statistics in Table 1. Because ofthis, the standard deviation in Table 1 is not exactly one.
11

boom. Riddiough and Thompson (2011) document the existence of sophisticated MBS in the
US since at least the 1850s.
As Table 2 shows, the complexity variables are correlated. The highest correlation (73%)
between our complexity measures is between pagesmpool and pagesprosup. Mechanically, an
increase in the number of pages required to describe the collateral increases the length of the
overall supplement. There is also a high correlation (52%) between the number of securities
and the number of loan groups.
3.1.2 Deal-Level Control Variables
Aside from our deal-level complexity variables, we include an indicator for whether the deal
provides for cross-collateralization across loan groups, the size of the deal (in millions of
USD) (dealsize), the excess spread in the deal in percent (excessspread), and the volume of
ABS issuance by the lead manager of the deal in the year the deal was issued (leadtot). We
include deal size because Furfine (2014) uses it as a measure of complexity. We drop a small
number of deals that have negative excess spread. We include the size of the lead manager
following He, Qian, and Strahan (2012)’s finding that larger issuers received more favorable
ratings.7 Finally, we control for the year the deal was issued since there are significant
changes over time in the ABS market.
Only 30% of the deals provide for any cross-collateralization. Since more than twice that
number of deals have multiple loan groups, a slight majority of deals with multiple loan
groups do not provide for cross-collateralization. The average deal is for $837 million; the
smallest deal is for $25 million and the largest deal is a 2007 deal for over $6 billion. The
average excess spread across all securities in a deal is 4.65 percentage points. The average
amount of total ABS underwriting by the lead manager of the deal in the year the deal is
issued is $26 billion, with one underwriter issuing $75 billion of ABS in a year.
7The lead manager is usually also the issuer. We use the lead manager rather than the issuer as Bloomberghas a uniform naming convention for the lead manager (but not for the issuer) as the size of the issuer is notthe focus of our study.
12

We do not include deal-level overcollateralization as a control variable because home
equity ABS typically do not have any initial overcollateralization. Rather, they rely on
excess spread to paydown bonds faster than simply through the return of principal, thereby
creating overcollateralization. This turboing in essence converts interest into principal for
the benefit of senior bonds. If a target overcollateralization amount is achieved by the deals
stepdown date, principal and interest are diverted to the residual class, provided various
triggers are passed.8
3.2 Security-Level Variables
We control for the initial rating of the security. We include securities rated BBB through
AAA and control for ratings using the ratings categories AAA, AA, A, and BBB. If there is
a disagreement in the rating, we take the highest rating. For example, AAA takes a value of
1 if any of the three major CRAs rate the security AAA. Since there may be disagreement
among the CRAs, we also include a dummy variable (disagreetranche) that takes a value of
1 if there is any disagreement among the CRAs on the rating of that tranche. The ratings
disagreements are concentrated in the AA and A rated tranches: less than 2% of the AAA
securities have a ratings disagreement, while 38% of the AA and 43% of the A rated securities
have a disagreement. Only 27% of the BBB rated securities have a ratings disagreement. We
experimented with controlling for subnotches and the results are quite similar. Furthermore,
there appeared to be no more information in the subnotches than in the broader ratings
categories we use.
Default takes a value of 1 if the security defaults by August 2013 and 0 otherwise. We
define default to be an event in which the security has suffered a principal loss or in which
one of the ratings agencies indicates the security is in default. For Moody’s, this is a rating
of Caa1 or lower. For S&P, this is a rating of CCC+ or lower while for Fitch this is a rating
of CCC or lower.
8Triggers are tests embedded in a structure to protect senior security holders if the collateral exhibitsabnormally high delinquency or losses.
13

Panel B of Table 1 describes our security-level variables. We see that 36% of our secu-
rities are AAA-rated at issuance. By August 2013, 36% of these AAA-rated securities had
defaulted. By comparison, 80% of securities that had AA ratings at issuance had defaulted
while 95% of securities originally rated A or BBB were in default.
We also include the subordination level of each security. Subordination is a measure of
credit enhancement that measures the percentage of the value of all the securities in the deal
that are below it in the priority of payments. Thus, AAA securities have the most subor-
dination and BBB tranches have the least subordination. The mean level of subordination
of a security in a deal is 12 percentage points, and the average subordination for an AAA
security is 19 percentage points.
The main pricing variable in our dataset is the fixed spread the security pays above one
month LIBOR. This spread is fixed for the life of the security. Actual transaction prices
are extremely difficult to observe in the ABS market since, prior to May 2011, there was
no requirement that transactions be reported to any centralized body.9 Bloomberg has
transactions prices for some of our tranches on some dates, primarily the senior tranches.
For dates near security issuance, the security prices are extremely close to par so that the
spread is a good measure of the return investors expected to earn from investing in ABS.
The mean spread on a security is 92 basis points. AAA investors were promised a mere 26
basis points while BBB investors were promised 220 basis points on average.
3.3 Loan Group-Level Variables
Our data contains the shares of each state in the top 5 most common property states for
that pool. For example, if 25% of the loans in the pool come from California, 10% from
Florida, 5% from Ohio, 3% from Michigan, and 2% from New York, the top 5 state shares
9As of May 2011, the Financial Industry Regulatory Authority (FINRA) requires reporting of all MBStransactions but has not released the data it has collected for most classes of MBS, including PLMBS, to thepublic. FINRA has released the data from 2011 onwards to three groups of researchers; see Atanasov andMerrick (2013), Bessembinder, Maxwell, and Venkataraman (2013), and Hollifield, Neklyudov, and Spatt(2013). Bloomberg contains modeled prices for many securities but average transactions prices for far fewersecurities.
14

are reported as “CA 25%”, “FL 10%”, “OH 5%”, “MI 3%”, and “NY 2%”. We do not
know how the loans in a group are divided among the remaining 45 states. From the top 5
state shares, we construct the shares of the most prevalent top 5 states in the ABS market
(California, Florida, New York, Illinois, and Texas). On average, 29% of the loans in a pool
come from California, 9% from Florida, 4% from New York, 3% from Illinois, and 2% from
Texas. We experimented with using the shares from the top 10 states and our results were
quite similar.
We have detailed information on the measured ex ante quality of the collateral for less
than half of the securities. Nevertheless, all of our results are quantitatively and qualitatively
similar when we control for these observable collateral characteristics. The average FICO
score at origination on the loans that serve as collateral for our securities is 632 and ranges
from 470 to 780. The weighted average loan-to-value (LTV) of the loans in a group has an
average of 78% and a standard deviation of 13%. The average share of loans in a pool that
are low or no documentation is 35% with some loan groups having no reduced documentation
loans and some loan groups consisting entirely of reduced documentation loans. The weighted
average maturity (WAM) of the mortgages is 341 months on average and ranges from 136
to 477 months. Bloomberg has two variables that contain summary information about the
principal balances of the underlying loans. These variables are the share of loans with original
principal balances under $300,000 and the share of loans with original principal balances of
$300,000 to $600,000.
For robustness, we consider whether our results are driven by the presence of the GSEs in
the ABS market. Although none of our securities are issued by the GSEs, the GSEs bought
substantial quantities of AAA ABS. Often, one loan group in a multiple loan group deal is
tailored for one of the GSEs. The GSEs invested in AAA ABS backed by loan groups that
consisted entirely of loans with principal balances that conform to their conforming loan
limit. We can frequently identify such cases from the collateral group description Bloomberg
provides. We create a variable called conforming that takes a value of 1 if the collateral
15

group description contains terms such as “CONF”, “CON”, or “CONFORMING”. The
variable conforming takes a value of 0 if the collateral group description contains terms such
as “NCONF”, “NCON”, or “NONCONFORMING”. We manually code the exact collateral
descriptions as conforming to prevent misclassification. If the collateral group description
does not indicate whether the loans are conforming or non-conforming, conforming is missing.
4 Security Performance and Complexity
We define Di,t+T to be a variable that equals one if security i issued at t has defaulted in
our sample period, and zero otherwise. We model the probability of default using a probit
P (Di,t+T = 1) = Φ(Complex′i,j,tβ1 + Controls′i,j,tβ2
). (1)
where Φ() is the cumulative standard normal distribution and Complexi,j,t is a vector of
complexity variables for security i in deal j known at issuance of the security. A set of
control variables, collected in the vector Controlsi,j,t, is observable at issuance of secu-
rity i. The benchmark set of controls includes the deal size (dealsize), an indicator for
cross-collateralization in the deal (crosscollat), the amount of excess spread in the deal (ex-
cessspread), the issuance volume of the lead manager in the year the deal was issued (leadtot),
dummies for the year of issuance, controls for the geography of the collateral, dummies for the
rating categories, the percentage subordination of the security (subordination), the spread
above one month LIBOR the security promises (spread), and a dummy variable indicating
whether the CRAs disagreed on the security’s rating at issuance (disagreetranche). We in-
clude disagreetranche to capture the possibility that, for example, some investors treat what
we code an AA security as an A security.
Table 3 contains the results from estimating various specifications of equation (1). The
table presents marginal effects from the probit estimates to facilitate understanding the
economic magnitudes. As Columns 1 through 5 illustrate, all of our measures of complexity
16

predict security default. The effects are statistically significant at the 1% level. The signs
of the prospectus-based measures indicate that longer prospectus supplements, or particular
portions thereof, predict more default. Although longer prospectus supplements could in
principle indicate more transparency, more transparency is unlikely to be associated with
more default. Rather, our results suggest that longer prospectus supplements are associated
with decreased readability (or less transparency) consistent with the findings of Loughran
and McDonald (forthcoming).
The effect of complexity on default is also economically important. The addition of one
loan group increases the likelihood that a security will default by 3 percentage points. An
increase of one standard deviation in the number of securities in a deal (6 securities) raises
the likelihood that a security will default by one and a half percentage points. An increase
in the prospectus length of 38 pages (1 standard deviation) increases the risk of default by
2.5 percentage points. An increase of 18 pages in the length of the portion of the prospectus
devoted to describing the collateral raises the chance of default by 1.5 percentage points as
does a one standard deviation (9 page) increase in the length of the portion of the prospectus
that describes the waterfall.
Columns 6 and 7 of Table 3 present the effects of complexity when we combine our
complexity variables. In Column 6, we include all 5 measures of complexity simultaneously
without regard to potential collinearity. The number of securities in the deal and the number
of pages used to describe the collateral are not significant predictors of default once we control
for other dimensions of complexity. Although, not surprisingly, the magnitudes of the effects
decrease, nloangroups, pagesprosup, and pageswaterfall continue to be statistically significant
predictors of default at the 1% level.
In Column 7, we present our results from combining all complexity variables using their
first principal component, complexityindex. The standard deviation of complexityindex is 1
and the interpretation of its marginal effect is that a one standard deviation increase in the
overall complexity of the deal raises the risk of default by 3 percentage points.
17

As Table 4 shows, the relation between default and complexity is stronger for AAA
securities than for all securities. In Table 4, we perform the same analysis as we do in Table
3 but including only AAA securities. For AAA securities, adding one loan group to a deal is
associated with a 6 percentage point increase in the likelihood of default rather than the 3
percentage point increase we observed in our benchmark model. Issuing one more security
from a deal results in a 37 basis point increase in the risk of default for AAA securities while
for all securities the increase in the chance of default from one more security is only 26 basis
points. We also see stronger relations between default and pagesprosup, pagesmpool, and
pageswaterfall for AAA securities than for all securities.
Not only are the absolute magnitudes larger for AAA securities, the percentage increases
in default are larger. More than 80% of securities rated below AAA default while only 36%
of AAA securities default so that a given percentage point increase in the risk of default is a
much larger percent change for AAA securities. As Column 7 shows, a one unit increase in
complexityindex raises the likelihood of default by 7 percentage points for securities initially
rated AAA. As only 36% of our AAA securities default, a one unit increase in complexity
raises the risk of default by 19% for AAA securities.
Not surprisingly, AAA securities default the least and AA securities default the second
least. Securities initially rated A do not default statistically less frequently than BBB se-
curities. However, several variables beyond ratings predict default. Importantly, spreads on
individual securities are highly predictive of default even after controlling for their rating,
implying that investors priced securities using information beyond the rating. A 100 basis
point increase in the spread is associated with a 2.5 percentage point greater risk of default.
Furthermore, Table 4 shows that even AAA investors priced riskier securities higher. Adelino
(2009) also finds that spreads on MBS contain information about the risk of the security be-
yond what the information encapsulated in the rating. We also see that more credit support
in the form of subordination reduces the risk of default. A one percentage point increase in
the level of subordination decreases the risk of default by approximately half a percentage
18

point. Larger deals and deals from larger underwriters also default more often.
4.1 Sensitivity Analysis
We conduct several sensitivity analyses of our results to our model specification. Table
5 presents the key alternative specifications using the summary variable complexityindex ;
the full results for the individual complexity variables are available from the authors upon
request. Column 1 of Table 5 reproduces our benchmark specification with complexityindex
(Column 7 of Table 3).
Columns 2 and 3 of Table 5 show that, although complexity is a stronger predictor of
default for AAA securities, it is also an economically important predictor of default for
securities not rated AAA. For securities not rated AAA, a one standard deviation increase
in complexity is associated with a 1.3 percentage point rise in the likelihood of default; the
coefficient on default is statistically significant at the 1% level. We estimated the effect of
complexity on securities in each rating category separately (results not shown) and found
that the relation between complexity and default is similar for AA, A, and BBB securities.
In Column 4, we cluster the standard errors at the deal level. Since several of our variables
are security-level while other variables, including our complexity variables, are deal-level and
still others are loan group-level, the correct clustering of the standard errors, if any, is unclear.
Nevertheless, the effect of complexity on default continues to be statistically significant at
the 1% level when we cluster at the deal level. However, when we cluster the standard errors
by deal, dealsize is significant at the 5% level and the coefficient on leadtot is no longer
significant at a conventional level.
In Column 5, we present the results from estimating equation (1) when we include ad-
ditional summary characteristics about the loans as control variables. The specification in
Column 5 adds the weighted average LTV at origination (ltv), the average FICO score on
the loans (fico), the share of loans that are no or low documentation (lownodocshare), the
share of loans with balances under $300,000, the share of loans with balances of $300,000 to
19

$600,000, and the weighted average maturity (wam) of the loans to the vector of controls.
All of these variables are available for only about half the securities and, as such, the specifi-
cation in Column 5 cuts our sample in half. The coefficient on complexityindex continues to
be statistically significant at the 1% level although its magnitude falls by about one third.
Likely as a result of the much smaller sample, the coefficients on dealsize, crosscollat, and
leadtot are no longer statistically significant when we include collateral characteristics as
controls.
Column 6 contains the results from estimating equation (1) excluding securities collateral-
ized primarily by pools of entirely conforming pools, i.e., those pools for which conforming=1.
Our motivation for the specification in Column 6 is that the GSEs had a substantial demand
for PLMBS and usually only purchased securities based on conforming pools (see Ghent,
Hernandez-Murillo, and Owyang (2013) and Adelino, Frame, and Gerardi (2014)). Deals
in which the GSEs bought a security might thus have almost mechanically had one more
loan group which might in turn have increased measured complexity along other dimensions.
One concern then is that our complexity variables are only picking up the influence of the
GSEs. However, our results are extremely similar when we include securities collateralized
primarily by pools that the collateral group description describes as conforming.
In Column 7, we include our additional collateral characteristics, exclude securities based
on conforming pools, and cluster the standard errors by deal. When we combine all these
robustness exercises, it continues to be the case that an increase in complexityindex raises
the risk of default and that the effect is significant at the 1% level.
In another sensitivity exercise, we consider whether the results are sensitive to our way
of controlling for the geography of the loan group. In particular, we estimate a specification
in which, rather than controlling for the top 5 state shares, we control for the geographic
concentration of the loan group. We measure the concentration of the loan group using a
Herfindahl-Hirschmann Index (HHI) of the top five states in each loan group. The coefficients
on our complexity variables are very similar to those in our other specifications. The results
20

are available from the authors upon request.
Finally, we conduct our analysis using discrete measures of complexity to ensure the
robustness of our results to outliers. For example, rather than including the number of loan
groups itself as in Column 1 of Table 3, we include two dummy variables for the number
of loan groups, nloangroups2 and nloangroups3ormore. Similarly, rather than using the
number of tranches as in Column 2 of Table 3, we include a dummy variable that takes a
value of 1 if the number of securities in the deal was above the median and 0 otherwise. We
construct parallel discrete measures of complexity for the number of pages in the prospectus
supplement, the number of pages required to describe the collateral, the number of pages
required to describe the waterfall, and the number of disagreements in the deal. The results
from using these discretized complexity measures also imply that the risk that a security will
default increases with its complexity. The results using discretized complexity measures are
available from the authors upon request.
4.2 Disentangling Weak Collateral from Structuring
We have established that complex securities default more. In this subsection, we explore
possible reasons for the relation between complexity and security performance. There are
at least two possible explanations for the relation. The mechanisms are not mutually exclu-
sive. First, issuers may use complexity to mask collateral that is lower in quality in ways
that investors cannot easily observe. Although investors can easily observe key summary
characteristics of the collateral (e.g., the average LTV of the loans in the deal), issuers may
still have better information about the quality of the collateral. If this is the case, we would
expect to observe a higher foreclosure rate on the collateral ex post.
Another possibility is that complexity disadvantages senior tranches regardless of the
underlying collateral quality. Horwitz (2011) details one such example involving Carrington
Capital Management. In essence, Carringtons actions as servicer, for example, liberally using
capitalization modifications to make loans current, allowed it to release millions of dollars
21

of excess spread to the equity tranche that it owned rather than to the deals senior tranche.
More generally, Whitworth and Walsh (2006) document a myriad of triggers in equity ABS
deals and resulting flip-flops all of which have the potential to reduce the degree of protection
afforded to senior tranches. The impact of triggers on security performance is reminiscent
of the effects of mirepresentations at the collateral level documented by Piskorski, Seru, and
Witkin (2013) and Griffin and Maturana (forthcoming).
4.2.1 Collateral Quality and Security Complexity
In Table 6, we regress the foreclosure rate of the loan group on all observable collateral char-
acteristics in our dataset and our deal complexity variables. When the complexity variables
enter individually, all the signs on the complexity variables are positive. However, the co-
efficient on Furfine’s measure of complexity in the CMBS market, ntranches, is statistically
insignificant. The coefficient on nloangroups is also statistically insignificant while the coef-
ficient on pagesprosup is statistically significant only at the 10% level. While the coefficients
on pagesmpool and pageswaterfall are statistically significant at the 1% level, a comparison
of Tables 3 and 6 shows that the relation between security default and complexity is more
robust than the relation between collateral default and complexity.
In Column 7 of Table 6 , we include our summary measure of complexity, complexityin-
dex. The coefficient on complexityindex indicates that a one standard deviation increase
in complexity is associated with a 40 basis point increase in the foreclosure rate in a pool.
The coefficient on complexityindex is significant at the 1% level. Because we control for the
year of issuance of the deal, the relation between complexity and collateral quality that we
uncover is not being driven by the fact that, over our sample period, complexity is increasing
(see Figure 2) while collateral quality is decreasing. There is thus a positive association be-
tween ex post collateral quality and complexity. This finding is analogous to Furfine’s (2014)
in the CMBS market. However, taken in isolation, a finding that lower quality collateral
is associated with more complexity reveals little about whether the complexity is efficient.
22

Rather, the promise of complex structuring was to create high quality securities from low
quality collateral. More complexity may be necessary to provide greater protection for the
senior tranches in deals with lower quality collateral. It is our finding of greater security
default that makes the relation between higher foreclosure rates and complexity seem more
suspect.
4.2.2 Security Performance Controlling for Collateral Quality
Given that the relation between security default and complexity is stronger than the relation
between collateral default and complexity, it seems likely that collateral default can explain
little of the relation between security default and complexity. Table 7 confirms this hypoth-
esis. In Table 7, we estimate equation (1) including foreclosurerate as a control variable.
Unsurprisingly, the coefficient on foreclosurerate is always positive and highly statistically
significant. What is more notable is that controlling for the ex post collateral quality barely
changes the relation between complexityindex and security default. The marginal effect of
a one unit increase in complexity falls from 2.9 percentage points to 2.7 percentage points
in the specifications in which we do not control for collateral characteristics measured at
issuance (columns 1 through 3). The marginal effect falls from 2.2 percentage points to 2
percentage points when we use only the observations for which we can control for collateral
characteristics (columns 4 through 6). As such, the main channel through which complexity
relates to security performance is not the collateral.
5 The Pricing and Rating of Complexity
5.1 Investors
Given that complex deals perform worse ex post, it is important to see how investors price
complexity ex ante to ascertain whether they were aware that more complex securities were
more likely to perform poorly. We analyze the pricing of complexity by regressing the yield
23
spread of securities on various determinants. More specifically, let Yi be the yield of security
i at issuance in excess of one month LIBOR. Our goal is to see whether more complex
securities, as measured by our complexity variables, had higher yields.
We run the following cross-sectional regression
Yi = Complex′i,jγ1 + Controls′i,jγ2 + εi (2)
where, as before, Complexi,j is a vector of complexity variables for security i in deal j and
Controlsi,j, are control variables, observable at origination of security i, and j indexes either
the deal or the group.
Table 8 presents the results from estimating equation (2). Most of the complexity vari-
ables have negative coefficients implying that investors accepted lower returns for worse
performance. Furthermore, the coefficients are often statistically significant at the 1% level
including for our summary complexity measure. The magnitudes are small, however: a
one standard deviation in complexityindex is associated with a reduction in spreads of only
1 basis point. Overall, the results indicate that investors did not perceive more complex
securities to be of lower quality ex ante.
As expected, AAA investors accepted lower rates of return than AA, A, or BBB investors,
and AA investors were promised lower returns than A or BBB investors. Investors perceived
larger deals to be less risky as well as deals in which there was more excess spread.
We perform the same sensitivity analyses for our examination of spreads and complexity
as we did for default (see Table 5 for some examples). The results are available from the
authors upon request.
5.2 Credit Rating Agencies
It is also useful to test whether the CRAs rated securities from more complex deals to reflect
their higher likelihood of default. It is possible that the CRAs, which should have analyzed
24

all the intricate details of the deal and security structure, understood these securities would
likely perform worse and required issuers to provide more support for the senior tranches to
be rated AAA in more complex deals.
The nature of the ratings process in the ABS market is not for issuers to prepare a set
of securities and then solicit a rating. Rather, the institutional structure of the ABS market
consists of a dialogue between the issuer and the CRA prior to security issuance. In essence,
the issuer asks the CRA how it requires the issuer to structure the security for the CRA
to give it a particular rating. One main provision consists of how much of the deal can
be rated AAA. Limiting the portion of the deal rated AAA is equivalent to requiring more
subordination for each AAA security in the deal.
If the observed subordination measures are unbiased measures of required credit support,
we expect that more complex deals will have more subordination to compensate for their
higher risk. However, several recent papers have analyzed equilibria in which disclosed
ratings are systematically biased. Skreta and Veldkamp (2009) show that if issuers engage
in ratings shopping, observed ratings will be systematically biased upward as the securities
get more complex.10 If issuers shop for ratings and the deal gets structured according to the
requirements of the most favorable CRA, observed subordination levels may not be unbiased
measures of credit quality.
Even if issuers do not explicitly shop for ratings, complexity may increase ratings infla-
tion if CRAs cater to issuers to gain their business or to institutional investors’ regulatory
requirements.11 The model of Opp, Opp, and Harris (2013) predicts more ratings inflation
as the complexity of the asset increases because of catering to regulatory requirements. Even
without a regulatory requirement, complexity may increase the cost of accurately rating an
10Technically, Skreta and Veldkamp’s model predicts a non-monotonic relation between observed ratingsand security complexity. Beyond a certain level of complexity, ratings are too noisy to be valuable signalsand, as investor demand for ratings decreases, rating shopping falls. However, Skreta and Veldkamp’s modeldoes not contain a regulatory motive for ratings. Given a regulatory motive for ratings (see, e.g., Bongaerts,Cremers, and Goetzmann (2012), Stanton and Wallace (2012), or Opp, Opp, and Harris (2013)), we arelikely to be in the case where complexity increases shopping.
11See Griffin, Nickerson, and Tang (2013) for a discussion of the distinction between explicit rating shoppingand rating catering.
25

investment and decrease the likelihood that investors will discover the ratings inflation. If
CRAs compete for business, as Bolton, Freixas, and Shapiro (2012) model them, greater
complexity may indeed increase the incentive to inflate ratings. Such ratings inflation may
require CRAs to adjust their models, unlike rating shopping. Griffin and Tang (2012) find
that CRAs did, in fact, make such adjustments during the MBS boom of the 2000s. The
literature on CRAs’ incentives and biased ratings, while not the focus of this paper, is never-
theless relevant in helping us understand the connection between ratings’ accuracy and deal
complexity.
To test whether the CRAs gave less favorable ratings to more complex deals, we estimate
subordinationi = Complex′i,jγ1 + Controls′i,jγ2 + ui (3)
where Complexi,j is a vector of complexity variables for security i in deal j and Controlsi,j,
are control variables, observable at origination of security i, and j indexes either the deal or
the group. In the absence of explicit rating shopping or rating catering, we anticipate γ1 > 0
given the higher default risk of more complex deals. In estimating equation (3), we restrict
our attention to AAA securities.
Table 9 presents the results. Although the effects of complexity on subordination are
less consistent across the complexity variables than the effect of complexity on default that
we present in Table 3, the coefficients are negative and statistically significant or else sta-
tistically insignificant when we include each complexity variable individually. Our summary
complexity measure, complexityindex, is highly statistically significant. A one standard de-
viation increase in complexityindex is associated with 34 basis points less subordination. As
γ1 is negative and statistically significant, we reject the hypothesis that credit ratings are
unbiased, accurate measures of complex securities’ quality.
Increasing the number of loan groups is particularly strongly related to lower levels of
subordination. Adding one more loan group results in 50 basis points less subordination; the
26

coefficient is statistically significant at the 1% level both when we include only the number
of loan groups and when we include all our complexity measures simultaneously.
We perform several sensitivity analyses on the results from Table 9. Table 10 reports
the results from selected sensitivity analyses. In Columns 2 and 4, we report the results
when we exclude securities collateralized by conforming pools. We report these particular
specifications because the effect of complexity on subordination is especially strongly related
to the number of loan groups. The number of loan groups in turn is partly driven by the
GSEs’ demand for securities based on conforming pools. Thus, it is important to understand
whether complexity affects ratings only because it is associated with deals in which one or
both of the GSEs bought an AAA security. As Columns 2 and 4 illustrate, our results
are nearly identical when we exclude conforming pools. As Column 5 shows, the effect of
complexity on subordination continues to be statistically significant at the 10% level when
we cluster the standard errors at the deal level. Finally, in Column 6, we include securities
initially rated AA along with our AAA securities.
We also investigate whether the ratings inflation is in the senior AAAs (sometimes called
super-senior AAAs) or is confined to the junior support AAAs. We identify the senior AAAs
as follows: for each collateral group, we take the AAA security with the lowest spread to
LIBOR as the senior AAA. The precise way these securities have higher priority is likely
in the fine details of the waterfall. Roughly half of our AAAs are senior according to our
definition. When we estimate equation (3) for only the senior AAAs, the coefficient on
complexityindex indicates that a one standard deviation increase in complexity only lowered
subordination by 16 basis points and the coefficient is not statistically significant. In contrast,
when we estimate equation (3) for AAAs that are not senior, we find that a one standard
deviation increase in complexity is associated with 60 basis points less subordination and
the coefficient is significant at the 1% level. As such, the ratings inflation is primarily in the
more junior AAAs. These results are available upon request. 12
12We also estimated our default and pricing regressions with the rating categories AAA senior,AAA notsenior, AA, A, and BBB rather than AAA, AA, A, and BBB as in our benchmark specification. All
27

Overall, the results demonstrate that in more complex deals, the CRAs gave AAA ratings
to securities with less credit support. This finding is consistent with explicit rating shopping
and rating catering. Without the details of the CRAs’ rating models, we cannot distinguish
between shopping and catering, nor can we decisively eliminate the possibility that the CRAs
were confused by the more complex deals. Nevertheless, the CRAs clearly exacerbated the
problems with complexity.
Although we find that complexity leads to more generous ratings, ratings inflation does
not explain the default results we find in Section 4. In all of our default specifications, we
control for both the level of subordination and the rating of the security. If we omit the level
of subordination from the default regressions, the effect of complexity on default is even
larger because it captures both the direct effect of complexity on default and the indirect
level of complexity on subordination.
The results in Tables 9 and 10 also indicate that larger deals and deals from larger
underwriters were treated more generously by CRAs. Our finding that larger underwriters
received more inflated ratings is consistent with the findings of He, Qian, and Strahan (2012)
regarding issuers.
6 Complexity in the MBS Market and Security Design
We have shown that more complex securities perform worse and that investors did not price
more complex securities in a manner consistent with their perceiving them to be riskier.
Furthermore, we have not found evidence that the CRAs understood that more complex
securities were riskier. From the perspective of investors, complexity thus appears to be
confusing rather than welfare-enhancing.
Can we reconcile our results with theories of security design? In this section, we consider
how well different theories of security design explain the level of complexity we observe in
of our results for default and spreads are qualitatively the same when we use these finer rating categories.The magnitude of the relation between complexity and default is slightly larger when we use AAA senior,AAA notsenior, AA, A, and BBB as the rating categories.
28

the MBS market and the facts about complexity that we have documented. We evaluate
the consistency of our results with two classic theories, “tailoring theory” and “information
sensitivity theory”.
Allen and Gale’s (1988) seminal theory of complexity, which we term tailoring theory,
posits that complexity arises to complete the market in the Arrow-Debreu sense. In tailoring
theory, an issuer (a trust in our case) should offer many different types of securities collat-
eralized by the same assets (a pool of mortgages in our case) that satisfy different investor
appetites. In so doing, investors maximize the revenue the issuer receives from the sale of
the securities because each security is held by the investor that values it most.13
The tailoring theory of complexity is consistent with the existence of loan groups struc-
tured specifically to satisfy the GSEs’ demand (see Adelino, Frame, and Gerardi (2014)).
However, for the tailoring theory to explain the substantial complexity that we document,
the different loan groups within deals would have to be dissimilar to one another. That
is, the collateral must be customized within a deal to satisfy particular clients’ requests for
specific types of collateral resulting in substantively dissimilar loan groups within a deal.
If the loan groups are quite similar to one another, spanning different states of the world
cannot be the main reason for the different loan groups since investors within a deal are
buying assets backed by effectively the same collateral.
If groups within a deal are designed to cater to different risk appetites or preferences for
particular types of collateral, then the loan characteristics across groups within the same
deal must be different. To understand how different the loan characteristics are, we compare
them to the loan characteristics across deals. In the absence of tailoring, we expect the two
measures to be roughly equal. We compute the mean absolute deviation (MAD) of several
loan characteristics between groups within a deal and across deals. That is, for each loan
13Allen and Gale (1991) extend their completing the market argument to a market model with short sales.In general, investors cannot short ABS. Since 2006, investors can short indices of ABS via the ABX. However,in their analysis of the ABX, Stanton and Wallace (2011) find that it poorly reflects the performance of theassets underlying it prior to 2011.
29

characteristic c, we compute
DiffIntrac =1
N
N∑k=1
∣∣∣∣∣∣Charck,j − 1
Nj
Nj∑n=1
Charck,j
∣∣∣∣∣∣and
DiffInterc =1
N
N∑k=1
∣∣∣∣∣Charck,j − 1
NT
NT∑l=1
Charcl,j
∣∣∣∣∣where N is the total number of loan groups in our data, NT is the total number of loan
groups in year T, and Nj is the total number of loan groups in deal j. If the division into
loan groups is because of tailoring, we expect DiffIntrac > DiffInterc.
Table 11 compares the differences between loan groups within deals and the differences
between loan groups across deals. We see that there is much more variation in loan char-
acteristics across deals than within them. The largest amount of variation in loan group
characteristics within deals is in the original principal balances. The intra-deal differences in
principal balances are likely due to the influence of the GSEs and, even along this dimension,
there is greater variation across deals than within deals. Thus, tailoring cannot explain a
substantial portion of the complexity creating by subdividing the loan pool into separate
loan groups.14
Another strand of the literature, pioneered by Gorton and Pennacchi (1990) and Boot and
Thakor (1993), posits that the multiple securities we observe can be explained by the need for
some securities to be informationally insensitive or at least less informationally sensitive. In
14Furthermore, the Allen and Gale theory of complexity is somewhat difficult to apply to the RMBS mar-ket since, unlike a corporation, the underlying assets in a trust that issues mortgage-backed securities areinherently more divisible than a corporation. Should an RMBS consist of 1000 loans or 5000 loans? Somepooling of loans can be explained by diversification benefits (DeMarzo, 2005) and the desire to overcomeadverse selection created by the originator of the loans (not necessarily of the securities) having more infor-mation than investors (Riddiough (1997) and DeMarzo (2005)). Without additional theory, however, it isdifficult to understand why so many securities are issued within one deal rather than issued from separatedeals. It is possible that there is some high fixed cost of issuing a deal such that it is advantageous toissue very large deals with more securities and loan groups rather than put the different loan groups intoseparate deals. Certainly, it seems likely that there are costs to establishing a trust (e.g., legal fees) that arenot present with subdividing loans within a deal. However, it is unclear what puts an upper bound on thenumber of loans within a pool if the fixed costs are very high.
30

Gorton and Pennacchi, the exploitation of uninformed traders by informed traders creates a
need for some securities to be less informationally sensitive. By creating less informationally
sensitive securities, the issuer expands the potential market for its securities to those investors
that are either unable or unwilling to acquire information about the quality of the assets. In
Boot and Thakor, an issuer divides its cash flows into multiple claims with some securities
(i.e., equity) being more information-sensitive than others; the creation of multiple securities
from a single asset arises to incentivize information acquisition.
Consistent with the theory of information sensitivity, ABS deals include both informa-
tionally sensitive securities (i.e., securities with ratings below AAA) and less informationally
less sensitive securities (i.e., securities with AAA ratings). Unfortunately, the information
sensitivity model does not provide a prediction as to how many different securities an asset
should collateralize, only that there should be differences in the information sensitivity of
the securities that are issued. What is difficult to understand is why it is necessary to have
so many different informationally sensitive and informationally insensitive securities within
the same deal. The average deal has 16 securities.
Two other aspects of complexity cannot be explained by either the tailoring theory or
the information acquisition theory of security design. First, neither theory can explain why
securities from more complex deals default more. Furthermore, neither theory predicts that
securities from more complex deals should receive more inflated ratings.
In summary, several facts we uncover about complexity are difficult to reconcile with
traditional theories of security design including those that allow explicitly for informational
asymmetry between the issuer of a security and investors. Our results suggest that issuers
may have an informational advantage over investors in this market and that they use com-
plexity to exploit this informational advantage. The most closely related work is in industrial
organization models wherein firms can obfuscate prices to retain clients (see Ellison and El-
lison (2009), Carlin (2009), and Ellison and Wolitzky (2012)). Carlin and Manso (2011)
embed such strategic obfuscation into a model of mutual funds.
31

7 Conclusion
In this paper, we propose measures of complexity for securitized assets. We apply our
measures to the ABS market and document an increase in complexity in the 2000s. We then
show that more complexity is robustly associated with a higher likelihood of default and
that the increase in the risk of default associated with complexity is greatest for securities
designed to be informationally insensitive. Lower ex post quality collateral is associated with
greater complexity but securities from more complex deals default more even after controlling
for the realized collateral quality. Ex ante pricing indicates that investors did not think more
complex securities would default more although several aspects of MBS risk beyond credit
ratings were priced. The CRAs rated more complex deals more liberally indicating that they
failed to distill the complexity of these deals into the rating. Our results are consistent with
the market for PLMBS being subject to strategic obfuscation during the subprime boom.
References
Adelino, Manuel, 2009. Do Investors Rely Only on Ratings? The Case of Mortgage-Backed
Securities. Manuscript, Duke University.
Adelino, Manuel, W. Scott Frame, and Kristopher S. Gerardi, 2014. The Effect of Large
Investors on Asset Quality: Evidence from Subprime Mortgage Securities. Manuscript, Fed-
eral Reserve Bank of Atlanta.
Allen, Franklin, and Douglas Gale, 1988. Optimal Security Design. Review of Financial
Studies, 1:3, 229-63.
Allen, Franklin and Douglas Gale, 1991. Arbitrage, Short Sales, and Financial Innova-
tion. Econometrica, 59:4, 1041-68.
32

Ashcraft, Adam, Paul Goldsmith-Pinkham, Peter Hull, and James Vickery, 2011. Credit
Ratings and Security Prices in the Subprime MBS Market. American Economic Review:
Papers and Proceedings, 101:3, 115-9.
Atanasov, Vladimir and John J. Merrick Jr., 2013. The Effects of Market Frictions on
Asset Prices: Evidence from Agency MBS. Manuscript, College of William and Mary.
Barber, Brad M. and Terrance Odean, 2008. All That Glitters: The Effect of Attention
and News on the Buying Behavior of Individual and Institutional Investors. Review of Fi-
nancial Studies, 21:2, 785-818.
Barberis, Nicholas and Richard Thaler, 2003. A Survey of Behavioral Finance. Ch. 18
in Handbook of the Economics of Finance, Vol. 1 Part B, George M. Constantinides, Milton
Harris, and Rene M. Stulz, eds. Elsevier.
Begley, Taylor and Amiyatosh Purnanandam, 2012. Design of Financial Securities: Em-
pirical Evidence from Private-label RMBS Deals. Manuscript, University of Michigan (Ann
Arbor).
Bessembinder, Hendrik, William Maxwell, and Kumar Venkataraman, 2013. Introducing
Daylight to Structured Credit Products. Financial Analysts Journal, 69:6, 55-67.
Bhattacharya, Utpal, Philip J. Reny, and Matthew Spiegel, 1995. Destructive Interfer-
ence in an Imperfectly Competitive Multi-Security Market. Journal of Economic Theory,
65, 136-70.
33
Bolton, Patrick, Xavier Freixas, and Joel Shapiro, 2012. The Credit Ratings Game.
Journal of Finance, 67:1, 85-111.
Bongaerts, Dion, K.J. Martijn Cremers, and William N. Goetzmann, 2012. Tiebreaker:
Certification and Multiple Credit Ratings. Journal of Finance, 67:1, 113-52,
Boot, Arnoud W.A. and Anjan V. Thakor, 1993. Security Design. Journal of Finance,
48:4, 1349-78.
Carlin, Bruce Ian, 2009. Strategic Price Complexity in Retail Financial Markets. Journal
of Financial Economics, 91, 278-87.
Carlin, Bruce Ian, Shimon Kogan, and Richard Lowery, 2013. Trading Complex Assets.
Journal of Finance, 68:5, 1937-60.
Carlin, Bruce Ian and Gustavo Manso, 2011. Obfuscation, Learning, and the Evolution
of Investor Sophistication. Review of Financial Studies, 24:3, 754-85.
Celerier, Claire and Boris Vallee, 2013. What Drives Complexity? A Look into the Retail
Market for Structured Products. Manuscript, University of Zurich.
Cheng, Ing-Haw, Sahil Raina, and Wei Xiong, forthcoming. Wall Street and the Housing
Bubble. American Economic Review.
Cohen, Lauren and Andrea Frazzini, 2008. Economic Links and Predictable Returns.
Journal of Finance. 63:4, 1977-2011.
34

Cohen, Lauren and Dong Lou, 2012. Complicated Firms. Journal of Financial Eco-
nomics, 104, 383-400.
Coval, Joshua D., Jakub W. Jurek, and Erik Stafford, 2009. Economic Catastrophe
Bonds. American Economic Review, 99:3, 628-66.
DellaVigna, Stefano and Joshua M. Pollet, 2007. Demographics and Industry Returns.
American Economic Review, 97:5, 1667-1702.
DellaVigna, Stefano and Joshua M. Pollet, 2009. Investor Inattention and Friday Earn-
ings Announcements. Journal of Finance, 64:2, 709-49.
DeMarzo, Peter M., 2005. The Pooling and Tranching of Securities: A Model of Informed
Intermediation. Review of Financial Studies, 18:1, 1-35.
Demiroglu, Cem and Christopher James, 2012. How Important is Having Skin in the
Game? Originator-Sponsor Affiliation and Losses on Mortgage-backed Securities. Review of
Financial Studies, 25:11, 3217-58.
Ellison, Glenn and Sara Fisher Ellison, 2009. Search, Obfuscation, and Price Elasticities
on the Internet. Econometrica, 77:2, 427-52.
Ellison, Glenn and Alexander Wolitzky, 2012. A Search Cost Model of Obfuscation.
RAND Journal of Economics, 43:3, 417-41.
Foote, Christopher L., Kristopher S. Gerardi, and Paul S. Willen, 2012. Why Did So
Many People Make So Many Ex Post Bad Decisions? The Causes of the Foreclosure Crisis.
35

Federal Reserve Bank of Boston Working Paper No. 12-2.
Furfine, Craig, 2014. Complexity as a Means to Distract: Evidence from the Securitiza-
tion of Commercial Mortgages. Review of Corporate Finance Studies, 2:2, 154-87.
Gale, Douglas, 1992. Standard Securities. Review of Economic Studies, 59:4, 731-55.
Gennaioli, Nicola, Andrei Shleifer, and Robert Vishny, 2012. Neglected Risks, Financial
Innovation, and Financial Fragility. Journal of Financial Economics, 104, 452-68.
Ghent, Andra C., Ruben Hernandez-Murillo, and Michael T. Owyang, 2013. Did Afford-
able Housing Legislation Contribute to the Subprime Securities Boom? Manuscript, Arizona
State University.
Gorton, Gary and George Pennacchi, 1990. Financial Intermediaries and Liquidity Cre-
ation. Journal of Finance, 45:1, 49-71.
Gorton, Gary and Andrew Metrick, 2012. Securitized Banking and the Run on Repo.
Journal of Financial Economics, 104, 425-51.
Gorton, Gary and Andrew Metrick, 2013. Securitization. Handbook of the Economics
of Finance, Volume 2, Chapter 1, Ed. Constantinides, G., Harris, M., and Stulz, R., Elsevier.
Griffin, John M., Richard Lowery, and Alessio Saretto, 2013. Complex Securities and Un-
derwriter Reputation: Do Reputable Underwriters Produce Better Securities? Manuscript,
University of Texas (Austin).
36

Griffin, John M., and Gonzalo Maturana, forthcoming. Who Facilitated Misreporting in
Securitized Loans? Journal of Finance.
Griffin, John M., Jordan Nickerson, and Dragon Yongjun Tang, 2013. Rating Shopping
or Catering? An Examination of the Response to Competitive Pressure for CDO Credit
Ratings. Review of Financial Studies, 26:9, 2270-310.
Griffin, John M. and Dragon Hongjun Tang, 2012. Did Subjectivity Play a Role in CDO
Credit Ratings? Journal of Finance, 67:4, 1293-1328.
Hanson, Samuel G. and Adi Sunderam, 2013. Are there too Many Safe Securities? Se-
curitization and the Incentives for Information Production. Journal of Financial Economics,
108, 565-84.
He, Jie (Jack), Jun ‘QJ’ Qian, and Philip E. Strahan, 2012. Are All Ratings Created
Equal? The Impact of Issuer Size on the Pricing of Mortgage-Backed Securities. Journal of
Finance, 47:6, 2097-137.
Hirshleifer, David and Siew Hong Teoh, 2003. Limited Attention, Information Disclosure,
and Financial Reporting. Journal of Accounting and Economics, 36, 337-86.
Hirshleifer, David, Sonya S. Lim, and Siew Hong Teoh, 2009. Driven to Distraction:
Extraneous Events and Underreaction to Earnings News. Journal of Finance, 64, 2289-2325.
Hollifield, Burton, Artem Neklyudov, and Chester Spatt, 2013. Bid-Ask Spreads and the
Pricing of Securitizations: 144a vs. Registered Securitizations. Manuscript, Carnegie Mellon
University.
37

Hong, Harrison and Jeremy C. Stein, 1999. A Unified Theory of Underreaction, Momen-
tum Trading, and Overreaction in Asset Markets. Journal of Finance, 54:6, 2143-84.
Hong, Harrison, Walter Torous, and Rossen Valkanov, 2007. Do Industries Lead Stock
Markets? Journal of Financial Economics, 83, 367-96.
Hou, Kewei, 2007. Industry Information Diffusion and the Lead-lag Effect in Stock Re-
turns. Review of Financial Studies, 20:4, 1113-1138.
Horwitz, Jeff, 2011. A Servicer’s Alleged Conflict Raises Doubts About ’Skin in the
Game’ Reforms. American Banker, Feb. 24.
Huberman, Gur and Tomer Regev, 2001. Contagious Speculation and a Cure for Cancer:
A Nonevent that Made Stock Prices Soar. Journal of Finance, 55:1, 387-96.
Jacobs, David P., James M. Manzi, and Frank J. Fabozzi, 2006. The Impact of Struc-
turing on CMBS Bond Class Performance. Ch. 50 in The Handbook of Mortgage-Backed
Securities, 6th ed., Frank J. Fabozzi, ed. New York: McGraw-Hill.
Loughran, Tim and Bill McDonald, forthcoming. Measuring Readability in Financial
Disclosures. Journal of Finance.
Lucas, Douglas J., Laurie S. Goodman, Frank J. Fabozzi, and Rebecca J. Manning, 2007.
Development in Collateralized Debt Obligations: New Products and Insights. Hoboken, NJ:
John Wiley & Sons.
38

Menzly, Lior and Oguzhan Ozbas, 2010. Market Segmentation and Cross-Predictability
of Returns. Journal of Finance, 65:4, 1555-80.
Merton, Robert C., 1987. A Simple Model of Capital Market Equilibrium with Incom-
plete Information. Journal of Finance, 42:3, 483-510.
Opp, Christian C., Marcus M. Opp, and Milton Harris, 2013. Rating Agencies in the
Face of Regulation. Journal of Financial Economics, 108, 46-61.
Piskorski, Tomasz, Amit Seru, and James Witkin, 2013. Asset Quality Misrepresentation
by Financial Intermediaries: Evidence from RMBS Market. Manuscript, Columbia Univer-
sity.
Rahi, Rohit, 1996. Adverse Selection and Security Design. Review of Economic Studies,
63:2, 287-300.
Riddiough, Timothy J., 1997. Optimal Security Design and Governance of Asset-Backed
Securities. Journal of Financial Intermediation, 6, 121-52.
Riddiough, Timothy J. and Howard E. Thompson, 2011. Deja Vu All Over Again:
Agency, Uncertainty, Leverage and the Panic of 1857. Manuscript, University of Wisconsin
(Madison).
Sims, Christopher A., 2003. Implications of Rational Inattention. Journal of Monetary
Economics, 50, 665-90.
Skreta, Vasiliki and Laura Veldkamp, 2009. Ratings Shopping and Asset Complexity: A
39
Theory of Ratings Inflation. Journal of Monetary Economics, 56, 678-95.
Stanton, Richard and Nancy Wallace, 2011. The Bear’s Lair: Index Credit Default Swaps
and the Subprime Mortgage Crisis. Review of Financial Studies, 24:10, 3250-80.
Stanton, Richard and Nancy Wallace, 2012. CMBS Subordination, Ratings Inflation,
and Regulatory-Capital Arbitrage. Manuscript, University of California (Berkeley).
Whitworth, Shane and Erin K. Walsh, 2006. Home Equity ABS Trigger Report. Manuscript,
Wachovia Securities.
40

Figure 1: US Private-Label Home Equity ABS Issuance by Year, 1999-2007
02
00
40
06
00
Issu
an
ce
Vo
lum
e (
B$
)
1998 2000 2002 2004 2006 2008Year
Includes all deals with detailed data available via Bloomberg terminals.
41

Figure 2: Means of Deal Size and Complexity Variables by Year, 1999-2007
0200
400
600
800
1,0
00
1999 2000 2001 2002 2003 2004 2005 2006 2007
(a) Deal Size ($M)
0.5
11.5
22.5
1999 2000 2001 2002 2003 2004 2005 2006 2007
(b) No. of Loan Groups
05
10
15
20
1999 2000 2001 2002 2003 2004 2005 2006 2007
(c) No. of Securities
050
100
150
200
1999 2000 2001 2002 2003 2004 2005 2006 2007
(d) No. of Pages in Prospectus Supplement
010
20
30
40
1999 2000 2001 2002 2003 2004 2005 2006 2007
(e) No. of Pages Describing Collateral
010
20
30
1999 2000 2001 2002 2003 2004 2005 2006 2007
(f) No. of Pages Describing Waterfall
−.5
0.5
11.5
2
1999 2000 2001 2002 2003 2004 2005 2006 2007
(g) Complexity Index
42
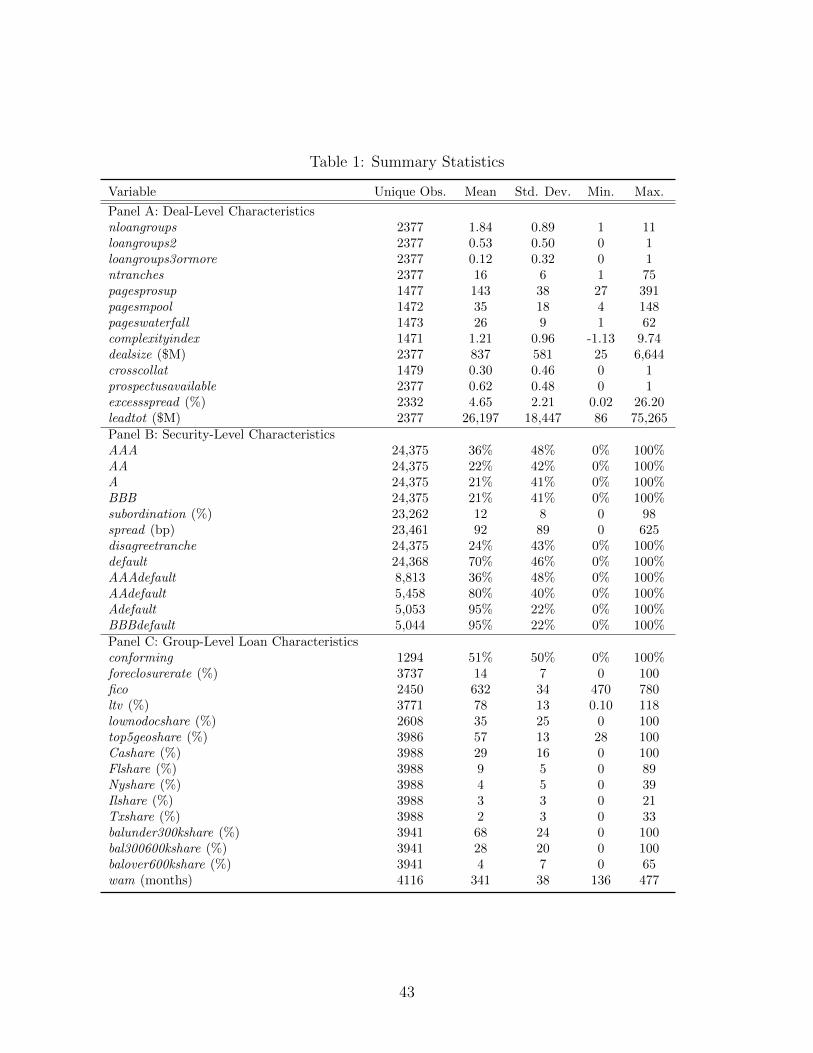
Table 1: Summary Statistics
Variable Unique Obs. Mean Std. Dev. Min. Max.
Panel A: Deal-Level Characteristicsnloangroups 2377 1.84 0.89 1 11loangroups2 2377 0.53 0.50 0 1loangroups3ormore 2377 0.12 0.32 0 1ntranches 2377 16 6 1 75pagesprosup 1477 143 38 27 391pagesmpool 1472 35 18 4 148pageswaterfall 1473 26 9 1 62complexityindex 1471 1.21 0.96 -1.13 9.74dealsize ($M) 2377 837 581 25 6,644crosscollat 1479 0.30 0.46 0 1prospectusavailable 2377 0.62 0.48 0 1excessspread (%) 2332 4.65 2.21 0.02 26.20leadtot ($M) 2377 26,197 18,447 86 75,265Panel B: Security-Level CharacteristicsAAA 24,375 36% 48% 0% 100%AA 24,375 22% 42% 0% 100%A 24,375 21% 41% 0% 100%BBB 24,375 21% 41% 0% 100%subordination (%) 23,262 12 8 0 98spread (bp) 23,461 92 89 0 625disagreetranche 24,375 24% 43% 0% 100%default 24,368 70% 46% 0% 100%AAAdefault 8,813 36% 48% 0% 100%AAdefault 5,458 80% 40% 0% 100%Adefault 5,053 95% 22% 0% 100%BBBdefault 5,044 95% 22% 0% 100%Panel C: Group-Level Loan Characteristicsconforming 1294 51% 50% 0% 100%foreclosurerate (%) 3737 14 7 0 100fico 2450 632 34 470 780ltv (%) 3771 78 13 0.10 118lownodocshare (%) 2608 35 25 0 100top5geoshare (%) 3986 57 13 28 100Cashare (%) 3988 29 16 0 100Flshare (%) 3988 9 5 0 89Nyshare (%) 3988 4 5 0 39Ilshare (%) 3988 3 3 0 21Txshare (%) 3988 2 3 0 33balunder300kshare (%) 3941 68 24 0 100bal300600kshare (%) 3941 28 20 0 100balover600kshare (%) 3941 4 7 0 65wam (months) 4116 341 38 136 477
43

Notes: 1) The variable definitions are as follows. nloangroups is the number of loan groups in the deal;
nloangroups2 equals 1 if the number of loan groups is exactly 2, 0 otherwise; nloangroups3ormore equals 1
if the number of loan groups is 3 or more, 0 otherwise; ntranches is the number of securities in the deal;
pagesprosup is the number of pages in the prospectus supplement; pagesmpool is the number of pages in
the prospectus supplement describing the collateral; pageswaterfall is the number of pages in the prospectus
supplement describing the allocation of payments from collateral to the securities; complexityindex is the
normalized first principal component of nloangroups, ntranches, pagesprosup, pagesmpool, and pageswaterfall ;
crosscollat is a dummy variable that takes a value of 1 if the deal provides for some cross-collateralization
across loan groups; prospectusavail is a dummy variable indicating whether Bloomberg has a prospectus
supplement for the deal; excessspread is the excess coupon the collateral pays relative to what is owed on
the securities; leadtot is the volume of ABS deals in that year by the lead manager; subordination is the %
subordination the security has; spread is the coupon the security pays above one month LIBOR measured in
basis points; disagreetranche takes a value of 1 if the ratings agencies disagree on the rating of that security;
default equals 1 if the security has realized a principal loss or the ratings agencies have lowered their rating
to that of a defaulted security; AAAdefault, AAdefault, Adefault, and BBBdefault summarize the default
variable only for securities in that rating category; conforming takes a value of 1 if the description of the
collateral group specifically refers to the loan group being conforming and takes a value of 0 if the description
of the collateral group specifically states that the loan group is non-conforming; fico is the average FICO score
of the loans at origination; ltv is the average loan-to-value (LTV) of the loans at origination; lownodocshare
is the fraction of loans that are No or Low documentation; top5geoshare is the fraction of loans that are in
the 5 most common states for that pool; Cashare, Flshare, Nyshare, Ilshare, and Txshare is the sum of the
share of loans from the most common 5 states in that deal that are in California, Florida, New York, Illinois,
and Texas, respectively; balunder300kshare is the fraction of loans with original principal balances of under
$300,000; bal300600kshare is the fraction of loans with original principal balances of $300,000 to $600,000;
balover600kshare is the fraction of loans with original principal balances of $600,000; wam is the original
weighted average maturity of the loans in months. 2) The sample is all USD-denominated private-label ABS
deals backed by US collateral issued 1999-2007 for which detailed information is available via Bloomberg.
44

Table 2: Correlations Between Complexity Variables
dealsize nloangroups ntranches pagesprosup pagesmpool pageswaterfall
dealsize 100%nloangroups 34% 100%
ntranches 33% 52% 100%pagesprosup 28% 40% 46% 100%pagesmpool 34% 47% 30% 73% 100%
pageswaterfall 19% 28% 38% 39% 23% 100%
Notes: 1) nloangroups is the number of loan groups in the deal, ntranches is the number of securities in
the deal, pagesprosup is the number of pages in the prospectus supplement, pagesmpool is the number of
pages in the prospectus supplement describing the collateral, and pageswaterfall is the number of pages in
the prospectus supplement describing the allocation of payments from collateral to the securities.
45
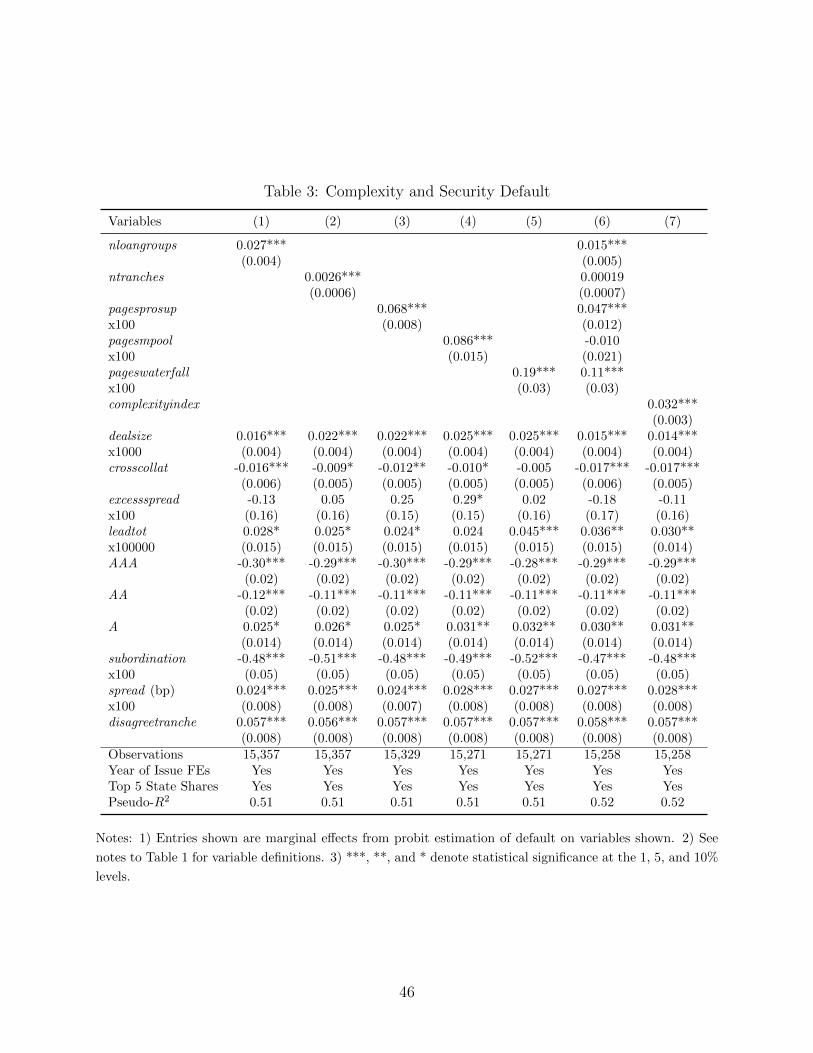
Table 3: Complexity and Security Default
Variables (1) (2) (3) (4) (5) (6) (7)
nloangroups 0.027*** 0.015***(0.004) (0.005)
ntranches 0.0026*** 0.00019(0.0006) (0.0007)
pagesprosup 0.068*** 0.047***x100 (0.008) (0.012)pagesmpool 0.086*** -0.010x100 (0.015) (0.021)pageswaterfall 0.19*** 0.11***x100 (0.03) (0.03)complexityindex 0.032***
(0.003)dealsize 0.016*** 0.022*** 0.022*** 0.025*** 0.025*** 0.015*** 0.014***x1000 (0.004) (0.004) (0.004) (0.004) (0.004) (0.004) (0.004)crosscollat -0.016*** -0.009* -0.012** -0.010* -0.005 -0.017*** -0.017***
(0.006) (0.005) (0.005) (0.005) (0.005) (0.006) (0.005)excessspread -0.13 0.05 0.25 0.29* 0.02 -0.18 -0.11x100 (0.16) (0.16) (0.15) (0.15) (0.16) (0.17) (0.16)leadtot 0.028* 0.025* 0.024* 0.024 0.045*** 0.036** 0.030**x100000 (0.015) (0.015) (0.015) (0.015) (0.015) (0.015) (0.014)AAA -0.30*** -0.29*** -0.30*** -0.29*** -0.28*** -0.29*** -0.29***
(0.02) (0.02) (0.02) (0.02) (0.02) (0.02) (0.02)AA -0.12*** -0.11*** -0.11*** -0.11*** -0.11*** -0.11*** -0.11***
(0.02) (0.02) (0.02) (0.02) (0.02) (0.02) (0.02)A 0.025* 0.026* 0.025* 0.031** 0.032** 0.030** 0.031**
(0.014) (0.014) (0.014) (0.014) (0.014) (0.014) (0.014)subordination -0.48*** -0.51*** -0.48*** -0.49*** -0.52*** -0.47*** -0.48***x100 (0.05) (0.05) (0.05) (0.05) (0.05) (0.05) (0.05)spread (bp) 0.024*** 0.025*** 0.024*** 0.028*** 0.027*** 0.027*** 0.028***x100 (0.008) (0.008) (0.007) (0.008) (0.008) (0.008) (0.008)disagreetranche 0.057*** 0.056*** 0.057*** 0.057*** 0.057*** 0.058*** 0.057***
(0.008) (0.008) (0.008) (0.008) (0.008) (0.008) (0.008)Observations 15,357 15,357 15,329 15,271 15,271 15,258 15,258Year of Issue FEs Yes Yes Yes Yes Yes Yes YesTop 5 State Shares Yes Yes Yes Yes Yes Yes YesPseudo-R2 0.51 0.51 0.51 0.51 0.51 0.52 0.52
Notes: 1) Entries shown are marginal effects from probit estimation of default on variables shown. 2) See
notes to Table 1 for variable definitions. 3) ***, **, and * denote statistical significance at the 1, 5, and 10%
levels.
46

Table 4: Complexity and Security Default: AAA Securities Only
Variables (1) (2) (3) (4) (5) (6) (7)
nloangroups 0.059*** 0.037***(0.0078) (0.0099)
ntranches 0.0037*** -0.0013(0.0013) (0.0015)
pagesprosup 0.13*** 0.06**x100 (0.02) (0.03)pagesmpool 0.23*** 0.07x100 (0.03) (0.05)pageswaterfall 0.34*** 0.21***x100 (0.06) (0.06)complexityindex 0.068***
(0.007)dealsize 0.028*** 0.045*** 0.037*** 0.039*** 0.045*** 0.024** 0.022**x1000 (0.009) (0.009) (0.009) (0.009) (0.009) (0.010) (0.010)crosscollat -0.042*** -0.023* -0.034*** -0.034*** -0.015 -0.043*** -0.045***
(0.012) (0.012) (0.012) (0.012) (0.012) (0.013) (0.012)excessspread 0.83** 1.50*** 1.80*** 2.00*** 1.40*** 1.00** 0.91**x100 (0.37) (0.38) (0.34) (0.35) (0.35) (0.40) (0.36)leadtot 0.100*** 0.094*** 0.094*** 0.096*** 0.140*** 0.120*** 0.110***x100000 (0.032) (0.032) (0.032) (0.032) (0.032) (0.032) (0.032)subordination -0.68*** -0.76*** -0.71*** -0.72*** -0.76*** -0.68*** -0.70***x100 (0.10) (0.10) (0.10) (0.10) (0.10) (0.10) (0.10)spread (bp) 0.58*** 0.59*** 0.59*** 0.60*** 0.58*** 0.59*** 0.60***x100 (0.04) (0.04) (0.04) (0.04) (0.04) (0.04) (0.04)disagreetranche 0.047 0.041 0.046 0.038 0.039 0.042 0.036
(0.041) (0.041) (0.041) (0.041) (0.041) (0.041) (0.041)Observations 5,194 5,194 5,183 5,158 5,158 5,153 5,153Year of Issue FEs Yes Yes Yes Yes Yes Yes YesTop 5 State Shares Yes Yes Yes Yes Yes Yes YesPseudo-R2 0.38 0.37 0.38 0.37 0.37 0.38 0.38
Notes: 1) Entries shown are marginal effects from probit estimation of default on variables shown. 2) See
notes to Table 1 for variable definitions. 3) ***, **, and * denote statistical significance at the 1, 5, and 10%
levels.
47

Table 5: Complexity and Security Default: Sensitivity Analysis
Variable (1) (2) (3) (4) (5) (6) (7)
complexityindex 0.032*** 0.068*** 0.013*** 0.032*** 0.023*** 0.031*** 0.021***(0.003) (0.007) (0.003) (0.005) (0.005) (0.003) (0.006)
dealsize 0.014*** 0.022** 0.015*** 0.014** 0.011 0.014*** 0.011x1000 (0.004) (0.010) (0.004) (0.006) (0.007) (0.004) (0.008)crosscollat -0.017*** -0.045*** -0.0068 -0.017** -0.007 -0.015*** -0.0061
(0.005) (0.012) (0.005) (0.007) (0.008) (0.006) (0.009)excessspread -0.11 0.91** -0.50*** -0.11 0.36 -0.09 0.37x100 (0.16) (0.36) (0.15) (0.27) (0.23) (0.16) (0.34)leadtot 0.030** 0.110*** -0.008 0.030 -0.008 0.035** -0.005x100000 (0.014) (0.032) (0.015) (0.020) (0.019) (0.015) (0.025)AAA -0.29*** -0.29*** -0.19*** -0.29*** -0.19***
(0.02) (0.02) (0.03) (0.02) (0.03)AA -0.11*** -0.11*** -0.11*** -0.06** -0.11*** -0.06**
(0.016) (0.01) (0.02) (0.02) (0.02) (0.03)A 0.031** -0.006 0.031** 0.074*** 0.029** 0.071***
(0.014) (0.010) (0.015) (0.020) (0.014) (0.021)subordination -0.48*** -0.70*** -0.41*** -0.48*** -0.52*** -0.47*** -0.49***x100 (0.05) (0.10) (0.05) (0.08) (0.06) (0.05) (0.10)spread (bp) 0.028*** 0.600*** -0.007 0.028*** 0.045*** 0.026*** 0.043***x100 (0.008) (0.044) (0.005) (0.010) (0.011) (0.007) (0.015)disagreetranche 0.057*** 0.036 0.035*** 0.057*** 0.050*** 0.055*** 0.048***
(0.0075) (0.041) (0.0052) (0.010) (0.010) (0.0074) (0.013)Observations 15,258 5,153 10,105 15,258 8,165 14,596 7,793Year of Issue FEs Yes Yes Yes Yes Yes Yes YesTop 5 State Shares Yes Yes Yes Yes Yes Yes YesIncludes Conforming Pools Yes Yes Yes Yes Yes No NoCollateral Characteristics No No No No Yes No YesStd. Errors Clustered by Deal No No No Yes No No YesAAA Only No Yes No No No No NoPseudo-R2 0.52 0.38 0.37 0.52 0.48 0.51 0.48
Notes: 1) Entries shown are marginal effects from probit estimation of default on variables shown. 2) See
notes to Table 1 for variable definitions. 3) ***, **, and * denote statistical significance at the 1, 5, and
10% levels. 4) Collateral Characteristics are ltv, fico, lownodocshare, balunder300kshare, bal300600kshare,
and wam. 5) In the specifications in Columns 6 and 7, we exclude securities collateralized primarily by loan
groups indicated as conforming in the loan group description from Bloomberg.
48

Table 6: Complexity and Collateral Default
Variables (1) (2) (3) (4) (5) (6) (7)
nloangroups 0.09 -0.37**(0.14) (0.19)
ntranches 0.037 0.053*(0.025) (0.031)
pagesprosup 0.0078* -0.0120*(0.0045) (0.0070)
pagesmpool 0.031*** 0.052***(0.009) (0.014)
pageswaterfall 0.053*** 0.052***(0.016) (0.016)
complexityindex 0.44***(0.16)
dealsize 0.095 0.051 -0.010 -0.210 0.034 -0.250 -0.13x1000 (0.290) (0.290) (0.300) (0.300) (0.290) (0.310) (0.300)crosscollat 0.49 0.47 0.47 0.38 0.66** 0.58* 0.39
(0.34) (0.33) (0.33) (0.33) (0.33) (0.34) (0.33)excessspread 0.28*** 0.24*** 0.28*** 0.30*** 0.18** 0.22** 0.20**
(0.09) (0.09) (0.08) (0.08) (0.09) (0.10) (0.09)leadtot -0.30*** -0.30*** -0.31*** -0.32*** -0.25*** -0.28*** -0.30***(x10000) (0.10) (0.10) (0.10) (0.10) (0.10) (0.10) (0.10)Constant 26.9*** 27.9*** 27.5*** 27.2*** 27.1*** 28.1*** 29.3***
(6.2) (6.2) (6.2) (6.1) (6.1) (6.2) (6.2)Observations 1,271 1,271 1,271 1,264 1,265 1,262 1,262R2 0.496 0.497 0.497 0.503 0.501 0.510 0.501Year of Issue FEs Yes Yes Yes Yes Yes Yes YesTop 5 State Shares Yes Yes Yes Yes Yes Yes YesCollateral Characteristics Yes Yes Yes Yes Yes Yes Yes
Notes: 1) Entries shown are coefficients from a regression of the foreclosure rate on the loan group, in
percent, on the variables shown. 2) See notes to Table 1 for variable definitions. 3) ***, **, and * denote
statistical significance at the 1, 5, and 10% levels. 4) Collateral Characteristics are ltv, fico, lownodocshare,
balunder300kshare, bal300600kshare, and wam.
49

Table 7: Complexity and Security Default after Controlling for Collateral Default
Variable (1) (2) (3) (4) (5) (6)
complexityindex 0.029*** 0.027*** 0.027*** 0.022*** 0.020*** 0.020***(0.004) (0.004) (0.005) (0.005) (0.005) (0.006)
foreclosurerate 0.0021*** 0.0021*** 0.0028*** 0.0028***(0.0005) (0.0007) (0.0006) (0.0008)
dealsize 0.020*** 0.020*** 0.020*** 0.013* 0.014** 0.014(x1000) (0.004) (0.004) (0.006) (0.007) (0.007) (0.009)crosscollat -0.016*** -0.018*** -0.018** -0.0071 -0.0079 -0.0079
(0.005) (0.005) (0.007) (0.008) (0.008) (0.009)excessspread -0.16 -0.15 -0.15 0.38 0.33 0.33(x100) (0.18) (0.18) (0.29) (0.24) (0.24) (0.36)leadtot 0.017 0.023 0.023 -0.010 -0.002 -0.002(x100000) (0.015) (0.015) (0.020) (0.019) (0.020) (0.025)AAA Rated -0.27*** -0.27*** -0.27*** -0.18*** -0.18*** -0.18***
(0.02) (0.02) (0.02) (0.03) (0.03) (0.03)AA Rated -0.093*** -0.092*** -0.092*** -0.048** -0.049** -0.049*
(0.017) (0.017) (0.018) (0.023) (0.023) (0.027)A Rated 0.039*** 0.040*** 0.040*** 0.082*** 0.083*** 0.083***
(0.014) (0.014) (0.015) (0.021) (0.021) (0.024)subordination -0.60*** -0.61*** -0.61*** -0.66*** -0.65*** -0.65***(x100) (0.05) (0.05) (0.07) (0.06) (0.06) (0.09)spread (bp) 0.029*** 0.029*** 0.029*** 0.048*** 0.047*** 0.047***(x100) (0.008) (0.008) (0.010) (0.011) (0.011) (0.016)disagreetranche 0.053*** 0.053*** 0.053*** 0.053*** 0.054*** 0.054***
(0.008) (0.008) (0.010) (0.011) (0.011) (0.014)Observations 14,601 14,601 14,601 7,864 7,864 7,864Year of Issue FEs Yes Yes Yes Yes Yes YesTop 5 State Shares Yes Yes Yes Yes Yes YesCollateral Characteristics No No No Yes Yes YesStd. Errors Clustered by Deal No No Yes No No YesPseudo-R2 0.52 0.52 0.52 0.49 0.49 0.49
Notes: 1) Entries shown are marginal effects from probit estimation of default on variables shown. 2) See
notes to Table 1 for variable definitions. 3) ***, **, and * denote statistical significance at the 1, 5, and
10% levels. 4) Collateral Characteristics are ltv, fico, lownodocshare, balunder300kshare, bal300600kshare,
and wam. 5) The number of observations in columns 1 through 3 differs from that in Table 3 because we
drop observations for which we do not have a foreclosure rate.
50

Table 8: The Pricing of Security Complexity
Variable (1) (2) (3) (4) (5) (6) (7)
nloangroups -1.60*** 0.031(0.47) (0.65)
ntranches -0.31*** -0.27***(0.08) (0.10)
pagesprosup -0.039*** -0.009(0.011) (0.017)
pagesmpool -0.074*** -0.055*(0.021) (0.030)
pageswaterfall -0.028 0.024(0.040) (0.042)
complexityindex -1.96***(0.45)
dealsize -0.23*** -0.23*** -0.26*** -0.23*** -0.29*** -0.19*** -0.19***x100 (0.06) (0.06) (0.06) (0.06) (0.06) (0.06) (0.06)crosscollat 0.10 -0.02 -0.20 -0.10 -0.61 0.44 0.26
(0.80) (0.78) (0.78) (0.78) (0.77) (0.81) (0.79)excessspread -0.67*** -0.60** -0.89*** -1.00*** -0.93*** -0.71*** -0.68***
(0.24) (0.24) (0.22) (0.22) (0.23) (0.25) (0.23)leadtot -0.085 -0.063 -0.067 -0.032 -0.082 -0.004 -0.088
(0.22) (0.22) (0.22) (0.22) (0.22) (0.22) (0.22)AAA Rated -180*** -180*** -180*** -181*** -181*** -180*** -180***
(1.58) (1.58) (1.58) (1.58) (1.58) (1.59) (1.59)AA Rated -155*** -155*** -155*** -155*** -155*** -155*** -155***
(1.24) (1.24) (1.24) (1.24) (1.24) (1.25) (1.24)A Rated -109*** -109*** -109*** -109*** -109*** -109*** -109***
(1.09) (1.09) (1.09) (1.09) (1.09) (1.09) (1.09)subordination -0.062 -0.055 -0.059 -0.031 -0.019 -0.055 -0.055
(0.080) (0.079) (0.080) (0.080) (0.079) (0.080) (0.080)disagreetranche 14.4*** 14.5*** 14.4*** 14.3*** 14.3*** 14.4*** 14.3***
(0.88) (0.88) (0.88) (0.88) (0.88) (0.88) (0.88)Constant 243*** 243*** 246*** 244*** 243*** 244*** 240***
(3.41) (3.41) (3.51) (3.43) (3.44) (3.57) (3.46)Observations 15,357 15,357 15,329 15,271 15,271 15,258 15,258R2 0.757 0.757 0.757 0.757 0.757 0.757 0.757Year of Issue FEs Yes Yes Yes Yes Yes Yes YesTop 5 State Shares Yes Yes Yes Yes Yes Yes Yes
Notes: 1) Entries shown are coefficients from a regression of the spread of the security, in basis points,
relative to one month LIBOR on the variables shown. 2) See notes to Table 1 for variable definitions. 3)
***, **, and * denote statistical significance at the 1, 5, and 10% levels.
51

Table 9: Subordination Levels (Credit Support) for AAA Securities and Complexity
Variables (1) (2) (3) (4) (5) (6) (7)
nloangroups -0.50*** -0.76***(0.09) (0.12)
ntranches 0.010 0.094***(0.015) (0.019)
pagesprosup -0.012*** -0.017***(0.002) (0.004)
pagesmpool -0.012*** 0.021***(0.005) (0.007)
pageswaterfall 0.003 0.019**(0.009) (0.009)
complexityindex -0.37***(0.090)
dealsize -0.32** -0.47*** -0.43*** -0.57*** -0.67*** -0.59*** -0.48***x1000 (0.13) (0.13) (0.13) (0.13) (0.13) (0.14) (0.14)crosscollat -0.97*** -1.30*** -1.10*** -1.17*** -1.26*** -0.94*** -1.06***
(0.17) (0.17) (0.17) (0.17) (0.17) (0.18) (0.17)excessspread 0.50*** 0.38*** 0.43*** 0.42*** 0.43*** 0.46*** 0.48***
(0.049) (0.049) (0.047) (0.047) (0.049) (0.052) (0.049)leadtot -0.47*** -0.46*** -0.46*** -0.47*** -0.46*** -0.46*** -0.47***x10000 (0.05) (0.05) (0.05) (0.05) (0.05) (0.05) (0.05)disagreetranche -1.85*** -1.87*** -1.85*** -1.78*** -1.82*** -2.02*** -1.78***
(0.60) (0.60) (0.60) (0.60) (0.60) (0.60) (0.60)Constant 11.4*** 12.2*** 12.4*** 11.6*** 11.3*** 12.0*** 10.9***
(0.71) (0.67) (0.74) (0.72) (0.72) (0.75) (0.72)Observations 5,527 5,527 5,516 5,490 5,490 5,485 5,485R2 0.154 0.147 0.154 0.152 0.151 0.163 0.154Year of Issue FEs Yes Yes Yes Yes Yes Yes YesTop 5 State Shares Yes Yes Yes Yes Yes Yes Yes
Notes: 1) Entries shown are coefficients from a regression of the subordination of the security, in percent,
on the variables shown. 2) See notes to Table 1 for variable definitions. 3) ***, **, and * denote statistical
significance at the 1, 5, and 10% levels. 4) Regressions include only AAA securities.
52
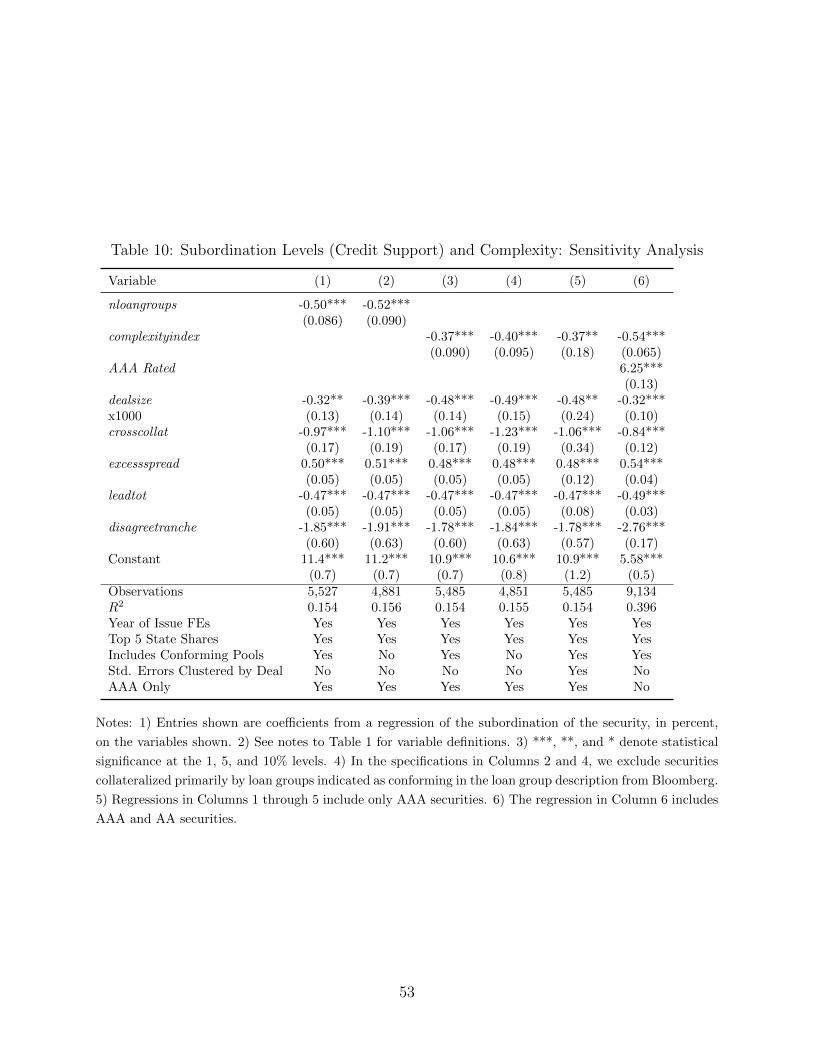
Table 10: Subordination Levels (Credit Support) and Complexity: Sensitivity Analysis
Variable (1) (2) (3) (4) (5) (6)
nloangroups -0.50*** -0.52***(0.086) (0.090)
complexityindex -0.37*** -0.40*** -0.37** -0.54***(0.090) (0.095) (0.18) (0.065)
AAA Rated 6.25***(0.13)
dealsize -0.32** -0.39*** -0.48*** -0.49*** -0.48** -0.32***x1000 (0.13) (0.14) (0.14) (0.15) (0.24) (0.10)crosscollat -0.97*** -1.10*** -1.06*** -1.23*** -1.06*** -0.84***
(0.17) (0.19) (0.17) (0.19) (0.34) (0.12)excessspread 0.50*** 0.51*** 0.48*** 0.48*** 0.48*** 0.54***
(0.05) (0.05) (0.05) (0.05) (0.12) (0.04)leadtot -0.47*** -0.47*** -0.47*** -0.47*** -0.47*** -0.49***
(0.05) (0.05) (0.05) (0.05) (0.08) (0.03)disagreetranche -1.85*** -1.91*** -1.78*** -1.84*** -1.78*** -2.76***
(0.60) (0.63) (0.60) (0.63) (0.57) (0.17)Constant 11.4*** 11.2*** 10.9*** 10.6*** 10.9*** 5.58***
(0.7) (0.7) (0.7) (0.8) (1.2) (0.5)Observations 5,527 4,881 5,485 4,851 5,485 9,134R2 0.154 0.156 0.154 0.155 0.154 0.396Year of Issue FEs Yes Yes Yes Yes Yes YesTop 5 State Shares Yes Yes Yes Yes Yes YesIncludes Conforming Pools Yes No Yes No Yes YesStd. Errors Clustered by Deal No No No No Yes NoAAA Only Yes Yes Yes Yes Yes No
Notes: 1) Entries shown are coefficients from a regression of the subordination of the security, in percent,
on the variables shown. 2) See notes to Table 1 for variable definitions. 3) ***, **, and * denote statistical
significance at the 1, 5, and 10% levels. 4) In the specifications in Columns 2 and 4, we exclude securities
collateralized primarily by loan groups indicated as conforming in the loan group description from Bloomberg.
5) Regressions in Columns 1 through 5 include only AAA securities. 6) The regression in Column 6 includes
AAA and AA securities.
53

Table 11: Are Loan Groups Tailored?
Loan Group Characteristic Inter-Deal MAD Intra-Deal MAD T-Stat for Difference
Cashare 12.5 7.1 29.3Flshare 2.9 1.4 27.4Nyshare 3.9 1.6 37.0Ilshare 3.0 1.3 45.7Txshare 2.7 1.0 45.2fico 25.3 8.7 30.7ltv 6.0 1.1 24.2lownodocshare 18.4 3.7 40.6balunder300kshare 19.2 17.1 6.7bal300600kshare 15.7 13.8 6.5balover600kshare 4.3 3.4 8.5wam 22.0 4.2 32.5
Notes: 1) MAD is mean absolute deviation. 2) See Table 1 for variable definitions.
54