compliance training produces increases in skill-based
TRANSCRIPT
St. Cloud State UniversitytheRepository at St. Cloud StateCulminating Projects in Community Psychology,Counseling and Family Therapy
Department of Community Psychology, Counselingand Family Therapy
5-2017
Compliance Training Produces Increases in Skill-Based Assessments in Typically-DevelopingChildrenAmy L. SipplSt. Cloud State, [email protected]
Follow this and additional works at: https://repository.stcloudstate.edu/cpcf_etds
This Thesis is brought to you for free and open access by the Department of Community Psychology, Counseling and Family Therapy at theRepositoryat St. Cloud State. It has been accepted for inclusion in Culminating Projects in Community Psychology, Counseling and Family Therapy by anauthorized administrator of theRepository at St. Cloud State. For more information, please contact [email protected].
Recommended CitationSippl, Amy L., "Compliance Training Produces Increases in Skill-Based Assessments in Typically-Developing Children" (2017).Culminating Projects in Community Psychology, Counseling and Family Therapy. 36.https://repository.stcloudstate.edu/cpcf_etds/36

Compliance Training Produces Increases in Skill-Based Assessments in Typically-
Developing Children
by
Amy L. Sippl
A Thesis
Submitted to the Graduate Faculty of
St. Cloud State University
in Partial Fulfillment of the Requirements
for the Degree of
Master of Science in Applied Behavior Analysis
May, 2017
Thesis Committee:
Dr. Benjamin N. Witts, Chairperson
Dr. Kimberly Schulze
Dr. Michele Traub

COMPLIANCE AND BEHAVIORAL ASSESSMENT 2
Abstract
Early intensive behavioral intervention therapy (EIBIT) practitioners have been documented to
use both standardized psychological and behavioral assessments in assessing outcomes of
children diagnosed with autism. Assessments are necessary to inform stakeholders if EIBIT is
effective, for which children, and under what conditions. However, the extent to which variables
like compliance influence the results of existing EIBIT assessments is yet unknown. This study
evaluated the influence of compliance training on the results of the Early Learning Measure
(ELM), one assessment used in EIBIT. Two participants underwent repeated compliance
training sessions followed by re-testing of the ELM assessment. Mean scores on the ELM
increased over baseline following compliance training alone for both participants. A compliance
reversal training protocol was then conducted. Mean scores on the ELM decreased for one
participant and remained stagnant for the second following compliance reversal. The study’s
findings support variables like compliance may influence scores on EIBIT assessments and
provide a preliminary evidence for the need to systematically manipulate these variables in
applied settings.

COMPLIANCE AND BEHAVIORAL ASSESSMENT 3
Acknowledgements
A manuscript like this brings up a long list of things to be grateful for. Because of the large "village"
it took to make this project happen, there are many to thank. First I wish to thank Dr. Benjamin N.
Witts and my committee at SCSU, Dr. Eric Larsson, Dr. Charryse Luckey, and Dr. Angela Brown
for your patient guidance through not just my thesis, but through my entire program. Your years of
research and clinical experience shine through this project in many ways. I also wish to thank my
friends, family, and colleagues who continue to inspire me to follow my curiosity and ask the big
questions.

COMPLIANCE AND BEHAVIORAL ASSESSMENT 4
Table of Contents
Chapter
1. Introduction and Literature Review ...........................................................................5
2. Methods .....................................................................................................................17
3. Results ......................................................................................................................27
4. Discussion ..................................................................................................................29
References .… .....................................................................................................................34
Appendices
A. Figures ......................................................................................................................38
B. Sample Data Sheets....................................................................................................44
C. Sample Session Instructions ......................................................................................47
D. Sample Assessor Fidelity Checklist ...........................................................................50
E. Institutional Review Board Approval ........................................................................53

COMPLIANCE AND BEHAVIORAL ASSESSMENT 5
Chapter 1: Introduction and Literature Review
Early intensive behavioral intervention therapy (EIBIT) is an evidence-based treatment
found to be effective for many young children diagnosed with autism (Lovaas, 1987; McEachin,
Smith, & Lovaas, 1993; Rogers & Vismara, 2008). EIBIT was developed from the field of
applied behavior analysis and uses behavior analytic principles to guide systematic teaching to
address autism-related features (see Lovaas, 2003 for a review of EIBIT principles). While
findings support that most children who receive EIBIT benefit more than receiving no
intervention, there appears to be a wide range of outcomes among individuals (Eldevik, et al.,
2009; Reichow, 2012). Some studies report that just under half of children receiving EIBIT
achieve normal functioning, and another substantial percentage of achieve significant gains in
IQ, language, and other skill areas (Lovaas, 1987; McEachin, et al., 1993; Rogers & Vismara,
2008).
While the outcomes of EIBIT are promising, it can be expensive for families and funding
agencies. Direct therapy costs for intensive behavioral treatments are reported to be as high as
$60,000 per child per year (Chasson, Harris, & Neely, 2007). This cost is in addition to the
substantial financial and social costs of raising a child diagnosed with autism families already
incur (Ganz, 2007; LaValle, et al., 2014; Leigh & Du, 2015). Costs of raising a child diagnosed
with autism in the United States, including healthcare, education, therapies, and caregiver time
are reported to be as high as $17,000 per year in addition to costs of traditional parenting
(LaValle, et al., 2014). Many families also incur indirect costs, including parents’ loss of
working hours or leaving the workforce as a result of a child receiving treatment (Ganz, 2007).

COMPLIANCE AND BEHAVIORAL ASSESSMENT 6
With such steep costs and such wide-ranging treatment outcomes, it becomes increasingly more
important for all stakeholders to understand which children are likely to benefit from EIBIT.
Comparative Effectiveness of Assessing EIBIT Outcomes
The field of applied behavior analysis relies on assessments to better predict which
individuals might benefit the most from a particular treatment (Nelson & Hayes, 1979). Families
and EIBIT practitioners also use assessment data to guide treatment decisions and demonstrate
the benefits of EIBIT over other treatments. Yet few empirical evaluations are conducted on the
treatment utility of conducting particular behavioral assessments. If families and stakeholders
are to make important decisions about care and resource allocation, more information is needed
about the comparative effectiveness of behavioral assessments. Researchers should provide a
better understanding of what behavioral assessments yield the best EIBIT outcomes for a given
population of children, and under what conditions.
Current Research on Assessments in EIBIT
In 2007, MacDonald, Parry-Cruwys, Dupere, and Ahearn reviewed the common
assessments used in evaluating progress and outcomes for toddlers receiving EIBIT. Their
findings indicated that while no standard EIBIT assessments exist, practitioners frequently use a
combination of psychological and behavioral assessments to evaluate progress and outcomes.
Psychological assessments. Norm-referenced standardized psychological assessments
are frequently used as measures of progress and outcomes in EIBIT (MacDonald, et al., 2007).
These include pre- and post-treatment scores on standardized measures of IQ (e.g., Bayley,
Wechsler Preschool and Primary Scale [WPPSI], Merrill-Palmer, Stanford-Binet) and
composite scores of adaptive functioning (e.g., Vineland Adaptive Behavior Scale, Adaptive

COMPLIANCE AND BEHAVIORAL ASSESSMENT 7
Behavior Assessment System [ABAS]). It is argued that individuals who have achieved
successful outcomes as a result of EIBIT reflect statistically significant increases in scores, and
in many cases achieve scores in the normative range (Lovaas, 1987; McEachin, et al., 1993;
Rogers & Vismara, 2008).
While standardized psychometric evaluations like IQ and adaptive behavior can be
indicative of global changes in functioning, they offer little information about the target
behaviors to address in treatment or about which changes resulted in the best outcomes for the
individual (Nelson & Hayes, 1979). In addition, there is some evidence to support these
measures lack the sensitivity to measure and predict changes to autistic features (MacDonald, et
al., 2007).
Autism-specific assessments. Other assessments attempt to remedy this lack of
sensitivity by directly assessing changes in autism-specific deficits, including language
development and social functioning. The Autism Diagnostic Observation Schedule (ADOS-2;
Lord, DiLavore, & Gotham, 2012) and the Childhood Autism Rating Scale (CARS-2; Schopler,
Reichler, & Renner, 2002) are two such measures used with children receiving EIBIT
(MacDonald, et al., 2007). In both assessments, an evaluator uses a rating scale to rank the
child’s performance across a variety of autism-related skill areas. Information on the child’s
performance is reported by the caregiver or teacher. The scores on each rating scale are
calculated to form a composite, which then contributes to a diagnosis of the severity of autism.
Therefore, it is presumed that a child who achieves an autism diagnosis pre-treatment and loses
that diagnosis post-treatment can be said to have achieved optimal functioning as a result of
EIBIT (Sallows & Graupner, 2005).

COMPLIANCE AND BEHAVIORAL ASSESSMENT 8
While these autism-specific assessments are designed with more sensitivity to the core
behavioral deficits and excesses of the disorder than standardized psychological evaluations,
both are indirect measures of individual performance and rely on parent and teacher report. As
such, they do not require the repeated observation of the individual’s performance over time, and
in many cases the evaluator must make conclusions based on the caregiver’s subjective reports
(MacDonald, et al., 2007). While these types of descriptive assessments have value in
identifying patterns or global excess and deficits, it can be argued they lack the experimental
control and repeated observation necessary to understand what elements of treatment were
effective and why (see Nelson & Hayes, 1979).
Rate of learning assessments. In addition, MacDonald et al., (2007) identified two
studies that remedy the above deficits in assessment through direct observation of the child’s rate
of learning. Rate of learning, or sometimes rate of acquisition can be described as the duration
needed to meet pre-determined mastery criteria for a particular skill (Cooper, Heron, & Heward,
2007; Weiss & Delmolino, 2006). According to these studies, rapid acquisition of skills—
especially in vocal imitation—during the initial months of EIBIT has been strongly correlated
with children who achieved normal functioning after treatment (Sallows & Graupner, 2005;
Smith, Groen, & Wynn, 2000). Other examinations in EIBIT show more moderate correlations
between rate of learning and later status of the child (Weiss, 1999). The findings suggest those
who demonstrated high initial learning rates during the assessment continued to demonstrate
high rates of learning. Children who demonstrated lower rates of skill acquisition continued to
demonstrate higher rates of autistic behavior after treatment (Smith, Groen, & Wynn, 2000;
Weiss, 1999).

COMPLIANCE AND BEHAVIORAL ASSESSMENT 9
While Weiss (1999) suggested that rate of skill acquisition may be indicative of EIBIT
outcomes, it was also suggested that rate of learning may be influenced by other confounding
variables. In the study the rate of learning of 19 children diagnosed with autism receiving in-
home EIBIT was measured across nine programs. Initial rapid rates of learning were correlated
with later improvements in autistic behavior (Weiss, 1999). However, no controls were made for
variability in individual responsiveness to reinforcement and basic compliance among the
participants. Without these controls, it is unclear how success on rate of learning assessments is
influenced by confounding variables.
Measuring the Influence of Variables in Rate of Learning Assessments
There are many variables which may influence rate of learning assessments. To date, no
empirical research has been published examining how variables like compliance, responsiveness
to social reinforcement, or instructor experience influence outcomes on these types of
assessments. This study seeks to increase the available information by developing a
methodology for assessing the influence of variables like compliance in rate of learning
assessments.
The Role of Compliance
In many EIBIT programs, the initial months of treatment are focused on building rapport
and establishing basic compliance (Lovaas, 2003). Failure to comply with instructions is
frequently identified as a behavioral problem in children with developmental disabilities
(Cataldo, Ward, Russo, Riordan, & Bennett, 1986; Mace, et al., 1988; Lovaas, 2003; Wilder,
Fischetti, Myers, Leon‐ Enriquez, & Majdalany, 2013). Schoen (1983) operationally defined
compliance as demonstrating a specific requested response within a designated time. Not only

COMPLIANCE AND BEHAVIORAL ASSESSMENT 10
does complying include response accuracy, it must also be performed when instructed. Schoen
also described the counterpart of ‘non-compliance’ as demonstrating a different response than
the one requested, responding outside of the designated time, or no response when requested.
Compliance Training in EIBIT
A myriad of behavioral interventions have been developed to address compliance deficits
in children. Houlihan, Sloane, Jones, and Patten (1992) reviewed literature on behavioral
treatments to increase compliance. Consequence-based procedures, including contingent
reinforcement and punishment, were cited as effective in increasing compliance. These
procedures were used with a variety of instructions and across various environments.
Antecedent strategies including changing the form of the instruction or the context of the
instruction were also found to be effective in increasing compliance. Manipulating high
probability and low probability instructions to promote compliance (Mace et al., 1988;
McComas, Wacker, & Cooper, et al., 1998; Zuluaga & Normand, 2008) has also been studied in
EIBIT programs.
Lovaas (2003) described procedures to establish compliance in the early stages of EIBIT.
Compliance with sitting in a chair is frequently the first response taught in many EIBIT
programs, followed by compliance with simple instructions (e.g. “Come here,” “hands quiet,”
“drop block”) in the initial weeks of treatment. Training compliance with these beginning tasks
is described as essential to developing other more complex behaviors.
Yet despite the evidence of the effectiveness of compliance training, little is known about
how compliance influences results on many behavioral assessments, particularly rate of learning
assessments. Specifically, researchers must better understand the role of compliance has in

COMPLIANCE AND BEHAVIORAL ASSESSMENT 11
altering scores on assessments independent of EIBIT programming. If rate of learning
assessments are indicative out EIBIT outcomes, perhaps compliance may also be a stand-alone
indicator of outcomes. Additional empirical examination is necessary to understand and evaluate
this relation in rate of learning assessments.
The Early Learning Measure
The Early Learning Measure (ELM) is one rate of learning assessment well-suited for an
empirical study of compliance. The ELM was developed by many of the early pioneers of
EIBIT (Lovaas & Smith, 1988; Smith, Buch, & Ganby, 2000; Smith, Groen, & Wynn, 2000),
and first appeared as part of long-term outcome studies of children who received EIBIT under
the UCLA treatment model (Smith, et al., 2000). The ELM emphasizes initial rates of learning
in the first few months of EIBIT as a predictor of which children will achieve optimal
functioning at the end of treatment. A number of sources have supported the use of the ELM by
EIBIT practitioners (Lovaas & Smith, 1988; Sallows & Graupner, 2005; Smith et al., 2000). The
assumptions, administration, and varied empirical support of the ELM make it particularly well-
suited for an evaluation of the effects of compliance on outcomes. It is to these three aspects that
I now turn.
Assumptions of the Early Learning Measure
There are several assumptions that supported the initial development of the ELM.
Described by Weiss (1999), the foundation of the ELM resides in the assessment of initial rates
of learning in the first several months of EIBIT. The evaluator assesses rate of learning across
four core areas of basic skills: non-vocal imitation, vocal imitation, responding to commands,
and expressive labels (i.e., tacting objects) in the first five months of treatment (Smith, et al.,

COMPLIANCE AND BEHAVIORAL ASSESSMENT 12
2000). The ELM assumes that children with autism who benefit from EIBIT the most are those
who experience the most gains in the initial stages of treatment. If these children must make up
significant ground in order to “catch up” to their same-aged peers, the first months of EIBIT are
critical to establish the necessary conditions to accelerate learning.
Assessment Administration
Smith, Buch, and Ganby (2000), Sallows and Graupner (2005), and Lovaas Institute for
Early Intervention (1998) describe the procedure for administering the ELM. The assessment is
traditionally conducted under controlled conditions in the environment in which the EIBIT
program is to take place (i.e., if the EIBIT program is in-home, the ELM is conducted in the
child’s home; it should be conducted in the therapy center for children attending center-based
programs). Stimuli are gathered from the available materials in the child’s environment and the
child is seated across from the evaluator during the assessment. ELM assessments are frequently
videotaped for later reference.
Baseline. Baseline is established at intake, prior to the start of any EIBIT programming
with the child. At baseline the evaluator identifies failures across each of the four core skill
areas. Failures can include: the child provides no response to an instruction, the child provides
an inaccurate or incomplete response (e.g., the child says “cup” when the evaluator presents a
shoe), the child engages in refusal or tantrum behavior following an instruction, or the child
demonstrates the response the first time the instruction is given, but does not demonstrate it on a
consecutive administration.
The evaluator identifies 40 instructions the child fails to respond to, 10 in each of four
core skill areas: 10 non-vocal imitation tasks (e.g., evaluator says “Do this.” and models

COMPLIANCE AND BEHAVIORAL ASSESSMENT 13
clapping hands. Child stomps feet), 10 vocal imitation tasks (e.g., evaluator says “Say Mama.”
Child says “Dada”), 10 receptive commands, (e.g., evaluator says, “Touch head.” Child touches
knees), and 10 expressive object labels (e.g., evaluator presents a shoe and says “What’s this?”
Child says “shirt”). Once the evaluator identifies the 40 items, a second baseline evaluation is
conducted up to one week later. If the child responds correctly to an instruction in the second
baseline evaluation that was previously identified as a failure it is removed from the test items
and a new failure to respond is identified. These 40 instructions are then evaluated through the
rest of the assessment (see Appendix A for a sample of ELM instructions).
Treatment. Following the onset of EIBIT programming, the ELM is re-administered
every four to five weeks of treatment for the next five months. During this time, the EIBIT
programming may or may not include items from the ELM. At each re-administration, the
evaluator presents the 40 items and measures mastery for each. Mastery is defined as
demonstration of the response on two consecutive opportunities to respond. If the child
demonstrates mastery of an item, it is no longer assessed in upcoming administrations of ELM.
Therefore, as the child demonstrates mastery of items in each ELM, fewer items are administered
on the subsequent assessments. The test is continued until the child responds to all 40 items or
until the end of the first five months of treatment, whichever occurs first.
Data analysis. At the end of the first five months of treatment, the evaluator has a visual
depiction of the rate of the child’s skill acquisition across the four skill areas (see Figure 5 for an
example). The primary measure obtained at the end of assessment is the number of weeks
required for the child to learn 90% (9 of 10 items) of items in each skill area and assumes that
children who acquire these items during the first five months of treatment have a promising

COMPLIANCE AND BEHAVIORAL ASSESSMENT 14
prognosis for responding to EIBIT (Sallows & Graupner, 2005). While not empirically
validated, it follows logically that children who demonstrate slower acquisition of skills (i.e., the
child only masters a few items in each of the core skill areas) or more moderate acquisition of
skills on the ELM (i.e., the child masters all items in one or two core skill areas but limited items
in the others) are likely to demonstrate more moderate outcomes after receiving EIBIT.
Considerations and Limitations of the Early Learning Measure
Upon initial review, the ELM offers promising data for parents and EIBIT practitioners.
Given there is a relatively brief intake baseline period and the results can be calculated
concurrently with treatment (no need to discontinue treatment or return to baseline), the ELM
avoids critical teaching time in assessments rather than EIBIT programming. The response effort
and specialized training to administer the assessment is also low with only 40 items to test and
very simple instructions for the evaluator.
In addition, early assessment data provided by the ELM may influence treatment.
Completing the assessment every five weeks of treatment provides frequent and consistent
feedback about the progress in treatment. Practitioners’ behavior may adjust based on ELM
results as well. Positive assessments may be an indication the EIBIT programming in place is
aiding in the rapid acquisition of skills. If the results are more moderate in the initial ELM
assessments, parents and practitioners may make adjustments to the EIBIT programming to
increase the rate of skill acquisition (e.g. increased intensity of hours, revision to reinforcement
contingencies, more staff training).
However, many of the conclusions listed above must be interpreted cautiously as there
are a number of considerations and limitations to the ELM. The results of the assessment should

COMPLIANCE AND BEHAVIORAL ASSESSMENT 15
be interpreted with an understanding of the limited empirical validation for the assessment and
the influence of potential confounds like compliance.
Empirical Validation of the Early Learning Measure
One of the most critical concerns regarding the treatment utility of the ELM is the limited
empirical validation of the assessment. To date, the body of research using rate of learning in
EIBIT has been limited to a few long-term outcome EIBIT studies, primarily from the
developers of the assessment (Lovaas & Smith, 1988; Smith, et al., 2000). While the results of
these studies are encouraging, conclusions are corollary in nature and do not necessarily indicate
that the assessment can predict which children will achieve normal functioning following EIBIT
treatment. It is erroneous to suggest that at this time results from the ELM alone could indicate
to a practitioner or parent what the long-term prognosis of a child with autism may be after
receiving EIBIT.
In addition, no empirical studies have been published indicating how the results of the
ELM might guide modifications to EIBIT programs to alter a child’s prognosis. A practitioner
who conducts the initial ELM assessments might see rapid gains in one area but slow acquisition
of skills in another area and make adjustments accordingly. A child might receive lower
intensity or lower quality treatment in the first five months as EIBIT staff are trained to
implement the program and as the staff build rapport with the child which may underestimate
progress on the ELM. Problem behavior may interfere with responding during the initial stages
of treatment, which may take more than five months to address; yet with modifications the child
may demonstrate rapid acquisition of skills after the mastery cut-off for the ELM. It is yet
unknown if or how these types of adjustments to treatment at early or later stages of EIBIT may

COMPLIANCE AND BEHAVIORAL ASSESSMENT 16
alter later outcomes. Studies on how treatment intensity, staff training, or rates of problem
behavior influence ELM results are also limited in scope and number.
The Influence of Compliance Training on the ELM
While the ELM is considered to be an assessment of rate of learning, the measurement
criteria mirrors a measurement of compliance. A correct response on the ELM is by definition a
compliant response in that the child performs the skill with accuracy and fluency when
instructed. In this way, one must question whether the outcomes on an ELM assessment reflect a
measure of rate of learning or a measure of compliance. Logically then, if the ELM results
correlate with basic compliance rather than skill acquisition, one must also question if
compliance is a similar or better predictor of child outcomes than rate of learning.
Finally, although compliance appears to be a component of the ELM assessment, little is
known about if or how compliance interventions improve outcomes on the ELM or improve
outcomes in EIBIT. Perhaps emphasis on compliance training in the initial stages of EIBIT is
more critical than targeting specific skill deficits as suggested by other standardized or autism-
specific assessments. Of course, such questions are empirical in nature, and require data that
currently do not exist. Prior to answering these important questions, an assessment of the degree
to which compliance influence ELM results is needed.
Statement of the Problem
Given the results of previous EIBIT outcomes research using of rate of learning (Lovaas
& Smith, 1988; Smith, et al., 2000; Weiss, 1999), further research on these assessments is
needed. Assessments are necessary to inform stakeholders if EIBIT is effective, for which
children, and under what conditions. However, the extent to which variables like compliance

COMPLIANCE AND BEHAVIORAL ASSESSMENT 17
influence the results of existing EIBIT assessments like the ELM is unknown. A standardized
empirical method to evaluate these variables is also yet undeveloped. The purpose of the current
study was to develop a rudimentary methodology to evaluate the influence of compliance
training on the results of the ELM in an applied setting.
Chapter 2: Methods
Participants, Setting, and Materials
Participants. Data were collected from two participants. Both participants were siblings
of a child currently enrolled in an in-home EIBIT program located in a large Midwest
metropolitan area. The EIBIT program was currently using the ELM as part of the intake and
semi-annual assessment package. Sibling participants were selected to avoid interference with
the intake assessment procedure of a child currently undergoing EIBIT, to avoid an interference
with a current EIBIT program which may already be targeting compliance and to avoid practice
effects from prior intake assessments.
Families were recommended to the investigator by the agency’s clinical director based on
the following selection criteria: 1) participant was at least 3 years of age at the onset of the study,
2) participant was described by the clinical director as possibly benefitting from additional
compliance training (in some circumstances, the EIBIT program addresses sibling compliance to
promote successful modeling of appropriate behavior for the child in treatment), and 3)
participant had not had prior compliance training with the EIBIT team.
Sam. Sam was a 4-year-old male whose older brother was currently receiving in-home
EIBIT services for ASD. The clinical supervisor overseeing the older brother’s case reported
that Sam engaged in non-compliant behaviors with his family members, including frequent

COMPLIANCE AND BEHAVIORAL ASSESSMENT 18
whining and protesting. He was also observed to engage in some aggression (chasing and hitting
his siblings) when he was asked to do difficult tasks or preferred activities were disrupted by his
siblings.
Sam was enrolled in a preschool classroom for 3-5 year olds three days per week prior
to and during the duration of the study. Sam’s mother reported that he had been evaluated for
ASD the previous year due to reported challenges with social interactions by his preschool
teachers. Sam would prefer to play alone at preschool or would have difficulty engaging
appropriately with his classmates. At the time of evaluation, Sam did not meet the diagnostic
criteria for ASD and no additional diagnostic recommendations were made. Sam’s mother
reported he scored “above his age level” for expressive language, but would start to “shut down”
when the receptive language assessments were conducted.
Bailey. Bailey was 5 years old at the onset of the study. His twin brother was currently
receiving in home EIBIT services for ASD. Bailey had not been previously evaluated for ASD;
however, his mother reported concerns about his ‘anxiety issues’ and stress related to his
brother’s severe aggressive behaviors and inability to communicate.
Bailey was enrolled in a preschool classroom for 4-5 year olds three mornings per week
prior to and during the study. Bailey’s mother reported that he was responding well in the
preschool setting and had several close friends. At home, he was observed to have tantrum
behaviors when asked to complete simple tasks. He also demonstrated overly emotional
responses to unpredictable events (e.g., screaming and crying if his block tower collapsed,
aggression towards his caregivers if refused).

COMPLIANCE AND BEHAVIORAL ASSESSMENT 19
Setting and Materials. All sessions were conducted in the participants’ home, which
comports with the assessment conditions for the ELM. Sessions were conducted once per day by
a member of the EIBIT program staff. Written instructions for each session were provided to the
assessor prior to experimentation and at the onset of each session (see Appendix C). The
assessor scored all session measures on a provided data collection sheet (see Appendix B).
Finally, the principal investigator directly observed the assessor’s implementation of the ELM
and compliance training sessions using a fidelity checklist (see Appendix D) to confirm correct
and incorrect implementation of each experimental condition.
Experimental Design
A replicated ABCBD design with embedded probes was used in this study to determine
the existence of and extent to which compliance training influences scores on the ELM
assessment. Three conditions were examined: compliance training, compliance reversal, and task
training.
Response Measurement
Child measures. The primary dependent measure for this study was correct and
incorrect responses to instructions during the ELM assessment and during compliance training
sessions.
Correct/incorrect responses to instructions. For each session, the assessor scored
correct and incorrect responses to instructions. Correct responses were defined as the child
accurately completes the instruction within 5 seconds. Incorrect responses or “failures” were
defined as: non-response (i.e., the child does not respond within 5 seconds of the instruction),
inaccurate response (i.e., the child completes a different response than the one requested by the

COMPLIANCE AND BEHAVIORAL ASSESSMENT 20
assessor and does so within 5 seconds of the instruction), incomplete response (i.e., the child
completes part of the instruction but not all components within 10 seconds of the instruction), or
any maladaptive behavior (i.e., the child vocally refuses, disrupts the environment, leaves the
assessment area, tantrums, or aggresses) at any point during or following the instruction delivery.
The type of failure and maladaptive behavior for each instruction delivered was also recorded
when applicable. In addition, for each session the percentage of correct responses was calculated
by dividing the number of correct responses in the session by the total number of instructions
delivered during the session.
Procedures
Assessor training. Prior to experimentation, the staff (clinical supervisor, senior
behavior therapist, or behavior therapist) overseeing the client’s EIBIT program completed
assessor training. One week prior to the training, the investigator provided written instructions
for each experimental session and the fidelity checklists. The principal investigator then
conducted a 30-minute training session with each assessor, including modeling, role play, and
feedback on the assessor delivery of experimental conditions.
Following the training session, each assessor was observed completing the experimental
conditions with the child. The assessor was required to demonstrate 90% correct responding on
the fidelity checklist in order to proceed. The fidelity checklist was completed to ensure
consistent responding on a total of 10% of sessions.
ELM baseline. Each participant completed the standard baseline data condition of the
ELM as outlined in Smith, Buch, and Ganby (2000), Sallows and Graupner (2005), and Lovaas
Institute for Early Intervention (1998). For each session, the assessor reviewed pre-written

COMPLIANCE AND BEHAVIORAL ASSESSMENT 21
session instructions from the principal investigator, gathered all materials necessary for the
session, and conducted the session according to the written instructions (see Appendix C). All
sessions were video recorded using the camera application on an iPod for later review.
The assessor began with a sampling procedure to identify a putatively reinforcing activity
(i.e., present the item to the child, prompt the child to engage with the item, observe if the child
reaches for the item, makes eye contact with the item, or requests access to the item). When a
putatively reinforcing activity or item was identified (or when a maximum of five putatively
reinforcing activities or toys were sampled), the assessor prompted the child to begin the first test
section.
After each instruction, the assessor observed and recorded the child’s response. The
assessor delivered the statement “OK” in a neutral tone following all correct and incorrect
responses. One to two minutes of noncontingent access to putatively reinforcing activities or
stimuli was delivered after every three instructions. Two consecutive correct responses were
required for the child to demonstrate mastery of any particular instruction. No prompting
occurred following incorrect responses and any maladaptive behavior was ignored.
Instructions were administered in blocks of ten before repeating the same instructions
again (e.g., the assessor tests motor imitation instructions #1-10 in order. The child demonstrates
instruction #1 & #2 only. The assessor repeats these two instructions, then begins testing
instructions #11-20 to identify a total of 10 failures). This process was continued until 10
failures were identified in each test section. Between each section of the ELM, the assessor
provided the child with a 2-3 minute break without reinforcement or demands before beginning
the sampling and test procedure again until 40 failures were identified.

COMPLIANCE AND BEHAVIORAL ASSESSMENT 22
A second administration of the ELM baseline was conducted approximately 1 week after
the first administration using similar reinforcement and prompting procedures. The assessor
began by testing the 40 failures identified during the first baseline collection. If the child
demonstrated a second failure, the instruction was carried forward into the ELM probe sessions.
However, if the child demonstrated the mastery criteria for any item during the second baseline
probe, the assessor introduced a new instruction until another failure occurred. This process was
continued until 10 failures were identified in each test section.
High-probability instruction sequencing. Following the completion of ELM baseline
condition, a sequence of high- and low-probability instructions was established for each
participant. In a high-probability instructions sequence, the bottom of the hierarchy is composed
of instructions the participant is most likely to comply with (high-probability). The upper levels
of the hierarchy represent instructions the participant is less likely to comply with (low-
probability) or has a history of maladaptive behavior with. Positive reinforcement delivered for
compliance with high-probability instructions can be used to influence performance on low-
probability instructions (see Killu, 1999 for a review of high-probability instruction sequencing).
The high-probability instruction sequence for each participant was developed using data
from the ELM baseline assessments. Level 1 high-probability instructions were those
instructions that were demonstrated on two consecutive administrations in the initial ELM
baseline assessment. All other instructions were considered at a higher level in the hierarchy and
discarded for the remainder of the study. When the demand sequencing was completed, Sam had
50 high-probability instructions in the Level 1 hierarchy and Bailey had 16.

COMPLIANCE AND BEHAVIORAL ASSESSMENT 23
Compliance training. Compliance training sessions were conducted once per day in the
participant’s home by a staff member overseeing EIBIT treatment in the home. The therapist
gathered any treatment materials needed and video recorded the session. Each session began by
conducting the same sampling procedure as outlined in the ELM experimental conditions. When
a putatively reinforcing activity or item was identified (or when a maximum of five potential
activities or toys have been sampled), the therapist issued a Level 1 instruction and observed the
child’s response.
All correct responses were reinforced with access to the preferred item for 1-2 minutes.
Following access to reinforcement, the therapist issued another Level 1 instruction from the
hierarchy. This procedure was repeated until reinforcement was delivered 10 times. Level 1
instructions were randomly rotated across compliance training sessions. If the child did respond
to a Level 1 instruction or engaged in maladaptive behavior during the compliance training
sessions, the therapist re-issued the instruction and provided a prompt using least-to-most
intrusive prompting methods (see Libby, Weiss, Bancroft, & Ahern, 2008) for a review of least-
to-most-intrusive prompts). Following the prompted instruction, the therapist reissued the
instruction until the child demonstrated compliance without prompting. No access to
reinforcement was provided until the child demonstrated the correct response without prompting.
ELM probes. After every 5 compliance training sessions, the ELM was administered.
During ELM probes, the assessor conducted reinforcement sampling as in baseline and no
prompting was provided following incorrect responses. As in baseline, non-contingent access to
putative reinforcement was provided for 1-2 minutes after every third item during probe sessions.

COMPLIANCE AND BEHAVIORAL ASSESSMENT 24
In the ELM instructions outlined by Smith et al. (2000), Sallows and Graupner (2005),
and Lovaas Institute for Early Intervention (1998), when the participant demonstrates mastery of
an instruction it is removed from subsequent ELM probes. Removing mastered items serves to
minimize the confounding effects of delivering high rates of non-contingent access to highly
preferred activities during the ELM probes. For example, the assessor administers all 40 items in
the first probe. The participant demonstrates mastery of 5 items in the first probe. The assessor
will then remove the 5 items from the next ELM probe and only administer the remaining 35
items. In each ELM probe conducted for the current study, all 40 items were tested in each ELM
probe. This was a deviation from the standard protocol, but was intended to collect a more robust
sample of the participant’s compliance following compliance training and compliance reversal
sessions. Participants were informed of this deviation and any potential risks.
Compliance reversal training. Following the compliance training phase, a compliance
training reversal condition was used. Due to the sensitive nature and risks of reversing
compliance training (i.e., training non-compliance with instructions may result in disruption to
the family and deterioration of the child’s social responding), additional considerations were
made to protect the welfare of participants. The following set of conditions were established to
determine when the reversal condition was conducted for each participant: 1) the participant
demonstrated an increase in ELM scores on three consecutive probe sessions above baseline, 2)
additional consent was obtained from the participant’s parent to enter the compliance training
reversal phase, 3) sufficient time and staffing resources were available at the time to ensure
compliance training sessions could be conducted again following the reversal phase.

COMPLIANCE AND BEHAVIORAL ASSESSMENT 25
Compliance reversal sessions were conducted once per day in the participant’s home by
the staff overseeing the EIBIT program in the home. The therapist gathered any treatment
materials needed and video recorded the session.
The therapist began by sampling to identify potential reinforcement in the same manner
as the previous conditions. When a potentially reinforcing activity or item was identified (or
when a maximum of five potential activities or toys were sampled), the therapist issued a Level 1
instruction and observed the child’s response. Unlike in the compliance training condition,
access to 1-2 minutes of preferred items and activities was provided for incorrect responses,
incomplete responses, and non-responding to instructions. Correct responses within 5 seconds
were ignored and the inter-trial interval of 1 minute was started followed by another Level 1
instruction. Aggression, tantrumming, or bolting were ignored. Following access to 1-2 minutes
of reinforcement for failures, the therapist began a 1-minute inter trial interval with no demands
and no-access to reinforcement. The procedure was continued until either 1) reinforcement was
delivered 10 times or 2) 40 instructions were delivered.
Two compliance training reversal sessions were conducted prior to each probe of the
ELM assessment. Using a reduced number of training sessions aimed to reduce the risks to the
participant of reinforcement delivery for non-compliance. Compliance training reversal sessions
were discontinued when the participant demonstrated two consecutive decreasing ELM scores of
at least 20% from ELM probes during compliance training or until 3 total ELM probes have been
conducted. When discontinued, the compliance training sessions were re-introduced as outlined
above.

COMPLIANCE AND BEHAVIORAL ASSESSMENT 26
ELM task training. After re-instating compliance training for Sam, an additional
experimental phase was introduced. Sam demonstrated below 50% of the ELM items during any
of the conditions, indicating that compliance alone may not be sufficient to meet mastery criteria
of the ELM. An additional task training phase was completed. During this phase, any ELM
instruction that did not meet the mastery criteria were targeted in a “teach-to-the-test” training.
The assessor gathered any treatment materials needed and video recorded the session.
Each session began by conducting the same sampling procedure as outlined in the other
experimental conditions. When a putatively reinforcing activity or item was identified (or when
a maximum of five potential activities or toys have been sampled), the therapist issued an ELM
instruction and observed the child’s response.
The assessor responded to all correct responses with a neutral “OK” and proceeded to the
next instruction. After every 3 correct responses, the assessor delivered access to 1-2 minutes of
the preferred activity. If Sam did not respond to an ELM instruction, the assessor re-issued the
instruction and provided a prompt using least-to-most intrusive prompting methods until the
child demonstrated the response without prompting or up to 3 prompted trials, whichever came
first. Following the prompting sequence, the assessor delivered access to the preferred activity
for 1-2 minutes. After reinforcement delivery, the assessor continued to the next ELM
instruction until all 40 ELM instructions were targeted.
Treatment Integrity and Observer Agreement
Treatment integrity data were collected on 10% of sessions. Treatment integrity was
scored using a fidelity checklist and direct observation by the investigator (see Appendix D for a
sample fidelity checklist). Average score on the treatment fidelity checklist across all assessors

COMPLIANCE AND BEHAVIORAL ASSESSMENT 27
was 94.6%. Interobserver agreement was conducted either by direct observation or by an
independent evaluator scoring a video recording of the session during 19% of all sessions
conducted (50% of ELM baseline sessions, 24% of total compliance training sessions, and 9% of
ELM probe sessions). Agreement was calculated using a Kappa coefficient for the child’s
correct and incorrect responses. Responses were scored by both raters giving the exact rating—
correct or incorrect—for each instruction delivered in the condition. Mean Kappa coefficient
calculated for sessions was 0.778. This is considered acceptable agreement.
Chapter 3: Results
The percent correct during compliance training sessions and total ELM scores across the
experimental conditions are displayed in Figures 3 and 4. Results indicate that compliance
training resulted in high rates of compliance with instructions for both participants. In addition,
ELM scores increased for both participants after compliance training sessions (32-50% of
mastery of the ELM). However, neither participant met mastery criteria of the ELM during
compliance training.
Baseline ELM Outcomes
During baseline assessments of the ELM, both participants demonstrated 10 failures in
each skill section for a total of 40 failures. Figure 1 displays the total number of items assessed
and the number of items tested in each skill section before 40 failures were identified. A total of
193 items were tested with Sam and a total of 129 items were tested with Bailey to establish a
baseline for the ELM.
Compliance Training Sessions

COMPLIANCE AND BEHAVIORAL ASSESSMENT 28
Figure 2 summarizes compliance with adult instructions for each participant during the
experimental conditions. Participants demonstrated an average of 97% (range 80-100%) correct
responses during compliance training sessions. The participants demonstrated 100% compliance
on 25 of the 35 compliance training sessions conducted.
Compliance Reversal Sessions
In contrast, compliance with instructions decreased during compliance reversal sessions
to an average of 87% (range 80-93%) across participants. Sam’s compliance with instructions
decreased to 90% during compliance reversal sessions. Bailey’s compliance with instructions
decreased to 84% during compliance reversal sessions (see Figures 3 and 4).
Following the compliance reversal, compliance training was re-instated with both
participants. Compliance with instructions increased to an average of 98% (range 80-100%)
across participants. Sam’s compliance with instructions increased to 96% and Bailey’s
compliance with instructions increased to 100%.
ELM Skill Area Outcomes
Figures 5 and 6 summarize the ELM skill acquisition for each participant during the
study. Both participants demonstrated an increase in ELM items following compliance training
than at baseline. Sam demonstrated the greatest increases in motor imitation and receptive
commands areas and more limited increases in the vocal imitation and expressive label skill
areas. With the exception of receptive commands, all of Sam’s skill areas decreased or were held
stagnant during the compliance reversal condition. Bailey demonstrated a decrease in 2 of the 4
skill areas with an increase in receptive commands and stagnant responding in the motor
imitation area. Both participants ELM scores returned to the levels demonstrated when

COMPLIANCE AND BEHAVIORAL ASSESSMENT 29
compliance training was re-instated. Following the two ELM skill training sessions, Sam
acquired an additional 8 items on the ELM over the previous assessment, an increase of 20% of
the total assessment items.
Chapter 4: Discussion
While behavioral assessments continue to be used in EIBIT programs to inform treatment
decisions, the variables that contribute to positive outcomes on these assessments are not widely
understood. The primary goal of this study was to assess the influence of compliance in EIBIT
behavioral assessments like the ELM. The findings above provide preliminary evidence that
variables like compliance may influence outcomes on these assessments. The introduction of a
reinforcement procedure for compliance with instructions unrelated to upcoming ELM probes
increased responding for both participants in ELM probes over baseline. Reversal of this
procedure decreased ELM scores in one participant and moderated ELM progress in the other.
Taken together, these results suggest that rate of learning assessments like the ELM may
not be a measure of skill acquisition alone. If ELM scores solely measured skill acquisition,
scores should remain stable or low following compliance training. Instead, the results presented
here suggest that the ELM score may be a composite of both skill acquisition (adding new skills
to a behavioral repertoire) and compliance (instructional control). These findings are significant
for several reasons including the accurate depiction of baseline responding, variability in
performance over time, and the implications for EIBIT standards of practice.
Accuracy of Measurement
If proponents of rate of learning assessments support that children who demonstrate
increases in skill acquisition in the initial months of EIBIT have better outcomes, it is important

COMPLIANCE AND BEHAVIORAL ASSESSMENT 30
that ELM baseline scores accurately reflect skills that are not in a child’s behavioral repertoire at
intake. However, the results indicated here suggest that baseline scores on the ELM may include
failures in skill and failures in compliance. For example, at baseline and during ELM probe
sessions Sam repeatedly identified the expressive labeling task of saxophone as “a trumpet.”
Compliance training was not sufficient to increase Sam’s performance on the task during any of
the assessments. However, when the correct answer was taught in the skill acquisition phase,
Sam met the mastery criteria for ‘saxophone’ on two consecutive assessments. This suggests a
failure in skill; saxophone was not established in the behavioral repertoire until the skill was
taught.
In contrast, at baseline Bailey responded to many of the ELM instructions with correct
terms but in a ‘silly monster voice.’ This behavior decreased during compliance training
sessions and resulted in improved scores on subsequent ELM assessments. The same type of
failure returned during compliance reversal sessions, dropping the mean ELM score across two
consecutive assessments. This suggests that Bailey’s compliance (i.e., responding to the
instructions with an appropriate vocalization) with ELM instructions rather than the skills
themselves may be influencing the ELM score.
Although compliance is not a skill specifically targeted on the ELM, the score increases
after compliance training suggest a percentage of both children’s baseline scores on the ELM
were directly related to compliance failures and not failures in skill. This has serious
implications for EIBIT programs that uses rate of learning assessments in outcomes data. If
large numbers of failures at baseline were related to compliance as in the case of Bailey, large
increases in rate of learning may be inflated at later assessments. Instead ELM scores should be

COMPLIANCE AND BEHAVIORAL ASSESSMENT 31
described as not only the acquisition of skills, but also learning to demonstrate these skills when
requested by an assessor.
Variability in Performance Across Time
Performance across the ELM skill areas was variable between and among each
participant. Sam demonstrated gains in some areas like motor imitation and receptive commands
with limited gains in vocal imitation and expressive labels. Bailey demonstrated gains in all skill
areas, but variability in demonstrating these skills across different ELM assessments. This
variability was not fully examined in the scope of this study but it does suggest that for both
children, ELM scores may be a composite of skill acquisition and other variables, rather than a
measurement of rate of learning alone.
The standard ELM protocol suggests removing items from the assessment battery once
demonstrated. Once the item is mastered it is considered mastered for the remainder of the
treatment probes, even though it is no longer tested. However, the current experimental protocol
tested all items during all ELM probes. Additional variability was identified for both Sam and
Bailey as a result of this variation in the assessment protocol. Some items were demonstrated in
the initial ELM probe following compliance training but not demonstrated in a later probe. After
additional compliance training sessions, the skills were again demonstrated in a subsequent
probe. This variability would not be captured in the standard ELM protocol and again indicates
that scores may not be an accurate measure of rate of learning alone.
It should be noted that neither participant met mastery criteria of the ELM during the
study. While the assessment items tested reflect the individualization procedure outlined in the
standard ELM protocol, it is possible that the assessment tasks themselves may need additional

COMPLIANCE AND BEHAVIORAL ASSESSMENT 32
examination. This could be addressed by systematic replication of the ELM procedure with
alternative lists of assessment items or replicating the compliance training procedure with a
different behavioral assessment used in EIBIT.
Implications for EIBIT
If there may be other variables present in the measurement of rate of learning assessments
like the ELM it should also be considered how these variables related to EIBIT outcomes. The
above findings suggest that addressing compliance as a component of EIBIT treatment may
result in increased scores on some behavioral assessments like the ELM regardless of what skills
are taught during EIBIT. It also suggests that the children who perform better on the ELM (and
subsequently are more strongly correlated with achieving normal functioning after treatment)
may also be more compliant with adult instructions.
What may be the more important question for EIBIT practitioners then is whether the
child must overcome barriers to compliance, barriers to skill, or a combination of both. While
the procedure of assessing the ELM may provide some anecdotal information to the practitioner,
the outcome data of the assessment alone does not indicate if and how much compliance
contributes to a particular child’s score. The assessment also does not capture if improvements
over time were the result of skill training or compliance training during EIBIT. This suggests
that a hybrid assessment that captures both rate of skill acquisition and compliance may be more
valuable to EIBIT practitioners. At minimum, a careful examination of the type of failures
(compliance or skill-related) demonstrated by each child in each assessment may be more
valuable in informing treatment conditions.
Limitations

COMPLIANCE AND BEHAVIORAL ASSESSMENT 33
Several limitations of the study warrant noting. Neither participant decreased compliance
to 0% during compliance reversal sessions. While the compliance reversal phase was kept short
to reduce risks to the participants, it suggests the phase may have been too short to fully capture
treatment effects (i.e., it may take equal or more sessions to fully reverse the compliance training
effects from the previous phase) or that the protocol may need refinement to allow for more
salient discrimination of the reinforcement contingencies by the participants. In addition, the
study was not implemented with children diagnosed with ASD, the population the ELM was
targeted for. If replicated with children with ASD, the relationship between compliance and skill
acquisition may differ. Additional research is needed to examine these questions.
Other Areas of Future Research
While refinements are necessary, at the very minimum the findings presented suggest that
alternative conclusions can be made from the results of behavioral assessments like the ELM.
Given that the ultimate goal of behavioral assessment is to inform practitioners, funding
agencies, and other stakeholders in making EIBIT treatment decisions, the outcomes of this
study present a strong case for a more thorough examination of the current field of practice. This
study lays the foundation for future research on the scope and depth of assessments in EIBIT.
Practitioners and researchers should examine which behavioral assessments are
influenced by unaccounted variables like compliance, as well as should work to identify the most
effective methods to systematically determine the influence of these variables. Future research
should identify necessary refinements to current assessments in EIBIT to increase sensitivity to
compliance and skill acquisition, since improved measurement may subsequently lead to
improved treatment outcomes.

COMPLIANCE AND BEHAVIORAL ASSESSMENT 34
References
Cataldo, M. F., Ward, E. M., Russo, D. C., Riordan, M., & Bennett, D. (1986). Compliance and
correlated problem behavior in children: Effects of contingent and noncontingent
reinforcement. Analysis and Intervention in Developmental Disabilities, 6, 265-282.
Chasson, G. S., Harris, G. E., & Neely, W. J. (2007). Cost comparison of early intensive
behavioral intervention and special education for children with autism. Journal of Child
and Family Studies, 16(3), 401-413.
Cooper, J., Heron, T., & Heward., W. (2007). Applied Behavior Analysis. (2nd ed.) Upper Saddle
River, NJ: Pearson.
Eldevik, S., Hastings, R. P., Hughes, J. C., Jahr, E., Eikeseth, S., & Cross, S. (2009). Meta-
analysis of early intensive behavioral intervention for children with autism. Journal of
Clinical Child & Adolescent Psychology, 38(3), 439-450.
Ganz, M. L. (2007). The lifetime distribution of the incremental societal costs of autism.
Archives of pediatrics & adolescent medicine, 161(4), 343-349.
Killu, K. (1999). High-probability request research: Moving beyond compliance. Education and
Treatment of Children, 470-491.
Lavelle, T. A., Weinstein, M. C., Newhouse, J. P., Munir, K., Kuhlthau, K. A., & Prosser, L. A.
(2014). Economic burden of childhood autism spectrum disorders. Pediatrics, 133(3),
520-529.
Leigh, J. P., & Du, J. (2015). Brief report: forecasting the economic burden of autism in 2015
and 2025 in the United States. Journal of Autism and Developmental Disorders, 45(12),
4135-4139.

COMPLIANCE AND BEHAVIORAL ASSESSMENT 35
Libby, M. E., Weiss, J. S., Bancroft, S., & Ahearn, W. H. (2008). A Comparison of Most-to-
Least and Least-to-Most Prompting on the Acquisition of Solitary Play Skills. Behavior
Analysis in Practice, 1, 37-43
Lord, C., DiLavore, P. C., & Gotham, K. (2012). Autism diagnostic observation schedule.
Torrance, CA: Western Psychological Services.
Lovaas, O. I. (1987). Behavioral treatment and normal education and intellectual functioning in
young autistic children. Journal of Consulting and Clinical Psychology. 55, 3-9.
Lovaas, O. I. (2003). Teaching Individuals With Developmental Delays: Basic Intervention
Techniques. PRO-ED, Inc.: Austin, TX.
Lovaas, O. I., & Smith, T. (1988). Intensive behavioral treatment for young autistic children. In
Advances in clinical child psychology (pp. 285-324). Springer US.
MacDonald, R., Parry-Cruwys, D., Dupere, S., & Ahearn, W. (2014). Assessing progress and
outcome of early intensive behavioral intervention for toddlers with autism. Research in
developmental disabilities, 35(12), 3632-3644.
Mace, F. C., Hock, M. L., Lalli, J. S., West, B. J., Belfiore, P., Pinter, E., & Brown, D. K. (1988).
Behavioral momentum in the treatment of noncompliance. Journal of Applied Behavior
Analysis, 21, 123-141.
McComas, J. J., Wacker, D. P., & Cooper, L. J. (1998). Increasing compliance with medical
procedures: Application of the high-probability request procedure to a toddler. Journal
of Applied Behavior Analysis, 31, 287–290.

COMPLIANCE AND BEHAVIORAL ASSESSMENT 36
McEachin, J.J., Smith, T., & Lovaas, O.I. (1993). Long-term outcome for children with autism
who received early intensive behavioral treatment. American Journal on Mental
Retardation. 97, 359-372.
Nelson, R. O., & Hayes, S. C. (1979). The nature of behavioral assessment: A commentary.
Journal of Applied Behavior Analysis, 12, 491-500.
Reichow, B. (2012). Overview of meta-analyses on early intensive behavioral intervention for
young children with autism spectrum disorders. Journal of Autism and Developmental
Disorders, 42, 512-520.
Rogers, S. J., & Vismara, L. A. (2008). Evidence-based comprehensive treatments for early
autism. Journal of Clinical Child & Adolescent Psychology, 37, 8-38.
Russo, D. C., Cataldo, M. F., & Cushing, P. J. (1981). Compliance training and behavioral
covariation in the treatment of multiple behavior problems. Journal of Applied Behavior
Analysis, 14, 209-222.
Sallows, G. O., & Graupner, T. D. (2005). Intensive behavioral treatment for children with
autism: Four-year outcome and predictors. American Journal on Mental Retardation,
110, 417-438.
Schoen, S. F. (1983). The status of compliance technology: Implications for programming. The
Journal of Special Education, 17, 483-496.
Schopler, E., Reichler, R. J., & Renner, B. R. (2002). The childhood autism rating scale (CARS).
Los Angeles: Western Psychological Services.

COMPLIANCE AND BEHAVIORAL ASSESSMENT 37
Smith, T., Buch, G. A., & Gamby, T. E. (2000). Parent-directed, intensive early intervention for
children with pervasive developmental disorder. Research in developmental disabilities,
21, 297-309.
Smith, T., Groen, A. D., & Wynn, J. W. (2000). Randomized trial of intensive early intervention
for children with pervasive developmental disorder. American Journal on Mental
Retardation, 105, 269-285.
Weiss, M. J. (1999). Differential rates of skill acquisition and outcomes of early intensive
behavioral intervention for autism. Behavioral Interventions, 14, 3-22.
Weiss, M. J., & Delmolino, L. (2006). The relationship between early learning rates and
treatment outcome for children with autism receiving intensive home-based applied
behavior analysis. The Behavior Analyst Today, 7, 96-110.
Wilder, D. A., Fischetti, A. T., Myers, K., Leon‐ Enriquez, Y., & Majdalany, L. (2013). The
effect of response effort on compliance in young children. Behavioral Interventions,
28(3), 241-250.
Zuluaga, C., & Normand, M. (2008). An evaluation of the high-probability instruction sequence
with and without programmed reinforcement for compliance with high-probability
instructions. Journal of Applied Behavior Analysis, 41, 453–457.

COMPLIANCE AND BEHAVIORAL ASSESSMENT 38
Appendix A: Figures
Table 1
Number of Items Assessed to Establish Early Learning Measure Baseline
Sam Bailey
ELM Skill Area Baseline 1 Baseline 2 Baseline 1 Baseline 2
Motor Imitation 39 14 16 13
Vocal Imitation 28 15 14 20
Expressive Labels 33 19 15 20
Receptive Commands 27 18 13 18
Total Items Tested 127 66 58 71
Figure 1. Number of Items Assessed to Establish Early Learning Measure Baseline. This table
represents the total number of items tested across each of the four skill areas of the Early
Learning Measure required to establish baseline with participants Sam and Bailey. Testing was
discontinued in each section when 10 failures were identified.

COMPLIANCE AND BEHAVIORAL ASSESSMENT 39
Table 2
Mean Percentage of Correct Responses During Experimental Sessions
Sam Bailey
Experimental Phase M SD Range M SD Range
ELM Baseline Probes 69% 0.14 (50-89%) 49% 0.14 (29-71%)
Compliance Training 95% 6.40 (80-100%) 98% 5.23 (80-100%)
Compliance Reversal 90% 1.84 (88-93%) 84% 6.16 (80-93%)
Compliance Training 96% 8.94 (80-100%) 100% 0 100%
ELM Task Training 55% 24.04 (38-72%) ** ** **
Figure 2. Mean Percentage of Correct Responses During Experimental Sessions. This table
displays the mean percentage of responding to instructions, standard deviation, and range across
each experimental phase with participants Sam and Bailey. Due to scheduling restrictions, ELM
Task Training was not completed with Bailey during the study.

COMPLIANCE AND BEHAVIORAL ASSESSMENT 40
Figure 3. Percentage of correct responses during compliance training and reversal sessions and
ELM scores for participant Sam. This graph represents the raw ELM scores during baseline and
ELM probe sessions as outlined on the right y-axis. Percent compliance across compliance
training, compliance reversal and ELM task training conditions is represented on the left y-axis.
0
5
10
15
20
25
30
35
40
0
10
20
30
40
50
60
70
80
90
100
1 2 3 4 5 6 7 8 9 10 11 12 13 14 15 16 17 18 19 20 21 22 23 24 25 26 27 28 29 30 31 32 33 34 35
Nu
mb
er C
orr
ect
on
EL
M
Per
cen
t C
orr
ect
Sessions
Effects of Compliance Training on ELM Scores
% Compliance ELM Probe Score
Compliance Training Compliance
Reversal
Compliance
TrainingELM
Baseline
ELM Task
Training

COMPLIANCE AND BEHAVIORAL ASSESSMENT 41
Figure 4. Percentage of correct responses during compliance training and reversal sessions and
ELM scores for participant Bailey. This graph represents the raw ELM scores during baseline
and ELM probe sessions as outlined on the right y-axis. Percent compliance across compliance
training, compliance reversal and ELM task training conditions is represented on the left y-axis.
0
5
10
15
20
25
30
35
40
0
10
20
30
40
50
60
70
80
90
100
1 2 3 4 5 6 7 8 9 10 11 12 13 14 15 16 17 18 19 20 21 22 23 24 25 26 27 28 29 30 31 32 33 34 35 36 37 38
Nu
mb
er C
orr
ect
on
EL
M
Per
cen
t C
orr
ect
Sessions
Effects of Compliance Training on ELM Scores
% Compliance ELM Probe Score
Compliance TrainingCompliance
Reversal Compliance Training
ELM
Baseline

COMPLIANCE AND BEHAVIORAL ASSESSMENT 42
Figure 5. Scores on the Early Learning Measure for Sam. ELM scores are graphed across each
skill area tested during baseline, compliance training, compliance reversal, and re-instating
compliance training.
0123456789
10
Co
rrec
t R
espo
nse
s
Session
Motor Imitation
0123456789
10
Corr
ect
Res
pon
ses
Session
Vocal Imitation
0123456789
10
Corr
ect
Res
pon
ses
Session
Expressive Labels
0123456789
10
Co
rrec
t R
espo
nse
s
Session
Receptive Commands

COMPLIANCE AND BEHAVIORAL ASSESSMENT 43
Figure 6. Scores on the Early Learning Measure for Bailey. ELM scores are graphed across
each skill area tested during baseline, compliance training, and compliance reversal.
0
1
2
3
4
5
6
7
8
9
10
B1 B2 1 2 3 4 Reversal
1
Reversal
2
5
Corr
ect
Res
pon
ses
Session
Motor Imitation
0
1
2
3
4
5
6
7
8
9
10
B1 B2 1 2 3 4 Reversal
1
Reversal
2
5
Co
rrec
t R
esp
onse
s
Session
Vocal Imitation
0
1
2
3
4
5
6
7
8
9
10
B1 B2 1 2 3 4 Reversal
1
Reversal
2
5
Co
rrec
t R
esp
onse
s
Session
Expressive Labels
0
1
2
3
4
5
6
7
8
9
10
B1 B2 1 2 3 4 Reversal
1
Reversal
2
5
Corr
ect
Res
pon
ses
Session
Receptive Commands

COMPLIANCE AND BEHAVIORAL ASSESSMENT 44
Appendix B: Sample Data Sheets
Appendix B.1. Sample Early Learning Measure Probe Data Collection Form. This data sheet was
used to collect observational assessment data for Motor Imitation and Vocal Imitation Sections
of the Early Learning Measure Probe Sessions. Similar data collection forms were used for
Receptive Commands and Expressive Labels sections.

COMPLIANCE AND BEHAVIORAL ASSESSMENT 45
Appendix B.2. Sample Early Learning Measure Baseline Data Collection Form. This data sheet
was used to collect observational assessment data for the Motor Imitation section of the Early
Learning Measure baseline sessions. Similar data sheets were used for the other ELM sections.

COMPLIANCE AND BEHAVIORAL ASSESSMENT 46
Appendix B.3. Sample Compliance Training Data Collection Form. This data sheet was used to
collect compliance data during two compliance training sessions for both participants. 10
instructions were delivered per session. Similar data sheets were used for the compliance
reversal sessions.

COMPLIANCE AND BEHAVIORAL ASSESSMENT 47
Appendix C: Sample Session Instructions
Early Learning Measure Baseline & Probe Session Instructions
1. Gather all materials. You will need the following items for both ELM baseline and probe sessions:
a. Two chairs (preferably a child-sized chair)
b. Table
c. Reinforcement activities or toys
d. Current ELM session data sheet
e. Writing instrument for data collection
f. iPod and stand
g. 3D & 2D stimuli for testing (see ELM data sheet for test items).
2. Prepare the testing area.
a. Arrange the table and chairs according to Diagram 1. Chairs should be facing each other and
placed beside the table. Avoid placing the chairs in front of a window or source of bright light
which will diminish the quality of the video.
b. Arrange the iPod and stand according to Diagram 1. Place the iPod in the stand so that the
camera will film horizontally or in landscape mode. Verify under the “usage” settings that you
have sufficient storage space on the Ipod to complete the video. Position the camera to face the
testing area, with the screen facing away from the chairs (to avoid distractions from the video).
c. Prepare the data sheet. Write the date of testing, the child’s initials, and the start time of the
assessment on the top of the data sheet.
d. Place any stimuli needed for the first test condition on the table. Start with whichever section
seems likely to be most successful for the child.
3. ELM Administration
a. Turn on the iPod recording. Open the camera app. Select video. Push the red button to begin
recording.
b. Begin the ELM away from the chair by reinforcer sampling to determine an effective
reinforcer and engage the child. After successfully engaging the child with a reinforcer, or
failing to engage the child with five possible reinforcers, take the child to the chair with minimal
prompting, sit down and immediately give the first instruction.
c. Give the SD listed on the data sheet and observe the response. The child has 5 seconds to
respond regardless of child’s level of attention or compliance. Do not wait for eye contact, or for
the child to be silent before giving the SD. Make sure to only state the SD once.
d. All feedback is noncontingent. Whether or not the child responds, or responds correctly, the
examiner’s voice is a neutral, “OK.” On every third trial, give a neutral, “OK,” and then reinforce
with the child’s preferred reinforcement: tickles, toys, food, or any primary reinforcer.
e. Correct Response. If the child responds correctly within 5 seconds, it is considered a plus (+)
(correct), but again the examiner’s voice remains a neutral, “OK,” and immediately move on to the
next item.
f. Incorrect Response: If the child responds incorrectly within 5 seconds, does not respond within
5 seconds, or refuses, tantrums, aggresses, bolts, or disrupts the environment without giving the

COMPLIANCE AND BEHAVIORAL ASSESSMENT 48
correct response within 5 seconds, give a neutral, “OK,” and score a minus (-) (incorrect), and
immediately move on to the next item. Next to the - , circle the error occurred for the instruction.
g. Never prompt the correct response in any manner. Respond and redirect as minimally to any
challenging or off-task behavior as is necessary.
h. If the child has bolted, go to the child and return him to the table with the minimal
prompting necessary. If the child fails to come to the table with your prompting within 10
seconds, return to the table to record the trial on the data sheet, counting the trial as a failure. If
the child fails to come to the table on three consecutive trials within 10 seconds each, or continues
verbally refusing, tantrumming, aggressing, or disrupting on three consecutive trials, count the rest
of the items in the section as a failure. Take a normal break and, after the break, and with a new
section, start again attempting to bring the child to the table for each trial, if necessary.
i. Items should be administered in the order presented on the data sheet, and then repeated to
complete the section. During baseline, continue until 10 failed items occur in each section.
During probe sessions, simply test the items on the data sheet in the order listed.
j. After you have reached the end of the first section, take a small break from the chairs.
Breaks should not be longer than 3 minutes and should not include the contracted reinforcement.
The child may request to continue the assessment in order to return to the reinforcement activity.
k. After the break, move onto the other three sections. Give a break at least between every
section. Follow the procedures as above.
l. After the end of the testing concludes, stop the video recording. Record the end time of the
administration for the ELM on the data sheet.
4. ELM Scoring
a. Mastery requires correctly responding to the item for both trials on the same day. If one trial
on the item was correct or a (+), but the other trial had no response or a (-), the item as a whole is
considered incorrect (-) or a failure. See these samples:
1. Arms out + - = - (incorrect)
2. Clap twice + + = + (correct)
3. Touch head - ___ = - (incorrect)
1. Remember that if the child does not respond correctly within 5 seconds, it is considered incorrect
(-) or a failure. Disruptive behavior or failure to get the child to the table within 10 seconds is also
a failure.
2. Baseline ELM Scores: The resulting score of both baseline ELM’s should be 0/10 in every
section.
3. Probe Session ELM Scores: Scores on subsequent ELM’s should show the cumulative success
to date for each section, adding in any previously discontinued mastered items. So, for example,
on ELM #2, on the Motor Imitation section, the child got 4/10 correct. On ELM #3 on the Motor
Imitation section, only the 6 remaining were administered, and the child got two more correct. So
his cumulative score for the ELM #3 was 6/10.
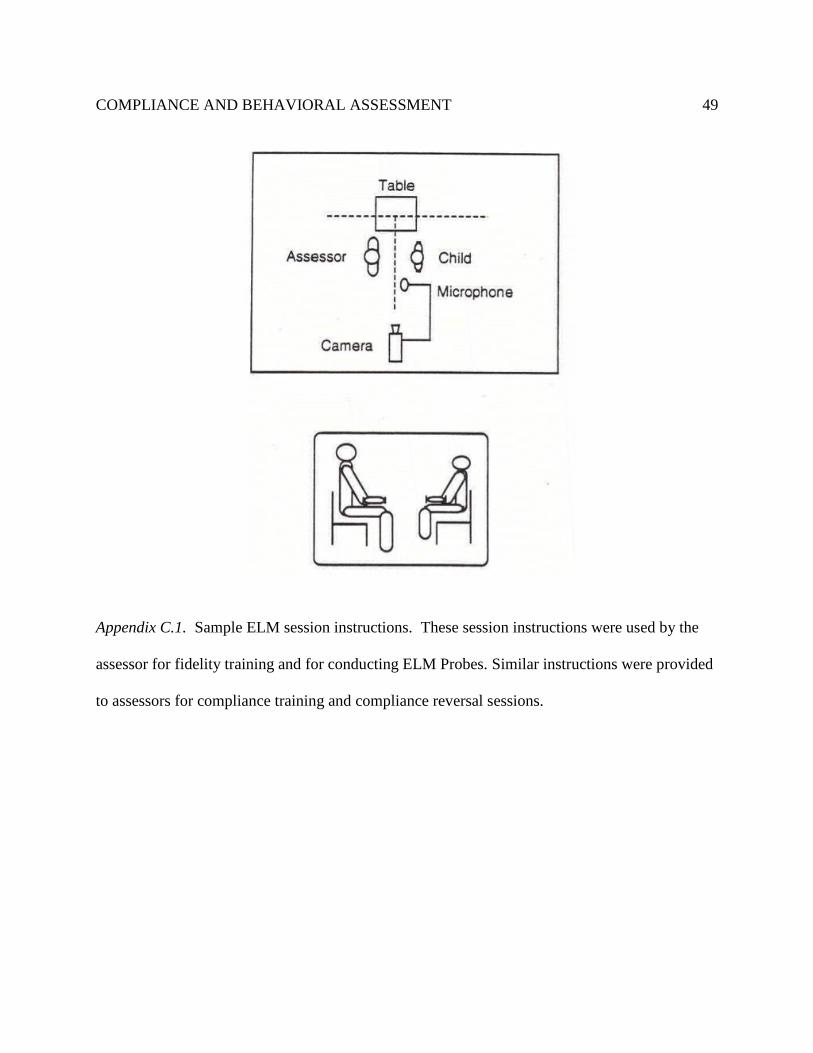
COMPLIANCE AND BEHAVIORAL ASSESSMENT 49
Appendix C.1. Sample ELM session instructions. These session instructions were used by the
assessor for fidelity training and for conducting ELM Probes. Similar instructions were provided
to assessors for compliance training and compliance reversal sessions.

COMPLIANCE AND BEHAVIORAL ASSESSMENT 50
Appendix D: Sample Assessor Fidelity Checklist
Date:
Session/Video Code:
Assessor:
Observer:
Baseline Fidelity Procedure: Observer should record accuracy of assessors performance for all responses in steps 1-
3 & 11. For all other steps, observer should record fidelity data on every 5th instruction administered by the observer
(minimum of 2 per each ELM test set).
In order to receive a score of Y for the step, the assessor must complete with 90% accuracy. Target is a minimum
of 11 of the 12 fidelity steps scored as a Y per each assessment administration.
ELM -Baseline Session Summary Sheet
Steps Description Score Notes
1
Did the assessor prepare the testing area as outlined? Must have 3/3:
- Are the table and chairs arranged according to the diagram?
- Is the proper data sheet present?
- Are the stimuli for the ELM test section readily available?
Y
N
2
Did the assessor verify the iPod function? Must have 3/3:
- Is the iPod positioned arranged according to the diagram?
- Did the assessor confirm sufficient storage on the Ipod?
- Did the assessor open the camera app and begin recording at the onset of the
testing?
Y
N
3
Did the assessor conduct reinforcement sampling prior to engaging the child in
the ELM? Must have 1/1:
- Did the assessor identify at least 1 possible reinforcer before beginning a test
item or did the assessor sample a maximum of five possible reinforcers before
beginning?
Y
N
4
Did the assessor give the SD listed on the data sheet with 90% accuracy?
- Possible SD’s (Motor Imitation: “Do This” followed by model of target;
Vocal Imitation: “Say” followed by model of target; Expressive Labels:
“What’s this?” paired with the presentation of the item; Receptive Commands:
Delivery of Instruction)
Y
N
5 Did the assessor give the SD only 1 time regardless of child’s compliance or
attention with 90% accuracy?
Y
N
6 Did the assessor deliver non-contingent “OK” feedback and access to 1-2 min of
reinforcement after every 3rd instruction with 90% accuracy?
Y
N

COMPLIANCE AND BEHAVIORAL ASSESSMENT 51
7
Did the assessor respond to correct responses according to the procedure with
90% accuracy ?
- Did the assessor identify correct responses as correct during the assessment?
- Did the assessor deliver a neutral “OK” and move on to the next item?
- Did the assessor record a + on the data sheet?
- Did the assessor test each correct response a second time before scoring as
mastered?
Y
N
8
Did the assessor respond to incorrect responses according to the procedure with
90% accuracy?
- Did the assessor identify all incorrect responses as incorrect during the
assessment?
- Did the assessor deliver a neutral “OK” and move on to the next item?
- Did the assessor record a - on the data sheet and the corresponding error?
- Did the assessor avoid prompting the correct response?
Y
N
9
Did the assessor respond to challenging behavior appropriately with 90%
accuracy?
- Did the assessor provide minimal attention to challenging behavior?
- If the child leaves the testing area did the assessor count the item as an error
and attempt to bring the child back to the table?
- If the child refuses to respond to 3 consecutive trials, did the assessor
discontinue testing the section and provide a break?
Y
N
10
Did the assessor continue testing items until 10 failures in the section were
identified or until 120 items were tested with 90% accuracy?
- Did the assessor test 10 items in a row, then re-test the 10 items again?
- Did the assessor add additional items of increasing difficulty?
- Did the assessor discontinue testing after 120 items?
Y
N
11
Did the assessor deliver a break after each section with 90% accuracy?
- Did the assessor withhold reinforcement during the break?
- Did the assessor begin testing after a maximum of 3 minutes?
Y
N
12 At the end of the testing session, did the assessor stop the video and record the
end time of testing on the data sheet?
Y
N

COMPLIANCE AND BEHAVIORAL ASSESSMENT 52
Individual Instruction Fidelity Sheet - Record data on every 5th instruction delivered during the ELM baseline
condition.
Instruction (copy items from
the child’s ELM data sheet) Correct
SD Deliver
SD 1x
“OK”
1-2 min
Sr+ Delivered
(every
third
trial)
If
correct
was
scored
as
correct
If
incorrect
was
scored
as
incorrect
No
prompts
Respond to
Challenging
Bx
according
to
procedure?
Correctly
Continued
or
Correctly
Stopped
Testing?
Appendix D.1. Sample ELM Assessor Fidelity Checklist. These fidelity checklists were used by
the investigator for fidelity training with each assessor conducting ELM Probes. Similar fidelity
checklists were implemented for compliance training and compliance reversal sessions.

COMPLIANCE AND BEHAVIORAL ASSESSMENT 53
Appendix E: Institutional Revie w Board Approval
720 4th Avenue South AS 210, St. Cloud, MN 56301-4498
Institutional Review Board (IRB)
Advisor Dr. Benjamin Witts
Address
Email: [email protected]
Project Title: The role of compliance in Behavioral Assessment
,
If we can be of further assistance, feel free to contact the IRB at 320-308-3290 or email [email protected] and please reference the SCSU IRB number when corresponding.
The Institutional Review Board has reviewed your protocol to conduct research involving human subjects. Your project has been: APPROVED
SCSU IRB# 1670 - 2086
OFFICE USE ONLY
IRB PROTOCOL
DETERMINATION:
Today's Date: 1/27/2017
USA
2nd Year Approval Date:1st Year Approval Date: 1/18/2017
1st Year Expiration Date: 2nd Year Expiration Date:
3rd Year Approval Date:
3rd Year Expiration Date:
Please note the following important information concerning IRB projects:
- The principal investigator assumes the responsibilities for the protection of participants in this project. Any adverse events must be reported to the IRB as soon as possible (ex. research related injuries, harmful outcomes, significant withdrawal of subject population, etc.).
- For expedited or full board review, the principal investigator must submit a Continuing Review/Final Report form in advance of the expiration date indicated on this letter to report conclusion of the research or request an extension.
-Exempt review only requires the submission of a Continuing Review/Final Report form in advance of the expiration date indicated in this letter if an extension of time is needed.
- Approved consent forms display the official IRB stamp which documents approval and expiration dates. If a renewal is requested and approved, new consent forms will be officially stamped and reflect the new approval and expiration dates.
- The principal investigator must seek approval for any changes to the study (ex. research design, consent process, survey/interview instruments, funding source, etc.). The IRB reserves the right to review the research at any time.
Exempt Review
Type: Exempt Review
Name: Amy Sippl
Dr. Latha RamakrishnanInterim Associate Provost for ResearchDean of Graduate Studies
IRB Institutional Official: