composite highway bridge design: worked · pdf fileworked example 1: multi-girder two-span...
TRANSCRIPT

Composite Highway BridgeDesign: Worked Examples
P357 Composite Highway Bridge Design: Worked ExamplesC
reat
ed o
n 16
Apr
il 20
12T
his
mat
eria
l is
copy
right
- a
ll rig
hts
rese
rved
. Use
of t
his
docu
men
t is
subj
ect t
o th
e te
rms
and
cond
ition
s of
the
Ste
elbi
z Li
cenc
e A
gree
men
t
SCI (The Steel Construction Institute) is the leading, independent provider of technical expertise and disseminator of best practice to the steel construction sector. We work in partnership with clients, members and industry peers to help build businesses and provide competitive advantage through the commercial application of our knowledge. We are committed to offering and promoting sustainable and environmentally responsible solutions.
Our service spans the following five areas:
Membership Individual and corporate membership
Technical information Courses Publications Online reference tools Education Codes and standards
Construction solutions Sustainability Product development Research Engineering solutions
Communications technology Websites Communities Design tools
Assessment SCI assessed
The Steel Construction Institute, Silwood Park, Ascot, Berkshire, SL5 7QN. Telephone: +44 (0) 1344 636525 Fax: +44 (0) 1344 636570 Email: [email protected] For information on publications, telephone direct: +44 (0) 1344 636513 or Email: [email protected] For information on courses, telephone direct: +44 (0) 1344 636500 or Email: [email protected] World Wide Web site: www.steel-sci.org 24 X 7 technical information: www.steelbiz.org
P357 Composite Highway Bridge Design: Worked ExamplesC
reat
ed o
n 16
Apr
il 20
12T
his
mat
eria
l is
copy
right
- a
ll rig
hts
rese
rved
. Use
of t
his
docu
men
t is
subj
ect t
o th
e te
rms
and
cond
ition
s of
the
Ste
elbi
z Li
cenc
e A
gree
men
t

SCI PUBLICATION P357
Composite highway bridge design:
Worked Examples In accordance with Eurocodes and the UK National Annexes
D C ILES MSc ACGI DIC CEng MICE
Published by: The Steel Construction Institute Silwood Park Ascot Berkshire SL5 7QN Tel: 01344 636525 Fax: 01344 636570
P357 Composite Highway Bridge Design: Worked ExamplesC
reat
ed o
n 16
Apr
il 20
12T
his
mat
eria
l is
cop
yrig
ht -
all
right
s re
serv
ed.
Use
of
this
doc
umen
t is
sub
ject
to
the
term
s an
d co
nditi
ons
of t
he S
teel
biz
Lice
nce
Agr
eem
ent

P357-frontpages.doc ii Printed 17/03/10
2010 The Steel Construction Institute
Apart from any fair dealing for the purposes of research or private study or criticism or review, as permitted under the Copyright Designs and Patents Act, 1988, this publication may not be reproduced, stored or transmitted, in any form or byany means, without the prior permission in writing of the publishers, or in the case of reprographic reproduction only in accordance with the terms of the licences issued by the UK Copyright Licensing Agency, or in accordance with the termsof licences issued by the appropriate Reproduction Rights Organisation outside the UK.
Enquiries concerning reproduction outside the terms stated here should be sent to the publishers, The Steel ConstructionInstitute, at the address given on the title page.
Although care has been taken to ensure, to the best of our knowledge, that all data and information contained herein areaccurate to the extent that they relate to either matters of fact or accepted practice or matters of opinion at the time ofpublication, The Steel Construction Institute, the authors and the reviewers assume no responsibility for any errors in ormisinterpretations of such data and/or information or any loss or damage arising from or related to their use.
Publications supplied to the Members of the Institute at a discount are not for resale by them.
Publication Number: SCI P357
ISBN-13: 978-1-85942-195-6
British Library Cataloguing-in-Publication Data.
A catalogue record for this book is available from the British Library.
P357 Composite Highway Bridge Design: Worked ExamplesC
reat
ed o
n 16
Apr
il 20
12T
his
mat
eria
l is
copy
right
- a
ll rig
hts
rese
rved
. Use
of t
his
docu
men
t is
subj
ect t
o th
e te
rms
and
cond
ition
s of
the
Ste
elbi
z Li
cenc
e A
gree
men
t
P357-frontpages_Nov 2010.doc iii Printed 12/11/10
FOREWORD
This publication is the second of two SCI bridge design guides that reflect the rules in the Eurocodes. It gives two worked examples, one for a multi-girder bridge and one for a ladder deck bridge. It is a companion to a publication giving general guidance on composite highway bridge design.
The guidance in this publication has been developed from earlier well-established guidance in a number of SCI bridge design guides. The previous guides referred to BS 5400 for the basis of design.
The publication was prepared by David Iles, of The Steel Construction Institute. A technical review of the examples, to confirm compliance with the Eurocode rules, was carried out by Atkins. Thanks are expressed to Chris Hendy, Rachel Jones and Jessica Sandberg, all of Atkins, for their comments.
The work leading to this publication was funded by Tata Steel †.
† This publication includes references to Corus, which is a former name of Tata Steel in Europe
P357 Composite Highway Bridge Design: Worked ExamplesC
reat
ed o
n 16
Apr
il 20
12T
his
mat
eria
l is
copy
right
- a
ll rig
hts
rese
rved
. Use
of t
his
docu
men
t is
subj
ect t
o th
e te
rms
and
cond
ition
s of
the
Ste
elbi
z Li
cenc
e A
gree
men
t
P357-frontpages.doc iv Printed 17/03/10
P357 Composite Highway Bridge Design: Worked ExamplesC
reat
ed o
n 16
Apr
il 20
12T
his
mat
eria
l is
copy
right
- a
ll rig
hts
rese
rved
. Use
of t
his
docu
men
t is
subj
ect t
o th
e te
rms
and
cond
ition
s of
the
Ste
elbi
z Li
cenc
e A
gree
men
t

P357-frontpages.doc v Printed 17/03/10
Contents
Page No.
FOREWORD iii
SUMMARY vi
INTRODUCTION 1
WORKED EXAMPLE 1: Multi-girder two-span bridge with integral abutments 3
WORKED EXAMPLE 2: Ladder deck three-span bridge 69
REFERENCES 129
P357 Composite Highway Bridge Design: Worked ExamplesC
reat
ed o
n 16
Apr
il 20
12T
his
mat
eria
l is
copy
right
- a
ll rig
hts
rese
rved
. Use
of t
his
docu
men
t is
subj
ect t
o th
e te
rms
and
cond
ition
s of
the
Ste
elbi
z Li
cenc
e A
gree
men
t
P357-frontpages.doc vi Printed 17/03/10
SUMMARY
This publication presents worked examples of the detailed design of two composite highway bridges. Each bridge is formed by steel girders acting compositely with a reinforced concrete deck slab. The first example is of multi-girder form, the second is of ladder-deck form. The examples cover the principal steps in the verification of the designs in accordance with the Eurocodes, as implemented by the UK National Annexes.
The publication is complementary to SCI publication P356, Composite highway bridge design, which describes both forms of construction and presents general guidance and an introduction to the relevant detailed requirements of the Eurocodes.
P357 Composite Highway Bridge Design: Worked ExamplesC
reat
ed o
n 16
Apr
il 20
12T
his
mat
eria
l is
copy
right
- a
ll rig
hts
rese
rved
. Use
of t
his
docu
men
t is
subj
ect t
o th
e te
rms
and
cond
ition
s of
the
Ste
elbi
z Li
cenc
e A
gree
men
t
P357-frontpages.doc 1 Printed 17/03/10
INTRODUCTION
This publication presents two worked examples of the design of composite highway bridges using beam and slab construction. The evaluations of design values of actions (loads), action effects (bending moments, shears, etc.) resistances (of cross sections and of members in buckling) and limiting SLS criteria are carried out in accordance with the Eurocodes, as implemented by the UK National Annexes. Reference is made to selected documents providing non-contradictory complementary information.
References are made in the right-hand margins of the sheets to relevant clauses of the Eurocode Part, National Annex or other document. For brevity, the Eurocodes are designated as, for example, ‘3-1-5’, meaning BS EN 1993-1-5 and its National Annex. National Annex clause numbers are all prefixed ‘NA’.
The two examples are:
1. A two-span integral bridge, each span 28 m, carrying a two-lane roadway. The reinforced concrete deck acts compositely with four main girders of constant depth. The example shows the calculation of action effects (from the results of a computer global analysis) and the verification of the main girders in bending and shear. The adequacy of a bolted splice in the main girders is verified. Fatigue assessment is carried out for certain key details.
2. A three-span ladder deck bridge, spans 24.5 m, 42 m , 24 5 m, also carrying a two-lane roadway. The reinforced concrete deck acts compositely with a ladder-deck configuration of two main girders, at 11.7 m centres, and cross girders at 3.5 m centres. The main girders are of variable depth. The example shows the calculation of action effects (from the results of a computer global analysis) and the verification of the main girders and cross girders in bending and shear. The adequacy of the bolted connection between main girders and cross girders is verified. Fatigue assessment is carried out for certain key details.
The detailed design of the deck slab, for local loading, is not covered in either example.
P357 Composite Highway Bridge Design: Worked ExamplesC
reat
ed o
n 16
Apr
il 20
12T
his
mat
eria
l is
copy
right
- a
ll rig
hts
rese
rved
. Use
of t
his
docu
men
t is
subj
ect t
o th
e te
rms
and
cond
ition
s of
the
Ste
elbi
z Li
cenc
e A
gree
men
t
P357-frontpages.doc 2 Printed 17/03/10
P357 Composite Highway Bridge Design: Worked ExamplesC
reat
ed o
n 16
Apr
il 20
12T
his
mat
eria
l is
copy
right
- a
ll rig
hts
rese
rved
. Use
of t
his
docu
men
t is
subj
ect t
o th
e te
rms
and
cond
ition
s of
the
Ste
elbi
z Li
cenc
e A
gree
men
t

P357-example1-D06.doc 3
WORKED EXAMPLE 1: Multi-girder two-span bridge with integral abutments Index Section Page No.
1 Structural arrangement 5
2 Design basis 6
3 Actions on the bridge 11
4 Girder make-up and slab reinforcement 16
5 Beam cross sections 17
6 Global analysis 22
7 Design values of the effects of combined actions 27
8 Verification of bare steel girder during construction 32
9 Verification of composite girder 36
10 Longitudinal shear 44
11 Fatigue assessment 48
12 Main girder splices 54
13 Transverse web stiffeners 62
14 Bracing 67
P357 Composite Highway Bridge Design: Worked ExamplesC
reat
ed o
n 16
Apr
il 20
12T
his
mat
eria
l is
copy
right
- a
ll rig
hts
rese
rved
. Use
of t
his
docu
men
t is
subj
ect t
o th
e te
rms
and
cond
ition
s of
the
Ste
elbi
z Li
cenc
e A
gree
men
t

P357-example1-D06.doc 4
P357 Composite Highway Bridge Design: Worked ExamplesC
reat
ed o
n 16
Apr
il 20
12T
his
mat
eria
l is
copy
right
- a
ll rig
hts
rese
rved
. Use
of t
his
docu
men
t is
subj
ect t
o th
e te
rms
and
cond
ition
s of
the
Ste
elbi
z Li
cenc
e A
gree
men
t
Job No. BCR113 Sheet 1 of 64 Rev A
Job Title Composite highway bridges: Worked examples
Subject Example 1: Multi-girder two-span bridge Section 1: Structural arrangement
Made by DCI Date July 2009
Silwood Park, Ascot, Berks SL5 7QN Telephone: (01344) 636525 Fax: (01344) 636570 CALCULATION SHEET
Client
SCI Checked by JMS Date Sep 2009
P357-example1-D06.doc 5 Printed 17/03/2010
1 Structural arrangement
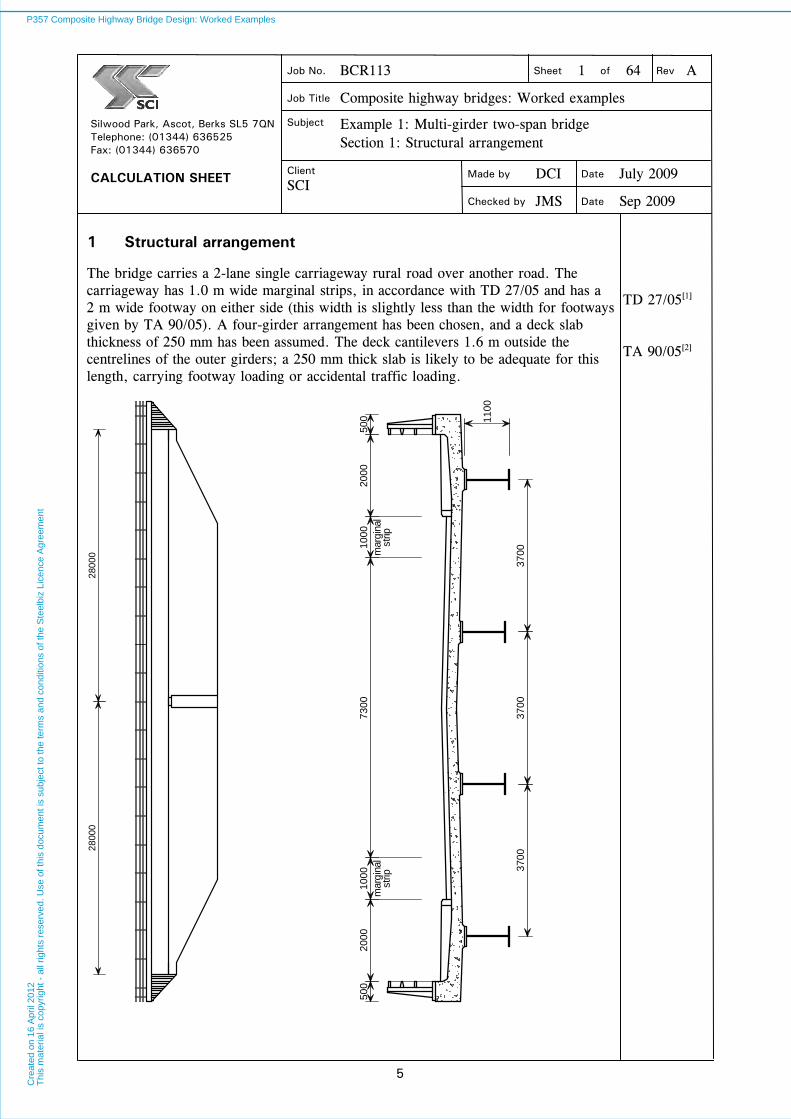
The bridge carries a 2-lane single carriageway rural road over another road. The carriageway has 1.0 m wide marginal strips, in accordance with TD 27/05 and has a 2 m wide footway on either side (this width is slightly less than the width for footways given by TA 90/05). A four-girder arrangement has been chosen, and a deck slab thickness of 250 mm has been assumed. The deck cantilevers 1.6 m outside the centrelines of the outer girders; a 250 mm thick slab is likely to be adequate for this length, carrying footway loading or accidental traffic loading.
TD 27/05[ 1]
TA 90/05[ 2]
2800
028
000
500
500
1000
1000
3700
3700
3700
mar
gina
lst
ripm
argi
nal
strip
2000
2000
7300
11
00
P357 Composite Highway Bridge Design: Worked ExamplesC
reat
ed o
n 16
Apr
il 20
12T
his
mat
eria
l is
copy
right
- a
ll rig
hts
rese
rved
. Use
of t
his
docu
men
t is
subj
ect t
o th
e te
rms
and
cond
ition
s of
the
Ste
elbi
z Li
cenc
e A
gree
men
t
Job No. BCR113 Sheet 2 of 64 Rev A
Job Title Composite highway bridges: Worked examples
Subject Example 1: Multi-girder two-span bridge Section 2: Design basis
Made by DCI Date July 2009
Silwood Park, Ascot, Berks SL5 7QN Telephone: (01344) 636525 Fax: (01344) 636570 CALCULATION SHEET
Client
SCI Checked by JMS Date Sep 2009
P357-example1-D06.doc 6 Printed 17/03/2010
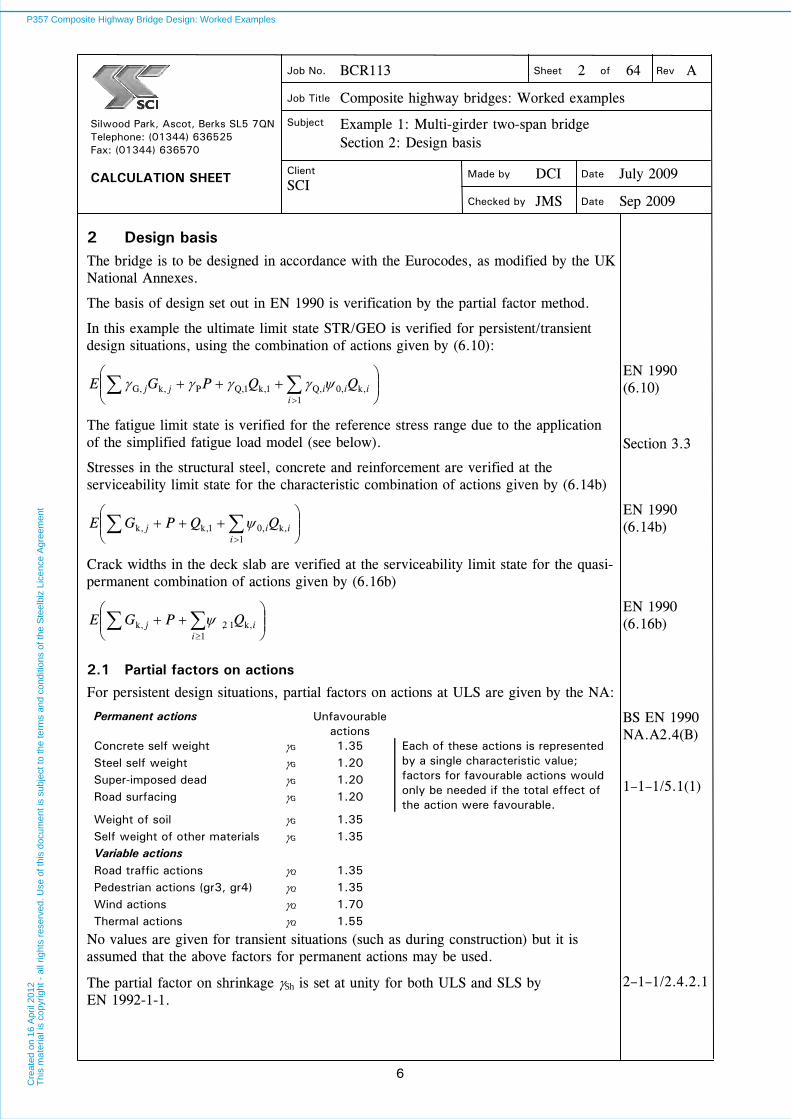
2 Design basis
The bridge is to be designed in accordance with the Eurocodes, as modified by the UK National Annexes.
The basis of design set out in EN 1990 is verification by the partial factor method.
In this example the ultimate limit state STR/GEO is verified for persistent/transient design situations, using the combination of actions given by (6.10):
1,k,0,Q1,k1,QP,k,G
iiiijj QQPGE
EN 1990 (6.10)
The fatigue limit state is verified for the reference stress range due to the application of the simplified fatigue load model (see below).
Section 3.3
Stresses in the structural steel, concrete and reinforcement are verified at the serviceability limit state for the characteristic combination of actions given by (6.14b)
1,k,01,k,k
iiij QQPGE
EN 1990 (6.14b)
Crack widths in the deck slab are verified at the serviceability limit state for the quasi-permanent combination of actions given by (6.16b)
1,k1,2,k
iij QPGE
EN 1990 (6.16b)
2.1 Partial factors on actions
For persistent design situations, partial factors on actions at ULS are given by the NA:
Permanent actions Unfavourable actions
Concrete self weight G 1.35
Steel self weight G 1.20
Super-imposed dead G 1.20
Road surfacing G 1.20
Each of these actions is represented by a single characteristic value; factors for favourable actions would only be needed if the total effect of the action were favourable.
Weight of soil G 1.35 Self weight of other materials G 1.35 Variable actions Road traffic actions Q 1.35 Pedestrian actions (gr3, gr4) Q 1.35 Wind actions Q 1.70 Thermal actions Q 1.55
BS EN 1990 NA.A2.4(B) 1–1–1/5.1(1)
No values are given for transient situations (such as during construction) but it is assumed that the above factors for permanent actions may be used.
The partial factor on shrinkage Sh is set at unity for both ULS and SLS by EN 1992-1-1.
2–1–1/2.4.2.1
P357 Composite Highway Bridge Design: Worked ExamplesC
reat
ed o
n 16
Apr
il 20
12T
his
mat
eria
l is
copy
right
- a
ll rig
hts
rese
rved
. Use
of t
his
docu
men
t is
subj
ect t
o th
e te
rms
and
cond
ition
s of
the
Ste
elbi
z Li
cenc
e A
gree
men
t
Job No. BCR113 Sheet 3 of 64 Rev A
Job Title Composite highway bridges: Worked examples
Subject Example 1: Multi-girder two-span bridge Section 2: Design basis
Made by DCI Date July 2009
Silwood Park, Ascot, Berks SL5 7QN Telephone: (01344) 636525 Fax: (01344) 636570 CALCULATION SHEET
Client
SCI Checked by JMS Date Sep 2009
P357-example1-D06.doc 7 Printed 17/03/2010
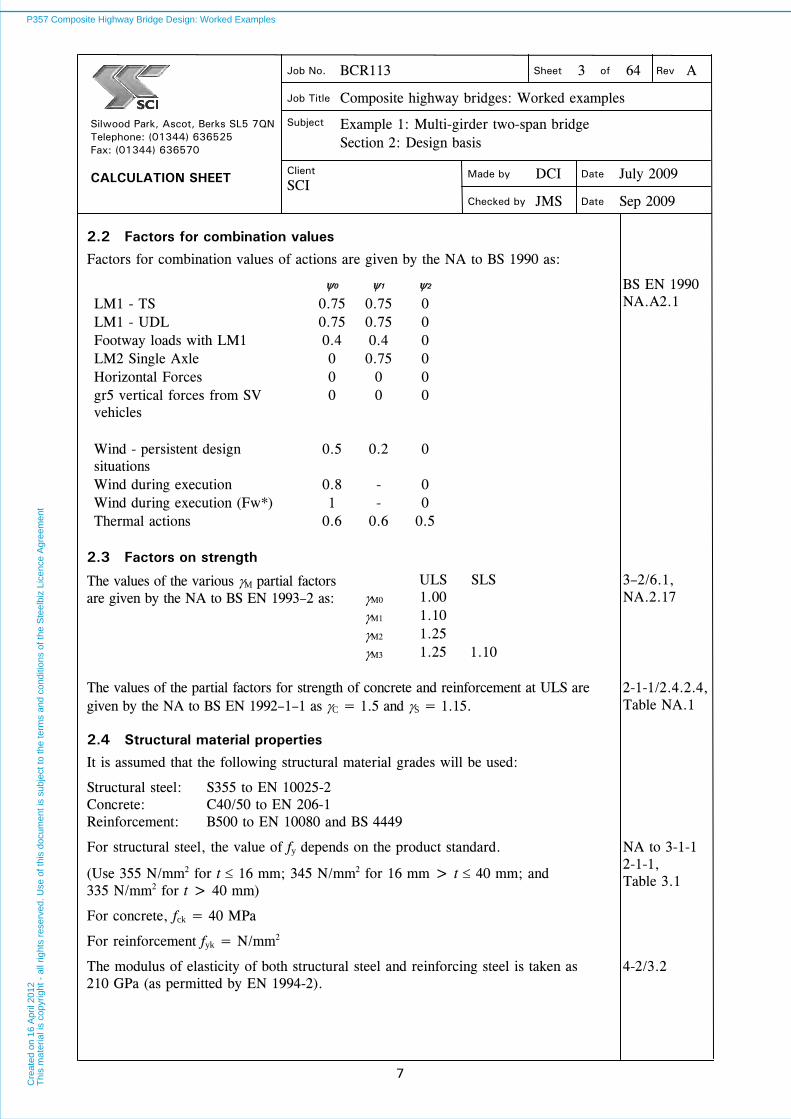
2.2 Factors for combination values
Factors for combination values of actions are given by the NA to BS 1990 as:
0 1 2
LM1 - TS 0.75 0.75 0 LM1 - UDL 0.75 0.75 0 Footway loads with LM1 0.4 0.4 0 LM2 Single Axle 0 0.75 0 Horizontal Forces 0 0 0 gr5 vertical forces from SV vehicles
0 0 0
Wind - persistent design situations
0.5 0.2 0
Wind during execution 0.8 - 0 Wind during execution (Fw*) 1 - 0 Thermal actions 0.6 0.6 0.5
BS EN 1990 NA.A2.1
2.3 Factors on strength
The values of the various M partial factors are given by the NA to BS EN 1993–2 as:
ULS SLS M0 1.00 M1 1.10 M2 1.25 M3 1.25 1.10
3–2/6.1, NA.2.17
The values of the partial factors for strength of concrete and reinforcement at ULS are given by the NA to BS EN 1992–1–1 as C = 1.5 and S = 1.15.
2-1-1/2.4.2.4, Table NA.1
2.4 Structural material properties
It is assumed that the following structural material grades will be used:
Structural steel: S355 to EN 10025-2 Concrete: C40/50 to EN 206-1 Reinforcement: B500 to EN 10080 and BS 4449
For structural steel, the value of fy depends on the product standard.
(Use 355 N/mm2 for t 16 mm; 345 N/mm2 for 16 mm > t 40 mm; and 335 N/mm2 for t > 40 mm)
For concrete, fck = 40 MPa
For reinforcement fyk = N/mm2
NA to 3-1-1 2-1-1, Table 3.1
The modulus of elasticity of both structural steel and reinforcing steel is taken as 210 GPa (as permitted by EN 1994-2).
4-2/3.2
P357 Composite Highway Bridge Design: Worked ExamplesC
reat
ed o
n 16
Apr
il 20
12T
his
mat
eria
l is
copy
right
- a
ll rig
hts
rese
rved
. Use
of t
his
docu
men
t is
subj
ect t
o th
e te
rms
and
cond
ition
s of
the
Ste
elbi
z Li
cenc
e A
gree
men
t

Job No. BCR113 Sheet 4 of 64 Rev A
Job Title Composite highway bridges: Worked examples
Subject Example 1: Multi-girder two-span bridge Section 2: Design basis
Made by DCI Date July 2009
Silwood Park, Ascot, Berks SL5 7QN Telephone: (01344) 636525 Fax: (01344) 636570 CALCULATION SHEET
Client
SCI Checked by JMS Date Sep 2009
P357-example1-D06.doc 8 Printed 17/03/2010
The modulus of elasticity of the concrete is given by EN 1992-1-1 as:
Ecm = 35 GPa. This 28-day value will be used for determination of all short-term effects and resistances and the modular ratio is thus
n0 = 210/35 = 6.0
2-1-1/ Table 3.1
For long-term effects, the modular ratio is given by 4-2/5.4.2.2 as:
) + (nn tL0L 1 =
For the evaluation of the creep coefficient t (= (t,t0) in 2-1-1/B.1) it is assumed that the first loading is applied at an average age of t0 = 21 days and that the relative humidity is 70%.
For t ∞ (t,t0) = 0
Where 0cmRH0 tf
4-2/5.4.2.2 2-1-1/B.1
For fcm>35 MPa (here fcm = 48 MPa, from 2-1-1/Table 3.1)
213
0RH
1.0
100/11
h
RH
802.0483535 7.07.0
cm1
f
939.0483535 2.02.0
cm2
f
2-1-1/Table 3.1 2-1-1/(B.3a) 2-1-1/(B.8c)
For a 250 thick slab (h0 = 250)
298.1939.0802.02501.0
100/7011
3RH
42.248
8.168.16
cmcm
ff
516.0211.0
1
1.0
120.020.00
0
t
t 2-1-1/(B.5)
Hence
621.1516.042.2298.10
For permanent loads, L = 1.1 and thus:
7.1679.20.61.1621.110.6L n
4-2/5.4.2.2(2)
Long term modulus = 210/16.7 = 12.6 GPa
P357 Composite Highway Bridge Design: Worked ExamplesC
reat
ed o
n 16
Apr
il 20
12T
his
mat
eria
l is
copy
right
- a
ll rig
hts
rese
rved
. Use
of t
his
docu
men
t is
subj
ect t
o th
e te
rms
and
cond
ition
s of
the
Ste
elbi
z Li
cenc
e A
gree
men
t
Job No. BCR113 Sheet 5 of 64 Rev A
Job Title Composite highway bridges: Worked examples
Subject Example 1: Multi-girder two-span bridge Section 2: Design basis
Made by DCI Date July 2009
Silwood Park, Ascot, Berks SL5 7QN Telephone: (01344) 636525 Fax: (01344) 636570 CALCULATION SHEET
Client
SCI Checked by JMS Date Sep 2009
P357-example1-D06.doc 9 Printed 17/03/2010
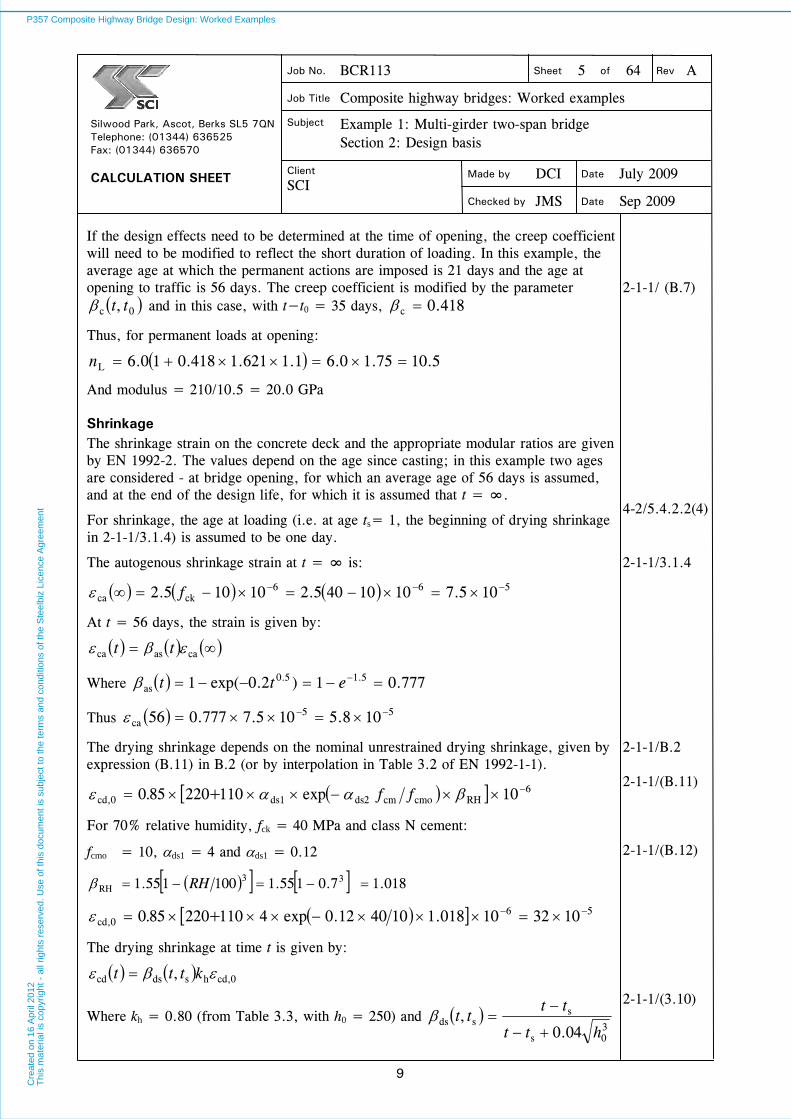
If the design effects need to be determined at the time of opening, the creep coefficient will need to be modified to reflect the short duration of loading. In this example, the average age at which the permanent actions are imposed is 21 days and the age at opening to traffic is 56 days. The creep coefficient is modified by the parameter
0c , tt and in this case, with t−t0 = 35 days, 418.0c
2-1-1/ (B.7)
Thus, for permanent loads at opening:
5.1075.10.61.1621.1418.010.6L n
And modulus = 210/10.5 = 20.0 GPa
Shrinkage The shrinkage strain on the concrete deck and the appropriate modular ratios are given by EN 1992-2. The values depend on the age since casting; in this example two ages are considered - at bridge opening, for which an average age of 56 days is assumed, and at the end of the design life, for which it is assumed that t = ∞.
For shrinkage, the age at loading (i.e. at age ts= 1, the beginning of drying shrinkage in 2-1-1/3.1.4) is assumed to be one day.
4-2/5.4.2.2(4)
The autogenous shrinkage strain at t = ∞ is:
566ckca 105.71010405.210105.2 f
2-1-1/3.1.4
At t = 56 days, the strain is given by:
caasca tt
Where 777.01)2.0exp(1 5.15.0as ett
Thus 55ca 108.5105.7777.056
The drying shrinkage depends on the nominal unrestrained drying shrinkage, given by expression (B.11) in B.2 (or by interpolation in Table 3.2 of EN 1992-1-1).
6RHcmocmds2ds1cd,0 10exp110220850 ff+.
For 70% relative humidity, fck = 40 MPa and class N cement:
fcmo = 10, ds1 = 4 and ds1 = 0.12
018.17.0155.1100155.1 33RH RH
56cd,0 103210018.1104012.0exp4110220850 +.
2-1-1/B.2 2-1-1/(B.11) 2-1-1/(B.12)
The drying shrinkage at time t is given by:
cd,0hsdscd , kttt
Where kh = 0.80 (from Table 3.3, with h0 = 250) and 30s
ssds
04.0,
htt
tttt
2-1-1/(3.10)
P357 Composite Highway Bridge Design: Worked ExamplesC
reat
ed o
n 16
Apr
il 20
12T
his
mat
eria
l is
copy
right
- a
ll rig
hts
rese
rved
. Use
of t
his
docu
men
t is
subj
ect t
o th
e te
rms
and
cond
ition
s of
the
Ste
elbi
z Li
cenc
e A
gree
men
t

Job No. BCR113 Sheet 6 of 64 Rev A
Job Title Composite highway bridges: Worked examples
Subject Example 1: Multi-girder two-span bridge Section 2: Design basis
Made by DCI Date July 2009
Silwood Park, Ascot, Berks SL5 7QN Telephone: (01344) 636525 Fax: (01344) 636570 CALCULATION SHEET
Client
SCI Checked by JMS Date Sep 2009
P357-example1-D06.doc 10 Printed 17/03/2010
For t = 56 and ts = 1 (see 4-2/5.4.2.2(4)), ds = 0.258
For t = ∞, ds = 1
Thus the drying shrinkage is:
At t = 56 days 55cd 1060.6103280.0258.0
At t = ∞ 55cd 106.25103280.0
The total shrinkage is thus:
At t = 56 days 555cd 104.121060.6108.5
At t = ∞ 555cd 101.33106.25105.7
For the modular ratio, the creep factor is calculated as for long term loading but the age at first loading is assumed to be 1 day. Thus:
91.011.0
1
1.0
120.020.00
0
t
t
The final creep coefficient is calculated as above for long term effects but with 91.00 t , and thus 86.291.042.2298.10
4-2/5.4.2.2(4) 2-1-1/(B.5)
For shrinkage, L = 0.55 and thus:
4.1557.20.655.086.210.6 Ln
4-2/5.4.2.2(2)
At opening to traffic (t = 56 days) the creep coefficient is modified by the parameter 0c , tt and in this case 475.0c and nL = 10.5.
2-1-1/(B.7)
In this example, the shrinkage effects will be taken into account at their long term values where they are unfavourable. Where the effects are favourable, the lesser values at 56 days could be considered but it is conservative to neglect shrinkage in that case.
P357 Composite Highway Bridge Design: Worked ExamplesC
reat
ed o
n 16
Apr
il 20
12T
his
mat
eria
l is
copy
right
- a
ll rig
hts
rese
rved
. Use
of t
his
docu
men
t is
subj
ect t
o th
e te
rms
and
cond
ition
s of
the
Ste
elbi
z Li
cenc
e A
gree
men
t

Job No. BCR113 Sheet 7 of 64 Rev A
Job Title Composite highway bridges: Worked examples
Subject Example 1: Multi-girder two-span bridge Section 3: Actions on the bridge
Made by DCI Date July 2009
Silwood Park, Ascot, Berks SL5 7QN Telephone: (01344) 636525 Fax: (01344) 636570 CALCULATION SHEET
Client
SCI Checked by JMS Date Sep 2009
P357-example1-D06.doc 11 Printed 17/03/2010
3 Actions on the bridge
3.1 Permanent actions
Self weight of structural elements The ‘density’ of steel is taken as 77 kN/m3 and the density of reinforced concrete is taken as 25 kN/m3 . The self weights are based on nominal dimensions.
1-1-1/Table A.1
Self weight of surfacing The total nominal thickness of the surfacing, including waterproofing layer is 130 mm. Assume that the ‘density’ is 23 kN/m3 for the whole thickness.
The self weight generally produces adverse effects and for that case the self weight is based on nominal thickness +55%. Thus:
gk = 1.55 0.13 23 = 4.63 kN/m2
1-1-1/Table NA.1
Self weight of footway construction The nominal thickness of the footway (comprising concrete fill and a thin surfacing) is 200 mm and a uniform density of 24 kN/m3 is assumed. The self weight is based on the nominal dimensions and thus:
gk = 1.0 0.2 24 = 4.80 kN/m2
Self weight of parapets A nominal value of 2 kN/m is assumed for each parapet.
Self weight of soil The density of the granular fill behind the integral abutments is taken as 21 kN/m3.
3.2 Construction loads
Construction loads are classed as variable loads.
For global analysis, a uniform construction load of Qca = 0.75 kN/m2 is assumed during casting and the weight of temporary formwork is assumed to be Qcc = 0.50 kN/m2. Additionally, wet concrete is assumed to have a density of 1 kN/m3 greater than that of hardened concrete; for a slab thickness of 250 mm this adds Qcf = 0.25 kN/m2
The total construction load is thus: Qc = 0.75 + 0.50 + 0.25 = 1.5 kN/m2
1-1-6/2.2 1-1-6/ Table 4.2
3.3 Traffic loads
Road traffic Normal traffic is represented by Load Model 1 (LM1).
For the road carried by this bridge, the highway authority specifies that abnormal traffic be represented by special vehicle SV100, as defined in the UK National Annex.
1-2/ NA.2.16.1.2
P357 Composite Highway Bridge Design: Worked ExamplesC
reat
ed o
n 16
Apr
il 20
12T
his
mat
eria
l is
copy
right
- a
ll rig
hts
rese
rved
. Use
of t
his
docu
men
t is
subj
ect t
o th
e te
rms
and
cond
ition
s of
the
Ste
elbi
z Li
cenc
e A
gree
men
t

Job No. BCR113 Sheet 8 of 64 Rev A
Job Title Composite highway bridges: Worked examples
Subject Example 1: Multi-girder two-span bridge Section 3: Actions on the bridge
Made by DCI Date July 2009
Silwood Park, Ascot, Berks SL5 7QN Telephone: (01344) 636525 Fax: (01344) 636570 CALCULATION SHEET
Client
SCI Checked by JMS Date Sep 2009
P357-example1-D06.doc 12 Printed 17/03/2010
Pedestrian traffic Pedestrian traffic is represented by the reduced value given by the NA to BS EN 1991-2, Table NA.3 and clause NA.2.36. Thus 0.6qfk is applied (= 0.6 5.0 = 3 kN/m2). The reduction for longer loaded lengths is not made.
1-2/Table NA.3
Fatigue loads For fatigue assessment, Fatigue Load Model 3 (FLM3), defined in 1-2/4.6.4, is used, as recommended by 3-2/9.2.2
3.4 Thermal actions
Shade temperatures Maximum and minimum shade air temperatures for the UK, for a 50-year return period are defined in EN 1991-1-5 NA.2.20. For this bridge location, the values are: Maximum 33°C Minimum −17°C
1-1-5/ NA.2.20
Thermal range of effective bridge temperature (for determination of soil pressures) For the purposes of determining soil pressure, the total range of effective bridge temperature for a 50 year return period is relevant, not the range from an assumed initial restraint position.
PD 6694-1[ 3]
clause 7.4.2 (draft)
The values of maximum/ minimum uniform bridge temperatures are given by EN 1991-1-5, 6.1.3.1; these are referred to as Te,min and Te,max
For Type 2 deck (concrete slab on steel girders)
Te,max = Tmax + 4 (EN 1991-1-5, Figure 6.1) Te,min = Tmin + 5
Hence the total range = (33 + 4) − (−17 + 5) = 49°C
(The adjustments for surfacing thickness over 100 mm given by the NA would result in a small reduction to the range and have been neglected.)
1-1-5/ NA.2.4
Thermal range (for determination of extreme value of thermal movement) For determination of the maximum movement at ULS, the values for a 120 year design life are relevant but according to EN 1990:A2, these are determined by applying Q = 1.55 to characteristic values for a 50 year return period.
For change of length in composite sections, the coefficient of linear thermal expansion is 12 10−6 per °C.
Table NA.A2.4(B) Note 6 4-2/5.4.2.5
Vertical temperature difference The vertical temperature difference given in EN 1991-1-5, Table 6.2b will be used and temperature difference will be considered to act simultaneously with uniform temperature change, as recommended in NA.2.12, if that is more onerous. For surfacing thickness other than 100 mm, interpolate in 1-1-5/Table B.2, as follows:
P357 Composite Highway Bridge Design: Worked ExamplesC
reat
ed o
n 16
Apr
il 20
12T
his
mat
eria
l is
copy
right
- a
ll rig
hts
rese
rved
. Use
of t
his
docu
men
t is
subj
ect t
o th
e te
rms
and
cond
ition
s of
the
Ste
elbi
z Li
cenc
e A
gree
men
t

Job No. BCR113 Sheet 9 of 64 Rev A
Job Title Composite highway bridges: Worked examples
Subject Example 1: Multi-girder two-span bridge Section 3: Actions on the bridge
Made by DCI Date July 2009
Silwood Park, Ascot, Berks SL5 7QN Telephone: (01344) 636525 Fax: (01344) 636570 CALCULATION SHEET
Client
SCI Checked by JMS Date Sep 2009
P357-example1-D06.doc 13 Printed 17/03/2010
T1 for slab thickness (mm) Surfacing thickness (mm) 200 300
100 13 16 150 10.5 12.5
Interpolating for slab thickness 250 mm, surfacing thickness 130 mm, gives T1 = 12.7°.
(The 55% increase over nominal thickness, where surfacing load is adverse, is ignored.)
For temperature difference in composite sections, the coefficient of thermal expansion is 10 10−6 per °C.
4-2/5.4.2.5
3.5 Geotechnical actions
Design values of thermal movements giving rise to geotechnical actions At the ULS that designs the superstructure, traffic loads are the leading action and thermal actions may be considered as an accompanying action. In that case the movement (from mean position) is:
(1.2 10−5 28000 49/2) Q 0 = 8.23 1.55 0.60 = 7.65 mm
For maximum axial force due to restraint of temperature, the thermal action would be the leading action and the movement (from mean position) would be:
8.23 Q = 8.23 1.55 = 12.8 mm.
Accompanying LM1 traffic loads would be at 75% of their value as a leading action (since 1 = 0.75 for gr1a). (LM3 is not considered as an accompanying action.)
Sheet 3
Soil pressure coefficients Soil pressure coefficient K* To determine the maximum soil pressure on the endscreen wall, PD 6694-1 requires the value of the total thermal movement range, the height of the wall above the pivot point and the K0 value for the soil.
PD 6694-1[ 3] (draft)
The PD gives:
d = Lx(Te,max − Te,min)
NOTE - The PD does not refer to characteristic values or to frequent values, it simply ignores the design basis; it could be argued that it is the frequent value as a leading action that determines the pressure coefficient, in which case the partial factor is unity and the factor 1 should be applied (1 = 0.6 according to the UK NA)
Here, following the PD
d = 1.2 10−5 28000 49 = 16.5 mm
(i.e. ± 8.25 about the mean position)
P357 Composite Highway Bridge Design: Worked ExamplesC
reat
ed o
n 16
Apr
il 20
12T
his
mat
eria
l is
copy
right
- a
ll rig
hts
rese
rved
. Use
of t
his
docu
men
t is
subj
ect t
o th
e te
rms
and
cond
ition
s of
the
Ste
elbi
z Li
cenc
e A
gree
men
t
Job No. BCR113 Sheet 10 of 64 Rev A
Job Title Composite highway bridges: Worked examples
Subject Example 1: Multi-girder two-span bridge Section 3: Actions on the bridge
Made by DCI Date July 2009
Silwood Park, Ascot, Berks SL5 7QN Telephone: (01344) 636525 Fax: (01344) 636570 CALCULATION SHEET
Client
SCI Checked by JMS Date Sep 2009
P357-example1-D06.doc 14 Printed 17/03/2010
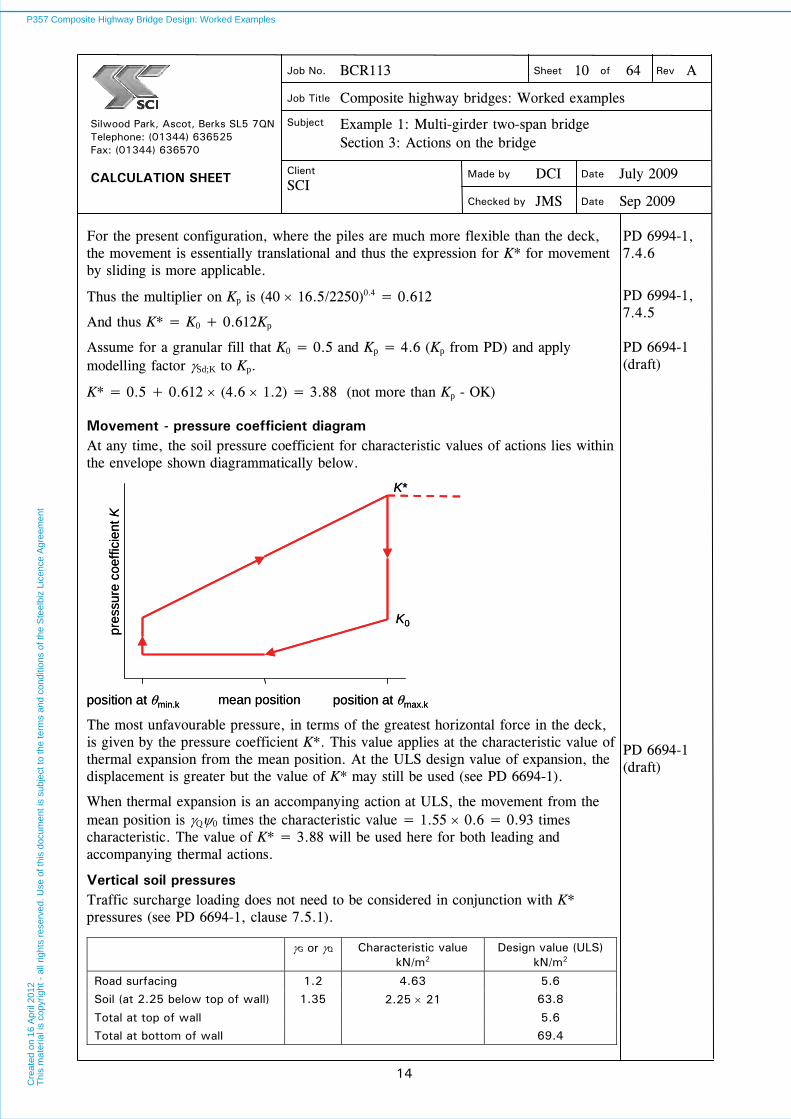
For the present configuration, where the piles are much more flexible than the deck, the movement is essentially translational and thus the expression for K* for movement by sliding is more applicable.
PD 6994-1, 7.4.6
Thus the multiplier on Kp is (40 16.5/2250)0.4 = 0.612
And thus K* = K0 + 0.612Kp
PD 6994-1, 7.4.5
Assume for a granular fill that K0 = 0.5 and Kp = 4.6 (Kp from PD) and apply modelling factor Sd;K to Kp.
K* = 0.5 + 0.612 (4.6 1.2) = 3.88 (not more than Kp - OK)
PD 6694-1 (draft)
Movement - pressure coefficient diagram At any time, the soil pressure coefficient for characteristic values of actions lies within the envelope shown diagrammatically below.
mean positionposition at min,k position at max,k
pres
sure
coe
ffic
ient
K
K*
K0
mean positionposition at min,k position at max,k
pres
sure
coe
ffic
ient
K
K*
K0
The most unfavourable pressure, in terms of the greatest horizontal force in the deck, is given by the pressure coefficient K*. This value applies at the characteristic value of thermal expansion from the mean position. At the ULS design value of expansion, the displacement is greater but the value of K* may still be used (see PD 6694-1).
When thermal expansion is an accompanying action at ULS, the movement from the mean position is Q0 times the characteristic value = 1.55 0.6 = 0.93 times characteristic. The value of K* = 3.88 will be used here for both leading and accompanying thermal actions.
PD 6694-1 (draft)
Vertical soil pressures Traffic surcharge loading does not need to be considered in conjunction with K* pressures (see PD 6694-1, clause 7.5.1).
G or Q Characteristic value kN/m2
Design value (ULS) kN/m2
Road surfacing 1.2 4.63 5.6
Soil (at 2.25 below top of wall) 1.35 2.25 21 63.8
Total at top of wall 5.6
Total at bottom of wall 69.4
P357 Composite Highway Bridge Design: Worked ExamplesC
reat
ed o
n 16
Apr
il 20
12T
his
mat
eria
l is
copy
right
- a
ll rig
hts
rese
rved
. Use
of t
his
docu
men
t is
subj
ect t
o th
e te
rms
and
cond
ition
s of
the
Ste
elbi
z Li
cenc
e A
gree
men
t
Job No. BCR113 Sheet 11 of 64 Rev A
Job Title Composite highway bridges: Worked examples
Subject Example 1: Multi-girder two-span bridge Section 3: Actions on the bridge
Made by DCI Date July 2009
Silwood Park, Ascot, Berks SL5 7QN Telephone: (01344) 636525 Fax: (01344) 636570 CALCULATION SHEET
Client
SCI Checked by JMS Date Sep 2009
P357-example1-D06.doc 15 Printed 17/03/2010
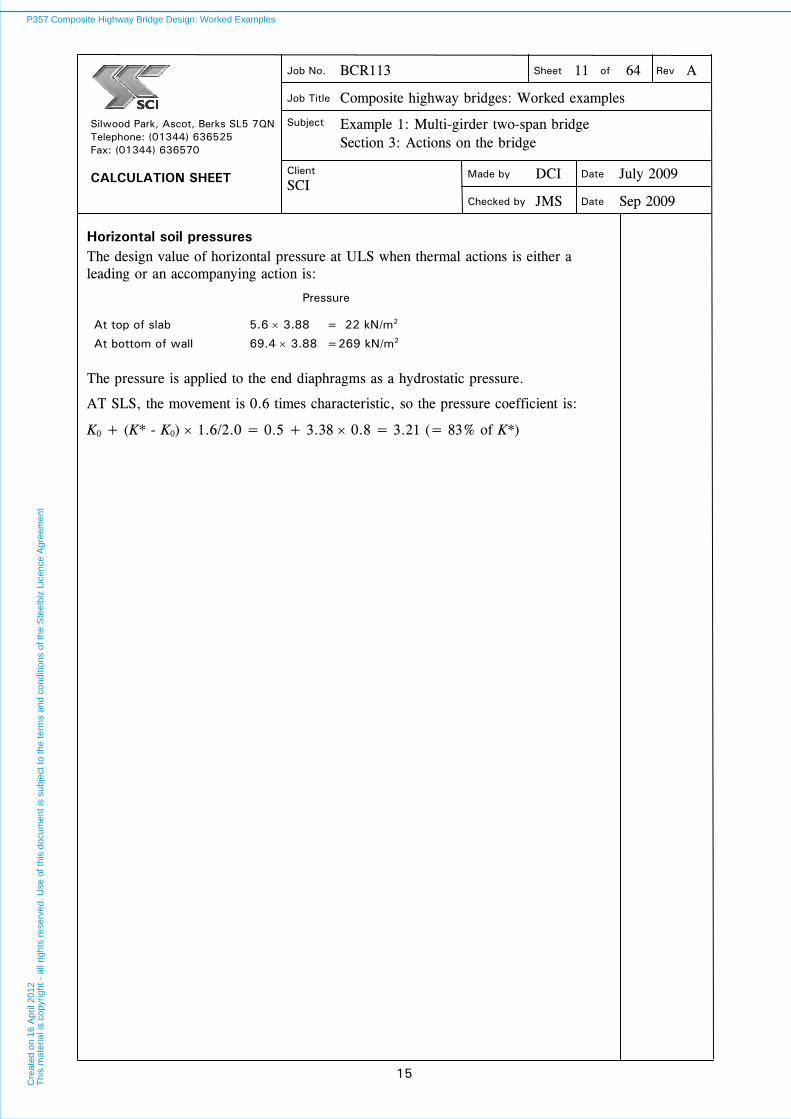
Horizontal soil pressures The design value of horizontal pressure at ULS when thermal actions is either a leading or an accompanying action is:
Pressure
At top of slab 5.6 3.88 = 22 kN/m2
At bottom of wall 69.4 3.88 =269 kN/m2
The pressure is applied to the end diaphragms as a hydrostatic pressure.
AT SLS, the movement is 0.6 times characteristic, so the pressure coefficient is:
K0 + (K* - K0) 1.6/2.0 = 0.5 + 3.38 0.8 = 3.21 (= 83% of K*)
P357 Composite Highway Bridge Design: Worked ExamplesC
reat
ed o
n 16
Apr
il 20
12T
his
mat
eria
l is
copy
right
- a
ll rig
hts
rese
rved
. Use
of t
his
docu
men
t is
subj
ect t
o th
e te
rms
and
cond
ition
s of
the
Ste
elbi
z Li
cenc
e A
gree
men
t
Job No. BCR113 Sheet 12 of 64 Rev A
Job Title Composite highway bridges: Worked examples
Subject Example 1: Multi-girder two-span bridge Section 4: Girder make-up and slab reinforcement
Made by DCI Date July 2009
Silwood Park, Ascot, Berks SL5 7QN Telephone: (01344) 636525 Fax: (01344) 636570 CALCULATION SHEET
Client
SCI Checked by JMS Date Sep 2009
P357-example1-D06.doc 16 Printed 17/03/2010
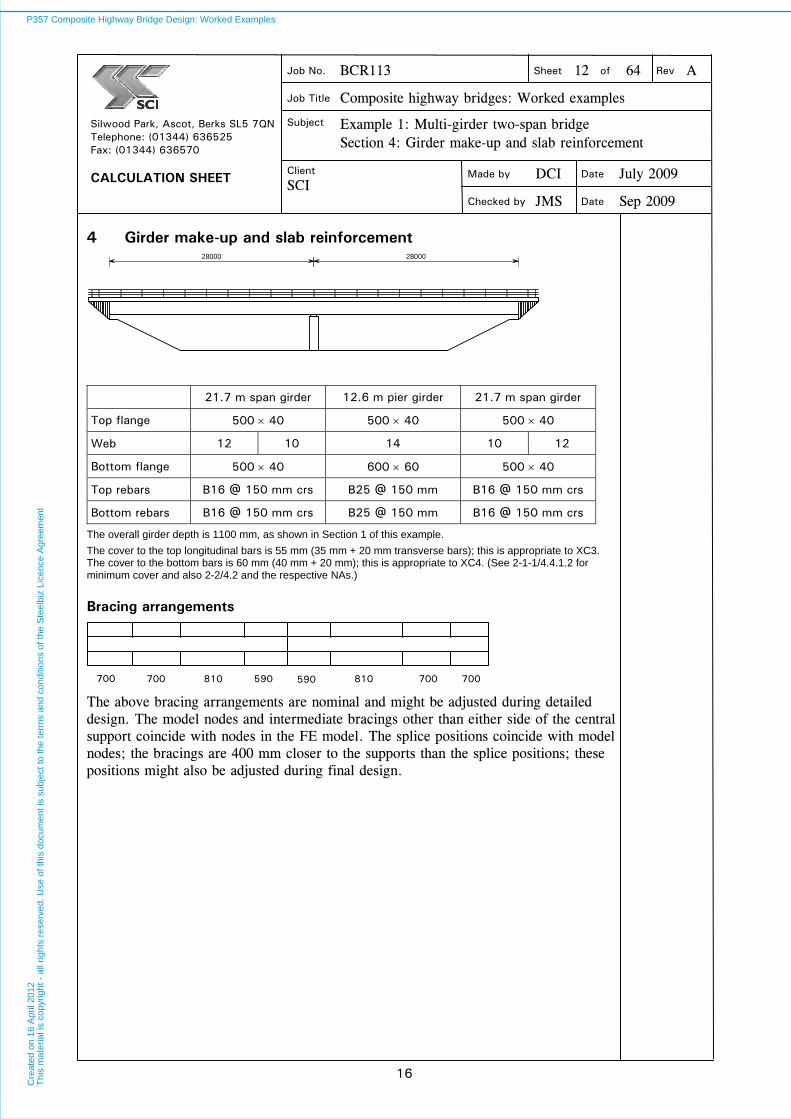
4 Girder make-up and slab reinforcement
28000 28000
21.7 m span girder 12.6 m pier girder 21.7 m span girder
Top flange 500 40 500 40 500 40
Web 12 10 14 10 12
Bottom flange 500 40 600 60 500 40
Top rebars B16 @ 150 mm crs B25 @ 150 mm B16 @ 150 mm crs
Bottom rebars B16 @ 150 mm crs B25 @ 150 mm B16 @ 150 mm crs
The overall girder depth is 1100 mm, as shown in Section 1 of this example.
The cover to the top longitudinal bars is 55 mm (35 mm + 20 mm transverse bars); this is appropriate to XC3. The cover to the bottom bars is 60 mm (40 mm + 20 mm); this is appropriate to XC4. (See 2-1-1/4.4.1.2 for minimum cover and also 2-2/4.2 and the respective NAs.)
Bracing arrangements
The above bracing arrangements are nominal and might be adjusted during detailed design. The model nodes and intermediate bracings other than either side of the central support coincide with nodes in the FE model. The splice positions coincide with model nodes; the bracings are 400 mm closer to the supports than the splice positions; these positions might also be adjusted during final design.
700 700 810 700700810590 590
P357 Composite Highway Bridge Design: Worked ExamplesC
reat
ed o
n 16
Apr
il 20
12T
his
mat
eria
l is
copy
right
- a
ll rig
hts
rese
rved
. Use
of t
his
docu
men
t is
subj
ect t
o th
e te
rms
and
cond
ition
s of
the
Ste
elbi
z Li
cenc
e A
gree
men
t
Job No. BCR113 Sheet 13 of 64 Rev A
Job Title Composite highway bridges: Worked examples
Subject Example 1: Multi-girder two-span bridge Section 5: Beam cross sections
Made by DCI Date July 2009
Silwood Park, Ascot, Berks SL5 7QN Telephone: (01344) 636525 Fax: (01344) 636570 CALCULATION SHEET
Client
SCI Checked by JMS Date Sep 2009
P357-example1-D06.doc 17 Printed 17/03/2010
5 Beam cross sections
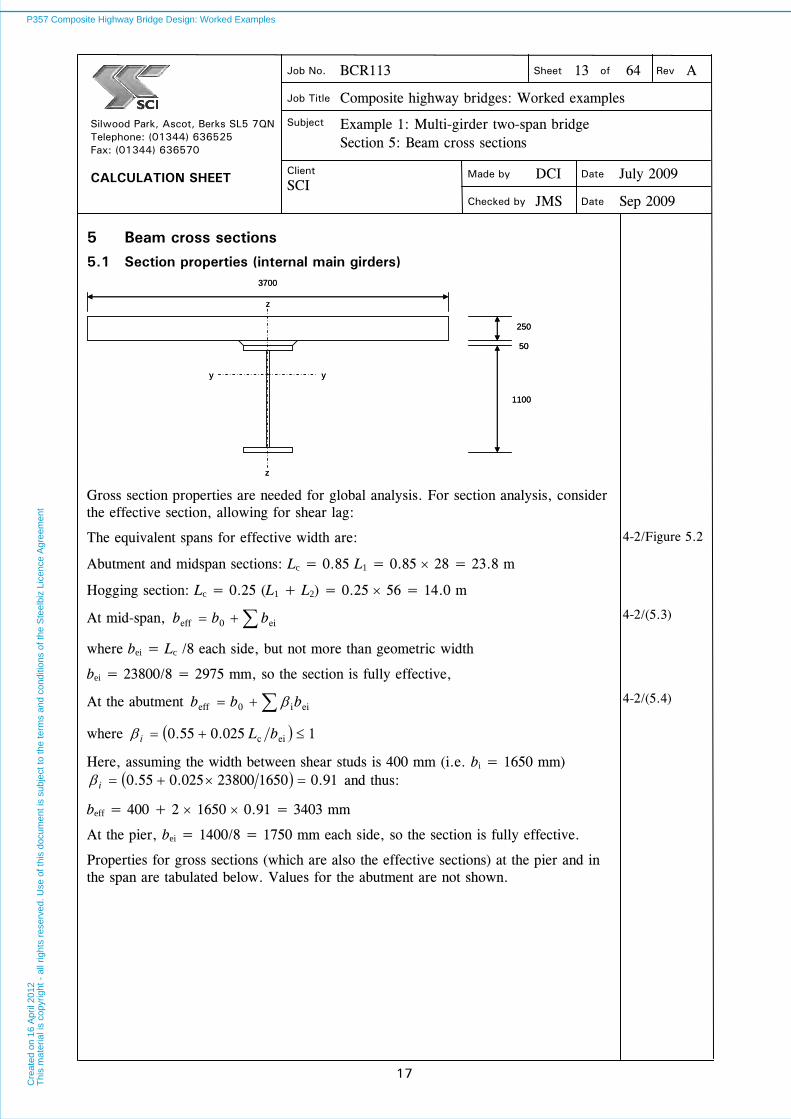
5.1 Section properties (internal main girders)
y
3700
250
1100
50
y
z
z
y
3700
250
1100
50
y
z
z
Gross section properties are needed for global analysis. For section analysis, consider the effective section, allowing for shear lag:
The equivalent spans for effective width are:
Abutment and midspan sections: Lc = 0.85 L1 = 0.85 28 = 23.8 m
Hogging section: Lc = 0.25 (L1 + L2) = 0.25 56 = 14.0 m
4-2/Figure 5.2
At mid-span, ei0eff bbb
where bei = Lc /8 each side, but not more than geometric width
bei = 23800/8 = 2975 mm, so the section is fully effective,
4-2/(5.3)
At the abutment eii0eff bbb
where 1025.055.0 eic bLi
Here, assuming the width between shear studs is 400 mm (i.e. bi = 1650 mm) 91.0165023800025.055.0 i and thus:
beff = 400 + 2 1650 0.91 = 3403 mm
4-2/(5.4)
At the pier, bei = 1400/8 = 1750 mm each side, so the section is fully effective.
Properties for gross sections (which are also the effective sections) at the pier and in the span are tabulated below. Values for the abutment are not shown.
P357 Composite Highway Bridge Design: Worked ExamplesC
reat
ed o
n 16
Apr
il 20
12T
his
mat
eria
l is
copy
right
- a
ll rig
hts
rese
rved
. Use
of t
his
docu
men
t is
subj
ect t
o th
e te
rms
and
cond
ition
s of
the
Ste
elbi
z Li
cenc
e A
gree
men
t
Job No. BCR113 Sheet 14 of 64 Rev A
Job Title Composite highway bridges: Worked examples
Subject Example 1: Multi-girder two-span bridge Section 5: Beam cross sections
Made by DCI Date July 2009
Silwood Park, Ascot, Berks SL5 7QN Telephone: (01344) 636525 Fax: (01344) 636570 CALCULATION SHEET
Client
SCI Checked by JMS Date Sep 2009
P357-example1-D06.doc 18 Printed 17/03/2010
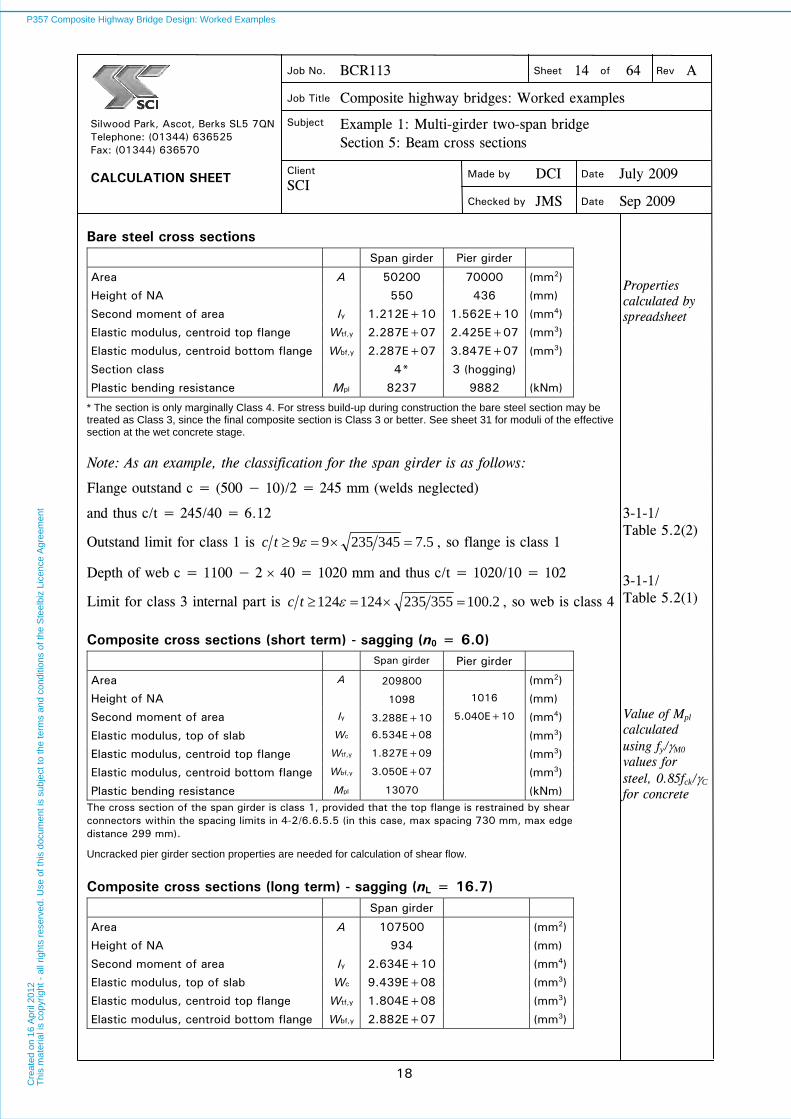
Bare steel cross sections Span girder Pier girder
Area A 50200 70000 (mm2)
Height of NA 550 436 (mm)
Second moment of area Iy 1.212E+10 1.562E+10 (mm4)
Elastic modulus, centroid top flange Wtf,y 2.287E+07 2.425E+07 (mm3)
Elastic modulus, centroid bottom flange Wbf,y 2.287E+07 3.847E+07 (mm3)
Section class 4* 3 (hogging)
Plastic bending resistance Mpl 8237 9882 (kNm)
* The section is only marginally Class 4. For stress build-up during construction the bare steel section may be treated as Class 3, since the final composite section is Class 3 or better. See sheet 31 for moduli of the effective section at the wet concrete stage.
Properties calculated by spreadsheet
Note: As an example, the classification for the span girder is as follows:
Flange outstand c = (500 − 10)/2 = 245 mm (welds neglected)
and thus c/t = 245/40 = 6.12
Outstand limit for class 1 is 5.734523599 tc , so flange is class 1
Depth of web c = 1100 − 2 40 = 1020 mm and thus c/t = 1020/10 = 102
Limit for class 3 internal part is 2.100355235124124 tc , so web is class 4
3-1-1/ Table 5.2(2)
3-1-1/ Table 5.2(1)
Composite cross sections (short term) - sagging (n0 = 6.0) Span girder Pier girder
Area A 209800 (mm2)
Height of NA 1098 1016 (mm)
Second moment of area Iy 3.288E+10 5.040E+10 (mm4)
Elastic modulus, top of slab Wc 6.534E+08 (mm3)
Elastic modulus, centroid top flange Wtf,y 1.827E+09 (mm3)
Elastic modulus, centroid bottom flange Wbf,y 3.050E+07 (mm3)
Plastic bending resistance Mpl 13070 (kNm) The cross section of the span girder is class 1, provided that the top flange is restrained by shear connectors within the spacing limits in 4-2/6.6.5.5 (in this case, max spacing 730 mm, max edge distance 299 mm). Uncracked pier girder section properties are needed for calculation of shear flow.
Value of Mpl calculated using fy/M0 values for steel, 0.85fck/C for concrete
Composite cross sections (long term) - sagging (nL = 16.7) Span girder
Area A 107500 (mm2)
Height of NA 934 (mm)
Second moment of area Iy 2.634E+10 (mm4)
Elastic modulus, top of slab Wc 9.439E+08 (mm3)
Elastic modulus, centroid top flange Wtf,y 1.804E+08 (mm3)
Elastic modulus, centroid bottom flange Wbf,y 2.882E+07 (mm3)
P357 Composite Highway Bridge Design: Worked ExamplesC
reat
ed o
n 16
Apr
il 20
12T
his
mat
eria
l is
copy
right
- a
ll rig
hts
rese
rved
. Use
of t
his
docu
men
t is
subj
ect t
o th
e te
rms
and
cond
ition
s of
the
Ste
elbi
z Li
cenc
e A
gree
men
t
Job No. BCR113 Sheet 15 of 64 Rev A
Job Title Composite highway bridges: Worked examples
Subject Example 1: Multi-girder two-span bridge Section 5: Beam cross sections
Made by DCI Date July 2009
Silwood Park, Ascot, Berks SL5 7QN Telephone: (01344) 636525 Fax: (01344) 636570 CALCULATION SHEET
Client
SCI Checked by JMS Date Sep 2009
P357-example1-D06.doc 19 Printed 17/03/2010
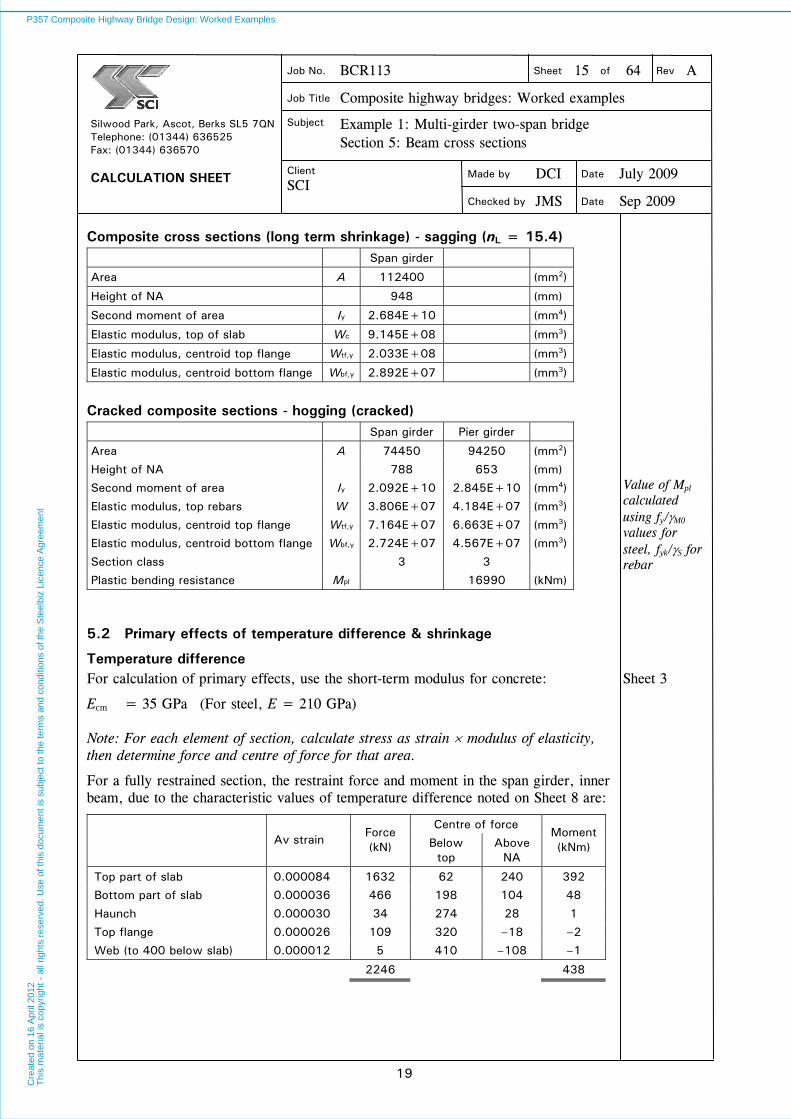
Composite cross sections (long term shrinkage) - sagging (nL = 15.4) Span girder
Area A 112400 (mm2)
Height of NA 948 (mm)
Second moment of area Iy 2.684E+10 (mm4)
Elastic modulus, top of slab Wc 9.145E+08 (mm3)
Elastic modulus, centroid top flange Wtf,y 2.033E+08 (mm3)
Elastic modulus, centroid bottom flange Wbf,y 2.892E+07 (mm3)
Cracked composite sections - hogging (cracked) Span girder Pier girder
Area A 74450 94250 (mm2)
Height of NA 788 653 (mm)
Second moment of area Iy 2.092E+10 2.845E+10 (mm4)
Elastic modulus, top rebars W 3.806E+07 4.184E+07 (mm3)
Elastic modulus, centroid top flange Wtf,y 7.164E+07 6.663E+07 (mm3)
Elastic modulus, centroid bottom flange Wbf,y 2.724E+07 4.567E+07 (mm3)
Section class 3 3
Plastic bending resistance Mpl 16990 (kNm)
Value of Mpl calculated using fy/M0 values for steel, fyk/S for rebar
5.2 Primary effects of temperature difference & shrinkage
Temperature difference For calculation of primary effects, use the short-term modulus for concrete:
Ecm = 35 GPa (For steel, E = 210 GPa)
Sheet 3
Note: For each element of section, calculate stress as strain modulus of elasticity, then determine force and centre of force for that area.
For a fully restrained section, the restraint force and moment in the span girder, inner beam, due to the characteristic values of temperature difference noted on Sheet 8 are:
Centre of force
Av strain
Force (kN) Below
top Above
NA
Moment (kNm)
Top part of slab 0.000084 1632 62 240 392
Bottom part of slab 0.000036 466 198 104 48
Haunch 0.000030 34 274 28 1
Top flange 0.000026 109 320 –18 –2
Web (to 400 below slab) 0.000012 5 410 –108 –1
2246 438
P357 Composite Highway Bridge Design: Worked ExamplesC
reat
ed o
n 16
Apr
il 20
12T
his
mat
eria
l is
copy
right
- a
ll rig
hts
rese
rved
. Use
of t
his
docu
men
t is
subj
ect t
o th
e te
rms
and
cond
ition
s of
the
Ste
elbi
z Li
cenc
e A
gree
men
t
Job No. BCR113 Sheet 16 of 64 Rev A
Job Title Composite highway bridges: Worked examples
Subject Example 1: Multi-girder two-span bridge Section 5: Beam cross sections
Made by DCI Date July 2009
Silwood Park, Ascot, Berks SL5 7QN Telephone: (01344) 636525 Fax: (01344) 636570 CALCULATION SHEET
Client
SCI Checked by JMS Date Sep 2009
P357-example1-D06.doc 20 Printed 17/03/2010
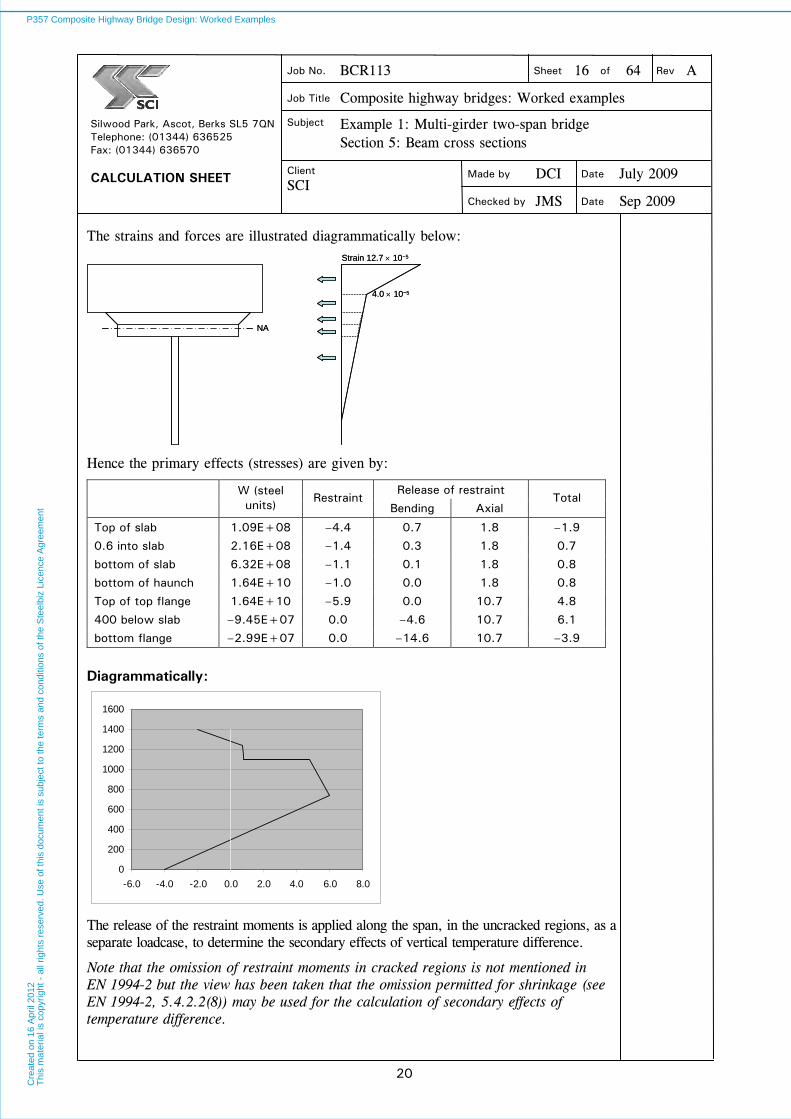
The strains and forces are illustrated diagrammatically below: Strain 12.7 10−5
4.0 10−5
NA
Strain 12.7 10−5
4.0 10−5
NA
Hence the primary effects (stresses) are given by:
Release of restraint
W (steel units)
Restraint Bending Axial
Total
Top of slab 1.09E+08 –4.4 0.7 1.8 –1.9
0.6 into slab 2.16E+08 –1.4 0.3 1.8 0.7
bottom of slab 6.32E+08 –1.1 0.1 1.8 0.8
bottom of haunch 1.64E+10 –1.0 0.0 1.8 0.8
Top of top flange 1.64E+10 –5.9 0.0 10.7 4.8
400 below slab –9.45E+07 0.0 –4.6 10.7 6.1
bottom flange –2.99E+07 0.0 –14.6 10.7 –3.9
Diagrammatically:
0
200
400
600
800
1000
1200
1400
1600
-6.0 -4.0 -2.0 0.0 2.0 4.0 6.0 8.0
The release of the restraint moments is applied along the span, in the uncracked regions, as a separate loadcase, to determine the secondary effects of vertical temperature difference.
Note that the omission of restraint moments in cracked regions is not mentioned in EN 1994-2 but the view has been taken that the omission permitted for shrinkage (see EN 1994-2, 5.4.2.2(8)) may be used for the calculation of secondary effects of temperature difference.
P357 Composite Highway Bridge Design: Worked ExamplesC
reat
ed o
n 16
Apr
il 20
12T
his
mat
eria
l is
copy
right
- a
ll rig
hts
rese
rved
. Use
of t
his
docu
men
t is
subj
ect t
o th
e te
rms
and
cond
ition
s of
the
Ste
elbi
z Li
cenc
e A
gree
men
t

Job No. BCR113 Sheet 17 of 64 Rev A
Job Title Composite highway bridges: Worked examples
Subject Example 1: Multi-girder two-span bridge Section 5: Beam cross sections
Made by DCI Date July 2009
Silwood Park, Ascot, Berks SL5 7QN Telephone: (01344) 636525 Fax: (01344) 636570 CALCULATION SHEET
Client
SCI Checked by JMS Date Sep 2009
P357-example1-D06.doc 21 Printed 17/03/2010
Shrinkage For complete verification, shrinkage effects should be calculated at the time of opening to traffic and at the end of the service life and the more onerous values used. Here, primary and secondary effects are calculated only for the long-term situation (the values are greater than those at opening) and where the total effects of shrinkage are advantageous, they are neglected.
The characteristic value of shrinkage strain is given on Sheet 6 as cd = 33.1 10−5 and the modular ratio is L = 15.4. This is very close to the value for long-term effects generally and for determining the secondary effects, the long-term properties will be used for both.
For a fully restrained section, the restraint force and moment in the span girder, inner beam, due to the characteristic values of shrinkage strain are given by:
Centre of force
Strain Force (kN)
Below top
Above NA
moment (kNm)
Slab –0.000331 –4164 125 327 –1362
Haunch –0.000331 –146 275 177 –26
–4310 –1388
Hence the primary effects are:
Release of restraint
W (steel units) Restraint Bending Axial Total
Top of slab 5.93E+07 4.5 –1.5 –2.5 0.5
bottom of slab 1.33E+08 4.5 –0.7 –2.5 1.3
bottom of haunch 1.76E+08 4.5 –0.5 –2.5 1.5
Top of top flange 1.76E+08 0.0 –7.9 –38.4 –46.3
bottom flange –2.83E+07 0.0 49.0 –38.4 10.6
Diagrammatically:
0
200
400
600
800
1000
1200
1400
1600
-60.0 -40.0 -20.0 0.0 20.0
The release of the restraint moments is applied along the span, in the uncracked regions, as a separate loadcase, to determine the secondary effects of shrinkage.
4-2/ 5.4.2.2(8)
P357 Composite Highway Bridge Design: Worked ExamplesC
reat
ed o
n 16
Apr
il 20
12T
his
mat
eria
l is
copy
right
- a
ll rig
hts
rese
rved
. Use
of t
his
docu
men
t is
subj
ect t
o th
e te
rms
and
cond
ition
s of
the
Ste
elbi
z Li
cenc
e A
gree
men
t
Job No. BCR113 Sheet 18 of 64 Rev A
Job Title Composite highway bridges: Worked examples
Subject Example 1: Multi-girder two-span bridge Section 6: Global analysis
Made by DCI Date July 2009
Silwood Park, Ascot, Berks SL5 7QN Telephone: (01344) 636525 Fax: (01344) 636570 CALCULATION SHEET
Client
SCI Checked by JMS Date Sep 2009
P357-example1-D06.doc 22 Printed 17/03/2010
6 Global analysis
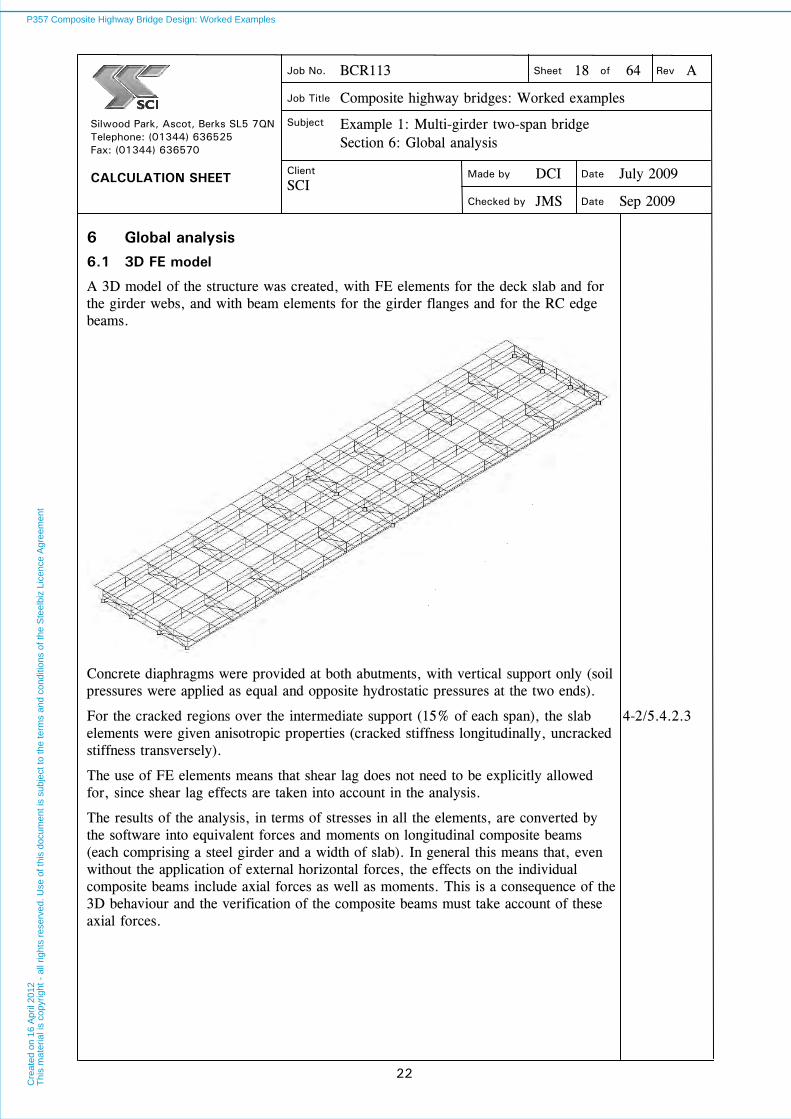
6.1 3D FE model
A 3D model of the structure was created, with FE elements for the deck slab and for the girder webs, and with beam elements for the girder flanges and for the RC edge beams.
Concrete diaphragms were provided at both abutments, with vertical support only (soil pressures were applied as equal and opposite hydrostatic pressures at the two ends).
For the cracked regions over the intermediate support (15% of each span), the slab elements were given anisotropic properties (cracked stiffness longitudinally, uncracked stiffness transversely).
4-2/5.4.2.3
The use of FE elements means that shear lag does not need to be explicitly allowed for, since shear lag effects are taken into account in the analysis.
The results of the analysis, in terms of stresses in all the elements, are converted by the software into equivalent forces and moments on longitudinal composite beams (each comprising a steel girder and a width of slab). In general this means that, even without the application of external horizontal forces, the effects on the individual composite beams include axial forces as well as moments. This is a consequence of the 3D behaviour and the verification of the composite beams must take account of these axial forces.
P357 Composite Highway Bridge Design: Worked ExamplesC
reat
ed o
n 16
Apr
il 20
12T
his
mat
eria
l is
copy
right
- a
ll rig
hts
rese
rved
. Use
of t
his
docu
men
t is
subj
ect t
o th
e te
rms
and
cond
ition
s of
the
Ste
elbi
z Li
cenc
e A
gree
men
t
Job No. BCR113 Sheet 19 of 64 Rev A
Job Title Composite highway bridges: Worked examples
Subject Example 1: Multi-girder two-span bridge Section 6: Global analysis
Made by DCI Date July 2009
Silwood Park, Ascot, Berks SL5 7QN Telephone: (01344) 636525 Fax: (01344) 636570 CALCULATION SHEET
Client
SCI Checked by JMS Date Sep 2009
P357-example1-D06.doc 23 Printed 17/03/2010
6.2 Construction stages
It is presumed that the deck will be concreted in two stages - the whole of span 1, followed by the whole of span 2. The edge beams will be concreted after span 2. Separate analytical models are therefore provided for:
Stage 1 All steelwork, wet concrete in span 1 Stage 2 Composite structure in span 1 (long-term properties), wet concrete in span 2 Stage 3 Composite structure in both spans (long-term properties) Stage 4 Composite structure (short term properties)
(For simplicity, the weight of the edge beams is applied to the stage 3 model, which includes the long-term properties of the edge beams, rather than introduce another model. The difference between the two approaches is negligible, in relation to the design of the main beams.)
A further model, a modification of Stage 1, without the wet slab, was analysed to determine the rotational stiffness of the beams at that stage.
6.3 Analysis results
All the following results are for design values of actions, i.e. after application of appropriate partial factors on characteristic values of actions.
For construction loading, results are given for the total effects at each of the three construction stages. For traffic loading the results are given for the combination of traffic and pedestrian loading for worst bending effects at three locations - at the pier, at a girder splice (the same position as the first bracing adjacent to the intermediate support) and at ‘mid-span’ (taken to be at the bracing position, 12.4 m from the end support).
Stage 1 Self weight of steelwork Self weight of concrete on span 1 Construction loads on span 1
ULS SLS Distance from pier (m) My (kNm) Fx (kN) Fz (kN) My (kNm) Fx (kN) Fz (kN)
0 –2573 0 689 –1958 0 519
6.3 1024 –2 415 752 –1 312
15.6 3132 –3 43 2343 –2 33
28 25 1 –521 19 0 –391
Note: Fx is axial force, Fz is vertical shear
Stage 2 Self weight of concrete on span 2 Construction loads on span 2 Removal of construction loads on span 1
P357 Composite Highway Bridge Design: Worked ExamplesC
reat
ed o
n 16
Apr
il 20
12T
his
mat
eria
l is
copy
right
- a
ll rig
hts
rese
rved
. Use
of t
his
docu
men
t is
subj
ect t
o th
e te
rms
and
cond
ition
s of
the
Ste
elbi
z Li
cenc
e A
gree
men
t

Job No. BCR113 Sheet 20 of 64 Rev A
Job Title Composite highway bridges: Worked examples
Subject Example 1: Multi-girder two-span bridge Section 6: Global analysis
Made by DCI Date July 2009
Silwood Park, Ascot, Berks SL5 7QN Telephone: (01344) 636525 Fax: (01344) 636570 CALCULATION SHEET
Client
SCI Checked by JMS Date Sep 2009
P357-example1-D06.doc 24 Printed 17/03/2010
ULS SLS Distance from pier (m) My (kNm) Fx (kN) Fz (kN) My (kNm) Fx (kN) Fz (kN)
0 –2499 –22 –13 –1851 –16 –10
6.3 –2354 31 45 –1744 23 33
15.6 –1714 –5 96 –1270 –3 71
28 –5 3 182 –4 2 135
Stage 3 Self weight of concrete edge beams Self weight of parapets Self weight of carriageway surfacing Self weight of footway construction Removal of construction loads on span 2
ULS SLS Distance from pier (m) My (kNm) Fx (kN) Fz (kN) My (kNm) Fx (kN) Fz (kN)
0.0 –1705 –230 308 –1444 –168 260
6.3 89 –87 193 51 –63 163
15.6 1265 114 46 1033 84 38
28.0 165 –17 –198 117 –12 –166
Long term shrinkage (restraint moments applied in uncracked regions) Values apply at both ULS and SLS since Sh = 1.0
characteristic Distance from pier (m) My (kNm) Fx (kN) Fz (kN)
0.0 –1552 –43 45
6.3 –1189 16 53
15.6 –695 2 54
28.0 –3 33 50
Sheet 2
Stage 4 – transient actions Traffic loads for worst hogging at intermediate support (gr5 loads) (The effects due to gr5 loads without footway loading are greater than those due to gr1a, including footway loading.)
ULS SLS Distance from pier (m) My (kNm) Fx (kN) Fz (kN) My (kNm) Fx (kN) Fz (kN)
0 –3621 622 499 –2682 461 370
6.3 –1139 432 348 –844 320 258
15.6 781 66 83 579 49 61
28 –269 26 –201 –199 19 –149
P357 Composite Highway Bridge Design: Worked ExamplesC
reat
ed o
n 16
Apr
il 20
12T
his
mat
eria
l is
copy
right
- a
ll rig
hts
rese
rved
. Use
of t
his
docu
men
t is
subj
ect t
o th
e te
rms
and
cond
ition
s of
the
Ste
elbi
z Li
cenc
e A
gree
men
t
Job No. BCR113 Sheet 21 of 64 Rev A
Job Title Composite highway bridges: Worked examples
Subject Example 1: Multi-girder two-span bridge Section 6: Global analysis
Made by DCI Date July 2009
Silwood Park, Ascot, Berks SL5 7QN Telephone: (01344) 636525 Fax: (01344) 636570 CALCULATION SHEET
Client
SCI Checked by JMS Date Sep 2009
P357-example1-D06.doc 25 Printed 17/03/2010
Traffic loads for worst hogging at splice position (gr5 loads) (The effects due to gr5 loads without footway loading are greater than those due to gr1a, including footway loading.)
ULS SLS Distance from pier (m) My (kNm) Fx (kN) Fz (kN) My (kNm) Fx (kN) Fz (kN)
0 –2895 479 184 –2145 355 136
6.3 –1980 479 183 –1467 355 135
15.6 –528 207 117 –391 153 86
28 –82 –7 –78 –61 –5 –57
Traffic loads for worst sagging at splice position (gr5 loads) (The effects due to gr5 loads without footway loading are greater than those due to gr1a, including footway loading.)
ULS SLS Distance from pier (m) My (kNm) Fx (kN) Fz (kN) My (kNm) Fx (kN) Fz (kN)
0 –2457 264 1268 –1820 196 939
6.3 2839 –160 303 2103 –118 225
15.6 2058 –296 –151 1524 –219 –112
28 –370 53 –198 –274 39 –147
Traffic loads for worst sagging at ‘mid-span’ (12.4 m from abutment) (gr5 loads) (The effects due to gr5 loads without footway loading are greater than those due to gr1a, including footway loading.)
ULS SLS Distance from pier (m) My (kNm) Fx (kN) Fz (kN) My (kNm) Fx (kN) Fz (kN)
0 –2425 381 661 –1796 282 490
6.3 1040 12 525 771 9 389
15.6 4952 –692 156 3668 –513 116
28 –1180 145 –691 –874 107 –512
gr5 traffic loads for maximum shear forces ULS SLS
My (kNm) Fx (kN) Fz (kN) My (kNm) Fx (kN) Fz (kN)
Pier –3206 387 1482 –2375 287 1098
Splice+ 2367 –11 669 1754 –8 496
Splice– 733 –101 –24 543 –75 –18
Span– 2805 –502 –396 2078 –372 –293
Abut– –1347 119 –1354 –998 88 –1003
P357 Composite Highway Bridge Design: Worked ExamplesC
reat
ed o
n 16
Apr
il 20
12T
his
mat
eria
l is
copy
right
- a
ll rig
hts
rese
rved
. Use
of t
his
docu
men
t is
subj
ect t
o th
e te
rms
and
cond
ition
s of
the
Ste
elbi
z Li
cenc
e A
gree
men
t

Job No. BCR113 Sheet 22 of 64 Rev A
Job Title Composite highway bridges: Worked examples
Subject Example 1: Multi-girder two-span bridge Section 6: Global analysis
Made by DCI Date July 2009
Silwood Park, Ascot, Berks SL5 7QN Telephone: (01344) 636525 Fax: (01344) 636570 CALCULATION SHEET
Client
SCI Checked by JMS Date Sep 2009
P357-example1-D06.doc 26 Printed 17/03/2010
Effects of thermal actions
Vertical temperature difference (restraint moments applied in
uncracked regions)
Soil pressures due to characteristic value of thermal expansion
characteristic characteristic Distance from pier (m) My (kNm) Fx (kN) Fz (kN) My (kNm) Fx (kN) Fz (kN)
0 423 3 –10 1058 1211 –50
6.3 340 –12 –14 –25 1187 –55
15.6 215 27 –15 –537 1253 –58
28 17 –9 –14 –1265 1204 –54
Note that the effect of the soil pressure (due to restraint of thermal expansion) introduces hogging moments at the abutments and sagging moments at the intermediate support, as well as axial force. The total effect at the pier is therefore favourable, in terms of stresses in the bottom flange (and, in the rebars, the moment and axial force both reduce tension). Similarly, there is a hogging moment at the ‘midspan’ position and again the total effect is favourable, both in the bottom flange and the slab.
Range of effects due to passage of fatigue vehicle Worst bending effects Pier Splice Span My (kNm) Fx (kN) My (kNm) Fx (kN) My (kNm) Fx (kN) Lane 1 pos 0 0 407 –29 653 60 Lane 1 neg –428 76 –267 85 –135 15 range 428 –76 674 –114 788 45 Lane 2 pos 0 0 387 –17 626 49 Lane 2 neg –401 89 –253 98 –125 15 401 –89 640 –115 751 34
Worst shear effects Pier Splice Span Abut Fz (kN) Fz (kN) Fz (kN) Fz (kN) Lane 1 pos 265 93 51 14 Lane 1 neg –6 –6 –25 –269 range 271 99 76 283 Lane 2 pos 235 88 45 13 Lane 2 neg 0 –2 –23 –247 235 90 68 260
P357 Composite Highway Bridge Design: Worked ExamplesC
reat
ed o
n 16
Apr
il 20
12T
his
mat
eria
l is
copy
right
- a
ll rig
hts
rese
rved
. Use
of t
his
docu
men
t is
subj
ect t
o th
e te
rms
and
cond
ition
s of
the
Ste
elbi
z Li
cenc
e A
gree
men
t
Job No. BCR113 Sheet 23 of 64 Rev A
Job Title Composite highway bridges: Worked examples
Subject Example 1: Multi-girder two-span bridge Section 7: Design values of the effects of combined actions
Made by DCI Date July 2009
Silwood Park, Ascot, Berks SL5 7QN Telephone: (01344) 636525 Fax: (01344) 636570 CALCULATION SHEET
Client
SCI Checked by JMS Date Sep 2009
P357-example1-D06.doc 27 Printed 17/03/2010
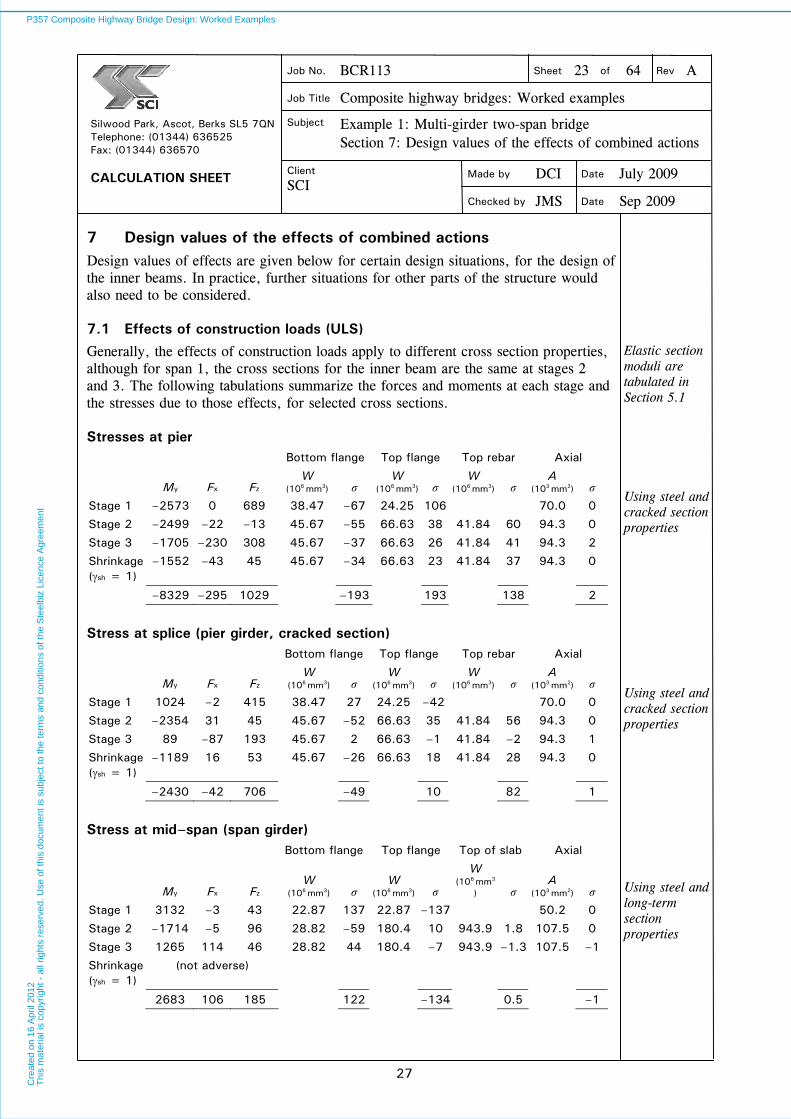
7 Design values of the effects of combined actions
Design values of effects are given below for certain design situations, for the design of the inner beams. In practice, further situations for other parts of the structure would also need to be considered.
7.1 Effects of construction loads (ULS)
Generally, the effects of construction loads apply to different cross section properties, although for span 1, the cross sections for the inner beam are the same at stages 2 and 3. The following tabulations summarize the forces and moments at each stage and the stresses due to those effects, for selected cross sections.
Elastic section moduli are tabulated in Section 5.1
Stresses at pier Bottom flange Top flange Top rebar Axial
My Fx Fz W
(106 mm3) σ W
(106 mm3) σ W
(106 mm3) σ A
(103 mm2) σ
Stage 1 –2573 0 689 38.47 –67 24.25 106 70.0 0
Stage 2 –2499 –22 –13 45.67 –55 66.63 38 41.84 60 94.3 0
Stage 3 –1705 –230 308 45.67 –37 66.63 26 41.84 41 94.3 2
Shrinkage (sh = 1)
–1552 –43 45 45.67 –34 66.63 23 41.84 37 94.3 0
–8329 –295 1029 –193 193 138 2
Using steel and cracked section properties
Stress at splice (pier girder, cracked section) Bottom flange Top flange Top rebar Axial
My Fx Fz W
(106 mm3) σ W
(106 mm3) σ W
(106 mm3) σ A
(103 mm2) σ
Stage 1 1024 –2 415 38.47 27 24.25 –42 70.0 0
Stage 2 –2354 31 45 45.67 –52 66.63 35 41.84 56 94.3 0
Stage 3 89 –87 193 45.67 2 66.63 –1 41.84 –2 94.3 1
Shrinkage (sh = 1)
–1189 16 53 45.67 –26 66.63 18 41.84 28 94.3 0
–2430 –42 706 –49 10 82 1
Using steel and cracked section properties
Stress at mid–span (span girder) Bottom flange Top flange Top of slab Axial
My Fx Fz W
(106 mm3) σ W
(106 mm3) σ
W (106 mm3
) σ A
(103 mm2) σ
Stage 1 3132 –3 43 22.87 137 22.87 –137 50.2 0
Stage 2 –1714 –5 96 28.82 –59 180.4 10 943.9 1.8 107.5 0
Stage 3 1265 114 46 28.82 44 180.4 –7 943.9 –1.3 107.5 –1
Shrinkage (sh = 1)
(not adverse)
2683 106 185 122 –134 0.5 –1
Using steel and long-term section properties
P357 Composite Highway Bridge Design: Worked ExamplesC
reat
ed o
n 16
Apr
il 20
12T
his
mat
eria
l is
copy
right
- a
ll rig
hts
rese
rved
. Use
of t
his
docu
men
t is
subj
ect t
o th
e te
rms
and
cond
ition
s of
the
Ste
elbi
z Li
cenc
e A
gree
men
t
Job No. BCR113 Sheet 24 of 64 Rev A
Job Title Composite highway bridges: Worked examples
Subject Example 1: Multi-girder two-span bridge Section 7: Design values of the effects of combined actions
Made by DCI Date July 2009
Silwood Park, Ascot, Berks SL5 7QN Telephone: (01344) 636525 Fax: (01344) 636570 CALCULATION SHEET
Client
SCI Checked by JMS Date Sep 2009
P357-example1-D06.doc 28 Printed 17/03/2010
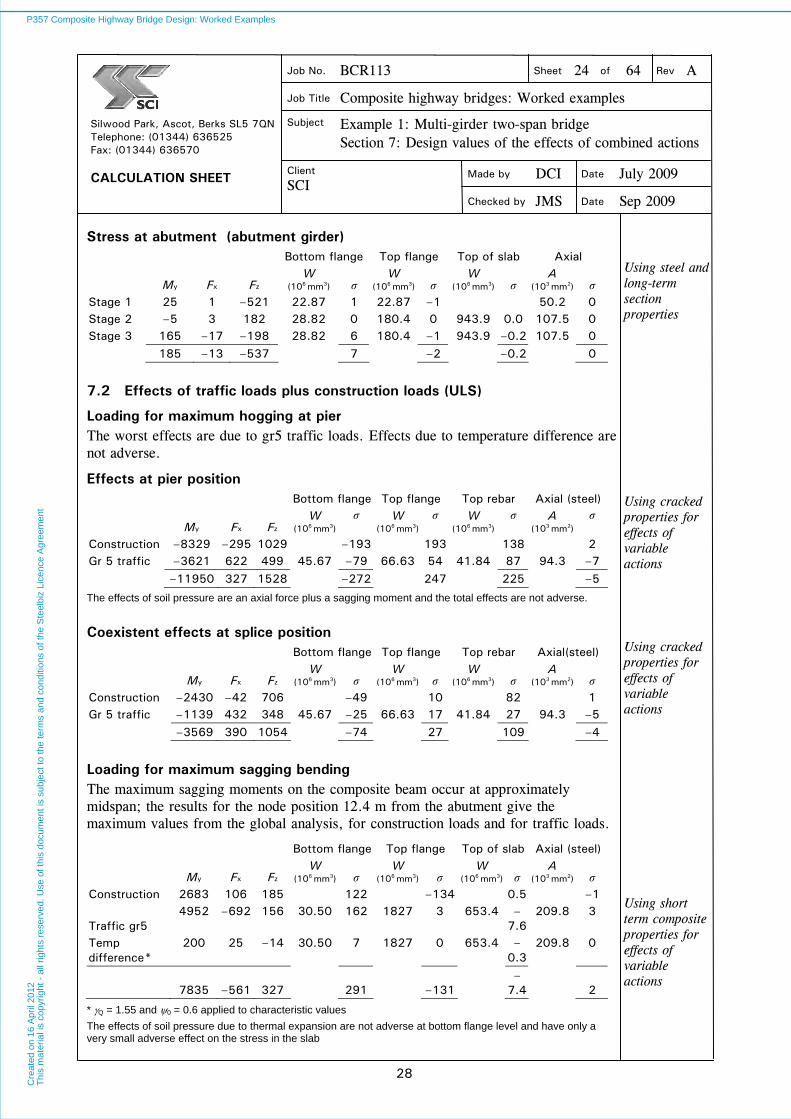
Stress at abutment (abutment girder) Bottom flange Top flange Top of slab Axial
My Fx Fz W
(106 mm3) σ W
(106 mm3) σ W
(106 mm3) σ A
(103 mm2) σ Stage 1 25 1 –521 22.87 1 22.87 –1 50.2 0 Stage 2 –5 3 182 28.82 0 180.4 0 943.9 0.0 107.5 0 Stage 3 165 –17 –198 28.82 6 180.4 –1 943.9 –0.2 107.5 0 185 –13 –537 7 –2 –0.2 0
Using steel and long-term section properties
7.2 Effects of traffic loads plus construction loads (ULS)
Loading for maximum hogging at pier The worst effects are due to gr5 traffic loads. Effects due to temperature difference are not adverse.
Effects at pier position Bottom flange Top flange Top rebar Axial (steel)
My Fx Fz W
(106 mm3) σ W
(106 mm3) σ W
(106 mm3) σ A
(103 mm2) σ
Construction –8329 –295 1029 –193 193 138 2 Gr 5 traffic –3621 622 499 45.67 –79 66.63 54 41.84 87 94.3 –7 –11950 327 1528 –272 247 225 –5
The effects of soil pressure are an axial force plus a sagging moment and the total effects are not adverse.
Using cracked properties for effects of variable actions
Coexistent effects at splice position Bottom flange Top flange Top rebar Axial(steel)
My Fx Fz W
(106 mm3) σ W
(106 mm3) σ W
(106 mm3) σ A
(103 mm2) σ Construction –2430 –42 706 –49 10 82 1 Gr 5 traffic –1139 432 348 45.67 –25 66.63 17 41.84 27 94.3 –5 –3569 390 1054 –74 27 109 –4
Using cracked properties for effects of variable actions
Loading for maximum sagging bending The maximum sagging moments on the composite beam occur at approximately midspan; the results for the node position 12.4 m from the abutment give the maximum values from the global analysis, for construction loads and for traffic loads.
Bottom flange Top flange Top of slab Axial (steel)
My Fx Fz W
(106 mm3) σ W
(106 mm3) σ W
(106 mm3) σ A
(103 mm2) σ Construction 2683 106 185 122 –134 0.5 –1
Traffic gr5 4952 –692 156 30.50 162 1827 3 653.4 –
7.6 209.8 3
Temp difference*
200 25 –14 30.50 7 1827 0 653.4 –0.3
209.8 0
7835 –561 327 291 –131 –
7.4 2
* Q = 1.55 and 0 = 0.6 applied to characteristic values
The effects of soil pressure due to thermal expansion are not adverse at bottom flange level and have only a very small adverse effect on the stress in the slab
Using short term composite properties for effects of variable actions
P357 Composite Highway Bridge Design: Worked ExamplesC
reat
ed o
n 16
Apr
il 20
12T
his
mat
eria
l is
copy
right
- a
ll rig
hts
rese
rved
. Use
of t
his
docu
men
t is
subj
ect t
o th
e te
rms
and
cond
ition
s of
the
Ste
elbi
z Li
cenc
e A
gree
men
t

Job No. BCR113 Sheet 25 of 64 Rev A
Job Title Composite highway bridges: Worked examples
Subject Example 1: Multi-girder two-span bridge Section 7: Design values of the effects of combined actions
Made by DCI Date July 2009
Silwood Park, Ascot, Berks SL5 7QN Telephone: (01344) 636525 Fax: (01344) 636570 CALCULATION SHEET
Client
SCI Checked by JMS Date Sep 2009
P357-example1-D06.doc 29 Printed 17/03/2010
Loading for maximum hogging at splice The maximum hogging moment at the splice position is much greater than the maximum sagging moment, so this will govern the design of the splice.
Pier side of splice Bottom flange Top flange Top rebar Axial(steel)
My Fx Fz W
(106 mm3) σ
W (106 mm3
) σ W
(106 mm3) σ A
(103 mm2) σ Construction –2430 –42 706 –49 10 82 1 Gr 5 traffic –1980 479 183 45.67 –43 66.83 30 41.84 47 94.3 –5 Temp (soil press)
–25 1187 55 45.67 –1 66.63 0 41.84 1 94.3 –13
–4435 1624 944 –93 40 130 –17
Using cracked properties for effects of variable actions
No results are tabulated for the bracing position, 0.4 m closer to the centre support, but values may be interpolated linearly with sufficient accuracy. In practice, model nodes might be positioned at bracing locations.
Span side of splice Bottom flange Top flange Top rebar Axial(steel)
My Fx Fz W
(106 mm3) σ W
(106 mm3) σ W
(106 mm3) σ A
(103 mm2) σ
Construction –2430 –42 706 –82 4 91 1 Gr 5 traffic –1980 479 183 27.24 –73 71.64 28 38.06 52 74.5 –6 Temp (soil press)
–25 1187 55 27.24 0 71.64 0 38.06 0 74.5 –16
–4435 1624 944 –155 32 143 –21
Using cracked properties for effects of variable action
Loading for maximum shear
Maximum shear at pier position The value of the maximum shear is needed to verify the shear resistance of the web and to determine the longitudinal shear on the stud connectors.
Bottom flange Top flange Top rebar Axial (steel)
My Fx Fz W
(106 mm3) σ W
(106 mm3) σ W
(106 mm3) σ A
(103 mm2) σ Construction –8329 –295 1029 –93 203 138 2 Gr 5 traffic –3206 387 1482 45.67 –70 66.63 48 41.84 77 94.3 –4 –11535 92 2511
Using cracked properties for effects of variable actions
Maximum shear at splice position The value of the maximum shear is needed to determine the maximum longitudinal shear on the stud connectors.
My Fx Fz
Construction –2430 –42 706
Gr 5 traffic 2367 –11 669
–63 –53 1375
P357 Composite Highway Bridge Design: Worked ExamplesC
reat
ed o
n 16
Apr
il 20
12T
his
mat
eria
l is
copy
right
- a
ll rig
hts
rese
rved
. Use
of t
his
docu
men
t is
subj
ect t
o th
e te
rms
and
cond
ition
s of
the
Ste
elbi
z Li
cenc
e A
gree
men
t

Job No. BCR113 Sheet 26 of 64 Rev A
Job Title Composite highway bridges: Worked examples
Subject Example 1: Multi-girder two-span bridge Section 7: Design values of the effects of combined actions
Made by DCI Date July 2009
Silwood Park, Ascot, Berks SL5 7QN Telephone: (01344) 636525 Fax: (01344) 636570 CALCULATION SHEET
Client
SCI Checked by JMS Date Sep 2009
P357-example1-D06.doc 30 Printed 17/03/2010
Maximum shear at midspan position The value of the maximum shear is needed to determine the maximum longitudinal shear on the stud connectors.
My Fx Fz
Construction 2683 106 185
Gr 5 traffic 2805 –502 –396
5488 –396 –211
Maximum shear at abutment My Fx Fz
Construction 185 –13 –537
Gr 5 traffic –1347 119 –1354
–1162 106 –1891
7.3 Effects of traffic loads plus construction loads (SLS)
The values of effects at SLS are needed to verify crack control in the slab at the pier and to verify the slip resistance of the splice.
Effects at pier position Bottom flange Top flange Top rebar Axial (steel)
My Fx Fz W
(106 mm3) σ W
(106 mm3) σ W
(106 mm3) σ A
(103 mm2) σ
Stage 1 –1964 44 494 38.47 –51 24.25 81 70.0 0
Stage 2 –1857 29 –2 45.67 –41 66.63 28 41.84 44 94.3 0
Stage 3 –1451 –178 290 45.67 –32 66.63 22 41.84 35 94.3 2
Shrinkage –1546 59 47 45.67 –34 66.63 23 41.84 37 132.2 0
Gr 5 traffic –2695 719 483 45.67 –59 66.63 40 41.84 64 94.3 –7
–9513 673 1312 –217 194 180 –5
The effects of soil pressures due to thermal expansion are not adverse at this position.
Effects at splice position (worst shear) Pier side Bottom flange Top flange Top rebar Axial(steel)
My Fx Fz W
(106 mm3) σ W
(106 mm3) σ W
(106 mm3) σ A
(103 mm2) σ
Stage 1 740 –5 359 38.47 20 24.25 –31 70.0 0
Stage 2 –1745 30 39 45.67 –38 66.63 26 41.84 42 94.3 0
Stage 3 39 –98 189 45.67 1 66.63 –1 41.84 –1 94.3 1
Shrinkage –1210 54 53 45.67 –26 66.63 18 41.84 28 132.2 0
Gr 5 traffic –1474 390 141 45.67 –32 66.63 22 41.84 35 94.3 –4
–3650 371 781 –75 34 104 –3
P357 Composite Highway Bridge Design: Worked ExamplesC
reat
ed o
n 16
Apr
il 20
12T
his
mat
eria
l is
copy
right
- a
ll rig
hts
rese
rved
. Use
of t
his
docu
men
t is
subj
ect t
o th
e te
rms
and
cond
ition
s of
the
Ste
elbi
z Li
cenc
e A
gree
men
t

Job No. BCR113 Sheet 27 of 64 Rev A
Job Title Composite highway bridges: Worked examples
Subject Example 1: Multi-girder two-span bridge Section 7: Design values of the effects of combined actions
Made by DCI Date July 2009
Silwood Park, Ascot, Berks SL5 7QN Telephone: (01344) 636525 Fax: (01344) 636570 CALCULATION SHEET
Client
SCI Checked by JMS Date Sep 2009
P357-example1-D06.doc 31 Printed 17/03/2010
Span side Bottom flange Top flange Top rebar Axial(steel)
My Fx Fz W
(106 mm3) σ W
(106 mm3) σ W
(106 mm3) σ A
(103 mm2) σ
Stage 1 740 –5 359 22.87 33 22.87 –33 50.2 0
Stage 2 –1745 30 39 27.24 –64 71.64 24 38.06 46 74.5 0
Stage 3 39 –98 189 27.24 2 71.64 –1 38.06 –1 74.5 1
Shrinkage –1210 54 53 27.24 –44 71.64 17 38.06 31 74.5 0
Gr 5 traffic –1474 390 141 27.24 –54 71.64 20 38.06 39 74.5 –5
–3650 371 781 –127 27 115 –4
7.4 Effects due to fatigue vehicle
The range of bending effects due to the passage of the fatigue vehicle in each lane is determined at the three locations already considered for static loading.
At pier Bottom flange Top flange Top rebar Axial(steel)
My Fx Fz W
(106 mm3) σ W
(106 mm3) σ W
(106 mm3) σ
A (103 mm2
) σ
Range, lane 1 428 –76 45.67 9.4 66.63 –6.4 41.84 –10.2 94.3 0.8
Range, lane 2 401 –89 45.67 8.8 66.63 –6.0 41.84 –9.6 94.3 0.9
Ratio lane 2/lane 1 moments = 0.937
At splice (span side, uncracked) Bottom flange Top flange Top rebar Axial(steel)
My Fx Fz W
(106 mm3) σ W
(106 mm3) σ W
(106 mm3) σ A
(103 mm2) σ
Range, lane 1 674 –114 30.50 22.1 –1,827 0.4 653.4 –1.0 209.8 0.5
Range, lane 2 640 –115 30.50 21.0 –1,827 0.4 653.4 –1.0 209.8 0.5
Ratio lane 2/lane 1 moments = 0.950
At midspan Bottom flange Top flange Top rebar Axial(steel)
My Fx Fz W
(106 mm3) σ W
(106 mm3) σ W
(106 mm3) σ A
(103 mm2) σ
Range, lane 1 788 45 30.50 25.8 –1,827 0.4 653.4 –1.2 209.8 –0.2
Range, lane 2 751 34 30.50 24.6 –1,827 0.4 653.4 –1.1 209.8 –0.2
Ratio lane 2/lane 1 moments = 0.953
P357 Composite Highway Bridge Design: Worked ExamplesC
reat
ed o
n 16
Apr
il 20
12T
his
mat
eria
l is
copy
right
- a
ll rig
hts
rese
rved
. Use
of t
his
docu
men
t is
subj
ect t
o th
e te
rms
and
cond
ition
s of
the
Ste
elbi
z Li
cenc
e A
gree
men
t
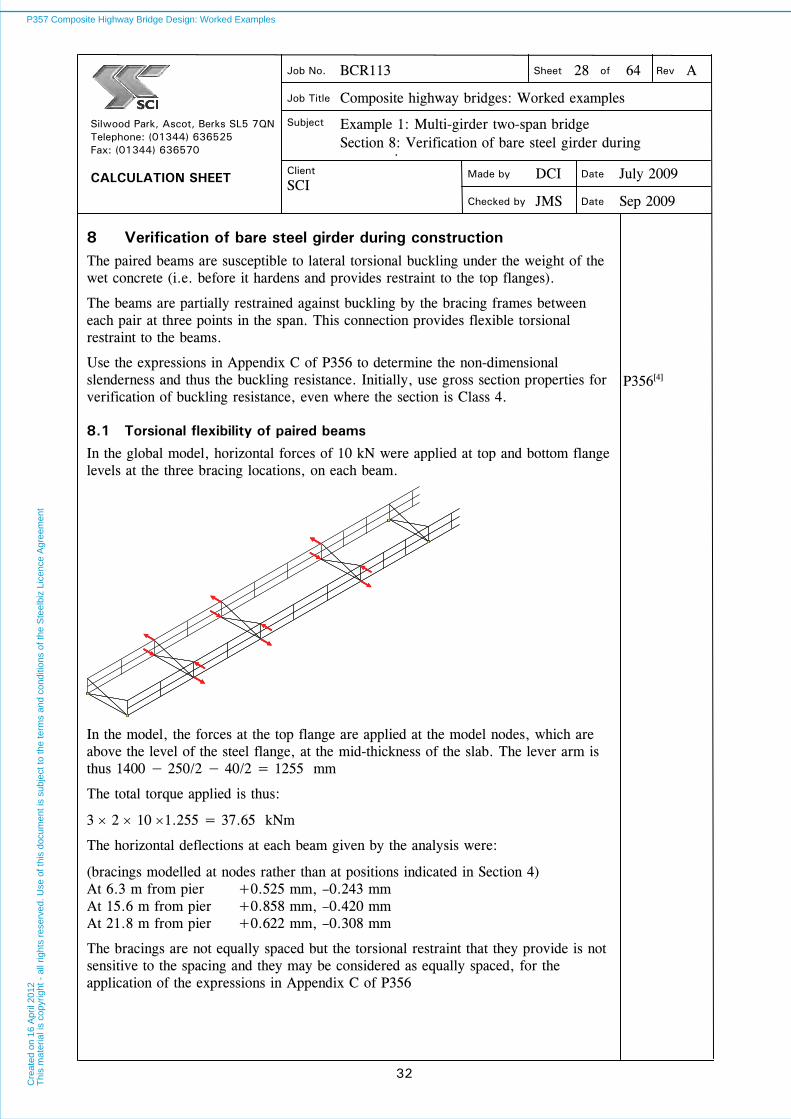
Job No. BCR113 Sheet 28 of 64 Rev A
Job Title Composite highway bridges: Worked examples
Subject Example 1: Multi-girder two-span bridge Section 8: Verification of bare steel girder during
t ti Made by DCI Date July 2009
Silwood Park, Ascot, Berks SL5 7QN Telephone: (01344) 636525 Fax: (01344) 636570 CALCULATION SHEET
Client
SCI Checked by JMS Date Sep 2009
P357-example1-D06.doc 32 Printed 17/03/2010
8 Verification of bare steel girder during construction
The paired beams are susceptible to lateral torsional buckling under the weight of the wet concrete (i.e. before it hardens and provides restraint to the top flanges).
The beams are partially restrained against buckling by the bracing frames between each pair at three points in the span. This connection provides flexible torsional restraint to the beams.
Use the expressions in Appendix C of P356 to determine the non-dimensional slenderness and thus the buckling resistance. Initially, use gross section properties for verification of buckling resistance, even where the section is Class 4.
P356[ 4]
8.1 Torsional flexibility of paired beams
In the global model, horizontal forces of 10 kN were applied at top and bottom flange levels at the three bracing locations, on each beam.
In the model, the forces at the top flange are applied at the model nodes, which are above the level of the steel flange, at the mid-thickness of the slab. The lever arm is thus 1400 − 250/2 − 40/2 = 1255 mm
The total torque applied is thus:
3 2 10 1.255 = 37.65 kNm
The horizontal deflections at each beam given by the analysis were:
(bracings modelled at nodes rather than at positions indicated in Section 4) At 6.3 m from pier +0.525 mm, –0.243 mm At 15.6 m from pier +0.858 mm, –0.420 mm At 21.8 m from pier +0.622 mm, –0.308 mm
The bracings are not equally spaced but the torsional restraint that they provide is not sensitive to the spacing and they may be considered as equally spaced, for the application of the expressions in Appendix C of P356
P357 Composite Highway Bridge Design: Worked ExamplesC
reat
ed o
n 16
Apr
il 20
12T
his
mat
eria
l is
copy
right
- a
ll rig
hts
rese
rved
. Use
of t
his
docu
men
t is
subj
ect t
o th
e te
rms
and
cond
ition
s of
the
Ste
elbi
z Li
cenc
e A
gree
men
t

Job No. BCR113 Sheet 29 of 64 Rev A
Job Title Composite highway bridges: Worked examples
Subject Example 1: Multi-girder two-span bridge Section 8: Verification of bare steel girder during
t ti Made by DCI Date July 2009
Silwood Park, Ascot, Berks SL5 7QN Telephone: (01344) 636525 Fax: (01344) 636570 CALCULATION SHEET
Client
SCI Checked by JMS Date Sep 2009
P357-example1-D06.doc 33 Printed 17/03/2010
The rotations are thus:
At 6.3 m from pier (0.525 + 0.243) / 1255 = 6.12 10−4 rad At 15.6 m from pier (0.858 + 0.420) / 1255 = 10.18 10−4 rad At 21.8 m from pier (0.622 + 0.308) / 1255 = 7.41 10−4 rad
Thus, use:
R = 10.18 10−4 / (37.65 106) = 2.705 10−11 rad/Nmm
8.2 Evaluation of non-dimensional slenderness
Geometrical parameters:
Lw = 28000 mm and for the span girder cross section, the section properties are:
Iz,c = Iz,t = 4.167 108 mm4
IT = 2.167 107 mm4
iz = 128.8 mm
h = 1100 mm
tf = 40 mm
df = 1060 mm
ht
i
L =
z
fwF = 91.7
110040
8.12828000
P356/C.4.3 and C.3.2
I + I
I = atz,cz,
cz, = 0.5 (equal flanges)
aa 128.0 = 0.8 (2 0.5 − 1) = 0
To determine Veq, the following are needed:
= 214 aaa = 4 0.5 (1−0.5) +0 = 1.0
=2wT
z2f
2
LGI
EIdπ =
27
822
2800010 2.167
6.21033.81060
π
= 1.414 (using E/G = 2.6)
P356/C.4.5
Thus:
Veq = 25.0
24
2
a
a =
25.0
20414.14
414.15.02
= 0.715
Thus the restraint parameter Veq4Lw
3/[EIz,cRdf2(1a)]= 4316
P357 Composite Highway Bridge Design: Worked ExamplesC
reat
ed o
n 16
Apr
il 20
12T
his
mat
eria
l is
copy
right
- a
ll rig
hts
rese
rved
. Use
of t
his
docu
men
t is
subj
ect t
o th
e te
rms
and
cond
ition
s of
the
Ste
elbi
z Li
cenc
e A
gree
men
t
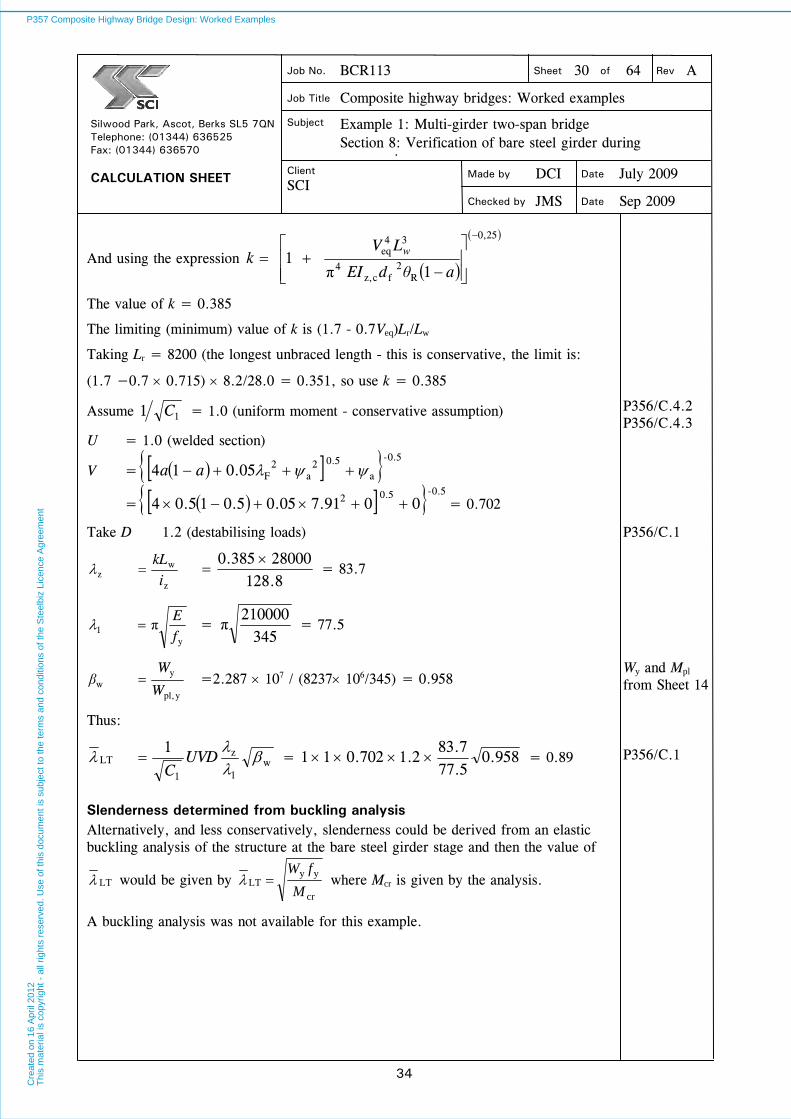
Job No. BCR113 Sheet 30 of 64 Rev A
Job Title Composite highway bridges: Worked examples
Subject Example 1: Multi-girder two-span bridge Section 8: Verification of bare steel girder during
t ti Made by DCI Date July 2009
Silwood Park, Ascot, Berks SL5 7QN Telephone: (01344) 636525 Fax: (01344) 636570 CALCULATION SHEET
Client
SCI Checked by JMS Date Sep 2009
P357-example1-D06.doc 34 Printed 17/03/2010
And using the expression
25,0
R2
fcz,4
34eq
11
aθdEI
LV k
w
π
The value of k = 0.385
The limiting (minimum) value of k is (1.7 - 0.7Veq)Lr/Lw
Taking Lr = 8200 (the longest unbraced length - this is conservative, the limit is:
(1.7 −0.7 0.715) 8.2/28.0 = 0.351, so use k = 0.385
Assume 11 C = 1.0 (uniform moment - conservative assumption)
U = 1.0 (welded section)
V = 5.0-
a
5.0 2a
2F05.014 aa
= 5.0- 5.0 2 0091.705.05.015.04 = 0.702
P356/C.4.2 P356/C.4.3
Take D 1.2 (destabilising loads) P356/C.1
z
wz i
kL
8.12828000385.0
= 83.7
y1 f
Eπ =
345210000
π = 77.5
ypl,
yw W
Wβ =2.287 107 / (8237 106/345) = 0.958
Wy and Mpl from Sheet 14
Thus:
w1
z
1
LT1
UVD
C = 958.0
5.777.83
2.1702.011 = 0.89
P356/C.1
Slenderness determined from buckling analysis Alternatively, and less conservatively, slenderness could be derived from an elastic buckling analysis of the structure at the bare steel girder stage and then the value of
LT would be given by cr
yyLT
M
fW where Mcr is given by the analysis.
A buckling analysis was not available for this example.
P357 Composite Highway Bridge Design: Worked ExamplesC
reat
ed o
n 16
Apr
il 20
12T
his
mat
eria
l is
copy
right
- a
ll rig
hts
rese
rved
. Use
of t
his
docu
men
t is
subj
ect t
o th
e te
rms
and
cond
ition
s of
the
Ste
elbi
z Li
cenc
e A
gree
men
t

Job No. BCR113 Sheet 31 of 64 Rev A
Job Title Composite highway bridges: Worked examples
Subject Example 1: Multi-girder two-span bridge Section 8: Verification of bare steel girder during
t ti Made by DCI Date July 2009
Silwood Park, Ascot, Berks SL5 7QN Telephone: (01344) 636525 Fax: (01344) 636570 CALCULATION SHEET
Client
SCI Checked by JMS Date Sep 2009
P357-example1-D06.doc 35 Printed 17/03/2010
8.3 Reduction factor
Since h/b > 2, use buckling curve d, LT = 0.76
2LTLTLTLT 2.015.0
= 289.02.089.076.015.0 = 1.16
3–2/6.3.2.2 3–1–1/6.3.2.2 3–1–1/NA.2.16
Hence
2LT
2LTLTLT 1 = 22 89.016.116.11 = 0.525
8.4 Verification
1M
yelRdb,
fWM = 6
7
101.1
345102.287525.0
= 3766 kNm 3–1–1/6.3.2.1
MEd = 3132 kNm (Sheet 23) < Mb,Rd = 3766 kNm - OK
The above calculations assume that the cross section is Class 3. In fact it is marginally Class 4, as noted on Sheet 14. The determination of the properties of the effective section for this particular cross section (neglecting fillet welds) gives the following parameters:
k = 23.9 p =0.907 = 0.069
beff = 494.2, which means that there is a ‘hole’ in the web 15.8 mm vertically with its centroid beff/2 below the underside of the top flange.
3–1–5/4.4
The section moduli are then:
2.281 107 mm4 at the mid-thickness of the top flange and
2.288 107 mm4 at the mid-thickness of the bottom flange
The modulus for the effective section should be used in the expressions for w and Mb,Rd. Here the difference is negligible.
P357 Composite Highway Bridge Design: Worked ExamplesC
reat
ed o
n 16
Apr
il 20
12T
his
mat
eria
l is
copy
right
- a
ll rig
hts
rese
rved
. Use
of t
his
docu
men
t is
subj
ect t
o th
e te
rms
and
cond
ition
s of
the
Ste
elbi
z Li
cenc
e A
gree
men
t
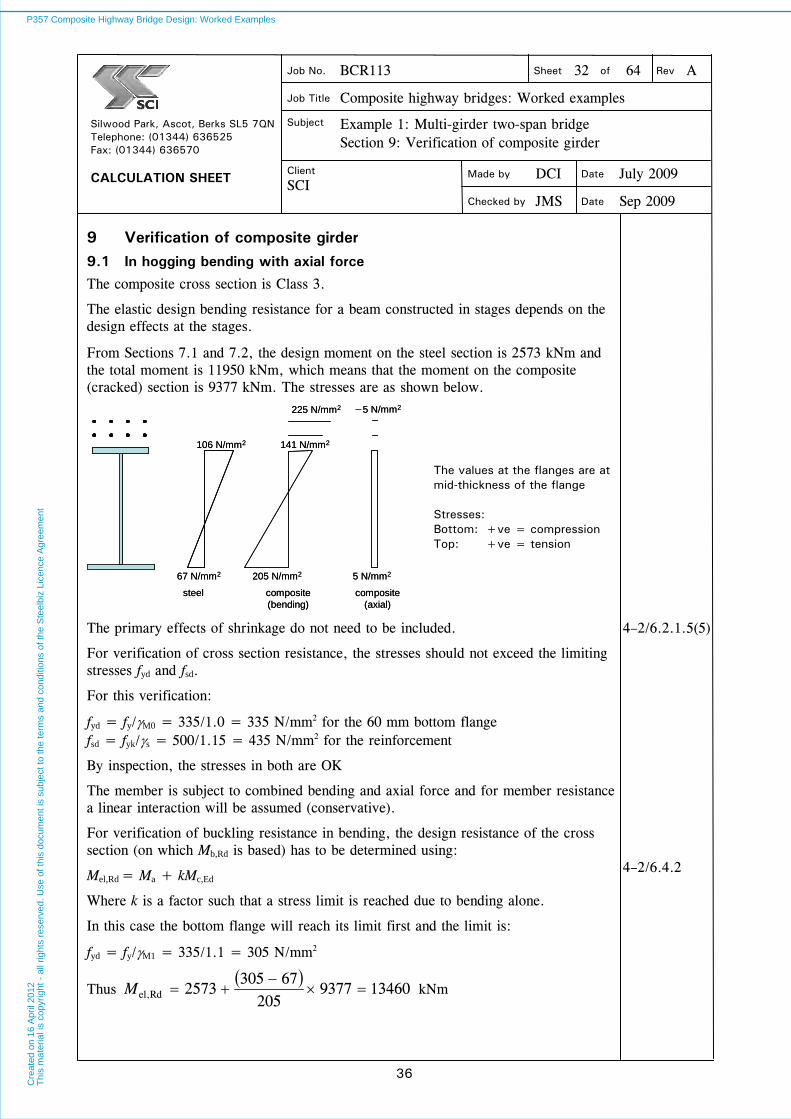
Job No. BCR113 Sheet 32 of 64 Rev A
Job Title Composite highway bridges: Worked examples
Subject Example 1: Multi-girder two-span bridge Section 9: Verification of composite girder
Made by DCI Date July 2009
Silwood Park, Ascot, Berks SL5 7QN Telephone: (01344) 636525 Fax: (01344) 636570 CALCULATION SHEET
Client
SCI Checked by JMS Date Sep 2009
P357-example1-D06.doc 36 Printed 17/03/2010
9 Verification of composite girder
9.1 In hogging bending with axial force
The composite cross section is Class 3.
The elastic design bending resistance for a beam constructed in stages depends on the design effects at the stages.
From Sections 7.1 and 7.2, the design moment on the steel section is 2573 kNm and the total moment is 11950 kNm, which means that the moment on the composite (cracked) section is 9377 kNm. The stresses are as shown below.
steel composite(bending)
67 N/mm2
106 N/mm2
205 N/mm2
225 N/mm2
composite(axial)
5 N/mm2
141 N/mm2
−5 N/mm2
steel composite(bending)
67 N/mm2
106 N/mm2
205 N/mm2
225 N/mm2
composite(axial)
5 N/mm2
141 N/mm2
−5 N/mm2
The values at the flanges are at mid-thickness of the flange Stresses: Bottom: +ve = compression Top: +ve = tension
The primary effects of shrinkage do not need to be included. 4–2/6.2.1.5(5)
For verification of cross section resistance, the stresses should not exceed the limiting stresses fyd and fsd.
For this verification:
fyd = fy/M0 = 335/1.0 = 335 N/mm2 for the 60 mm bottom flange fsd = fyk/s = 500/1.15 = 435 N/mm2 for the reinforcement
By inspection, the stresses in both are OK
The member is subject to combined bending and axial force and for member resistance a linear interaction will be assumed (conservative).
For verification of buckling resistance in bending, the design resistance of the cross section (on which Mb,Rd is based) has to be determined using:
Mel,Rd = Ma + kMc,Ed
Where k is a factor such that a stress limit is reached due to bending alone.
4–2/6.4.2
In this case the bottom flange will reach its limit first and the limit is:
fyd = fy/M1 = 335/1.1 = 305 N/mm2
Thus
134609377205
673052573Rdel,
M kNm
P357 Composite Highway Bridge Design: Worked ExamplesC
reat
ed o
n 16
Apr
il 20
12T
his
mat
eria
l is
copy
right
- a
ll rig
hts
rese
rved
. Use
of t
his
docu
men
t is
subj
ect t
o th
e te
rms
and
cond
ition
s of
the
Ste
elbi
z Li
cenc
e A
gree
men
t

Job No. BCR113 Sheet 33 of 64 Rev A
Job Title Composite highway bridges: Worked examples
Subject Example 1: Multi-girder two-span bridge Section 9: Verification of composite girder
Made by DCI Date July 2009
Silwood Park, Ascot, Berks SL5 7QN Telephone: (01344) 636525 Fax: (01344) 636570 CALCULATION SHEET
Client
SCI Checked by JMS Date Sep 2009
P357-example1-D06.doc 37 Printed 17/03/2010
To evaluate Mb,Rd, determine the slenderness
The slenderness of the length of beam between the intermediate support and the bracing at 5.9 m into the span could be evaluated considering the LTB of a section comprising the effective width of slab and the steel girder but it is much simpler and a little less conservative to use the simplified method of EN 1993–2, as allowed by EN 1994–2.
4–2/6.4.3.2
Consider an effective Tee section comprising the bottom flange and one third of the depth of the part of the web in compression. Take the depth in compression as that under total effects, including axial force.
3–2/6.3.4.2
Flange area is 600 60 mm
Height to zero stress: Stress Mid-height
(277/532) 1050 +30 = 590 mm Top flange 255 1080
Height of web in compression = 530 mm Bottom flange 277 30
Area of Tee = 600 60 + (530 14)/3 = 38470 mm2
Lateral 2nd moment of area 6003 60 /12 = 1080 106 mm4
Radius of gyration = 16838470101080 6 mm
For a buckling length of 5900 mm (support to first bracing):
64300105900
101080210000 32
62
22
E
ππL
EIN kN
3–2/(6.12)
Initially, take m conservatively as 1.0
Then Ncrit = NE = 64300 kN
448.01064300
335384703
crit
yeffLT
N
fA
3–2/(6.10)
Since h/b >2, use buckling curve d ( = 0.76)
2LTLTLTLT 2.015.0
= 2448.02.0448.076.015.0 = 0.695
3–2/6.3.2.2 3–1–1/6.3.2.2 3–1–1/NA.2.16
Hence
2LT
2LTLTLT 1 = 22 448.0695.0695.01 = 0.815
1097013460815.0Rdel,Rdb, MM kNm 3–1–1/6.3.2.1
P357 Composite Highway Bridge Design: Worked ExamplesC
reat
ed o
n 16
Apr
il 20
12T
his
mat
eria
l is
copy
right
- a
ll rig
hts
rese
rved
. Use
of t
his
docu
men
t is
subj
ect t
o th
e te
rms
and
cond
ition
s of
the
Ste
elbi
z Li
cenc
e A
gree
men
t

Job No. BCR113 Sheet 34 of 64 Rev A
Job Title Composite highway bridges: Worked examples
Subject Example 1: Multi-girder two-span bridge Section 9: Verification of composite girder
Made by DCI Date July 2009
Silwood Park, Ascot, Berks SL5 7QN Telephone: (01344) 636525 Fax: (01344) 636570 CALCULATION SHEET
Client
SCI Checked by JMS Date Sep 2009
P357-example1-D06.doc 38 Printed 17/03/2010
For verifying the contribution of axial resistance in the interaction criterion, consider the same Tee section (and thus the same slenderness and reduction factor).
No effective section for axial force is given in EN 1993–2 but it could be argued that the effective Tee that would buckle laterally should comprise half the area of the web: the slenderness with this amount of web is very little different from that derived above bending.
Rdb,N = 956030538470815.0ydTee fA kN
EdN = 192538410Tee stressA kN
Considering first the interaction for values of MEd and NEd at the support (using a linear interaction, since the buckling mode is the same for both) and with no allowance for variation over the buckling length:
11.19560192
1097011950
Rdb,
Ed
Rdb,
Ed N
N
M
M
This is inadequate, so consider the variation of moment and location for MEd.
Allowance for varying moment over buckling length
Evaluate the m parameter in 6.3.4.2(6)
Coexisting total moment at the splice = 3569 kNm and shear = 1054 kN
Assume values at the brace position of M = 4000 kNm and V = 1080 kN
(If the model had been given nodes at the bracing position as well as at the change of section, actual values could have been used but the result would be negligibly different for the small distance involved in this example.)
3–2/6.3.4.2
Using the Note to 6.3.4.2(7) and ignoring any contribution from the continuous restraint provided by the web (which will be very small) (i.e. take = 0)
M2/M1 = 4000/11950 = 0.335 = V2/V1 - 1080/1528 = 0.707
78.0707.01335.012112 12 MMΦ
52.178.0707.0144.01144.01 5.15.1 m
Hence
Ncrit = 1.52 NE = 1.52 64300 = 97740 kNm
And
363.01097740
33510384703
6
crit
yeffLT
N
fA
2LT 363.02.0363.076.015.0 = 0.628
22 363.0628.0628.01LT
= 0.877
3–1–1/6.3.2.2
P357 Composite Highway Bridge Design: Worked ExamplesC
reat
ed o
n 16
Apr
il 20
12T
his
mat
eria
l is
copy
right
- a
ll rig
hts
rese
rved
. Use
of t
his
docu
men
t is
subj
ect t
o th
e te
rms
and
cond
ition
s of
the
Ste
elbi
z Li
cenc
e A
gree
men
t
Job No. BCR113 Sheet 35 of 64 Rev A
Job Title Composite highway bridges: Worked examples
Subject Example 1: Multi-girder two-span bridge Section 9: Verification of composite girder
Made by DCI Date July 2009
Silwood Park, Ascot, Berks SL5 7QN Telephone: (01344) 636525 Fax: (01344) 636570 CALCULATION SHEET
Client
SCI Checked by JMS Date Sep 2009
P357-example1-D06.doc 39 Printed 17/03/2010
1180013460877.0Rdel,Rdb, MM kNm 3-1-1/6.3.2.1
Consider the moment at a distance 0.25Lk from the support, where LK = mL 3-2/6.3.4.2(7)
Distance = 119652.1590025.0 mm from the support
103405900119640001195011950 EdM kNm (conservative
interpolation)
The axial force and Nb,Rd could also be reduced and the resistance Nb,Rd enhanced but that adjustment is not made here (the difference in the result is negligible).
The utilisation is now:
90.09560192
1180010340
Rdb,
Ed
Rdb,
Ed N
N
M
M Acceptable
The results of the cross section verification and buckling resistance verification indicate that some economy could be achieved (reducing the cross section slightly).
Interaction with shear must also be considered.
9.2 Maximum shear at support
The maximum shear in the girder at the intermediate support = 2511 kN Sheet 25
Assume that first transverse web stiffener is provided at 1967 mm from the support (i.e. divide the length to the first bracing into three panels).
For the web panel adjacent to the support
aw = 1967 mm hw = 1000 mm t = 14 mm fy = 355 N/mm2
The factor = 1.0 according to the NA
3-1-5/NA.2.4
From Equation (5.6):
tw
4.37 kt
hw
where 81.0355235235 y f
3-1-5/5.3
Since aw > hw and there are no longitudinal stiffeners:
37.6196710000.434.50.434.5 22wt ahk
3-1-5/A.3
934.037.681.0144.37
1000w
Since the girder is continuous, consider as a ‘rigid endpost’ case; thus, from Table 5.1:
889.0934.083.083.0 w w
3-1-5/ Table 5.1
P357 Composite Highway Bridge Design: Worked ExamplesC
reat
ed o
n 16
Apr
il 20
12T
his
mat
eria
l is
copy
right
- a
ll rig
hts
rese
rved
. Use
of t
his
docu
men
t is
subj
ect t
o th
e te
rms
and
cond
ition
s of
the
Ste
elbi
z Li
cenc
e A
gree
men
t

Job No. BCR113 Sheet 36 of 64 Rev A
Job Title Composite highway bridges: Worked examples
Subject Example 1: Multi-girder two-span bridge Section 9: Verification of composite girder
Made by DCI Date July 2009
Silwood Park, Ascot, Berks SL5 7QN Telephone: (01344) 636525 Fax: (01344) 636570 CALCULATION SHEET
Client
SCI Checked by JMS Date Sep 2009
P357-example1-D06.doc 40 Printed 17/03/2010
2319101.13
141000355889.0
33
M1
wywwRdbw,
thfV kN
3-1-5/5.2
This resistance is adequate for the maximum moment situation but requires a contribution from the flanges for the maximum shear situation.
Maximum contribution from flanges is given by:
2
Rdf,
Ed
M1
yf2ff
Rdbf, 1MM
c
ftbV
3-1-5/5.4
950355100014
335606006.125.01967
6.125.0
2
2
yw2
yf2ff
fht
ftbac
w
mm
Mf,Rd is the resistance of the flanges alone (no web).
The axial resistance of the top bars and top flange is:
(2 12,108) (500/1.15) + 20000 (345/1.0) = 17430 kN
And of the bottom flange is 36000 (335/1.0) = 12060 kN
Take the lever arm between top and bottom as 1159 mm and thus:
Mf,Rd = 12060 1159 10–3 = 13980 kNm
3-1-5/5.4
For the design situation for maximum shear, the net axial force on the cross section is a small tensile force; no reduction is needed to Mf,Rd for this axial force.
For the maximum shear situation, MEd = 11535 kNm Sheet 25
MEd / Mf,Rd = 11535/13980 = 0.83
215)69.01(69283.011.195033560600 2
2
Rdbf,
V kN
The total shear resistance is thus:
Vb,Rd = 2319 + 215 = 2534 kN (3 = 2487/2534 = 0.99) Satisfactory
9.3 Combined bending shear and axial force
When MEd > Mf,Rd and when VEd > 0.5Vbw,Rd the design resistance to bending and axial force must be reduced for the coexisting shear force.
3–1–5/7.1
Maximum shear with coexisting moment As noted above, MEd / Mf,Rd = 0.83, therefore the bending resistance does not need to be reduced for shear (instead, the shear resistance has already been reduced for coexisting moment).
Maximum moment with coexisting shear VEd = 1528 kN MEd = 11950 kNm Fx,Ed = 327 kN (axial compression)
Sheet 24
P357 Composite Highway Bridge Design: Worked ExamplesC
reat
ed o
n 16
Apr
il 20
12T
his
mat
eria
l is
copy
right
- a
ll rig
hts
rese
rved
. Use
of t
his
docu
men
t is
subj
ect t
o th
e te
rms
and
cond
ition
s of
the
Ste
elbi
z Li
cenc
e A
gree
men
t
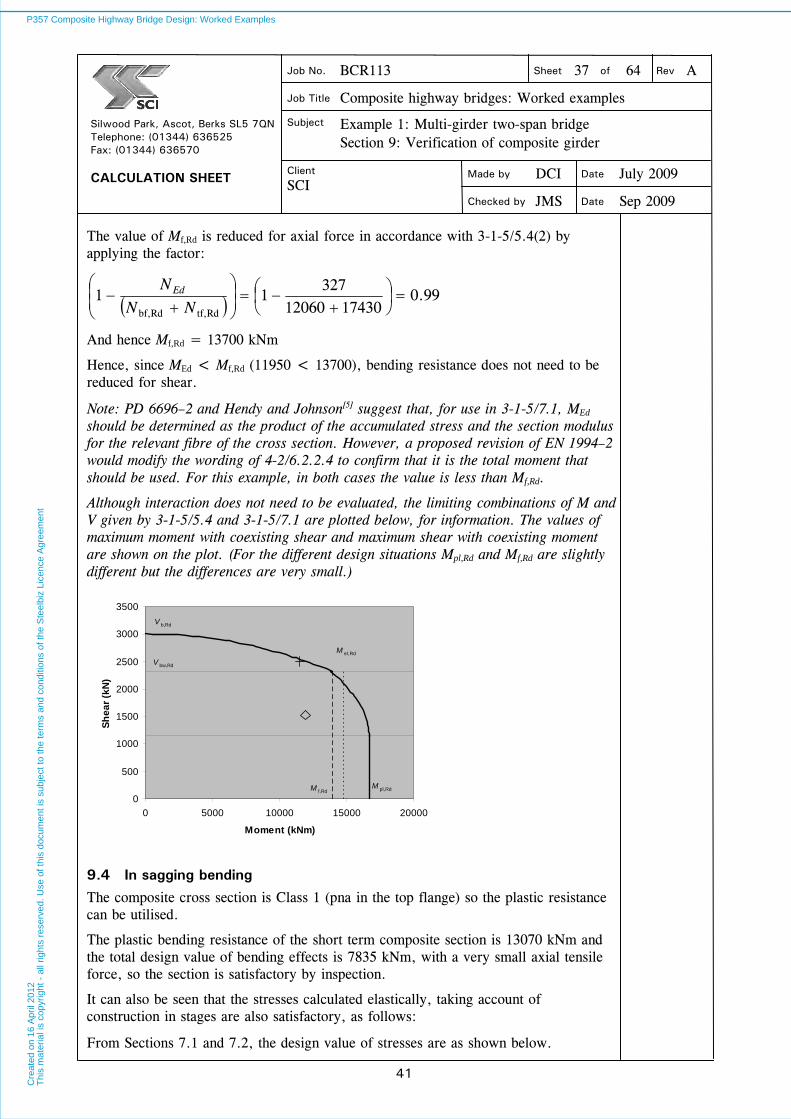
Job No. BCR113 Sheet 37 of 64 Rev A
Job Title Composite highway bridges: Worked examples
Subject Example 1: Multi-girder two-span bridge Section 9: Verification of composite girder
Made by DCI Date July 2009
Silwood Park, Ascot, Berks SL5 7QN Telephone: (01344) 636525 Fax: (01344) 636570 CALCULATION SHEET
Client
SCI Checked by JMS Date Sep 2009
P357-example1-D06.doc 41 Printed 17/03/2010
The value of Mf,Rd is reduced for axial force in accordance with 3-1-5/5.4(2) by applying the factor:
99.01743012060
32711
Rdtf,Rdbf,
NN
N Ed
And hence Mf,Rd = 13700 kNm
Hence, since MEd < Mf,Rd (11950 < 13700), bending resistance does not need to be reduced for shear.
Note: PD 6696–2 and Hendy and Johnson[ 5] suggest that, for use in 3-1-5/7.1, MEd should be determined as the product of the accumulated stress and the section modulus for the relevant fibre of the cross section. However, a proposed revision of EN 1994–2 would modify the wording of 4-2/6.2.2.4 to confirm that it is the total moment that should be used. For this example, in both cases the value is less than Mf,Rd.
Although interaction does not need to be evaluated, the limiting combinations of M and V given by 3-1-5/5.4 and 3-1-5/7.1 are plotted below, for information. The values of maximum moment with coexisting shear and maximum shear with coexisting moment are shown on the plot. (For the different design situations Mpl,Rd and Mf,Rd are slightly different but the differences are very small.)
0
500
1000
1500
2000
2500
3000
3500
0 5000 10000 15000 20000
Moment (kNm)
Sh
ea
r (k
N)
M f,RdM pl,Rd
M el,Rd
V bw,Rd
V b,Rd
9.4 In sagging bending
The composite cross section is Class 1 (pna in the top flange) so the plastic resistance can be utilised.
The plastic bending resistance of the short term composite section is 13070 kNm and the total design value of bending effects is 7835 kNm, with a very small axial tensile force, so the section is satisfactory by inspection.
It can also be seen that the stresses calculated elastically, taking account of construction in stages are also satisfactory, as follows:
From Sections 7.1 and 7.2, the design value of stresses are as shown below.
P357 Composite Highway Bridge Design: Worked ExamplesC
reat
ed o
n 16
Apr
il 20
12T
his
mat
eria
l is
copy
right
- a
ll rig
hts
rese
rved
. Use
of t
his
docu
men
t is
subj
ect t
o th
e te
rms
and
cond
ition
s of
the
Ste
elbi
z Li
cenc
e A
gree
men
t

Job No. BCR113 Sheet 38 of 64 Rev A
Job Title Composite highway bridges: Worked examples
Subject Example 1: Multi-girder two-span bridge Section 9: Verification of composite girder
Made by DCI Date July 2009
Silwood Park, Ascot, Berks SL5 7QN Telephone: (01344) 636525 Fax: (01344) 636570 CALCULATION SHEET
Client
SCI Checked by JMS Date Sep 2009
P357-example1-D06.doc 42 Printed 17/03/2010
steel short composite
137 N/mm2
137 N/mm2
169 N/mm2
7.9 N/mm2
composite(axial)
2 N/mm2
0 N/mm22 N/mm2
long composite
−15 N/mm2
3 N/mm2
−0.5 N/mm20.3 N/mm2
steel short composite
137 N/mm2
137 N/mm2
169 N/mm2
7.9 N/mm2
composite(axial)
2 N/mm2
0 N/mm22 N/mm2
long composite
−15 N/mm2
3 N/mm2
−0.5 N/mm20.3 N/mm2
Stresses: Top: +ve = compression Bottom: +ve = tension
The above stresses include the secondary effects of temperature difference (as an accompanying action). The primary effects should be added (values as an accompanying action): they are 4 N/mm2 compression at the bottom flange and 1.9 N/mm2 compression at the top of the slab.
Sheet 16
For verification of cross section resistance, the stresses should not exceed the limiting stresses fyd and fsd.
For this verification:
fyd = fy/M0 = 335/1.0 = 335 N/mm2 for the 40 mm bottom flange fcd = fck/c = 40/1.5 = 26.7 N/mm2 for the concrete
4–2/6.2.1.5
By inspection, the stresses in both are OK (bf = 293 N/mm2 slab = 7.3 N/mm2) Sheet 24
9.5 Verification of crack control at SLS
Minimum reinforcement The minimum required reinforcement is:
scteffct,css AkfkkA
4–2/7.4.2
ks = 0.9
0.13.021
1
0cc
zhk
Here hc = 250 and z0 = 1275 − 1016 = 259
974.03.025922501
1c
k
k = 0.8 fctm = 3.5 (Table 3.1) 2–1–1/3.1.2 wmax = 0.3 mm and thus for 25 mm bars, s = 200 N/mm2 (Table 7.1) 4–2/7.4.2
1135020037002505.38.0974.09.0s A mm2
Area provided = 2 491 3700/150 = 24250 mm2 - Satisfactory
Crack control Requirements relate only to the quasi-permanent design situation and therefore local longitudinal stresses in the reinforcement are negligible.
P357 Composite Highway Bridge Design: Worked ExamplesC
reat
ed o
n 16
Apr
il 20
12T
his
mat
eria
l is
copy
right
- a
ll rig
hts
rese
rved
. Use
of t
his
docu
men
t is
subj
ect t
o th
e te
rms
and
cond
ition
s of
the
Ste
elbi
z Li
cenc
e A
gree
men
t
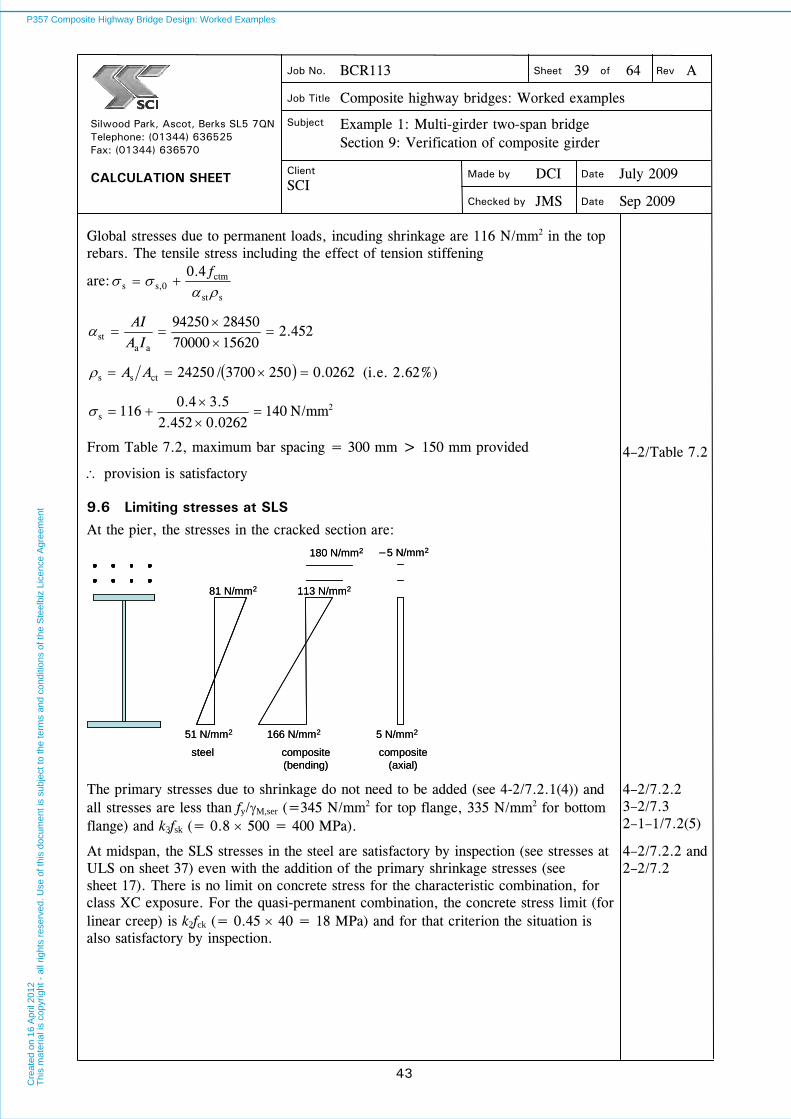
Job No. BCR113 Sheet 39 of 64 Rev A
Job Title Composite highway bridges: Worked examples
Subject Example 1: Multi-girder two-span bridge Section 9: Verification of composite girder
Made by DCI Date July 2009
Silwood Park, Ascot, Berks SL5 7QN Telephone: (01344) 636525 Fax: (01344) 636570 CALCULATION SHEET
Client
SCI Checked by JMS Date Sep 2009
P357-example1-D06.doc 43 Printed 17/03/2010
Global stresses due to permanent loads, incuding shrinkage are 116 N/mm2 in the top rebars. The tensile stress including the effect of tension stiffening
are:sst
ctms,0s
4.0
f
452.215620700002845094250
aast
IA
AI
0262.02503700/24250ctss AA (i.e. 2.62%)
1400262.0452.25.34.0
116s
N/mm2
From Table 7.2, maximum bar spacing = 300 mm > 150 mm provided
provision is satisfactory
4–2/Table 7.2
9.6 Limiting stresses at SLS
At the pier, the stresses in the cracked section are:
steel composite(bending)
51 N/mm2
81 N/mm2
166 N/mm2
180 N/mm2
composite(axial)
5 N/mm2
113 N/mm2
−5 N/mm2
steel composite(bending)
51 N/mm2
81 N/mm2
166 N/mm2
180 N/mm2
composite(axial)
5 N/mm2
113 N/mm2
−5 N/mm2
The primary stresses due to shrinkage do not need to be added (see 4-2/7.2.1(4)) and all stresses are less than fy/M,ser (=345 N/mm2 for top flange, 335 N/mm2 for bottom flange) and k3fsk (= 0.8 500 = 400 MPa).
4–2/7.2.2 3–2/7.3 2–1–1/7.2(5)
At midspan, the SLS stresses in the steel are satisfactory by inspection (see stresses at ULS on sheet 37) even with the addition of the primary shrinkage stresses (see sheet 17). There is no limit on concrete stress for the characteristic combination, for class XC exposure. For the quasi-permanent combination, the concrete stress limit (for linear creep) is k2fck (= 0.45 40 = 18 MPa) and for that criterion the situation is also satisfactory by inspection.
4–2/7.2.2 and 2–2/7.2
P357 Composite Highway Bridge Design: Worked ExamplesC
reat
ed o
n 16
Apr
il 20
12T
his
mat
eria
l is
copy
right
- a
ll rig
hts
rese
rved
. Use
of t
his
docu
men
t is
subj
ect t
o th
e te
rms
and
cond
ition
s of
the
Ste
elbi
z Li
cenc
e A
gree
men
t

Job No. BCR113 Sheet 40 of 64 Rev A
Job Title Composite highway bridges: Worked examples
Subject Example 1: Multi-girder two-span bridge Section 10: Longitudinal shear
Made by DCI Date July 2009
Silwood Park, Ascot, Berks SL5 7QN Telephone: (01344) 636525 Fax: (01344) 636570 CALCULATION SHEET
Client
SCI Checked by JMS Date Sep 2009
P357-example1-D06.doc 44 Printed 17/03/2010
10 Longitudinal shear
The resistance to longitudinal shear is verified for the web/flange weld, the shear connectors and the transverse reinforcement at the pier, at the splice and at mid-span
10.1 Shear forces
ULS values Pier Splice Span Abutment
Shear on steel section (stage 1) 689 415 43 –521
Shear on long-term composite section 340 291 142 –16
Shear on short-term composite section (worst effects)
1482 669 –396 –1354
Sheet 25
SLS values Pier Splice Span Abutment
Shear on steel section (stage 1) 519 312 33 –391
Shear on long-term composite section 295 196 109 –31
Shear on short-term composite section (worst effects)
1098 496 –293 –1003
10.2 Section properties
To determine shear flows the parameter yIzA is needed for each section and stage.
For composite sections, uncracked unreinforced composite section properties can be used to determine shear flow.
4-2/ 6.6.2.1(2)
Pier girder Span girder Abutment girder
Web/top fl Top fl/slab Web/top fl Top fl/slab Web/top fl Top fl/slab
yIzA (m−1) yIzA (m−1) yIzA (m−1) yIzA (m−1) yIzA (m−1) yIzA (m−1)
Steel section 0.825 0.875 0.861
Long term section 0.836 0.706 0.843 0.732 0.843 0.732
Short term section 0.831 0.805 0.826 0.836 0.836 0.844
At the pier, the values at the bottom flange/web junction are 0.936, 0.739 and 0.704 for steel, long-term and short-term cross sections respectively.
In addition to the shear flows determined from the vertical shear, the inequality of forces and moments on the four girders for any particular design situation leads to different axial forces on the composite beam sections that are verified to the design rules. These axial forces vary longitudinally and the variation is associated with a shear flow transferred between one composite section and the adjacent section. In this example, detailed interrogation of the analysis results identifies, for example, a negative shear flow of 34 kN/m at the pier due to permanent actions and a positive shear flow of 35 kN/m for the traffic loading for the worst shear case (both at the edge of the section, not at the steel/concrete interface). There is therefore no significant overall contribution. Values for other situations give only very small shear flows.
P357 Composite Highway Bridge Design: Worked ExamplesC
reat
ed o
n 16
Apr
il 20
12T
his
mat
eria
l is
copy
right
- a
ll rig
hts
rese
rved
. Use
of t
his
docu
men
t is
subj
ect t
o th
e te
rms
and
cond
ition
s of
the
Ste
elbi
z Li
cenc
e A
gree
men
t

Job No. BCR113 Sheet 41 of 64 Rev A
Job Title Composite highway bridges: Worked examples
Subject Example 1: Multi-girder two-span bridge Section 10: Longitudinal shear
Made by DCI Date July 2009
Silwood Park, Ascot, Berks SL5 7QN Telephone: (01344) 636525 Fax: (01344) 636570 CALCULATION SHEET
Client
SCI Checked by JMS Date Sep 2009
P357-example1-D06.doc 45 Printed 17/03/2010
10.3 Shear flow at ULS
Force at web/top flange junction At pier 689 0.825 +340 0.836 + 1482 0.831 = 2084 kN/m
At splice (span girder) 415 0.875 +291 0.843 + 669 0.826 = 1161 kN/m
At mid-span 43 0.875 +142 0.843 – 396 0.826 = –169 kN/m
At abutment –521 0.861 –16 0.843 – 1354 0.836 = 1594 kN/m
Force at flange/slab junction At pier 340 0.706 + 1482 0.805 = 1433 kN/m
At splice (span girder) 291 0.732 + 669 0.836 = 772 kN/m
At mid-span 142 0.734 - 396 0.843 = –230 kN/m
At abutment –16 0.732 – 1354 0.844 = –1155 kN/m
At the web/bottom flange junction At pier 689 0.936 + 340 0.739 + 1482 0.704 = 1939 kN/m
10.4 Shear flow at SLS
Force at flange/slab junction At pier 295 0.706 +1098 0.805 = 1092 kN/m
At splice (span girder) 196 0.732 +496 0.836 = 558 kN/m
At mid-span 109 0.734 –293 0.843 = –167 kN/m
At abutment –31 0.732 –1003 0.844 = –870 kN/m
The shear flow at SLS is required for verification of the shear connectors
10.5 Web/flange welds
Design weld resistance given by the simplified method of EN 1993-1-8, 4.5.3.3 is:
afF vw.dRdw, where M2
uvw.d
3f
f
3-1-8/4.5.3.3
For 6 mm throat fillet weld (8.4 mm leg length) a = 6 mm
For web and flange grade S355 in thickness range 3 - 100 mm, fu = 470 N/mm2 From Table 3–1–8/4.1 = 0.9
Thus 25.19.0
34706Rdw,
F = 1447 N/mm (kN/m)
Resistance of 2 welds = 2890 kN/m > 2084 kN/m shear flow in pier girder at top flange - OK
By inspection, 5 mm throat welds would be satisfactory at the splices and in the span regions.
P357 Composite Highway Bridge Design: Worked ExamplesC
reat
ed o
n 16
Apr
il 20
12T
his
mat
eria
l is
copy
right
- a
ll rig
hts
rese
rved
. Use
of t
his
docu
men
t is
subj
ect t
o th
e te
rms
and
cond
ition
s of
the
Ste
elbi
z Li
cenc
e A
gree
men
t
Job No. BCR113 Sheet 42 of 64 Rev A
Job Title Composite highway bridges: Worked examples
Subject Example 1: Multi-girder two-span bridge Section 10: Longitudinal shear
Made by DCI Date July 2009
Silwood Park, Ascot, Berks SL5 7QN Telephone: (01344) 636525 Fax: (01344) 636570 CALCULATION SHEET
Client
SCI Checked by JMS Date Sep 2009
P357-example1-D06.doc 46 Printed 17/03/2010
Shear flows at bottom flange are slightly less and are OK by inspection but the interaction with vertical effects at the bearing stiffener need to be checked (see Section 13.3)
EN 10025-2
10.6 Shear connectors
Stud shear connectors 19 mm diameter 150 mm long (type SD1 to EN ISO 13918) are assumed, with fu = 450 N/mm2
The resistance of a single stud is given by 4-2/6.6.3.1 as the lesser of:
PRd = V
2u 4/8.0 df
6.6.3.1(1) Eq (6.18)
PRd = V
cmck229.0
Efd
Eq (6.19)
= 1.0 as 419150sc
dh
Eq (6.21)
PRd = 32
1025.1
)4/19(4508.0
= 81.7 kN Eq (6.18)
PRd = 332
1025.1
103540190.129.0
= 99.1 kN Eq (6.19)
Therefore the design resistance of a single headed shear connector is
PRd = 81.7 kN
If studs are grouped and spaced at 150 mm spacing along the beam (to suit transverse reinforcement), then a row of 3 studs has a design resistance of:
FRd = 81.7 3 /0.150 = 1630 kN/m
This is adequate at the pier (FRd =1630 > FEd =1433 kN/m)
Rows of 2 studs would be adequate at the splice position (FRd = 1090 > FEd =772). The change from 3 studs per row to 2 studs per row can be made on the pier side of the splice (where the shear is a little higher), taking advantage of the permission in 6.6.5.5 to consider groups of connectors but that option is not explored here. Rows of 2 studs would not quite be adequate at the abutment.
The shear flow calculated above is based on elastic section properties and in this example the elastic bending resistance in the span is adequate, even though the composite section is class 2. If plastic bending resistance were utilised, the shear flow would need to be determined between the position where the elastic resistance is just mobilised and the position where the plastic resistance is developed (based on the difference in slab force over that length).
4–2/6.6.2.2
Resistance at SLS At SLS the shear connector resistance is limited to ksPRd with ks = 0.75.
The resistance of 3 studs at 150 mm spacing is thus 0.75 1630 = 1220 kN and the resistance with 2 studs per row is 815 kN.
4–2/6.8.1 4–2/NA.2.11
P357 Composite Highway Bridge Design: Worked ExamplesC
reat
ed o
n 16
Apr
il 20
12T
his
mat
eria
l is
copy
right
- a
ll rig
hts
rese
rved
. Use
of t
his
docu
men
t is
subj
ect t
o th
e te
rms
and
cond
ition
s of
the
Ste
elbi
z Li
cenc
e A
gree
men
t
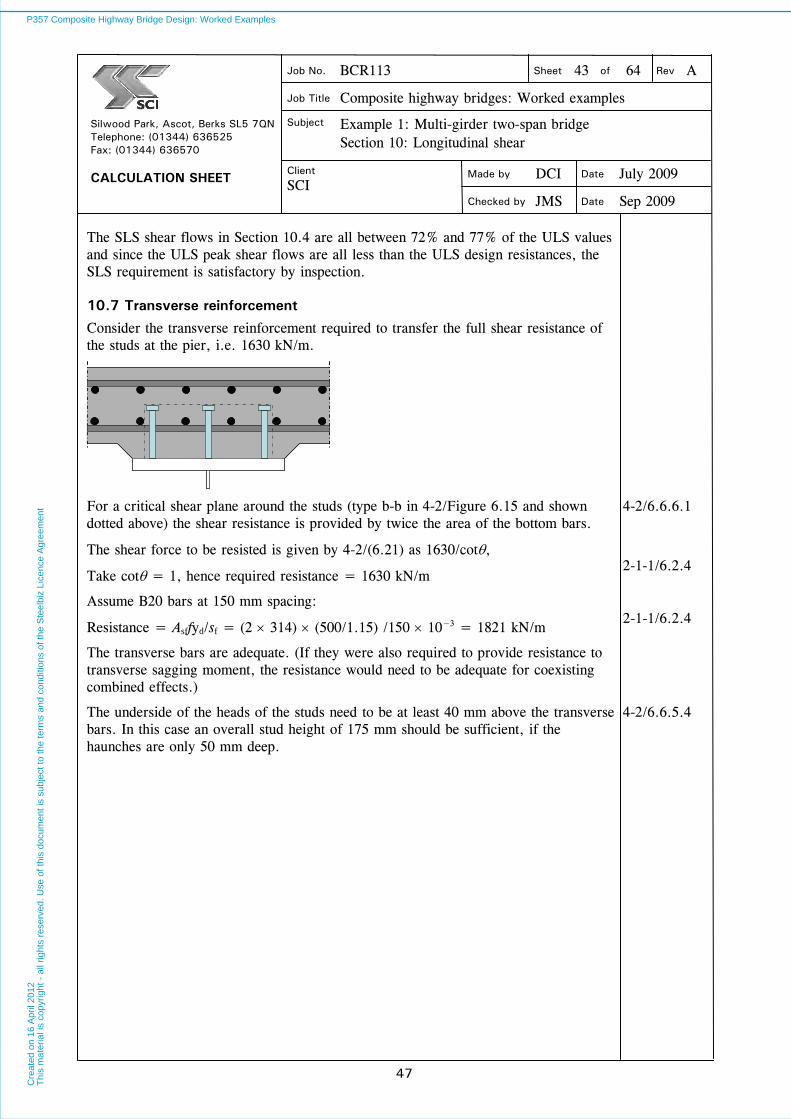
Job No. BCR113 Sheet 43 of 64 Rev A
Job Title Composite highway bridges: Worked examples
Subject Example 1: Multi-girder two-span bridge Section 10: Longitudinal shear
Made by DCI Date July 2009
Silwood Park, Ascot, Berks SL5 7QN Telephone: (01344) 636525 Fax: (01344) 636570 CALCULATION SHEET
Client
SCI Checked by JMS Date Sep 2009
P357-example1-D06.doc 47 Printed 17/03/2010
The SLS shear flows in Section 10.4 are all between 72% and 77% of the ULS values and since the ULS peak shear flows are all less than the ULS design resistances, the SLS requirement is satisfactory by inspection.
10.7 Transverse reinforcement
Consider the transverse reinforcement required to transfer the full shear resistance of the studs at the pier, i.e. 1630 kN/m.
For a critical shear plane around the studs (type b-b in 4-2/Figure 6.15 and shown dotted above) the shear resistance is provided by twice the area of the bottom bars.
4-2/6.6.6.1
The shear force to be resisted is given by 4-2/(6.21) as 1630/cot,
Take cot = 1, hence required resistance = 1630 kN/m
2-1-1/6.2.4
Assume B20 bars at 150 mm spacing:
Resistance = Asffyd/sf = (2 314) (500/1.15) /150 10−3 = 1821 kN/m
2-1-1/6.2.4
The transverse bars are adequate. (If they were also required to provide resistance to transverse sagging moment, the resistance would need to be adequate for coexisting combined effects.)
The underside of the heads of the studs need to be at least 40 mm above the transverse bars. In this case an overall stud height of 175 mm should be sufficient, if the haunches are only 50 mm deep.
4-2/6.6.5.4
P357 Composite Highway Bridge Design: Worked ExamplesC
reat
ed o
n 16
Apr
il 20
12T
his
mat
eria
l is
copy
right
- a
ll rig
hts
rese
rved
. Use
of t
his
docu
men
t is
subj
ect t
o th
e te
rms
and
cond
ition
s of
the
Ste
elbi
z Li
cenc
e A
gree
men
t

Job No. BCR113 Sheet 44 of 64 Rev A
Job Title Composite highway bridges: Worked examples
Subject Example 1: Multi-girder two-span bridge Section 11: Fatigue assessment
Made by DCI Date July 2009
Silwood Park, Ascot, Berks SL5 7QN Telephone: (01344) 636525 Fax: (01344) 636570 CALCULATION SHEET
Client
SCI Checked by JMS Date Sep 2009
P357-example1-D06.doc 48 Printed 17/03/2010
11 Fatigue assessment
11.1 Assessment of structural steel details
The design value of the stress range in structural steel is given as
FfE2 = Ff 2p where 2 =1.0 and Ff is given by the NA as 1.0
3-2/9.4.1, 9.5.1 3-2/NA.2.35
The value of = 1 2 3 4 3-2/9.5.2
For intermediate supports in spans up to 30 m, 20/103.021 L where L is the length of the critical influence line (in m) and here L = 28 (mean of adjacent spans)
Thus 20/103.021 L =1.73
Figure 9.5 3-2/9.5.2(2)a
For span regions, 70/107.055.21 L and here L = 28 as before
Thus 70/107.055.21 L =2.37
Figure 9.5
The value of 2 is given by51
0
Obs
0
1m2
NN
Where Q0 = 480 kN and N0 = 0.5 106
From 3–2/NA.2.39, Qm1 = 260 kN
From 1–2/Table NA.4, NObs = 1 106
Hence 62.05.00.1
480260
2.0
2
For a 120 year design life the value of 3 given by Table 9.2 is 1.037: 3-2/9.5.2(5)
The value of of 4 depends on the relative magnitude of the stress range due to the passage of FLM3 in the second lane and is given by:
2.0
4 1lanein effect2lanein effect
1
3-2/9.5.2(5)
Design stress ranges at pier
At the pier, the stress range p in top and bottom flanges (at their mid thickness) is:
Top flange: 7.3 N/mm2
Bottom flange: 9.7 N/mm2 The ratio of lane 2/lane 1 effects = 0.940 and thus 4 = 1.14
274.114.1037.162.073.1
The design stress ranges are thus:
Top flange: 1.0 1.274 7.3 = 9 N/mm2
Bottom flange: 1.0 1.274 9.7 = 12 N/mm2
The partial factor for fatigue strength Mf = 1.1 3-1-9/ NA.2.5.3
P357 Composite Highway Bridge Design: Worked ExamplesC
reat
ed o
n 16
Apr
il 20
12T
his
mat
eria
l is
copy
right
- a
ll rig
hts
rese
rved
. Use
of t
his
docu
men
t is
subj
ect t
o th
e te
rms
and
cond
ition
s of
the
Ste
elbi
z Li
cenc
e A
gree
men
t

Job No. BCR113 Sheet 45 of 64 Rev A
Job Title Composite highway bridges: Worked examples
Subject Example 1: Multi-girder two-span bridge Section 11: Fatigue assessment
Made by DCI Date July 2009
Silwood Park, Ascot, Berks SL5 7QN Telephone: (01344) 636525 Fax: (01344) 636570 CALCULATION SHEET
Client
SCI Checked by JMS Date Sep 2009
P357-example1-D06.doc 49 Printed 17/03/2010
The worst detail category that might apply is for a bearing plate welded to the underside of the bottom flange, which, for a flange plate over 50 mm thick, is category 36 (3–1–9/Table 8.5, detail 6).
Design value of fatigue strength c /Mf = 36/1.1 = 33 N/mm2 OK
Design stress ranges at bracing position At the bracing position, there is negligible stress range in the top flange. The range in the bottom flange (on the span girder side) is 22.2 N/mm2. The ratio of lane 2/lane 1 effects = 0.947 and thus 4 = 1.14
747.114.1037.162.037.2
The design stress range is thus:
Bottom flange: 1.0 1.747 22.2 = 38 N/mm2
The most onerous detail at a bolted splice would be category 112 (3–1–9/Table 8.1, detail 8, at the bolt holes); the stress range is OK, by inspection.
For a welded splice, a flange butt weld would be category 80 (with size effect factor of (25/t)0.2 = (25/40) 0.2 = 0.91). An open cope hole would introduce category 71 in the flange and a stress concentration factor of 2.4 in the web (for which a cut edge is category 125 or, if a butt weld terminates at the cope hole, category 112).
Thus the fatigue strength is either:
Flange butt: 80 0.91/1.1 = 66 N/mm2 > 38 N/mm2 OK Flange at cope: 71 0.91/1.1 = 59 N/mm2 > 38 N/mm2 OK Web at cope: 125/1.1 = 114 N/mm2 > 38 2.4 = 91 N/mm2 OK Web butt at cope: 112/1.1 = 102 N/mm2 > 38 2.4 = 91 N/mm2 OK
3–1–9/ Table 8.3
Where a transverse web stiffener is attached to the bottom flange, the detail category would be 80 (3–1–9/Table 8.4, detail 7) and thus the fatigue strength is
80/1.1 = 73 N/mm2 > 38 N/mm2 OK
Design stress ranges in mid-span At mid-span, there is negligible stress range in the top flange. The range in the bottom flange is 26.2 N/mm2. The ratio of lane 2/lane 1 effects = 0.942 and thus 4 = 1.14
747.114.1037.162.037.2
The design stress range is thus:
Bottom flange: 1.0 1.75 26.2 = 46 N/mm2
The most onerous detail would be a transverse web stiffener, for which the fatigue strength would be 73 N/mm2 (as above) and this is OK even for stiffeners welded to the bottom flange.
P357 Composite Highway Bridge Design: Worked ExamplesC
reat
ed o
n 16
Apr
il 20
12T
his
mat
eria
l is
copy
right
- a
ll rig
hts
rese
rved
. Use
of t
his
docu
men
t is
subj
ect t
o th
e te
rms
and
cond
ition
s of
the
Ste
elbi
z Li
cenc
e A
gree
men
t

Job No. BCR113 Sheet 46 of 64 Rev A
Job Title Composite highway bridges: Worked examples
Subject Example 1: Multi-girder two-span bridge Section 11: Fatigue assessment
Made by DCI Date July 2009
Silwood Park, Ascot, Berks SL5 7QN Telephone: (01344) 636525 Fax: (01344) 636570 CALCULATION SHEET
Client
SCI Checked by JMS Date Sep 2009
P357-example1-D06.doc 50 Printed 17/03/2010
11.2 Assessment of reinforcing steel
The design value of the stress range in reinforcing steel is F,fatS,equ where the value of F,fat is given by Table NA.1 as F,fat = 1.0
S,equ is referred to in EN 1994–2 as E , given by:
fmin,fmax,E
2-1/6.8.5 4-2/6.8.6.1
The value of = s
and s = fat s,1 s,2 s,3 s,4
Where fat is a damage equivalent impact factor
2-1-1/NN.2.1
The value effectively duplicates fat but since =1.0, this is not significant 4-2/6.8.6.1
The value of the stress range due to FLM3 needs to be increased by a factor of 1.75 (in regions of intermediate supports) in accordance with NN.2.1(101). Stresses also need to be increased for the effect of tension stiffening in accordance with 4–2/7.4.3
2-1-1/NN.2.1
Based on cracked section properties, the stress in the top rebars due to permanent actions is 118 N/mm2 (see SLS values in Section 7.3). (Coexisting global plus local effects do not govern.)
The stress range due to the FLM3 fatigue vehicle in lane 1 is 0 to 8.6 N/mm2 (see Section 7.4) and this is increased by the 1.75 factor, giving a range of 15 N/mm2 and thus, ignoring tension stiffening, gives max,f = 135 N/mm2.
Since FLM3 does not cause sagging bending, min,f = 118 N/mm2.
1-2/Annex B
To determine the effect of tension stiffening, the following parameters are needed:
Aa = 70000, Is = 1.562 1010 (for the bare steel section) A = 94250, I = 2.845 1010 (for the cracked section) s = As/Act = 24250/(3700 250) = 0.0262 st =AI/AaIs = (94250 2.845 1010 )/(70000 1.562 1010) = 2.45 fctm = 3.5 MPa (for C40/50 concrete)
110262.045.25.32.02.0
sst
ctm
f
s N/mm2
4-2/7.4.3 Sheet 13 2-1-1/ Table 3.1 See 4-2/6.8.5.4 for 0.2 factor
Thus, the maximum and minimum stresses including tension stiffening are:
s,max,f = max,f + s = 135 +11 = 146 N/mm2
And fmax,d,E,
fmin,d,E,fmax,s,fmin,s, M
M
Using the ratio of stresses, rather than directly using moments:
128135118
124fmin,s, N/mm2
4-2/6.8.5.4
For intermediate support region and span of 28 m, s,1 = 0.97 2-2/Figure NN.1
P357 Composite Highway Bridge Design: Worked ExamplesC
reat
ed o
n 16
Apr
il 20
12T
his
mat
eria
l is
copy
right
- a
ll rig
hts
rese
rved
. Use
of t
his
docu
men
t is
subj
ect t
o th
e te
rms
and
cond
ition
s of
the
Ste
elbi
z Li
cenc
e A
gree
men
t

Job No. BCR113 Sheet 47 of 64 Rev A
Job Title Composite highway bridges: Worked examples
Subject Example 1: Multi-girder two-span bridge Section 11: Fatigue assessment
Made by DCI Date July 2009
Silwood Park, Ascot, Berks SL5 7QN Telephone: (01344) 636525 Fax: (01344) 636570 CALCULATION SHEET
Client
SCI Checked by JMS Date Sep 2009
P357-example1-D06.doc 51 Printed 17/03/2010
For NObs = 1 106, medium distance traffic and straight bars (k2 = 9):Q =0.94 and
87.02.0
0.194.0
2.09Obs
s,22 k N
Q
2-2/Table NN.1
For 120 year design life:
020.1100120
1009Years
3,s2 k N
For 2 slow lanes:
080.11.0
0.29
Obs,1
Obss,4 2 k ,i
N
N
For road surface of good roughness fat = 1.2 1-2/Annex B
Thus 08.108.102.187.094.02.1
191808.11281460.108.1E N/mm2
19190.1S,equF,fat N/mm2
For straight bars, Rsk = 162.5 MPa
14115.1
5.162
fats,
Rsk
N/mm2 >22 mm2 OK
Note: If the bars were bent, as they might be at the abutment, the value ofRsk would be significantly reduced - see 2–1–1/Table 6.3.N.
2-1-1/ Table 6.3N 2–1/6.8.5
11.3 Assessment of shear connection
The design value of the stress range in shear studs is given as Ff,E2 where
vE,2
In which is the range of shear stress in the cross section of the stud.
EN 1994–2 refers to EN 1993–2 for the value of Ff, which is given by the NA as 1.0
4–2/6.8.7.2 3-2/NA.2.35
The value of v = v,1 v,2 v,3 v,4 4-2/6.8.6.2
Since the span is less than 100 m, v,1 = 1.55 6.8.6.2(4)
The value of 2, 3 and 4 are calculated in the same manner as for structural steel but with an exponent of 1/8 rather than 1/5
Hence 591.05.00.1
480260
125.0
2
6.8.6.2(4)
023.1100120
125.0
3
P357 Composite Highway Bridge Design: Worked ExamplesC
reat
ed o
n 16
Apr
il 20
12T
his
mat
eria
l is
copy
right
- a
ll rig
hts
rese
rved
. Use
of t
his
docu
men
t is
subj
ect t
o th
e te
rms
and
cond
ition
s of
the
Ste
elbi
z Li
cenc
e A
gree
men
t

Job No. BCR113 Sheet 48 of 64 Rev A
Job Title Composite highway bridges: Worked examples
Subject Example 1: Multi-girder two-span bridge Section 11: Fatigue assessment
Made by DCI Date July 2009
Silwood Park, Ascot, Berks SL5 7QN Telephone: (01344) 636525 Fax: (01344) 636570 CALCULATION SHEET
Client
SCI Checked by JMS Date Sep 2009
P357-example1-D06.doc 52 Printed 17/03/2010
The value of 4 depends on the relative magnitude of the stress range due to the passage of FLM3 in the second lane and is given by:
125.0
4 1 lanein effect2 lanein effect
1
Shear at pier The range of vertical shear force at the pier is 271 kN and the ratio of lane 2/lane 1 effects is 0.867.
Sheet 22
At the pier, the studs are 19 mm diameter, in rows of 3 at 150 mm spacing
Thus the stress range = Range of vertical shear yIzA 0.150 /(3 d2/4)
yIzA = 0.805 m–1 Sheet 40
Stress range = 271 0.805 0.150 / (3 284) = 38 N/mm2
081.1867.01 125.04
013.1081.1023.1591.055.1v
3938013.1E,2 N/mm2
The reference value of fatigue strength for a shear stud is c = 90 4-2/6.8.3
The partial factor on fatigue strength Mf = 1.1. 3-1-9/ NA.2.5.3
The design strength is thus 90/1.1 = 81 N/mm2 >39 N/mm2 OK
Additionally, since the flange is in tension, the interaction with normal stress in the steel flange must be verified, using:
3.1sMf,c
2E,Ff
Mfc
2E,Ff
With c = 80.
Coexistent stresses should be used but conservatively one can consider the most onerous values for each of c and c
60.01.190390.1
1.18090.1
OK
4-2/6.8.7.2
Shear at splice The range of vertical shear force at the splice is 99 kN and the ratio of lane 2/lane 1 effects is 0.909
At the splice, the studs are 19 mm diameter, in rows of 2 at 150 mm spacing
Stress range = 99 0.836 0.150 / (2 284) = 22 N/mm2
P357 Composite Highway Bridge Design: Worked ExamplesC
reat
ed o
n 16
Apr
il 20
12T
his
mat
eria
l is
copy
right
- a
ll rig
hts
rese
rved
. Use
of t
his
docu
men
t is
subj
ect t
o th
e te
rms
and
cond
ition
s of
the
Ste
elbi
z Li
cenc
e A
gree
men
t
Job No. BCR113 Sheet 49 of 64 Rev A
Job Title Composite highway bridges: Worked examples
Subject Example 1: Multi-girder two-span bridge Section 11: Fatigue assessment
Made by DCI Date July 2009
Silwood Park, Ascot, Berks SL5 7QN Telephone: (01344) 636525 Fax: (01344) 636570 CALCULATION SHEET
Client
SCI Checked by JMS Date Sep 2009
P357-example1-D06.doc 53 Printed 17/03/2010
084.1909.01 125.04
016.1084.1023.1591.055.1v
2222016.1E,2 N/mm2 <81 N/mm2 OK
Shear at midspan The range of vertical shear force at midspan is 76 kN and the ratio of lane 2/lane 1 effects is 0.895
At midspan, the studs are 19 mm diameter, in rows of 2 at 150 mm spacing
Stress range = 76 0.836 0.150 / (2 284) = 17 N/mm2
083.1895.01 125.04
015.1083.1023.1591.055.1v
1717015.1E,2 N/mm2<81 N/mm2 OK
Shear at abutment The range of vertical shear force at the abutment is 283 kN and the ratio of lane 2/lane 1 effects is 0.919
At the splice, the studs are 19 mm diameter, in rows of 2 at 150 mm spacing
Stress range = 283 0.836 0.150 / (2 284) = 62 N/mm2
085.1919.01 125.04
017.1085.1023.1591.055.1v
6362017.1E,2 N/mm2<81 N/mm2 OK
P357 Composite Highway Bridge Design: Worked ExamplesC
reat
ed o
n 16
Apr
il 20
12T
his
mat
eria
l is
copy
right
- a
ll rig
hts
rese
rved
. Use
of t
his
docu
men
t is
subj
ect t
o th
e te
rms
and
cond
ition
s of
the
Ste
elbi
z Li
cenc
e A
gree
men
t

Job No. BCR113 Sheet 50 of 64 Rev A
Job Title Composite highway bridges: Worked examples
Subject Example 1: Multi-girder two-span bridge Section 12: Main girder splices
Made by DCI Date July 2009
Silwood Park, Ascot, Berks SL5 7QN Telephone: (01344) 636525 Fax: (01344) 636570 CALCULATION SHEET
Client
SCI Checked by JMS Date Sep 2009
P357-example1-D06.doc 54 Printed 17/03/2010
12 Main girder splices 12.1 Forces and moments at splice position
Design effects to be considered: Worst hogging moment at splice, at ULS and SLS
Worst shear at splice, at ULS and SLS
(The worst sagging moment is much less than maximum hogging moment, as noted before)
Sheet 25
Consider the stresses in the pier girder side of the splice. The stress distribution will be different on the span girder side of the splice but the total moments and forces at the splice position must be the same. Because the bottom flange is smaller, more force will be carried in the web on the span side but since the moment on the bolt group on the pier side is increased by its eccentricity from the centreline of the splice and the moment on the group on the span side is decreased, it can be shown that the total effects on the bolt group are less on the span side. A symmetric arrangement of bolts, designed for the pier side, will thus be satisfactory.
The in-service design combinations of actions considered are:
(1) Construction load + traffic load for worst hogging + force due to temperature expansion
(2) Construction load + traffic load for worst shear + force due to temperature expansion.
ULS hog SLS hog ULS shear SLS shear Top flange stress 23 21 –38 –23 N/mm2 Bottom flange stress –110 –88 –10 –14 N/mm2 Shear force 834 650 1320 1011 N/mm2
From the above stresses, the forces in each flange, the axial force and moment in the web are as follows:
ULS hog SLS hog ULS shear SLS shear Top flange force 460 420 –760 –460 kN Bottom flange force –3960 –3168 –360 –504 kN Web force –644 –497 –336 –259 kN Web moment 161 132 –33 –11 kNm
Actions at the construction stage It is noted that the compressive stress in the top flange is higher at construction stage 1, under wet concrete load in span 1. At that stage, the splice must provide continuity of stiffness, without slipping, and because the beams are slender at that stage it is appropriate to amplify the design force to ensure adequate continuity of resistance.
The maximum stress in the top flange during construction is 42 N/mm2 Sheet 23
P357 Composite Highway Bridge Design: Worked ExamplesC
reat
ed
on
16
Apr
il 20
12T
his
mat
eria
l is
co
pyrig
ht
- al
l rig
hts
rese
rved
. U
se
of
this
do
cum
ent
is
subj
ect
to
the
term
s an
d co
nditi
ons
of
the
Ste
elbi
z Li
cenc
e A
gree
men
t

Job No. BCR113 Sheet 51 of 64 Rev A
Job Title Composite highway bridges: Worked examples
Subject Example 1: Multi-girder two-span bridge Section 12: Main girder splices
Made by DCI Date July 2009
Silwood Park, Ascot, Berks SL5 7QN Telephone: (01344) 636525 Fax: (01344) 636570 CALCULATION SHEET
Client
SCI Checked by JMS Date Sep 2009
P357-example1-D06.doc 55 Printed 17/03/2010
The slenderness of the beam at that stage is 89.0LT which means that
Mc,Rk/Mcr = 0.892 = 0.79
Sheet 30
The midspan bending moment at the bare steel stage is MEd = 3132 kNm (Sheet 23) and the resistance of the cross section Mc,Rk = 2.287 107 mm3 345 = 7890 kNm.
Hence 316.078903132
79.0Rkc,
Ed
cr
Rkc,
cr
Ed M
M
M
M
M
M
Second order effects can thus be determined by multiplying by 46.1316.01
1
Thus the design force for the top flange is 840 1.46 = 1226 kN
(Clearly this is more onerous than in the final situation, where the stresses are of similar magnitude but the flange is restrained against buckling and no amplification is needed.)
12.2 Slip resistance of bolts
Use M24 grade 8.8 preloaded bolts in double shear in normal clearance holes with class A friction surface:
d = 24 mm d0 =26 mm fub = 800 N/mm2 As = 353 mm2 = 0.5 ks = 1.0
3-1-8/3.9.1
Preload force Fp,C = 0.7fubAs = 0.7 800 353 10−3 = 198 kN
ULS Slip resistance of bolts (double shear)
15819825.1
5.020.1p,C
M3
sRds,
F
nkF
kN
For SLS slip resistance, use the same equation but divide by M3,ser (= 1.1)
Slip resistance in double shear = 198/1.1 = 180 kN
12.3 Shear resistance of bolts
ULS shear resistance of bolt (assuming shear through threads):
13625.1
3538006.0
M2
subvRDv,
Af
F kN
Resistance in double shear = 272 kN
3-1-8/ Table 3.4
P357 Composite Highway Bridge Design: Worked ExamplesC
reat
ed o
n 16
Apr
il 20
12T
his
mat
eria
l is
copy
right
- a
ll rig
hts
rese
rved
. Use
of t
his
docu
men
t is
subj
ect t
o th
e te
rms
and
cond
ition
s of
the
Ste
elbi
z Li
cenc
e A
gree
men
t

Job No. BCR113 Sheet 52 of 64 Rev A
Job Title Composite highway bridges: Worked examples
Subject Example 1: Multi-girder two-span bridge Section 12: Main girder splices
Made by DCI Date July 2009
Silwood Park, Ascot, Berks SL5 7QN Telephone: (01344) 636525 Fax: (01344) 636570 CALCULATION SHEET
Client
SCI Checked by JMS Date Sep 2009
P357-example1-D06.doc 56 Printed 17/03/2010
12.4 Bolt spacing and edge distances
Limiting spacings for M24 bolts, for strength:
End and edge distances: 1.2d0 = 1.2 26 = 31.2 mm Spacing in direction of force: 2.2d0 = 2.2 26 = 57.2 mm Spacing perpendicular to force 2.4d0 = 2.4 26 = 62.4 mm
3-1-8/ Table 3.3
Limiting spacings for M24 bolts, for fatigue classification:
End and edge distances: 1.5d = 1.5 26 = 39 mm Spacing: 2.5d = 2.5 24 = 60 mm
(The parameter d is not specified in Table 8.1 but GN 5.08 (P185[ 6]), suggests use of hole diameter for edge distances and bolt diameter for spacings.)
3-1-9/ Table 8.1
For detailing purposes, use minima of 40 mm, 65 mm and 70 mm respectively
12.5 Splice configuration
Consider the following splice configuration:
11 @
7550
50
11050 50
11 @
7550
50
11050 50
Elevation and web splice
50 2@65 110 2@65 50
60 7
5
60
50 2@65 110 2@65 50
60 7
5
60
Top flange (lower cover plates)
50 4@65 110 4@65 50
60 7
5
60
50 4@65 110 4@65 50
60 7
5
60
Bottom flange (upper cover plates)
Top flange splice (Dimensions for lower covers)
Bolt spacing: In line of force: e1 = 50 mm, p1 = 65 mm Perpendicular to force: e2 = 60 mm, p2 = 75 mm Overall dimension 470 195 mm Thickness 10 mm
P357 Composite Highway Bridge Design: Worked ExamplesC
reat
ed o
n 16
Apr
il 20
12T
his
mat
eria
l is
copy
right
- a
ll rig
hts
rese
rved
. Use
of t
his
docu
men
t is
subj
ect t
o th
e te
rms
and
cond
ition
s of
the
Ste
elbi
z Li
cenc
e A
gree
men
t
Job No. BCR113 Sheet 53 of 64 Rev A
Job Title Composite highway bridges: Worked examples
Subject Example 1: Multi-girder two-span bridge Section 12: Main girder splices
Made by DCI Date July 2009
Silwood Park, Ascot, Berks SL5 7QN Telephone: (01344) 636525 Fax: (01344) 636570 CALCULATION SHEET
Client
SCI Checked by JMS Date Sep 2009
P357-example1-D06.doc 57 Printed 17/03/2010
The length of the cover is sufficiently short that stud shear connectors do not need to be welded to the upper cover (the maximum permitted longitudinal spacing is 800 mm).
4-2/6.6.5.5
Bottom flange splice (Dimensions for upper covers)
Bolt spacing:
In line of force: e1 = 50 mm, p1 = 65 mm
Perpendicular to force: e2 = 60 mm, p2 = 75 mm
Overall dimension 210 195 mm.
Thickness 20 mm
Web splice Bolt spacing:
In line of force: e1 = 50 mm (only a single column, so no p1 value)
Perpendicular to force: e2 = 50 mm, p2 = 75 mm
Overall dimension 730 925 mm.
Thickness 10 mm
The web depth on the support side of the splice is 1000 mm and if the web splice is positioned symmetrically within this depth, the centreline of the lowest bolt will be 87.5 mm above the flange and 67.5 mm above the cover plate. This is adequate for the tightening of the bolt (see GN 2.06, P185[ 6]).
12.6 Verification of connection resistances
Top flange splice There are 3 rows of bolts, with 4 bolts per row across the flange.
A category C connection is required (the design situation is for resistance against buckling of the beam during construction).
Slip resistance at ULS = 12 158 = 1896 kN >1226 kN adequate
Bottom flange splice There are 5 rows of bolts, with 4 bolts per row across the flange.
A category B connection is required (the design situation is for resistance against compression in the flange in service).
Resistance at ULS
ULS slip resistance = 20 158 = 3160 kN < 3960 kN so the splice will slip into bearing at ULS
ULS shear resistance of bolt group = 20 272 = 5440 kN - adequate
P357 Composite Highway Bridge Design: Worked ExamplesC
reat
ed o
n 16
Apr
il 20
12T
his
mat
eria
l is
copy
right
- a
ll rig
hts
rese
rved
. Use
of t
his
docu
men
t is
subj
ect t
o th
e te
rms
and
cond
ition
s of
the
Ste
elbi
z Li
cenc
e A
gree
men
t
Job No. BCR113 Sheet 54 of 64 Rev A
Job Title Composite highway bridges: Worked examples
Subject Example 1: Multi-girder two-span bridge Section 12: Main girder splices
Made by DCI Date July 2009
Silwood Park, Ascot, Berks SL5 7QN Telephone: (01344) 636525 Fax: (01344) 636570 CALCULATION SHEET
Client
SCI Checked by JMS Date Sep 2009
P357-example1-D06.doc 58 Printed 17/03/2010
ULS bearing resistance per bolt is given by:
M2
ub1Rdb,
dtfkF
Bolt spacings, for determination of factors k1 and b
In line of force: e1 = 50 mm, p1 = 65 mm
Perpendicular to force: e2 = 60 mm, p2 = 75 mm
Since fub > fu, b = d (but 1)
For end bolts: d = e1/3d0 = 50 /(3 26) = 0.64
For inner bolts: d = p1/d0 − ¼ = 65 /(3 26) − 0.25= 0.58
For edge bolts k1 is the smaller of 2.8e2/d0 − 1.7 and 2.5
k1 = min(2.8 60/26 − 1.7; 2.5) = 2.5
In the upper cover plates there is no ‘inner’ line of bolts (in the direction of force) and for the flange and lower cover, the mean value of p2 that would apply is sufficient to ensure that k1 = 2.5
The value of fu is given by the product standard for S355 plates as 470 kN/mm2 EN 10025-2
Conservatively, using b = 0.58 the resistance of the bolt in 20 mm covers is:
26225.1
202447058.050.2Rdb,
F kN
Bearing resistance of group, with double covers = 20 2 262 = 10480 kN
The ULS bearing resistance is adequate and the connection resistance is determined by the shear resistance of the bolts. Note that, on the span side, 20 mm packing is used. This would reduce the bearing/shear resistance on the upper shear plane by about 15% (see 3–1–8/3.6.1(12)) but the resistance would still be adequate.
Resistance at SLS
SLS slip resistance of group = 20 180 = 3600 kN >3312 kN satisfactory
Web splice The splice has a single column of 12 bolts at 75 mm spacing
For this group the ‘modulus’ for the outer bolts = max2 rri
where ri is the distance of each bolt from the centre of the group and rmax is the distance of the furthest bolt.
Here, the modulus = 1950 mm
The extra moment due to the shear = shear force eccentricity of group from the centreline of the splice
P357 Composite Highway Bridge Design: Worked ExamplesC
reat
ed o
n 16
Apr
il 20
12T
his
mat
eria
l is
copy
right
- a
ll rig
hts
rese
rved
. Use
of t
his
docu
men
t is
subj
ect t
o th
e te
rms
and
cond
ition
s of
the
Ste
elbi
z Li
cenc
e A
gree
men
t
Job No. BCR113 Sheet 55 of 64 Rev A
Job Title Composite highway bridges: Worked examples
Subject Example 1: Multi-girder two-span bridge Section 12: Main girder splices
Made by DCI Date July 2009
Silwood Park, Ascot, Berks SL5 7QN Telephone: (01344) 636525 Fax: (01344) 636570 CALCULATION SHEET
Client
SCI Checked by JMS Date Sep 2009
P357-example1-D06.doc 59 Printed 17/03/2010
Hence the force on the outer bolts at ULS and SLS are
ULS hog SLS hog ULS shear SLS shear Shear V 834 650 1320 1011 kN Longitudinal force FL 609 469 –336 –259 kN Moment 155 127 –33 –11 kNm Moment due to e = 55 mm 46 36 73 56 kNm Total Moment M 201 163 40 45 kNm Force per bolt due to M 103 84 21 23 kN (= M/1950) Force per bolt due to FL 51 39 –28 22 kN (= FL/12) Total horizontal force 154 123 49 45 kN Vertical force due to V 70 54 110 84 kN (= V/12) Resultant force 169 134 120 95 kN (Vector sum)
Bearing resistance for web bolts Note: The directions of the resultant forces are not parallel to an edge. Table 3.4 suggests that in such cases the parallel and normal components could be verified separately but no interaction relationship is suggested. Here the direction of the resultant force being not normal to the long edge of the cover plate edge is considered not to have an adverse effect on the factors, since the edge distance is less than the end distance. The factors for resistance in a horizontal direction are therefore used.
For end bolts (there is only a single row, transverse to the force):
d = e1/3d0 = 50 /(3 26) = 0.64
For edge bolts k1 = min(2.8 50/26 − 1.7; 2.5) = 2.5
For inner bolts k1 = min(1.4 75/26 − 1.7; 2.5) = 2.34
With two 10 mm covers, the bearing stress on the 14 mm web is higher (and is higher again on the 10 mm web, although the values for the design forces on that side of the splice are lower and are not shown here)
20225.1
14244706450.2Rdb,
F kN (for end bolts, 192 kN for inner bolts)
The bearing resistance is less than the resistance of the bolts in double shear (272 kN), so bearing resistance governs.
The maximum resultant force at ULS (164 kN) exceeds the slip resistance (158 kN) but is less than the resistance in bearing and shear (202 kN) therefore the bolt group is satisfactory. The maximum force at SLS is 134 kN and the resistance is 180 kN so there is no slip at SLS. The forces on the inner bolts are less and are satisfactory by inspection.
12.7 Forces in cover plates
The cover plates are verified as members in tension or compression, in accordance with EN 1993–1–1.
P357 Composite Highway Bridge Design: Worked ExamplesC
reat
ed o
n 16
Apr
il 20
12T
his
mat
eria
l is
copy
right
- a
ll rig
hts
rese
rved
. Use
of t
his
docu
men
t is
subj
ect t
o th
e te
rms
and
cond
ition
s of
the
Ste
elbi
z Li
cenc
e A
gree
men
t
Job No. BCR113 Sheet 56 of 64 Rev A
Job Title Composite highway bridges: Worked examples
Subject Example 1: Multi-girder two-span bridge Section 12: Main girder splices
Made by DCI Date July 2009
Silwood Park, Ascot, Berks SL5 7QN Telephone: (01344) 636525 Fax: (01344) 636570 CALCULATION SHEET
Client
SCI Checked by JMS Date Sep 2009
P357-example1-D06.doc 60 Printed 17/03/2010
Top flange The covers are in tension. Assume half of the load is carried in the lower cover plates. The force per cover plate thus = 1302/4 = 326 kN
Area of gross cross section = 195 10 = 1950 mm2
Area of net section = 1950 − 2 26 10 = 1430 mm2
This is a Category C slip resistant connection, therefore the design tension resistance is given by:
508100.13551430 3
M0
ynetRdnet,
fA
N kN Satisfactory 3-1-1/6.2.3
The maximum spacing of bolts is 110 mm and the limiting spacing is given by Table 3.3 as the smaller of 14t (= 140 mm) and 200 mm. Since p1/t = 65/20 = 3.25, which is less than 9 (=7.2) buckling does not need to be checked. The spacing is satisfactory.
3-1-1/ Table 3.3
Bottom flange The covers are in compression. Assume half of the load is carried in the upper cover plates. The force per cover plate thus = 3960/4 = 990 kN
Fastener holes do not need to be deducted (unless oversize holes are allowed), therefore A = 1950 20 = 3900 mm2
1346100.13453900 3
M0
yRdpl,
Af
N kN Satisfactory
The maximum spacing of bolts is 110 mm and the limiting spacing is given by Table 3.3 as the smaller of 14t (= 280 mm) and 200 mm. The spacing is satisfactory.
3-1-1/ Table 3.3
Web Consider the stresses in the cover plate on a line through the vertical row of bolts.
The moment on each cover plate = 201/2 = 101 kN The axial force = 609/2 = 305 kN The shear force = 834/2 = 417 kN
The stress at the bottom of the cover plate is thus:
(101 106) /(10 9252/6) + (305 103)/(925 10)
= 71 + 33 = 104 N/mm2
The value of p1/t = 115/10 = 11, which is greater than 9 (=7.2) so buckling must be checked. Using a buckling length of 0.6p1 = 66 mm and 89.21210 i mm, the slenderness is:
30.05.7698.2
66
1
cr
i
L
3-1-8/ Table 3.3 3-1-1/6.3.1.3
P357 Composite Highway Bridge Design: Worked ExamplesC
reat
ed o
n 16
Apr
il 20
12T
his
mat
eria
l is
copy
right
- a
ll rig
hts
rese
rved
. Use
of t
his
docu
men
t is
subj
ect t
o th
e te
rms
and
cond
ition
s of
the
Ste
elbi
z Li
cenc
e A
gree
men
t
Job No. BCR113 Sheet 57 of 64 Rev A
Job Title Composite highway bridges: Worked examples
Subject Example 1: Multi-girder two-span bridge Section 12: Main girder splices
Made by DCI Date July 2009
Silwood Park, Ascot, Berks SL5 7QN Telephone: (01344) 636525 Fax: (01344) 636570 CALCULATION SHEET
Client
SCI Checked by JMS Date Sep 2009
P357-example1-D06.doc 61 Printed 17/03/2010
From buckling curve a, = 0.98, so the limiting stress = 0.98 355/1.1 = 316 N/mm2, which is satisfactory. The spacing also complies with the limit of 14t (= 140 mm).
The shear stress is:
417 103 /(10 925) = 45 N/mm2
This is satisfactory and is low enough that the resistance to direct stress does not need to be reduced.
P357 Composite Highway Bridge Design: Worked ExamplesC
reat
ed o
n 16
Apr
il 20
12T
his
mat
eria
l is
copy
right
- a
ll rig
hts
rese
rved
. Use
of t
his
docu
men
t is
subj
ect t
o th
e te
rms
and
cond
ition
s of
the
Ste
elbi
z Li
cenc
e A
gree
men
t
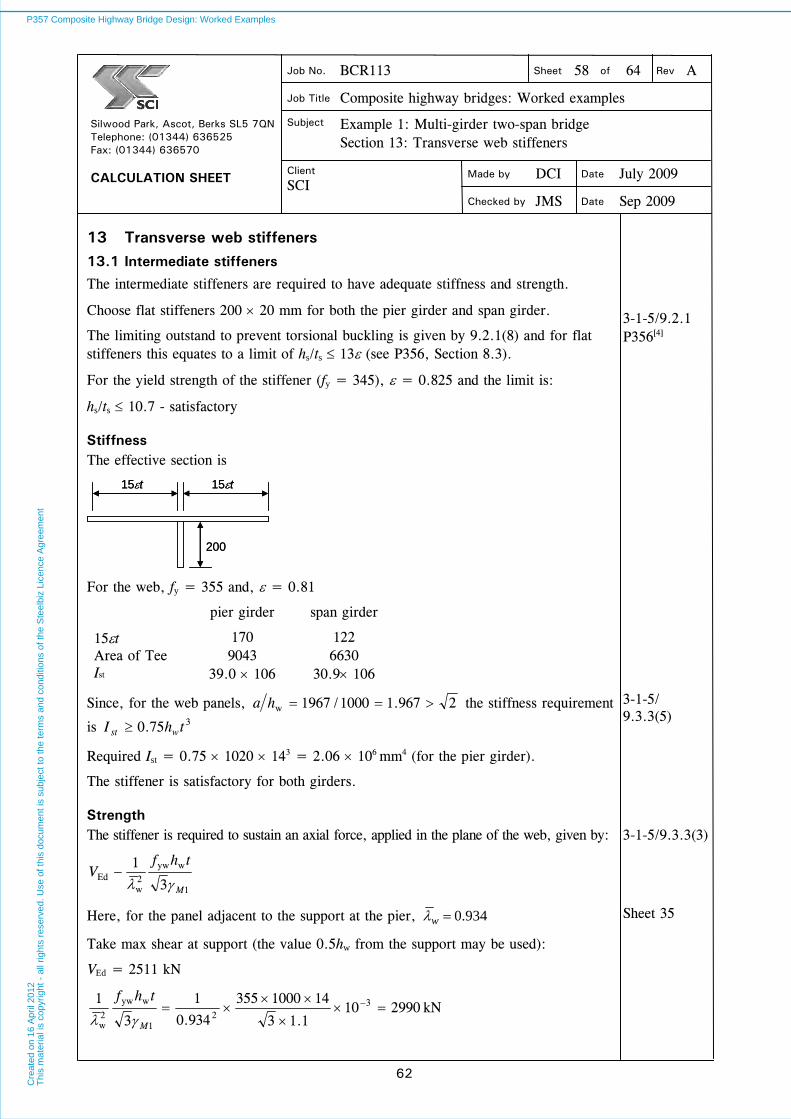
Job No. BCR113 Sheet 58 of 64 Rev A
Job Title Composite highway bridges: Worked examples
Subject Example 1: Multi-girder two-span bridge Section 13: Transverse web stiffeners
Made by DCI Date July 2009
Silwood Park, Ascot, Berks SL5 7QN Telephone: (01344) 636525 Fax: (01344) 636570 CALCULATION SHEET
Client
SCI Checked by JMS Date Sep 2009
P357-example1-D06.doc 62 Printed 17/03/2010
13 Transverse web stiffeners
13.1 Intermediate stiffeners
The intermediate stiffeners are required to have adequate stiffness and strength.
Choose flat stiffeners 200 20 mm for both the pier girder and span girder.
The limiting outstand to prevent torsional buckling is given by 9.2.1(8) and for flat stiffeners this equates to a limit of hs/ts 13 (see P356, Section 8.3).
For the yield strength of the stiffener (fy = 345), = 0.825 and the limit is:
hs/ts 10.7 - satisfactory
3-1-5/9.2.1 P356[ 4]
Stiffness The effective section is
15t 15t
200
15t 15t
200
For the web, fy = 355 and, = 0.81
pier girder span girder
15t 170 122 Area of Tee 9043 6630 Ist 39.0 106 30.9 106
Since, for the web panels, 2967.11000/1967w ha the stiffness requirement
is 375.0 thI wst
3-1-5/ 9.3.3(5)
Required Ist = 0.75 1020 143 = 2.06 106 mm4 (for the pier girder).
The stiffener is satisfactory for both girders.
Strength The stiffener is required to sustain an axial force, applied in the plane of the web, given by:
1
wyw2w
Ed3
1
M
thfV
3-1-5/9.3.3(3)
Here, for the panel adjacent to the support at the pier, 934.0w
Take max shear at support (the value 0.5hw from the support may be used):
VEd = 2511 kN
Sheet 35
2990101.13
141000355
934.0
1
3
1 32
1
wyw
2w
M
thf
kN
P357 Composite Highway Bridge Design: Worked ExamplesC
reat
ed o
n 16
Apr
il 20
12T
his
mat
eria
l is
copy
right
- a
ll rig
hts
rese
rved
. Use
of t
his
docu
men
t is
subj
ect t
o th
e te
rms
and
cond
ition
s of
the
Ste
elbi
z Li
cenc
e A
gree
men
t
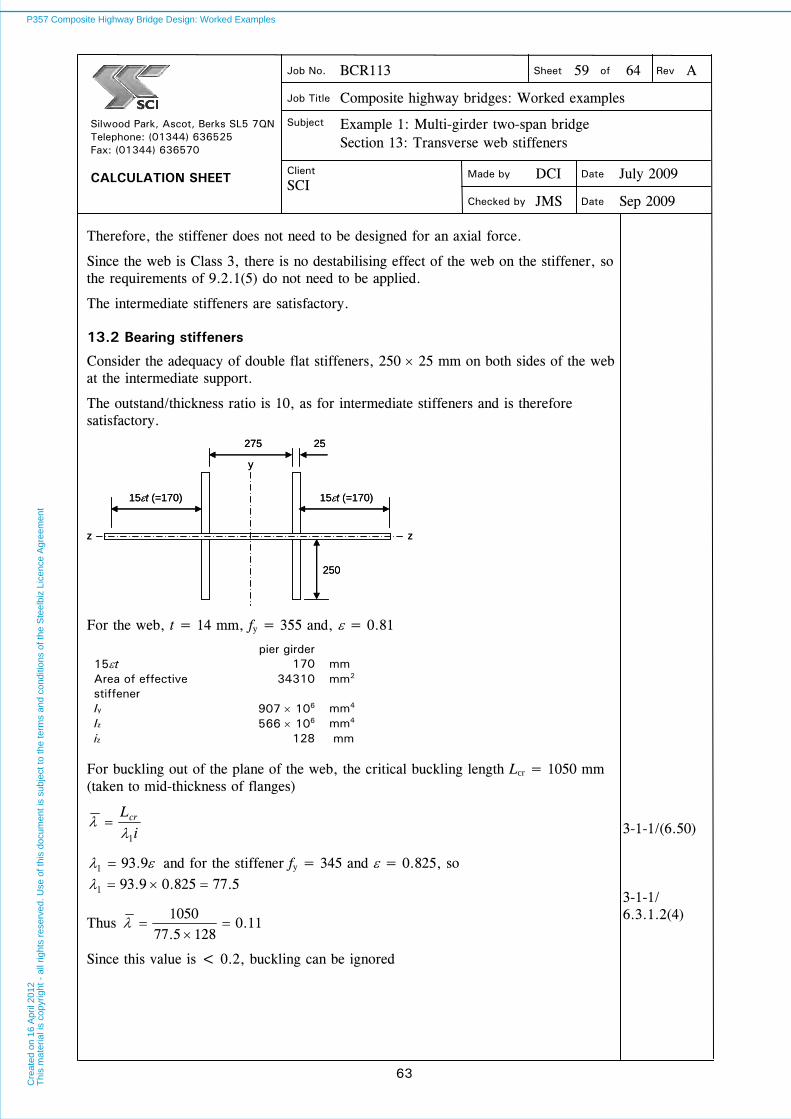
Job No. BCR113 Sheet 59 of 64 Rev A
Job Title Composite highway bridges: Worked examples
Subject Example 1: Multi-girder two-span bridge Section 13: Transverse web stiffeners
Made by DCI Date July 2009
Silwood Park, Ascot, Berks SL5 7QN Telephone: (01344) 636525 Fax: (01344) 636570 CALCULATION SHEET
Client
SCI Checked by JMS Date Sep 2009
P357-example1-D06.doc 63 Printed 17/03/2010
Therefore, the stiffener does not need to be designed for an axial force.
Since the web is Class 3, there is no destabilising effect of the web on the stiffener, so the requirements of 9.2.1(5) do not need to be applied.
The intermediate stiffeners are satisfactory.
13.2 Bearing stiffeners
Consider the adequacy of double flat stiffeners, 250 25 mm on both sides of the web at the intermediate support.
The outstand/thickness ratio is 10, as for intermediate stiffeners and is therefore satisfactory.
15t (=170)
250
275
15t (=170)
25
zz
y
15t (=170)
250
275
15t (=170)
25
zz
y
For the web, t = 14 mm, fy = 355 and, = 0.81
pier girder 15t 170 mm Area of effective stiffener
34310 mm2
Iy 907 106 mm4 Iz 566 106 mm4 iz 128 mm
For buckling out of the plane of the web, the critical buckling length Lcr = 1050 mm (taken to mid-thickness of flanges)
i
Lcr
1
9.931 and for the stiffener fy = 345 and = 0.825, so 5.77825.09.931
Thus 11.01285.77
1050
Since this value is < 0.2, buckling can be ignored
3-1-1/(6.50) 3-1-1/ 6.3.1.2(4)
P357 Composite Highway Bridge Design: Worked ExamplesC
reat
ed o
n 16
Apr
il 20
12T
his
mat
eria
l is
copy
right
- a
ll rig
hts
rese
rved
. Use
of t
his
docu
men
t is
subj
ect t
o th
e te
rms
and
cond
ition
s of
the
Ste
elbi
z Li
cenc
e A
gree
men
t
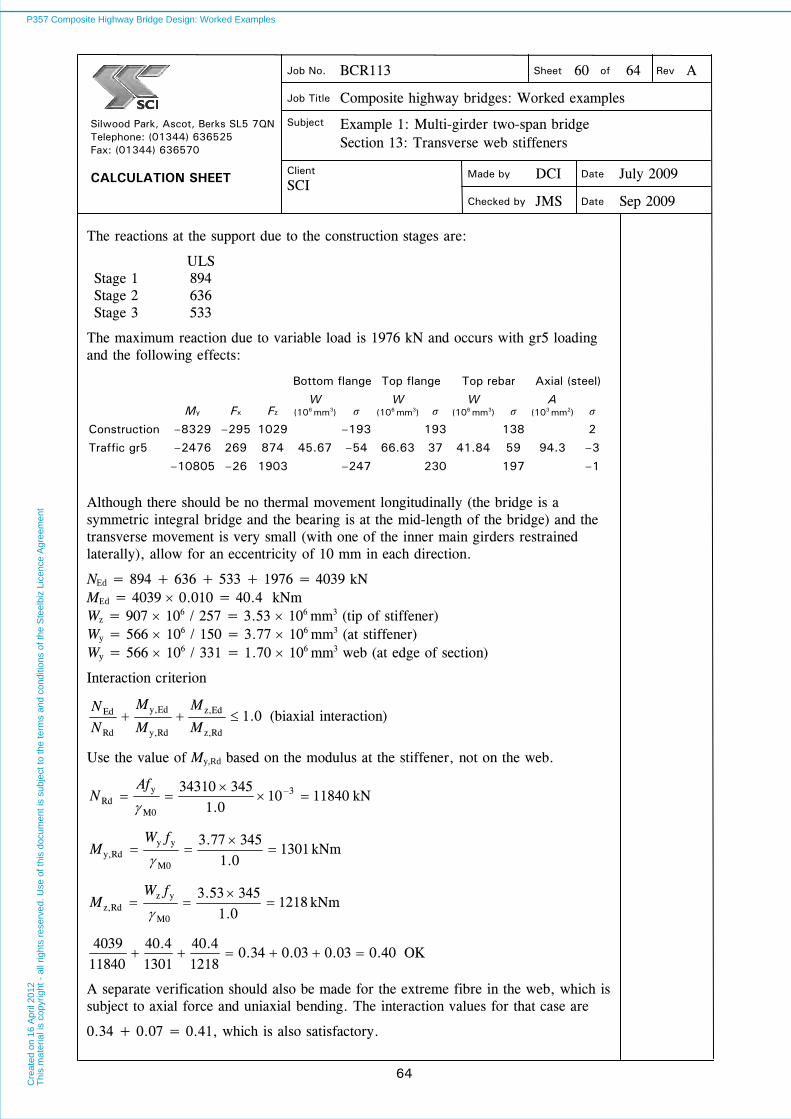
Job No. BCR113 Sheet 60 of 64 Rev A
Job Title Composite highway bridges: Worked examples
Subject Example 1: Multi-girder two-span bridge Section 13: Transverse web stiffeners
Made by DCI Date July 2009
Silwood Park, Ascot, Berks SL5 7QN Telephone: (01344) 636525 Fax: (01344) 636570 CALCULATION SHEET
Client
SCI Checked by JMS Date Sep 2009
P357-example1-D06.doc 64 Printed 17/03/2010
The reactions at the support due to the construction stages are:
ULS Stage 1 894 Stage 2 636 Stage 3 533
The maximum reaction due to variable load is 1976 kN and occurs with gr5 loading and the following effects:
Bottom flange Top flange Top rebar Axial (steel)
My Fx Fz W
(106 mm3) σ W
(106 mm3) σ W
(106 mm3) σ A
(103 mm2) σ
Construction –8329 –295 1029 –193 193 138 2
Traffic gr5 –2476 269 874 45.67 –54 66.63 37 41.84 59 94.3 –3
–10805 –26 1903 –247 230 197 –1
Although there should be no thermal movement longitudinally (the bridge is a symmetric integral bridge and the bearing is at the mid-length of the bridge) and the transverse movement is very small (with one of the inner main girders restrained laterally), allow for an eccentricity of 10 mm in each direction.
NEd = 894 + 636 + 533 + 1976 = 4039 kN MEd = 4039 0.010 = 40.4 kNm
Wz = 907 106 / 257 = 3.53 106 mm3 (tip of stiffener) Wy = 566 106 / 150 = 3.77 106 mm3 (at stiffener) Wy = 566 106 / 331 = 1.70 106 mm3 web (at edge of section)
Interaction criterion
0.1Rdz,
Edz,
Rdy,
Edy,
Rd
Ed M
M
M
M
N
N (biaxial interaction)
Use the value of My,Rd based on the modulus at the stiffener, not on the web.
11840100.1
34534310 3
M0
yRd
Af
N kN
13010.134577.3
M0
yyRdy,
fW
M kNm
12180.134553.3
M0
yzRdz,
fW
M kNm
40.003.003.034.01218
4.401301
4.40118404039
OK
A separate verification should also be made for the extreme fibre in the web, which is subject to axial force and uniaxial bending. The interaction values for that case are
0.34 + 0.07 = 0.41, which is also satisfactory.
P357 Composite Highway Bridge Design: Worked ExamplesC
reat
ed o
n 16
Apr
il 20
12T
his
mat
eria
l is
copy
right
- a
ll rig
hts
rese
rved
. Use
of t
his
docu
men
t is
subj
ect t
o th
e te
rms
and
cond
ition
s of
the
Ste
elbi
z Li
cenc
e A
gree
men
t
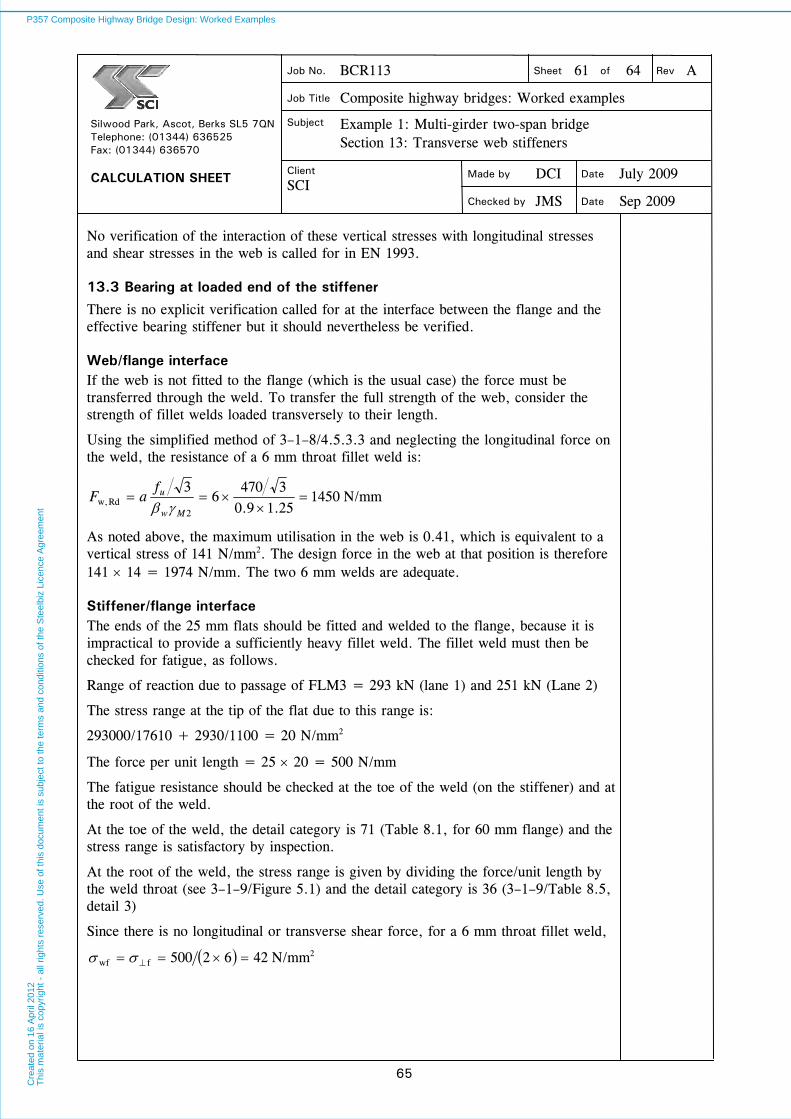
Job No. BCR113 Sheet 61 of 64 Rev A
Job Title Composite highway bridges: Worked examples
Subject Example 1: Multi-girder two-span bridge Section 13: Transverse web stiffeners
Made by DCI Date July 2009
Silwood Park, Ascot, Berks SL5 7QN Telephone: (01344) 636525 Fax: (01344) 636570 CALCULATION SHEET
Client
SCI Checked by JMS Date Sep 2009
P357-example1-D06.doc 65 Printed 17/03/2010
No verification of the interaction of these vertical stresses with longitudinal stresses and shear stresses in the web is called for in EN 1993.
13.3 Bearing at loaded end of the stiffener
There is no explicit verification called for at the interface between the flange and the effective bearing stiffener but it should nevertheless be verified.
Web/flange interface If the web is not fitted to the flange (which is the usual case) the force must be transferred through the weld. To transfer the full strength of the web, consider the strength of fillet welds loaded transversely to their length.
Using the simplified method of 3–1–8/4.5.3.3 and neglecting the longitudinal force on the weld, the resistance of a 6 mm throat fillet weld is:
145025.19.03470
63
2Rdw,
Mw
ufaF
N/mm
As noted above, the maximum utilisation in the web is 0.41, which is equivalent to a vertical stress of 141 N/mm2. The design force in the web at that position is therefore 141 14 = 1974 N/mm. The two 6 mm welds are adequate.
Stiffener/flange interface The ends of the 25 mm flats should be fitted and welded to the flange, because it is impractical to provide a sufficiently heavy fillet weld. The fillet weld must then be checked for fatigue, as follows.
Range of reaction due to passage of FLM3 = 293 kN (lane 1) and 251 kN (Lane 2)
The stress range at the tip of the flat due to this range is:
293000/17610 + 2930/1100 = 20 N/mm2
The force per unit length = 25 20 = 500 N/mm
The fatigue resistance should be checked at the toe of the weld (on the stiffener) and at the root of the weld.
At the toe of the weld, the detail category is 71 (Table 8.1, for 60 mm flange) and the stress range is satisfactory by inspection.
At the root of the weld, the stress range is given by dividing the force/unit length by the weld throat (see 3–1–9/Figure 5.1) and the detail category is 36 (3–1–9/Table 8.5, detail 3)
Since there is no longitudinal or transverse shear force, for a 6 mm throat fillet weld,
4262500fwf N/mm2
P357 Composite Highway Bridge Design: Worked ExamplesC
reat
ed o
n 16
Apr
il 20
12T
his
mat
eria
l is
copy
right
- a
ll rig
hts
rese
rved
. Use
of t
his
docu
men
t is
subj
ect t
o th
e te
rms
and
cond
ition
s of
the
Ste
elbi
z Li
cenc
e A
gree
men
t

Job No. BCR113 Sheet 62 of 64 Rev A
Job Title Composite highway bridges: Worked examples
Subject Example 1: Multi-girder two-span bridge Section 13: Transverse web stiffeners
Made by DCI Date July 2009
Silwood Park, Ascot, Berks SL5 7QN Telephone: (01344) 636525 Fax: (01344) 636570 CALCULATION SHEET
Client
SCI Checked by JMS Date Sep 2009
P357-example1-D06.doc 66 Printed 17/03/2010
As for intermediate support regions in Section 11.1:
1 = 1.73 2 = 0.62 3 = 1.037
08.1293251
1
2.05
4
Sheet 44
Design value is: 42 1.73 0.62 1.037 1.08 = 50 N/mm2
Fatigue strength = 36 N/mm2 (Table 8.5, constructional detail 3)
Design value of fatigue strength = 36/Mf = 36/1.1 - 33 N/mm2
3-1-9/ Table 8.5
The weld must be increased by about 50% - to 9 mm throat (13 mm leg)
(If the return weld around the end of the stiffener were taken into account, it might be possible to show that an 8 mm weld would be sufficient but that is not evaluated here.)
P357 Composite Highway Bridge Design: Worked ExamplesC
reat
ed o
n 16
Apr
il 20
12T
his
mat
eria
l is
copy
right
- a
ll rig
hts
rese
rved
. Use
of t
his
docu
men
t is
subj
ect t
o th
e te
rms
and
cond
ition
s of
the
Ste
elbi
z Li
cenc
e A
gree
men
t

Job No. BCR113 Sheet 63 of 64 Rev A
Job Title Composite highway bridges: Worked examples
Subject Example 1: Multi-girder two-span bridge Section 14: Bracing
Made by DCI Date July 2009
Silwood Park, Ascot, Berks SL5 7QN Telephone: (01344) 636525 Fax: (01344) 636570 CALCULATION SHEET
Client
SCI Checked by JMS Date Sep 2009
P357-example1-D06.doc 67 Printed 17/03/2010
14 Bracing
The configuration of the intermediate bracing systems between girder pairs is as shown below.
Assume the use of 120 120 12 angle sections.
Consider requirements for stiffness and strength
To perform as a fully effective intermediate restraint to the bottom flange adjacent to the support, the stiffness needs to be at least the value given by:
3
2E
D44
L
EIL
NC
where
I is the lateral second moment of area of the effective bottom flange (in the simplified method considered in Section 9.1)
L is the length of flange restrained by the bracing
445900
1008.121000043
92
D
C kN/mm
The stiffness of the bracing system can be determined from a simple plane frame model that reflects the actual geometry, including eccentric end connections, and the effective section of the intermediate stiffeners or a value can be determined from the simple triangulated system below:
øUnit F Unit F
H
B
D
øUnit F Unit F
H
B
D
B = 3700 mm H = 1100 mm D = 3860 mm ø = 0.289 rad
(The use of a diagonal system between top and bottom flanges will generally give a greater flexibility than that with the more detailed plane frame model and the shallower inclination of the angles.)
P357 Composite Highway Bridge Design: Worked ExamplesC
reat
ed o
n 16
Apr
il 20
12T
his
mat
eria
l is
copy
right
- a
ll rig
hts
rese
rved
. Use
of t
his
docu
men
t is
subj
ect t
o th
e te
rms
and
cond
ition
s of
the
Ste
elbi
z Li
cenc
e A
gree
men
t
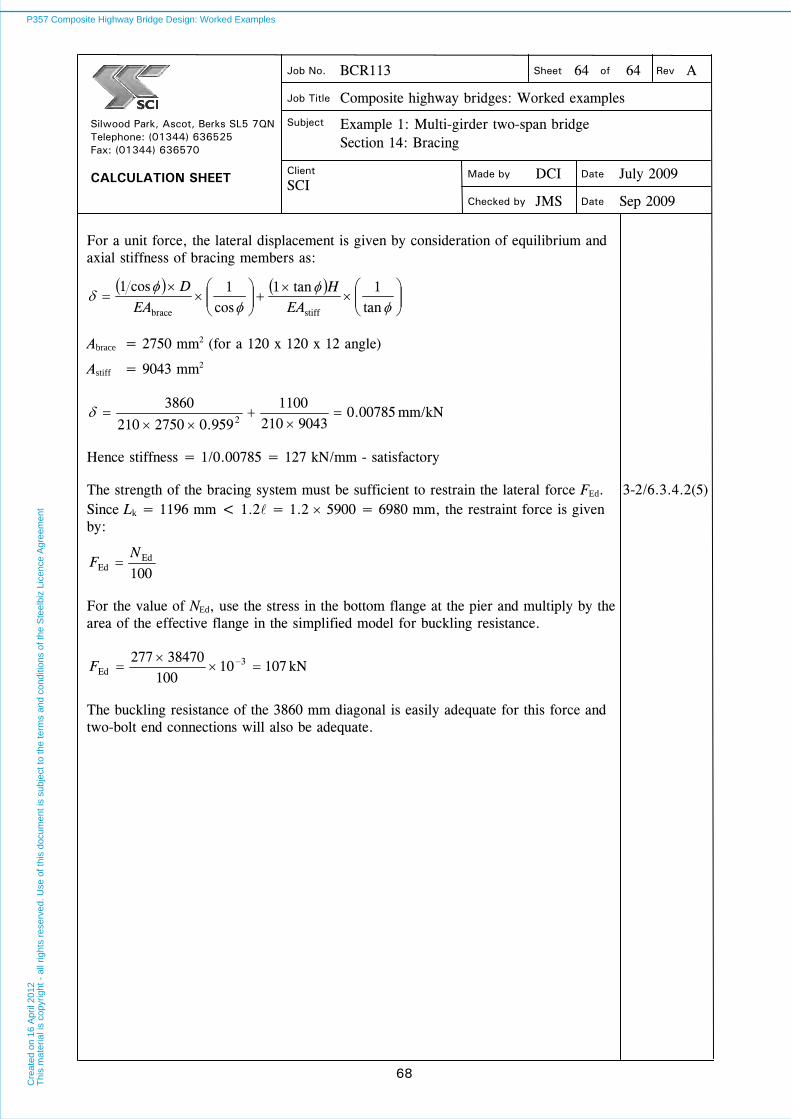
Job No. BCR113 Sheet 64 of 64 Rev A
Job Title Composite highway bridges: Worked examples
Subject Example 1: Multi-girder two-span bridge Section 14: Bracing
Made by DCI Date July 2009
Silwood Park, Ascot, Berks SL5 7QN Telephone: (01344) 636525 Fax: (01344) 636570 CALCULATION SHEET
Client
SCI Checked by JMS Date Sep 2009
P357-example1-D06.doc 68 Printed 17/03/2010
For a unit force, the lateral displacement is given by consideration of equilibrium and axial stiffness of bracing members as:
tan
1tan1cos
1cos1
stiffbrace EAH
EAD
Abrace = 2750 mm2 (for a 120 x 120 x 12 angle)
Astiff = 9043 mm2
00785.09043210
1100
959.02750210
38602
mm/kN
Hence stiffness = 1/0.00785 = 127 kN/mm - satisfactory
The strength of the bracing system must be sufficient to restrain the lateral force FEd. Since Lk = 1196 mm < 1.2 = 1.2 5900 = 6980 mm, the restraint force is given by:
100Ed
EdN
F
3-2/6.3.4.2(5)
For the value of NEd, use the stress in the bottom flange at the pier and multiply by the area of the effective flange in the simplified model for buckling resistance.
10710100
38470277 3Ed
F kN
The buckling resistance of the 3860 mm diagonal is easily adequate for this force and two-bolt end connections will also be adequate.
P357 Composite Highway Bridge Design: Worked ExamplesC
reat
ed o
n 16
Apr
il 20
12T
his
mat
eria
l is
copy
right
- a
ll rig
hts
rese
rved
. Use
of t
his
docu
men
t is
subj
ect t
o th
e te
rms
and
cond
ition
s of
the
Ste
elbi
z Li
cenc
e A
gree
men
t

P357-example2-D07.doc 69
WORKED EXAMPLE 2:
Ladder deck three-span bridge
Index
Section Page No.
1 Structural arrangement 71
2 Design basis 72
3 Actions on the bridge 74
4 Girder make-up and slab reinforcement 77
5 Beam cross sections 79
6 Global analysis 85
7 Design values of the effects of combined actions 91
8 Verification of bare steel girder during construction 95
9 Verification of composite girder 101
10 Longitudinal shear 111
11 Fatigue assessment 116
12 Cross girder to main girder connection 121
P357 Composite Highway Bridge Design: Worked ExamplesC
reat
ed o
n 16
Apr
il 20
12T
his
mat
eria
l is
copy
right
- a
ll rig
hts
rese
rved
. Use
of t
his
docu
men
t is
subj
ect t
o th
e te
rms
and
cond
ition
s of
the
Ste
elbi
z Li
cenc
e A
gree
men
t

P357-example2-D07.doc 70
P357 Composite Highway Bridge Design: Worked ExamplesC
reat
ed o
n 16
Apr
il 20
12T
his
mat
eria
l is
copy
right
- a
ll rig
hts
rese
rved
. Use
of t
his
docu
men
t is
subj
ect t
o th
e te
rms
and
cond
ition
s of
the
Ste
elbi
z Li
cenc
e A
gree
men
t

Job No. BCR113 Sheet 1 of 58 Rev A
Job Title Composite highway bridges: Worked examples
Subject Example 2: Ladder deck three-span bridge Section 1: Structural arrangement
Made by DCI Date July 2009
Silwood Park, Ascot, Berks SL5 7QN Telephone: (01344) 636525 Fax: (01344) 636570 CALCULATION SHEET
Client SCI
Checked by RJ Date Sep 2009
P357-example2-D07.doc 71 Printed 17/03/2010
1 Structural arrangement
The bridge carries a 2-lane single carriageway rural road over a flood plain. The carriageway has 1.0 m wide marginal strips, in accordance with TD 27/05 and has a 2 m wide footway on either side (this width is slightly less than the width for footways given by TA 90/05). A ladder deck girder arrangement has been chosen, and a deck slab thickness of 250 mm has been assumed. The deck cantilevers 1.3 m outside the centrelines of the outer girders; a 250 mm thick slab is likely to be adequate for this length, carrying footway loading or accidental traffic loading.
TD 27/05[ 1] TA 90/05[ 2]
4200024500 24500
Elevation 500 5001000 1000
marginalstrip
marginalstrip
2500 25007300
11700
varies1200 to 2200
Cross section (at intermediate cross girder)
P357 Composite Highway Bridge Design: Worked ExamplesC
reat
ed o
n 16
Apr
il 20
12T
his
mat
eria
l is
copy
right
- a
ll rig
hts
rese
rved
. Use
of t
his
docu
men
t is
subj
ect t
o th
e te
rms
and
cond
ition
s of
the
Ste
elbi
z Li
cenc
e A
gree
men
t

Job No. BCR113 Sheet 2 of 58 Rev A
Job Title Composite highway bridges: Worked examples
Subject Example 2: Ladder deck three-span bridge Section 2: Design basis
Made by DCI Date July 2009
Silwood Park, Ascot, Berks SL5 7QN Telephone: (01344) 636525 Fax: (01344) 636570 CALCULATION SHEET
Client SCI
Checked by RJ Date Sep 2009
P357-example2-D07.doc 72 Printed 17/03/2010
2 Design basis
The bridge is to be designed in accordance with the Eurocodes, as modified by the UK National Annexes.
The basis of design set out in EN 1990 is verification by the partial factor method.
Design situations to be considered are as given in Example 1 and for brevity, they are not repeated here; see Sheets 2 and 3 in Example 1 for details.
Example 1
2.1 Partial factors and combination factors
For a full summary of factors for all types of action, see Example 1.
The values of the principal factors used in this Example are:
At ULS: G = 1.35 for concrete self weight, 1.20 for steel self weight and superimposed dead load (factors for adverse effects). Q = 1.35 for traffic loads, 1.55 for thermal loads.
At SLS, factors of unity apply. A combination factor 0 = 0.75 applies to traffic actions where they are accompanying actions and 0 = 0.60 to thermal actions where they are accompanying actions.
The values tabulated in Section 7 are after application of the relevant factors.
2.2 Structural material properties
It is assumed that the same structural material grades as in Example 1 will be used:
Structural steel: S355 to EN 10025-2 Concrete: C40/50 to EN 206-1 Reinforcement: B500 to EN 10080 and BS 4449
For structural steel, the value of fy depends on the product standard.
(Use 355 N/mm2 for t 16 mm; 345 N/mm2 for 16 mm > t 40 mm; and 335 N/mm2 for 40 mm < t 63 mm)
For concrete, fck = 40 MPa
For reinforcement fyk = 500 N/mm2
3-1-1/NA.2.4 2-1-1, Table 3.1
The modulus of elasticity of both structural steel and reinforcing steel is taken as 210 GPa (as permitted by EN 1994-2, 3.2).
P357 Composite Highway Bridge Design: Worked ExamplesC
reat
ed o
n 16
Apr
il 20
12T
his
mat
eria
l is
copy
right
- a
ll rig
hts
rese
rved
. Use
of t
his
docu
men
t is
subj
ect t
o th
e te
rms
and
cond
ition
s of
the
Ste
elbi
z Li
cenc
e A
gree
men
t
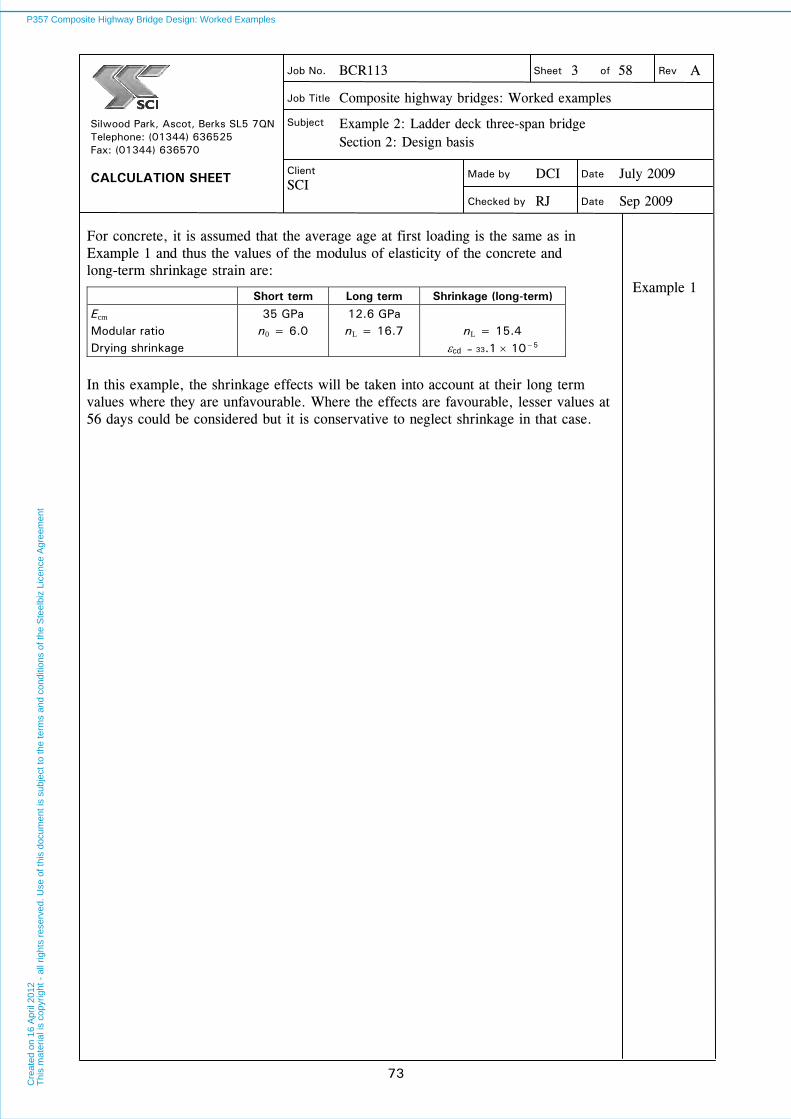
Job No. BCR113 Sheet 3 of 58 Rev A
Job Title Composite highway bridges: Worked examples
Subject Example 2: Ladder deck three-span bridge Section 2: Design basis
Made by DCI Date July 2009
Silwood Park, Ascot, Berks SL5 7QN Telephone: (01344) 636525 Fax: (01344) 636570 CALCULATION SHEET
Client SCI
Checked by RJ Date Sep 2009
P357-example2-D07.doc 73 Printed 17/03/2010
For concrete, it is assumed that the average age at first loading is the same as in Example 1 and thus the values of the modulus of elasticity of the concrete and long-term shrinkage strain are:
Short term Long term Shrinkage (long-term) Ecm 35 GPa 12.6 GPa Modular ratio n0 = 6.0 nL = 16.7 nL = 15.4 Drying shrinkage cd = 33.1 10−5
Example 1
In this example, the shrinkage effects will be taken into account at their long term values where they are unfavourable. Where the effects are favourable, lesser values at 56 days could be considered but it is conservative to neglect shrinkage in that case.
P357 Composite Highway Bridge Design: Worked ExamplesC
reat
ed o
n 16
Apr
il 20
12T
his
mat
eria
l is
copy
right
- a
ll rig
hts
rese
rved
. Use
of t
his
docu
men
t is
subj
ect t
o th
e te
rms
and
cond
ition
s of
the
Ste
elbi
z Li
cenc
e A
gree
men
t

Job No. BCR113 Sheet 4 of 58 Rev A
Job Title Composite highway bridges: Worked examples
Subject Example 2: Ladder deck three-span bridge Section 3: Actions on the bridge
Made by DCI Date July 2009
Silwood Park, Ascot, Berks SL5 7QN Telephone: (01344) 636525 Fax: (01344) 636570 CALCULATION SHEET
Client SCI
Checked by RJ Date Sep 2009
P357-example2-D07.doc 74 Printed 17/03/2010
3 Actions on the bridge
3.1 Permanent actions
Self weight of structural elements The ‘density’ of steel is taken as 77 kN/m3 and the density of reinforced concrete is taken as 25 kN/m3 . The self weights are based on nominal dimensions.
1-1-1/Table A.1
Self weight of surfacing The total nominal thickness of the surfacing, including waterproofing layer is 130 mm. Assume that the ‘density’ is 23 kN/m3 for the whole thickness.
The self weight generally produces adverse effects and for that case the self weight is based on nominal thickness +55%. Thus:
gk = 1.55 0.13 23 = 4.63 kN/m2
1-1-1/Table NA.1
Self weight of footway construction The nominal thickness of the footway (comprising concrete fill and a thin surfacing) is 200 mm and a uniform density of 24 kN/m3 is assumed. The self weight is based on the nominal dimensions and thus:
gk = 1.0 0.2 24 = 4.80 kN/m2
Self weight of parapets A nominal value of 2 kN/m is assumed for each parapet.
3.2 Construction loads
Construction loads are classed as variable loads.
For global analysis, a uniform construction load of Qca = 0.75 kN/m2 is assumed during casting. The use of permanent precast planks is assumed and thus there is no extra load for formwork. Additionally, wet concrete is assumed to have a density of 1 kN/m3 greater than that of hardened concrete; for a slab thickness of 250 mm this adds Qcf = 0.25 kN/m2
The total construction load is thus: Qc = 0.75 + 0.25 = 1.0 kN/m2
1-1-6/2.2 1-1-6/ Table 4.2
3.3 Traffic loads
Road traffic Normal traffic is represented by Load Model 1 (LM1).
For the road carried by this bridge, the highway authority specifies that abnormal traffic be represented by special vehicle SV100, as defined in the UK National Annex.
1-2/ NA.2.16.1.2
Pedestrian traffic Pedestrian traffic is represented by the reduced value given by the NA to BS EN 1991-2, Table NA.3 and clause NA.2.36. Thus 0.6qfk is applied (= 0.6 5.0 = 3 kN/m2). The reduction for longer loaded lengths is not made.
1-2/Table NA.3
P357 Composite Highway Bridge Design: Worked ExamplesC
reat
ed o
n 16
Apr
il 20
12T
his
mat
eria
l is
copy
right
- a
ll rig
hts
rese
rved
. Use
of t
his
docu
men
t is
subj
ect t
o th
e te
rms
and
cond
ition
s of
the
Ste
elbi
z Li
cenc
e A
gree
men
t

Job No. BCR113 Sheet 5 of 58 Rev A
Job Title Composite highway bridges: Worked examples
Subject Example 2: Ladder deck three-span bridge Section 3: Actions on the bridge
Made by DCI Date July 2009
Silwood Park, Ascot, Berks SL5 7QN Telephone: (01344) 636525 Fax: (01344) 636570 CALCULATION SHEET
Client SCI
Checked by RJ Date Sep 2009
P357-example2-D07.doc 75 Printed 17/03/2010
Fatigue loads For fatigue assessment, Fatigue Load Model 3 (FLM3), defined in 1-2/4.6.4, is used, as recommended by 3-2/9.2.2
3.4 Thermal actions
Shade temperatures Maximum and minimum shade temperatures, based on a 50-year return period are defined in BS EN 1991-1-5 NA.2.20. For this bridge location, the values are:
Maximum 33°C Minimum −17°C
1-1-5/ NA.2.20
Thermal range (for determination of extreme value of thermal movement) For determination of the maximum movement at ULS, the values for a 120 year design life are relevant but according to EN 1990:A2, these are determined by applying Q = 1.55 to characteristic values for a 50 year return period.
Table NA.A2.4(B) Note 6
The values of maximum/ minimum uniform bridge temperatures are given by EN 1991; these are referred to as Te,min and Te,max
1-1-1/6.1.3.1
For Type 2 deck
Te,max = Tmax + 4 (Figure 6.1) Te,min = Tmin + 5
The characteristic value TK is thus ½[(33 + 4) − (−17 + 5)] = 49/2 = 24.5°C
1-1-5/ Figure 6.1 3-2/A.4.2.1(4)
The design value of temperature difference is given by
0K*d TTTT γ
3-2/(A.6)
Assuming that bearing installation will be with estimated temperature and without correction by resetting, T0 = 15°C
According to the UK NA, T = 5°C
Thus
5.441555.24*d T °C
3-2/ Table A.4 NA.2.50
For change of length in composite sections, the coefficient of linear thermal expansion is 12 10−6 per °C.
4-2/5.4.2.5
Thus, if the fixed bearing is at one end of the bridge, the characteristic value of displacement at the second intermediate support is:
vx = (24500+42000) 44.5 12 10−6 = 35.5 mm
P357 Composite Highway Bridge Design: Worked ExamplesC
reat
ed o
n 16
Apr
il 20
12T
his
mat
eria
l is
copy
right
- a
ll rig
hts
rese
rved
. Use
of t
his
docu
men
t is
subj
ect t
o th
e te
rms
and
cond
ition
s of
the
Ste
elbi
z Li
cenc
e A
gree
men
t

Job No. BCR113 Sheet 6 of 58 Rev A
Job Title Composite highway bridges: Worked examples
Subject Example 2: Ladder deck three-span bridge Section 3: Actions on the bridge
Made by DCI Date July 2009
Silwood Park, Ascot, Berks SL5 7QN Telephone: (01344) 636525 Fax: (01344) 636570 CALCULATION SHEET
Client SCI
Checked by RJ Date Sep 2009
P357-example2-D07.doc 76 Printed 17/03/2010
Vertical temperature difference The vertical temperature difference given in Table 6.2b will be used and temperature difference will be considered to act simultaneously with uniform temperature change, as recommended in NA.2.12, if that is more onerous. For surfacing thickness other than 100 mm, interpolate in Table B.2, as follows:
1-1-5/ Table 6.2b
T for slab thickness (mm) Surfacing thickness (mm) 200 300 100 13 16 150 10.5 12.5
Interpolating for slab thickness 250 mm, surfacing thickness 130 mm, gives T = 12.7°C.
(The 55% increase over nominal thickness, where surfacing load is adverse, is ignored.)
Only the heating difference is considered here; it is more onerous than the cooling difference situation.
For temperature difference in composite sections, the coefficient of thermal expansion is 10 10−6 per °C
4-2/5.4.2.5
P357 Composite Highway Bridge Design: Worked ExamplesC
reat
ed o
n 16
Apr
il 20
12T
his
mat
eria
l is
copy
right
- a
ll rig
hts
rese
rved
. Use
of t
his
docu
men
t is
subj
ect t
o th
e te
rms
and
cond
ition
s of
the
Ste
elbi
z Li
cenc
e A
gree
men
t
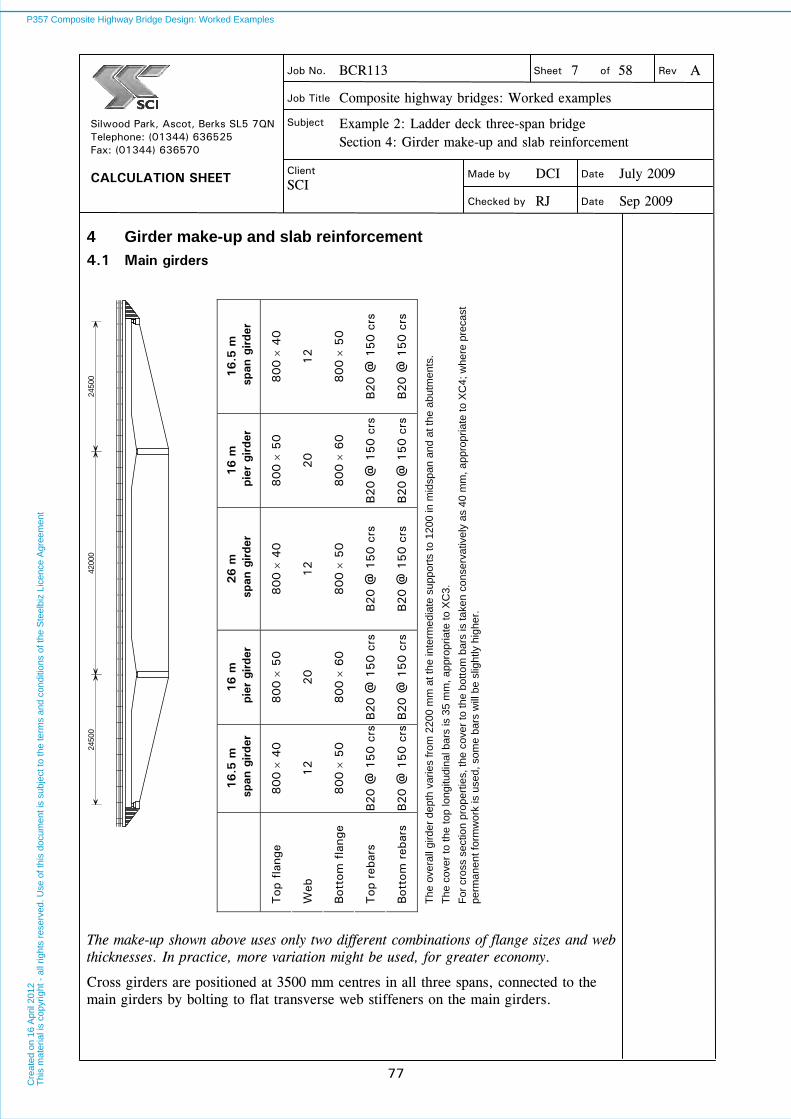
Job No. BCR113 Sheet 7 of 58 Rev A
Job Title Composite highway bridges: Worked examples
Subject Example 2: Ladder deck three-span bridge Section 4: Girder make-up and slab reinforcement
Made by DCI Date July 2009
Silwood Park, Ascot, Berks SL5 7QN Telephone: (01344) 636525 Fax: (01344) 636570 CALCULATION SHEET
Client SCI
Checked by RJ Date Sep 2009
P357-example2-D07.doc 77 Printed 17/03/2010
4 Girder make-up and slab reinforcement
4.1 Main girders
16.5
m
spa
n gi
rder
800
40
12
800
50
B20 @
150 c
rs
B20 @
150 c
rs
16 m
p
ier
gird
er
800
50
20
800
60
B20 @
150 c
rs
B20 @
150 c
rs
26 m
s
pan
gird
er
800
40
12
800
50
B20 @
150 c
rs
B20 @
150 c
rs
16 m
p
ier
gird
er
800
50
20
800
60
B20 @
150 c
rs
B20 @
150 c
rs
16.5
m
spa
n gi
rder
800
40
12
800
50
B20 @
150 c
rs
B20 @
150 c
rs
Top
fla
nge
Web
Bot
tom
fla
nge
Top
reb
ars
Bot
tom
reb
ars
The
ove
rall
gird
er
dept
h va
ries
fro
m 2
200
mm
at t
he
inte
rmed
iate
su
ppor
ts to
120
0 in
mid
span
and
at t
he a
butm
ents
.
The
cov
er to
the
top
long
itudi
nal b
ars
is 3
5 m
m, a
ppro
pria
te to
XC
3.
For
cro
ss s
ectio
n pr
oper
ties,
the
cove
r to
the
bott
om
bar
s is
take
n co
nser
vativ
ely
as 4
0 m
m, a
ppro
pria
te to
XC
4; w
here
pre
cast
pe
rman
ent f
orm
wor
k is
use
d, s
ome
bars
will
be
slig
htly
hig
her.
The make-up shown above uses only two different combinations of flange sizes and web thicknesses. In practice, more variation might be used, for greater economy.
Cross girders are positioned at 3500 mm centres in all three spans, connected to the main girders by bolting to flat transverse web stiffeners on the main girders.
2450
042
000
2450
0
P357 Composite Highway Bridge Design: Worked ExamplesC
reat
ed o
n 16
Apr
il 20
12T
his
mat
eria
l is
copy
right
- a
ll rig
hts
rese
rved
. Use
of t
his
docu
men
t is
subj
ect t
o th
e te
rms
and
cond
ition
s of
the
Ste
elbi
z Li
cenc
e A
gree
men
t
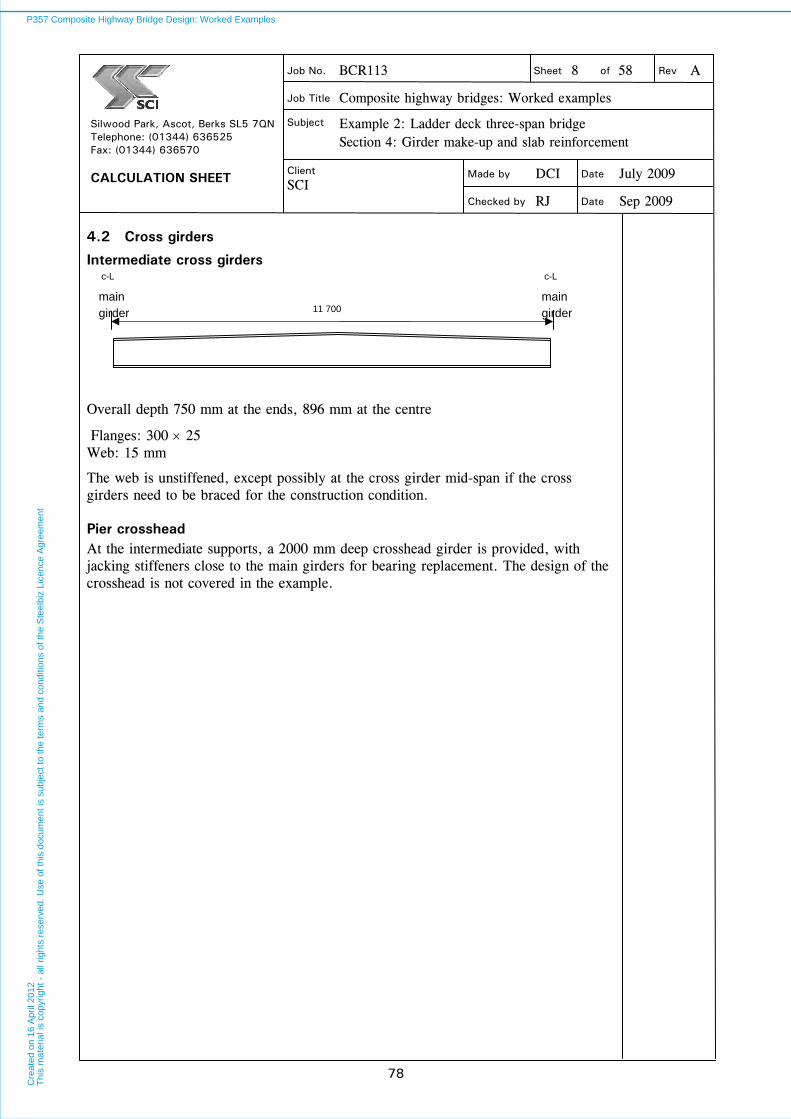
Job No. BCR113 Sheet 8 of 58 Rev A
Job Title Composite highway bridges: Worked examples
Subject Example 2: Ladder deck three-span bridge Section 4: Girder make-up and slab reinforcement
Made by DCI Date July 2009
Silwood Park, Ascot, Berks SL5 7QN Telephone: (01344) 636525 Fax: (01344) 636570 CALCULATION SHEET
Client SCI
Checked by RJ Date Sep 2009
P357-example2-D07.doc 78 Printed 17/03/2010
4.2 Cross girders
Intermediate cross girders
Overall depth 750 mm at the ends, 896 mm at the centre
Flanges: 300 25 Web: 15 mm
The web is unstiffened, except possibly at the cross girder mid-span if the cross girders need to be braced for the construction condition.
Pier crosshead At the intermediate supports, a 2000 mm deep crosshead girder is provided, with jacking stiffeners close to the main girders for bearing replacement. The design of the crosshead is not covered in the example.
c-L main girder 11 700
c-L main girder
P357 Composite Highway Bridge Design: Worked ExamplesC
reat
ed o
n 16
Apr
il 20
12T
his
mat
eria
l is
copy
right
- a
ll rig
hts
rese
rved
. Use
of t
his
docu
men
t is
subj
ect t
o th
e te
rms
and
cond
ition
s of
the
Ste
elbi
z Li
cenc
e A
gree
men
t
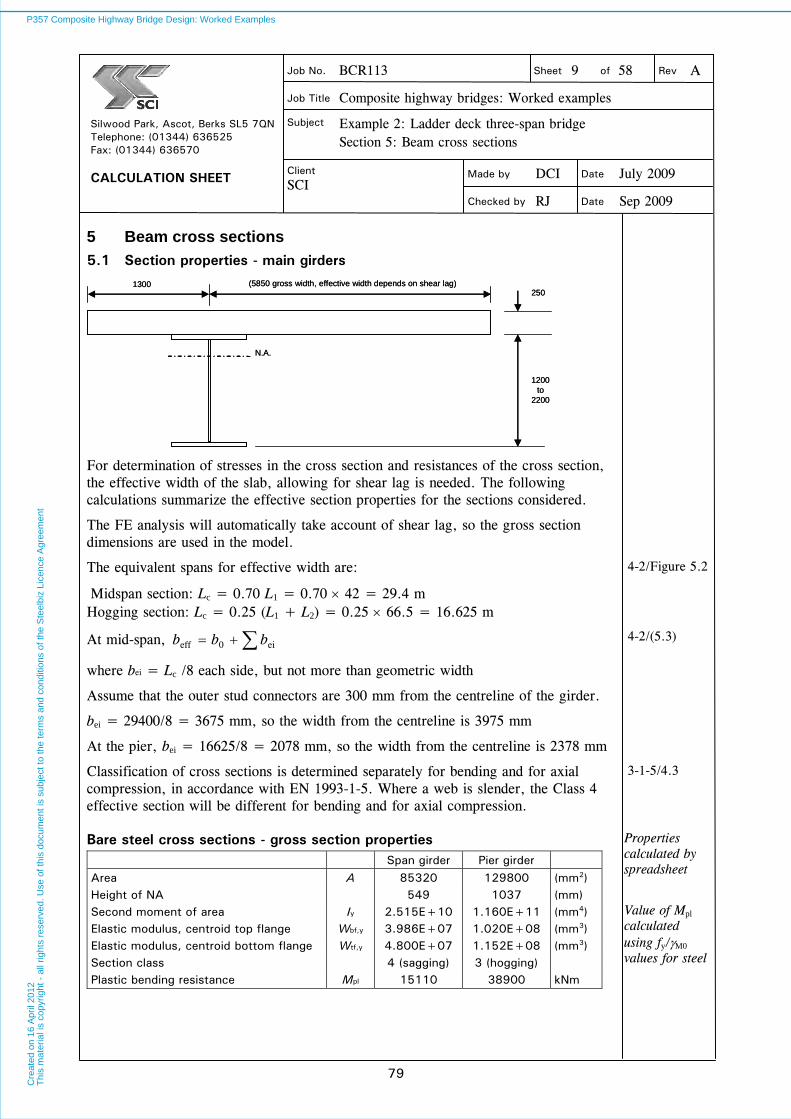
Job No. BCR113 Sheet 9 of 58 Rev A
Job Title Composite highway bridges: Worked examples
Subject Example 2: Ladder deck three-span bridge Section 5: Beam cross sections
Made by DCI Date July 2009
Silwood Park, Ascot, Berks SL5 7QN Telephone: (01344) 636525 Fax: (01344) 636570 CALCULATION SHEET
Client SCI
Checked by RJ Date Sep 2009
P357-example2-D07.doc 79 Printed 17/03/2010
5 Beam cross sections
5.1 Section properties - main girders
N.A.
1300 (5850 gross width, effective width depends on shear lag)
1200to
2200
250
N.A.
1300 (5850 gross width, effective width depends on shear lag)
1200to
2200
250
For determination of stresses in the cross section and resistances of the cross section, the effective width of the slab, allowing for shear lag is needed. The following calculations summarize the effective section properties for the sections considered.
The FE analysis will automatically take account of shear lag, so the gross section dimensions are used in the model.
The equivalent spans for effective width are:
Midspan section: Lc = 0.70 L1 = 0.70 42 = 29.4 m Hogging section: Lc = 0.25 (L1 + L2) = 0.25 66.5 = 16.625 m
4-2/Figure 5.2
At mid-span, ei0eff bbb
where bei = Lc /8 each side, but not more than geometric width
Assume that the outer stud connectors are 300 mm from the centreline of the girder.
bei = 29400/8 = 3675 mm, so the width from the centreline is 3975 mm
4-2/(5.3)
At the pier, bei = 16625/8 = 2078 mm, so the width from the centreline is 2378 mm
Classification of cross sections is determined separately for bending and for axial compression, in accordance with EN 1993-1-5. Where a web is slender, the Class 4 effective section will be different for bending and for axial compression.
3-1-5/4.3
Bare steel cross sections - gross section properties Span girder Pier girder Area A 85320 129800 (mm2) Height of NA 549 1037 (mm) Second moment of area Iy 2.515E+10 1.160E+11 (mm4) Elastic modulus, centroid top flange Wbf,y 3.986E+07 1.020E+08 (mm3) Elastic modulus, centroid bottom flange Wtf,y 4.800E+07 1.152E+08 (mm3) Section class 4 (sagging) 3 (hogging) Plastic bending resistance Mpl 15110 38900 kNm
Properties calculated by spreadsheet
Value of Mpl calculated using fy/M0 values for steel
P357 Composite Highway Bridge Design: Worked ExamplesC
reat
ed o
n 16
Apr
il 20
12T
his
mat
eria
l is
copy
right
- a
ll rig
hts
rese
rved
. Use
of t
his
docu
men
t is
subj
ect t
o th
e te
rms
and
cond
ition
s of
the
Ste
elbi
z Li
cenc
e A
gree
men
t
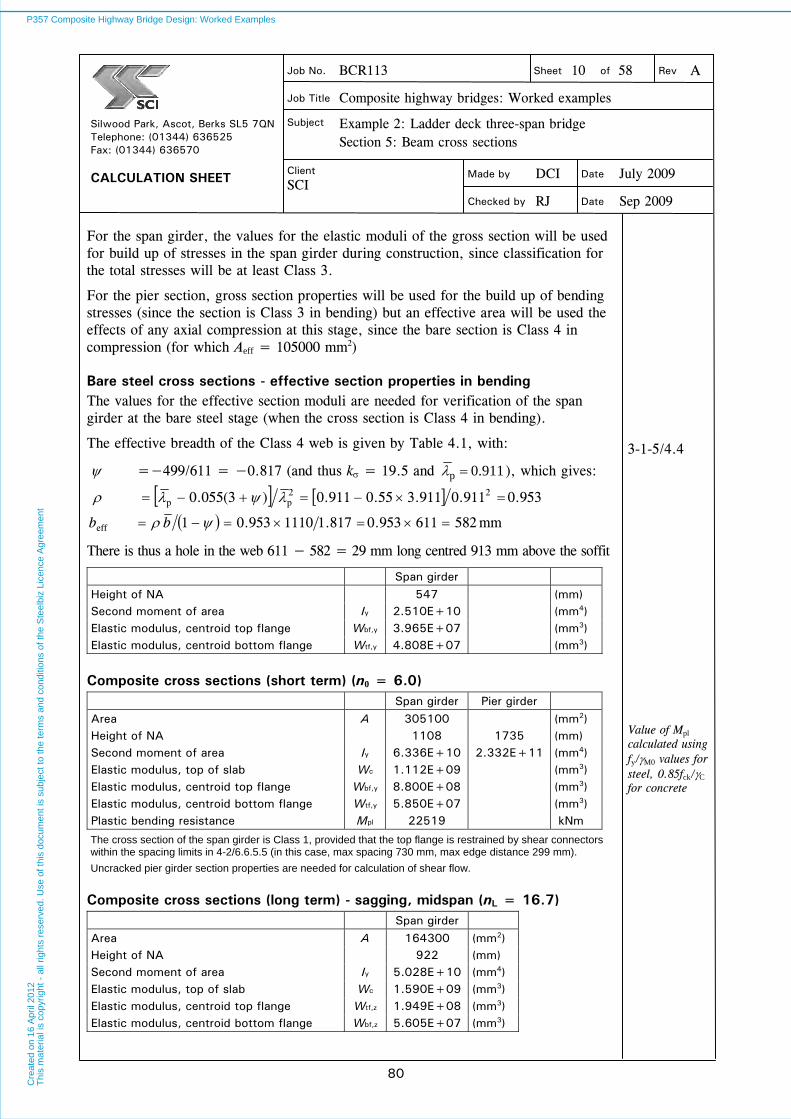
Job No. BCR113 Sheet 10 of 58 Rev A
Job Title Composite highway bridges: Worked examples
Subject Example 2: Ladder deck three-span bridge Section 5: Beam cross sections
Made by DCI Date July 2009
Silwood Park, Ascot, Berks SL5 7QN Telephone: (01344) 636525 Fax: (01344) 636570 CALCULATION SHEET
Client SCI
Checked by RJ Date Sep 2009
P357-example2-D07.doc 80 Printed 17/03/2010
For the span girder, the values for the elastic moduli of the gross section will be used for build up of stresses in the span girder during construction, since classification for the total stresses will be at least Class 3.
For the pier section, gross section properties will be used for the build up of bending stresses (since the section is Class 3 in bending) but an effective area will be used the effects of any axial compression at this stage, since the bare section is Class 4 in compression (for which Aeff = 105000 mm2)
Bare steel cross sections - effective section properties in bending The values for the effective section moduli are needed for verification of the span girder at the bare steel stage (when the cross section is Class 4 in bending).
The effective breadth of the Class 4 web is given by Table 4.1, with:
=−499/611 = −0.817 (and thus k = 19.5 and 911.0p ), which gives:
953.0911.0911.355.0911.0)3(055.0 22pp
582611953.0817.11110953.01eff bb mm
There is thus a hole in the web 611 − 582 = 29 mm long centred 913 mm above the soffit
Span girder Height of NA 547 (mm) Second moment of area Iy 2.510E+10 (mm4) Elastic modulus, centroid top flange Wbf,y 3.965E+07 (mm3) Elastic modulus, centroid bottom flange Wtf,y 4.808E+07 (mm3)
3-1-5/4.4
Composite cross sections (short term) (n0 = 6.0) Span girder Pier girder Area A 305100 (mm2) Height of NA 1108 1735 (mm) Second moment of area Iy 6.336E+10 2.332E+11 (mm4) Elastic modulus, top of slab Wc 1.112E+09 (mm3) Elastic modulus, centroid top flange Wbf,y 8.800E+08 (mm3) Elastic modulus, centroid bottom flange Wtf,y 5.850E+07 (mm3) Plastic bending resistance Mpl 22519 kNm
The cross section of the span girder is Class 1, provided that the top flange is restrained by shear connectors within the spacing limits in 4-2/6.6.5.5 (in this case, max spacing 730 mm, max edge distance 299 mm).
Uncracked pier girder section properties are needed for calculation of shear flow.
Value of Mpl calculated using fy/M0 values for steel, 0.85fck/C for concrete
Composite cross sections (long term) - sagging, midspan (nL = 16.7) Span girder Area A 164300 (mm2) Height of NA 922 (mm) Second moment of area Iy 5.028E+10 (mm4) Elastic modulus, top of slab Wc 1.590E+09 (mm3) Elastic modulus, centroid top flange Wtf,z 1.949E+08 (mm3) Elastic modulus, centroid bottom flange Wbf,z 5.605E+07 (mm3)
P357 Composite Highway Bridge Design: Worked ExamplesC
reat
ed o
n 16
Apr
il 20
12T
his
mat
eria
l is
copy
right
- a
ll rig
hts
rese
rved
. Use
of t
his
docu
men
t is
subj
ect t
o th
e te
rms
and
cond
ition
s of
the
Ste
elbi
z Li
cenc
e A
gree
men
t
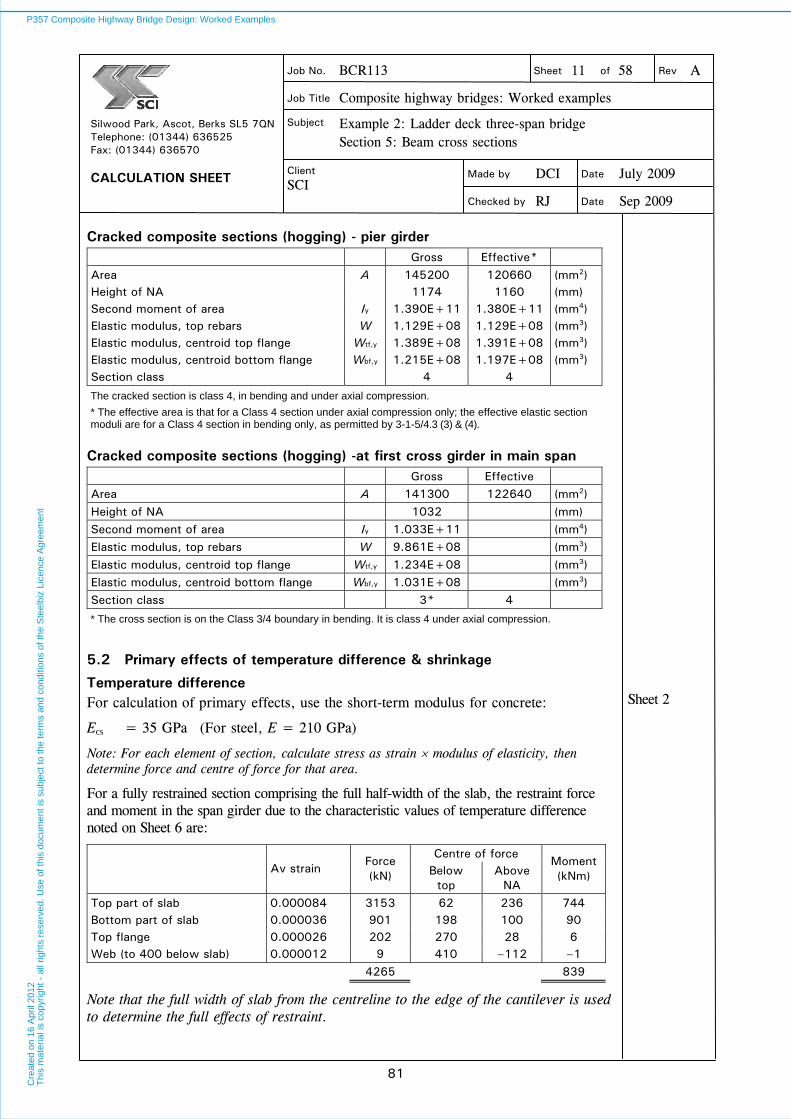
Job No. BCR113 Sheet 11 of 58 Rev A
Job Title Composite highway bridges: Worked examples
Subject Example 2: Ladder deck three-span bridge Section 5: Beam cross sections
Made by DCI Date July 2009
Silwood Park, Ascot, Berks SL5 7QN Telephone: (01344) 636525 Fax: (01344) 636570 CALCULATION SHEET
Client SCI
Checked by RJ Date Sep 2009
P357-example2-D07.doc 81 Printed 17/03/2010
Cracked composite sections (hogging) - pier girder Gross Effective* Area A 145200 120660 (mm2) Height of NA 1174 1160 (mm) Second moment of area Iy 1.390E+11 1.380E+11 (mm4) Elastic modulus, top rebars W 1.129E+08 1.129E+08 (mm3) Elastic modulus, centroid top flange Wtf,y 1.389E+08 1.391E+08 (mm3) Elastic modulus, centroid bottom flange Wbf,y 1.215E+08 1.197E+08 (mm3) Section class 4 4
The cracked section is class 4, in bending and under axial compression.
* The effective area is that for a Class 4 section under axial compression only; the effective elastic section moduli are for a Class 4 section in bending only, as permitted by 3-1-5/4.3 (3) & (4).
Cracked composite sections (hogging) -at first cross girder in main span Gross Effective Area A 141300 122640 (mm2) Height of NA 1032 (mm) Second moment of area Iy 1.033E+11 (mm4) Elastic modulus, top rebars W 9.861E+08 (mm3) Elastic modulus, centroid top flange Wtf,y 1.234E+08 (mm3) Elastic modulus, centroid bottom flange Wbf,y 1.031E+08 (mm3) Section class 3* 4
* The cross section is on the Class 3/4 boundary in bending. It is class 4 under axial compression.
5.2 Primary effects of temperature difference & shrinkage
Temperature difference For calculation of primary effects, use the short-term modulus for concrete:
Ecs = 35 GPa (For steel, E = 210 GPa)
Sheet 2
Note: For each element of section, calculate stress as strain modulus of elasticity, then determine force and centre of force for that area.
For a fully restrained section comprising the full half-width of the slab, the restraint force and moment in the span girder due to the characteristic values of temperature difference noted on Sheet 6 are:
Centre of force
Av strain
Force (kN) Below
top Above
NA
Moment (kNm)
Top part of slab 0.000084 3153 62 236 744 Bottom part of slab 0.000036 901 198 100 90 Top flange 0.000026 202 270 28 6 Web (to 400 below slab) 0.000012 9 410 –112 –1 4265 839
Note that the full width of slab from the centreline to the edge of the cantilever is used to determine the full effects of restraint.
P357 Composite Highway Bridge Design: Worked ExamplesC
reat
ed o
n 16
Apr
il 20
12T
his
mat
eria
l is
copy
right
- a
ll rig
hts
rese
rved
. Use
of t
his
docu
men
t is
subj
ect t
o th
e te
rms
and
cond
ition
s of
the
Ste
elbi
z Li
cenc
e A
gree
men
t

Job No. BCR113 Sheet 12 of 58 Rev A
Job Title Composite highway bridges: Worked examples
Subject Example 2: Ladder deck three-span bridge Section 5: Beam cross sections
Made by DCI Date July 2009
Silwood Park, Ascot, Berks SL5 7QN Telephone: (01344) 636525 Fax: (01344) 636570 CALCULATION SHEET
Client SCI
Checked by RJ Date Sep 2009
P357-example2-D07.doc 82 Printed 17/03/2010
The strains and forces are illustrated diagrammatically below. Strain 12.7 10−5
4.0 10−5
NA
Strain 12.7 10−5
4.0 10−5
NA
The primary effects (stresses) are given by:
Release of restraint
W (steel units)
Restraint (TE) Bending(M/W) Axial(F/A)
Total
Top of slab 2.24E+08 –4.4 0.6 1.9 –1.9 0.6 into slab 4.50E+08 –1.4 0.3 1.9 0.8 Bottom of slab 1.39E+09 –1.1 0.1 1.9 0.9 Top of top flange 1.39E+09 –6.7 0.6 11.1 5.0 400 below slab –1.89E+08 0.0 –4.4 11.1 6.7 Bottom flange –5.79E+07 0.0 –14.5 11.1 –3.4
For the above calculation, short-term section properties for the full width of slab are used, not those tabulated on Sheet 10. (Area = 383200 mm2, steel units)
Diagrammatically:
0
200
400
600
800
1000
1200
1400
1600
-4.0 -2.0 0.0 2.0 4.0 6.0 8.0
P357 Composite Highway Bridge Design: Worked ExamplesC
reat
ed o
n 16
Apr
il 20
12T
his
mat
eria
l is
copy
right
- a
ll rig
hts
rese
rved
. Use
of t
his
docu
men
t is
subj
ect t
o th
e te
rms
and
cond
ition
s of
the
Ste
elbi
z Li
cenc
e A
gree
men
t
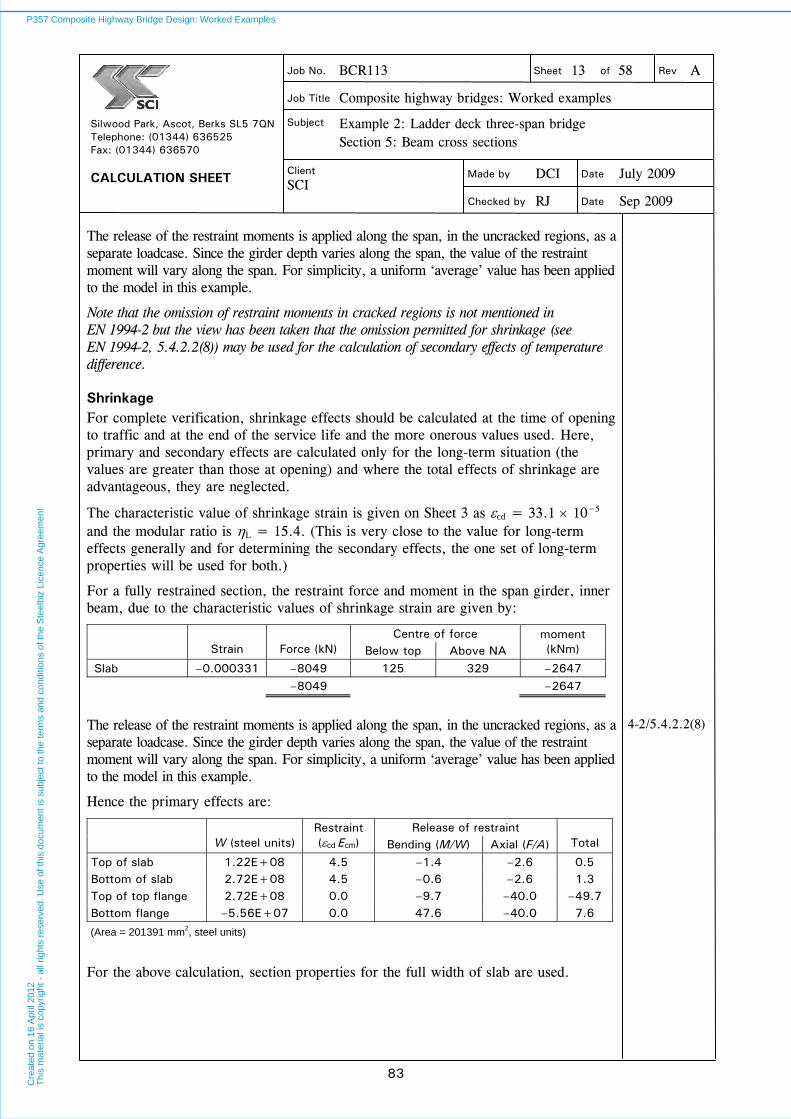
Job No. BCR113 Sheet 13 of 58 Rev A
Job Title Composite highway bridges: Worked examples
Subject Example 2: Ladder deck three-span bridge Section 5: Beam cross sections
Made by DCI Date July 2009
Silwood Park, Ascot, Berks SL5 7QN Telephone: (01344) 636525 Fax: (01344) 636570 CALCULATION SHEET
Client SCI
Checked by RJ Date Sep 2009
P357-example2-D07.doc 83 Printed 17/03/2010
The release of the restraint moments is applied along the span, in the uncracked regions, as a separate loadcase. Since the girder depth varies along the span, the value of the restraint moment will vary along the span. For simplicity, a uniform ‘average’ value has been applied to the model in this example.
Note that the omission of restraint moments in cracked regions is not mentioned in EN 1994-2 but the view has been taken that the omission permitted for shrinkage (see EN 1994-2, 5.4.2.2(8)) may be used for the calculation of secondary effects of temperature difference.
Shrinkage For complete verification, shrinkage effects should be calculated at the time of opening to traffic and at the end of the service life and the more onerous values used. Here, primary and secondary effects are calculated only for the long-term situation (the values are greater than those at opening) and where the total effects of shrinkage are advantageous, they are neglected.
The characteristic value of shrinkage strain is given on Sheet 3 as cd = 33.1 10−5 and the modular ratio is L = 15.4. (This is very close to the value for long-term effects generally and for determining the secondary effects, the one set of long-term properties will be used for both.)
For a fully restrained section, the restraint force and moment in the span girder, inner beam, due to the characteristic values of shrinkage strain are given by:
Centre of force Strain Force (kN) Below top Above NA
moment (kNm)
Slab –0.000331 –8049 125 329 –2647 –8049 –2647
The release of the restraint moments is applied along the span, in the uncracked regions, as a separate loadcase. Since the girder depth varies along the span, the value of the restraint moment will vary along the span. For simplicity, a uniform ‘average’ value has been applied to the model in this example.
4-2/5.4.2.2(8)
Hence the primary effects are:
Release of restraint W (steel units)
Restraint (cd Ecm) Bending (M/W) Axial (F/A) Total
Top of slab 1.22E+08 4.5 –1.4 –2.6 0.5 Bottom of slab 2.72E+08 4.5 –0.6 –2.6 1.3 Top of top flange 2.72E+08 0.0 –9.7 –40.0 –49.7 Bottom flange –5.56E+07 0.0 47.6 –40.0 7.6
(Area = 201391 mm2, steel units)
For the above calculation, section properties for the full width of slab are used.
P357 Composite Highway Bridge Design: Worked ExamplesC
reat
ed o
n 16
Apr
il 20
12T
his
mat
eria
l is
copy
right
- a
ll rig
hts
rese
rved
. Use
of t
his
docu
men
t is
subj
ect t
o th
e te
rms
and
cond
ition
s of
the
Ste
elbi
z Li
cenc
e A
gree
men
t

Job No. BCR113 Sheet 14 of 58 Rev A
Job Title Composite highway bridges: Worked examples
Subject Example 2: Ladder deck three-span bridge Section 5: Beam cross sections
Made by DCI Date July 2009
Silwood Park, Ascot, Berks SL5 7QN Telephone: (01344) 636525 Fax: (01344) 636570 CALCULATION SHEET
Client SCI
Checked by RJ Date Sep 2009
P357-example2-D07.doc 84 Printed 17/03/2010
Diagrammatically:
0
200
400
600
800
1000
1200
1400
1600
-60.0 -40.0 -20.0 0.0 20.0
5.3 Section properties - cross girders
The gross composite section of the cross girder includes half the width of slab to the adjacent cross girders.
For the effective composite section, taking account of shear lag, the cross girder is effectively simply supported and thus Le = 11700 mm and bei = 11700/8 = 1438 mm each side. Assume that there is only a single row of connectors on the beam centreline.
The effective section properties of the cross girder at midspan are:
Bare steel Short-term
comp Long- term
comp
Area A 27690 149600 71477 (mm2) Height of NA 448 915 799 (mm) Second moment of area Iy 3.603E+09 1.163E+10 9.404E+09 (mm4) Top of slab 3.021E+08 4.526E+08 Elastic modulus, centroid top flange
Wbf,y 8.273E+06 –3.692E+08 1.113E+08 (mm3)
Elastic modulus, centroid bottom flange
Wtf,y 8.273E+06 1.289E+07 1.196E+07 (mm3)
Section class 2 (bending) 1 (sagging) 1 (sagging) Plastic bending resistance Mpl 3207 6232 (sagging) kNm
Values of Mpl calculated using fy/M0 values for steel, 0.85fck/C for concrete.
z
1750 1750
896 at midspan
P357 Composite Highway Bridge Design: Worked ExamplesC
reat
ed o
n 16
Apr
il 20
12T
his
mat
eria
l is
copy
right
- a
ll rig
hts
rese
rved
. Use
of t
his
docu
men
t is
subj
ect t
o th
e te
rms
and
cond
ition
s of
the
Ste
elbi
z Li
cenc
e A
gree
men
t
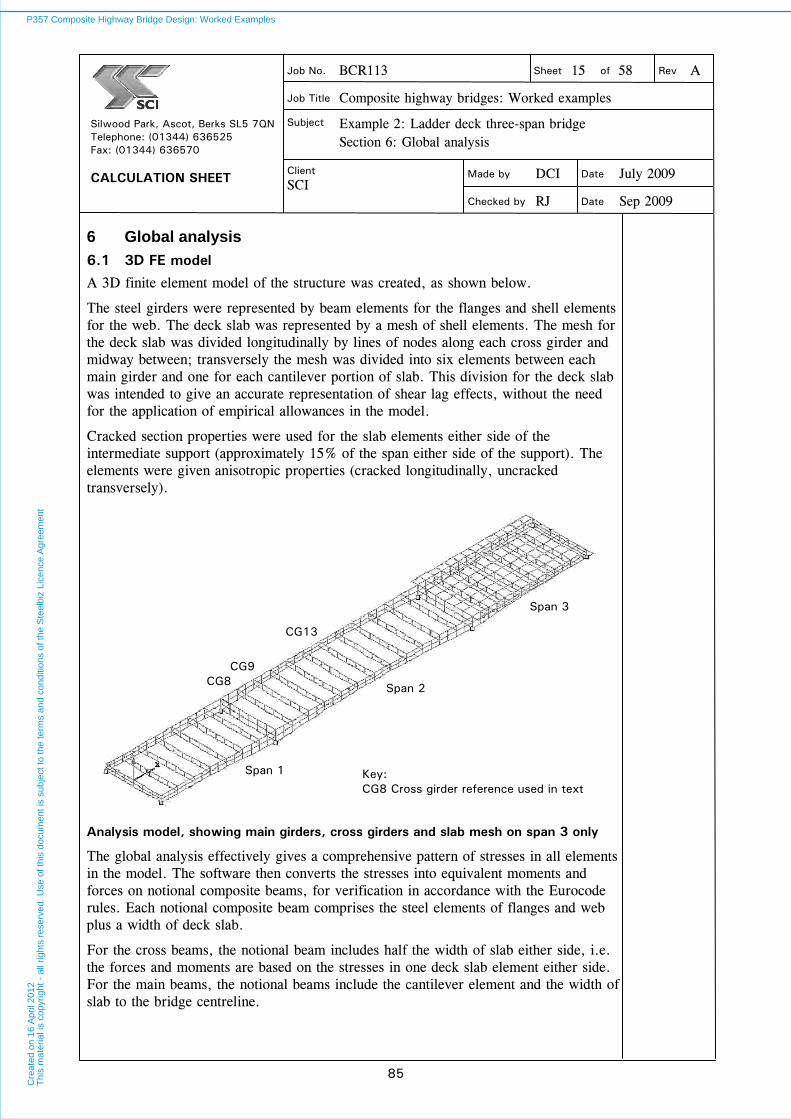
Job No. BCR113 Sheet 15 of 58 Rev A
Job Title Composite highway bridges: Worked examples
Subject Example 2: Ladder deck three-span bridge Section 6: Global analysis
Made by DCI Date July 2009
Silwood Park, Ascot, Berks SL5 7QN Telephone: (01344) 636525 Fax: (01344) 636570 CALCULATION SHEET
Client SCI
Checked by RJ Date Sep 2009
P357-example2-D07.doc 85 Printed 17/03/2010
6 Global analysis
6.1 3D FE model
A 3D finite element model of the structure was created, as shown below.
The steel girders were represented by beam elements for the flanges and shell elements for the web. The deck slab was represented by a mesh of shell elements. The mesh for the deck slab was divided longitudinally by lines of nodes along each cross girder and midway between; transversely the mesh was divided into six elements between each main girder and one for each cantilever portion of slab. This division for the deck slab was intended to give an accurate representation of shear lag effects, without the need for the application of empirical allowances in the model.
Cracked section properties were used for the slab elements either side of the intermediate support (approximately 15% of the span either side of the support). The elements were given anisotropic properties (cracked longitudinally, uncracked transversely).
Analysis model, showing main girders, cross girders and slab mesh on span 3 only
The global analysis effectively gives a comprehensive pattern of stresses in all elements in the model. The software then converts the stresses into equivalent moments and forces on notional composite beams, for verification in accordance with the Eurocode rules. Each notional composite beam comprises the steel elements of flanges and web plus a width of deck slab.
For the cross beams, the notional beam includes half the width of slab either side, i.e. the forces and moments are based on the stresses in one deck slab element either side. For the main beams, the notional beams include the cantilever element and the width of slab to the bridge centreline.
CG8 CG9
CG13
Key: CG8 Cross girder reference used in text
Span 1
Span 2
Span 3
P357 Composite Highway Bridge Design: Worked ExamplesC
reat
ed o
n 16
Apr
il 20
12T
his
mat
eria
l is
copy
right
- a
ll rig
hts
rese
rved
. Use
of t
his
docu
men
t is
subj
ect t
o th
e te
rms
and
cond
ition
s of
the
Ste
elbi
z Li
cenc
e A
gree
men
t
Job No. BCR113 Sheet 16 of 58 Rev A
Job Title Composite highway bridges: Worked examples
Subject Example 2: Ladder deck three-span bridge Section 6: Global analysis
Made by DCI Date July 2009
Silwood Park, Ascot, Berks SL5 7QN Telephone: (01344) 636525 Fax: (01344) 636570 CALCULATION SHEET
Client SCI
Checked by RJ Date Sep 2009
P357-example2-D07.doc 86 Printed 17/03/2010
Because shear lag effects are automatically accounted for in the global analysis model, the moments and forces per beam thus depend on the ‘actual’ shear lag rather than on any notional pattern of shear lag, such as that given by the rules in EN 1994-2.
The extracted effects on each main girder section (as defined above) were combinations of moment and axial force. The axial forces arise mainly as a result of the edge beam being modelled separately but also as a result of unequal loading on the two main girders (there is a small longitudinal shear across the bridge centreline when the loading is not symmetrical).
The application of the extracted moment plus axial force on the effective cross sections (allowing for shear lag) is a realistic combination of effects on those sections. The variation of axial force in the edge beam gives rise to (relatively small) additional longitudinal shear which can be taken into account in verifying the shear connection (see Section 10.1)
6.2 Construction stages
For simplicity, it is presumed that the deck will be concreted in three stages - the whole of span 1, followed by the whole of span 3, followed by the whole of span 2. The edge beams will be concreted after span 2. Separate analytical models are therefore provided for:
Stage 1 All steelwork, wet concrete in span 1 Stage 2 Composite structure in span 1 (long-term properties), wet concrete in span 3 Stage 3 Composite structure in spans 1 & 3, wet concrete in span 2 Stage 4 Composite structure in both spans (long-term properties) Stage 5 Composite structure (short term properties)
(For simplicity, the weight of the edge beams is applied to the stage 4 model, which includes the long-term properties of the edge beams, rather than introduce another model. The difference between the two approaches is negligible, in relation to the design of the main beams.)
A further model, a modification of Stage 3, without the wet slab, was analysed to determine the rotational stiffness of the beams at that stage.
6.3 Analysis results
The following results are for design values of actions, i.e. after application of appropriate partial factors on characteristic values of actions, except for the individual load cases for shrinkage and temperature difference (for which characteristic values are given).
For construction loading, results are given for the total effects at each of the construction stages. For traffic loading the results are given for the combination of traffic and pedestrian loading for worst bending effects at two locations - at an intermediate support and at the middle of the central span. For verification of buckling resistance adjacent to the intermediate support, additional results were extracted for coexistent effects at the position of the first cross girder in the central span.
P357 Composite Highway Bridge Design: Worked ExamplesC
reat
ed o
n 16
Apr
il 20
12T
his
mat
eria
l is
copy
right
- a
ll rig
hts
rese
rved
. Use
of t
his
docu
men
t is
subj
ect t
o th
e te
rms
and
cond
ition
s of
the
Ste
elbi
z Li
cenc
e A
gree
men
t

Job No. BCR113 Sheet 17 of 58 Rev A
Job Title Composite highway bridges: Worked examples
Subject Example 2: Ladder deck three-span bridge Section 6: Global analysis
Made by DCI Date July 2009
Silwood Park, Ascot, Berks SL5 7QN Telephone: (01344) 636525 Fax: (01344) 636570 CALCULATION SHEET
Client SCI
Checked by RJ Date Sep 2009
P357-example2-D07.doc 87 Printed 17/03/2010
Stage 1 Self weight of steelwork Self weight of concrete on span 1 Construction loads on span 1
ULS SLS Position My (kNm) Fx (kN) Fz (kN) My (kNm) Fx (kN) Fz (kN)
At pier –4432 4 311 –3476 3 255
At CG8 –3291 309 –2548 0 250
At CG13 121 82 161 0 61
Note: Fx is axial force, Fz is vertical shear
CG8 is the first intermediate cross girder on the main span side of the pier. CG13 is at midspan.
Stage 2 Self weight of concrete on span 3 Construction loads on span 3 Removal of construction loads on span 1
ULS SLS Position My (kNm) Fx (kN) Fz (kN) My (kNm) Fx (kN) Fz (kN) At pier 1307 –1 –77 968 –1 –57 At CG8 1004 –95 744 0 –70 At CG13 –584 –91 –433 0 –67
Stage 3 Self weight of concrete on span 2 Construction loads on span 2 Removal of construction loads on span 3
ULS SLS Position My (kNm) Fx (kN) Fz (kN) My (kNm) Fx (kN) Fz (kN) At pier –9374 48 1209 –6943 35 895 At CG8 –5267 38 1083 –3902 28 802 At CG13 4371 40 2 3237 30 2
Stage 4 Self weight of concrete edge beams Self weight of parapets Self weight of carriageway surfacing Self weight of footway construction Removal of construction loads on span 2
ULS SLS Position My (kNm) Fx (kN) Fz (kN) My (kNm) Fx (kN) Fz (kN)
At pier –6944 303 936 –5693 257 769
At CG8 –3825 227 828 –3130 195 681
At CG13 2904 –457 2388 –370 0
P357 Composite Highway Bridge Design: Worked ExamplesC
reat
ed o
n 16
Apr
il 20
12T
his
mat
eria
l is
copy
right
- a
ll rig
hts
rese
rved
. Use
of t
his
docu
men
t is
subj
ect t
o th
e te
rms
and
cond
ition
s of
the
Ste
elbi
z Li
cenc
e A
gree
men
t
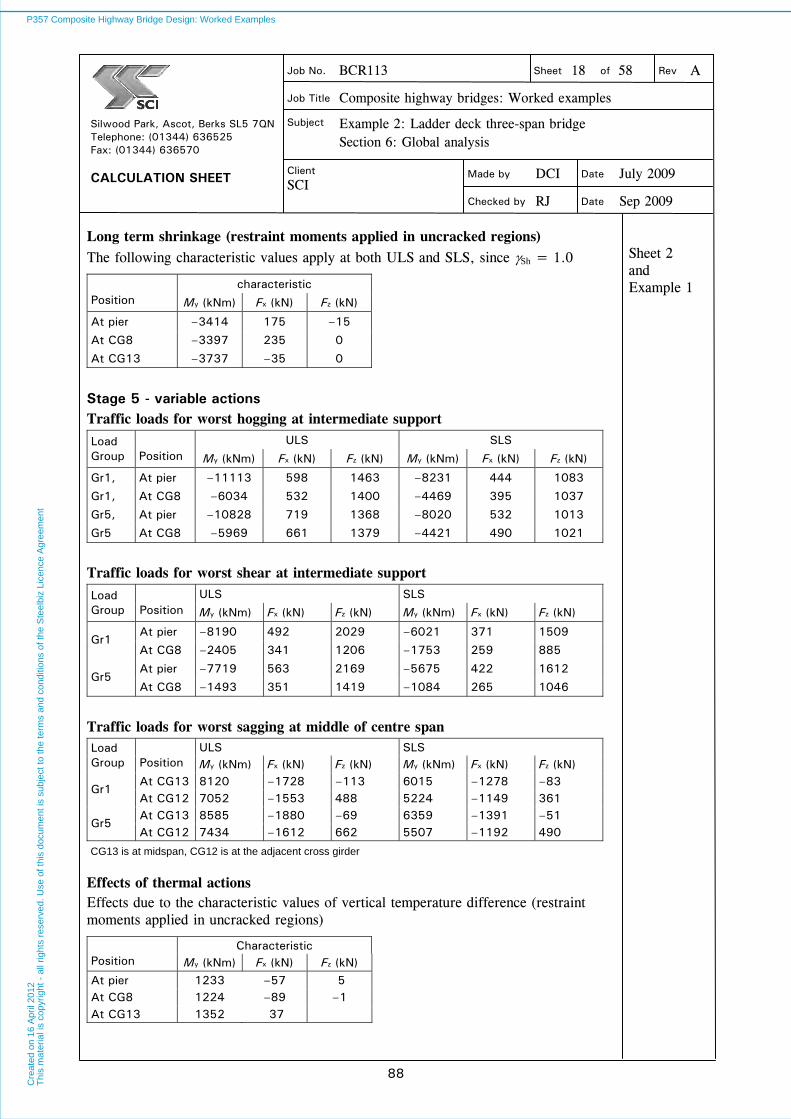
Job No. BCR113 Sheet 18 of 58 Rev A
Job Title Composite highway bridges: Worked examples
Subject Example 2: Ladder deck three-span bridge Section 6: Global analysis
Made by DCI Date July 2009
Silwood Park, Ascot, Berks SL5 7QN Telephone: (01344) 636525 Fax: (01344) 636570 CALCULATION SHEET
Client SCI
Checked by RJ Date Sep 2009
P357-example2-D07.doc 88 Printed 17/03/2010
Long term shrinkage (restraint moments applied in uncracked regions) The following characteristic values apply at both ULS and SLS, since Sh = 1.0
characteristic Position My (kNm) Fx (kN) Fz (kN)
At pier –3414 175 –15
At CG8 –3397 235 0
At CG13 –3737 –35 0
Sheet 2 and Example 1
Stage 5 - variable actions Traffic loads for worst hogging at intermediate support
ULS SLS Load Group Position My (kNm) Fx (kN) Fz (kN) My (kNm) Fx (kN) Fz (kN)
Gr1, At pier –11113 598 1463 –8231 444 1083
Gr1, At CG8 –6034 532 1400 –4469 395 1037
Gr5, At pier –10828 719 1368 –8020 532 1013
Gr5 At CG8 –5969 661 1379 –4421 490 1021
Traffic loads for worst shear at intermediate support ULS SLS Load
Group Position My (kNm) Fx (kN) Fz (kN) My (kNm) Fx (kN) Fz (kN)
At pier –8190 492 2029 –6021 371 1509 Gr1
At CG8 –2405 341 1206 –1753 259 885
At pier –7719 563 2169 –5675 422 1612 Gr5
At CG8 –1493 351 1419 –1084 265 1046
Traffic loads for worst sagging at middle of centre span ULS SLS Load
Group Position My (kNm) Fx (kN) Fz (kN) My (kNm) Fx (kN) Fz (kN) At CG13 8120 –1728 –113 6015 –1278 –83
Gr1 At CG12 7052 –1553 488 5224 –1149 361 At CG13 8585 –1880 –69 6359 –1391 –51
Gr5 At CG12 7434 –1612 662 5507 –1192 490
CG13 is at midspan, CG12 is at the adjacent cross girder
Effects of thermal actions Effects due to the characteristic values of vertical temperature difference (restraint moments applied in uncracked regions)
Characteristic Position My (kNm) Fx (kN) Fz (kN) At pier 1233 –57 5 At CG8 1224 –89 –1 At CG13 1352 37
P357 Composite Highway Bridge Design: Worked ExamplesC
reat
ed o
n 16
Apr
il 20
12T
his
mat
eria
l is
copy
right
- a
ll rig
hts
rese
rved
. Use
of t
his
docu
men
t is
subj
ect t
o th
e te
rms
and
cond
ition
s of
the
Ste
elbi
z Li
cenc
e A
gree
men
t
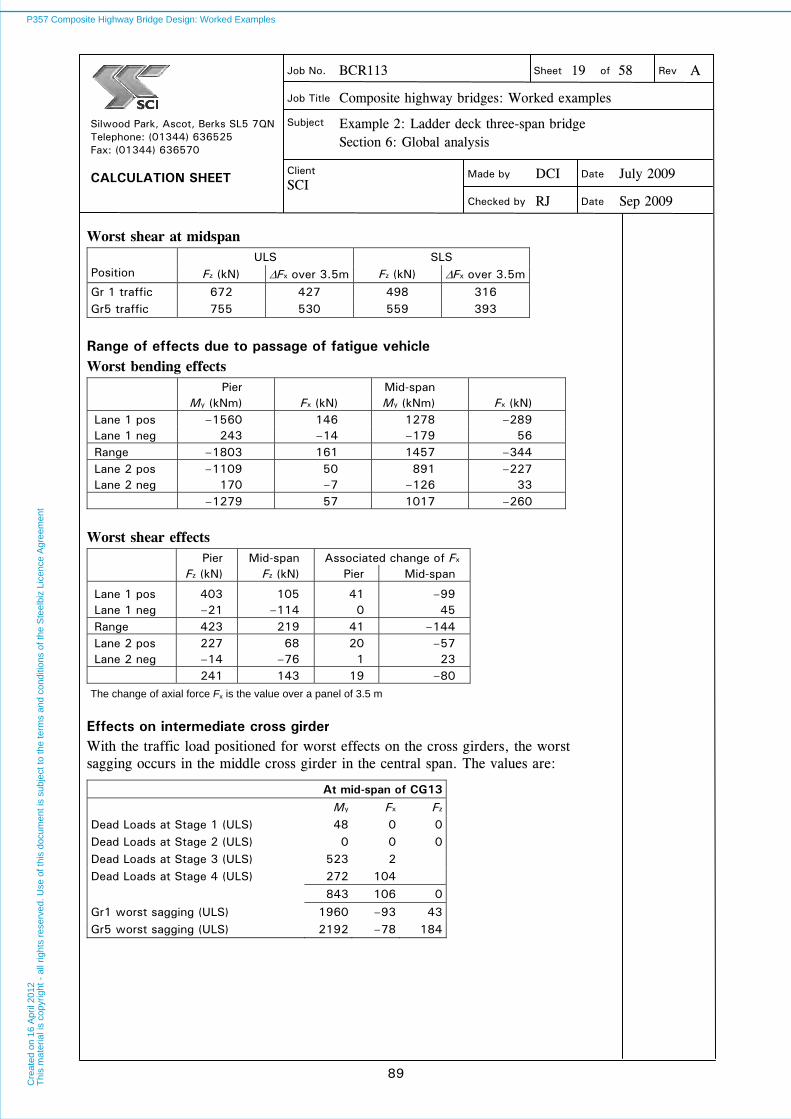
Job No. BCR113 Sheet 19 of 58 Rev A
Job Title Composite highway bridges: Worked examples
Subject Example 2: Ladder deck three-span bridge Section 6: Global analysis
Made by DCI Date July 2009
Silwood Park, Ascot, Berks SL5 7QN Telephone: (01344) 636525 Fax: (01344) 636570 CALCULATION SHEET
Client SCI
Checked by RJ Date Sep 2009
P357-example2-D07.doc 89 Printed 17/03/2010
Worst shear at midspan ULS SLS
Position Fz (kN) Fx over 3.5m Fz (kN) Fx over 3.5m Gr 1 traffic 672 427 498 316 Gr5 traffic 755 530 559 393
Range of effects due to passage of fatigue vehicle Worst bending effects Pier Mid-span My (kNm) Fx (kN) My (kNm) Fx (kN) Lane 1 pos –1560 146 1278 –289 Lane 1 neg 243 –14 –179 56 Range –1803 161 1457 –344 Lane 2 pos –1109 50 891 –227 Lane 2 neg 170 –7 –126 33 –1279 57 1017 –260
Worst shear effects Pier Mid-span Associated change of Fx Fz (kN) Fz (kN) Pier Mid-span
Lane 1 pos 403 105 41 –99 Lane 1 neg –21 –114 0 45 Range 423 219 41 –144 Lane 2 pos 227 68 20 –57 Lane 2 neg –14 –76 1 23 241 143 19 –80
The change of axial force Fx is the value over a panel of 3.5 m
Effects on intermediate cross girder With the traffic load positioned for worst effects on the cross girders, the worst sagging occurs in the middle cross girder in the central span. The values are:
At mid-span of CG13 My Fx Fz Dead Loads at Stage 1 (ULS) 48 0 0 Dead Loads at Stage 2 (ULS) 0 0 0 Dead Loads at Stage 3 (ULS) 523 2 Dead Loads at Stage 4 (ULS) 272 104 843 106 0
Gr1 worst sagging (ULS) 1960 –93 43 Gr5 worst sagging (ULS) 2192 –78 184
P357 Composite Highway Bridge Design: Worked ExamplesC
reat
ed o
n 16
Apr
il 20
12T
his
mat
eria
l is
copy
right
- a
ll rig
hts
rese
rved
. Use
of t
his
docu
men
t is
subj
ect t
o th
e te
rms
and
cond
ition
s of
the
Ste
elbi
z Li
cenc
e A
gree
men
t

Job No. BCR113 Sheet 20 of 58 Rev A
Job Title Composite highway bridges: Worked examples
Subject Example 2: Ladder deck three-span bridge Section 6: Global analysis
Made by DCI Date July 2009
Silwood Park, Ascot, Berks SL5 7QN Telephone: (01344) 636525 Fax: (01344) 636570 CALCULATION SHEET
Client SCI
Checked by RJ Date Sep 2009
P357-example2-D07.doc 90 Printed 17/03/2010
For consideration of the effects on the bolted end connection, the values at the first and second cross girders adjacent to the pier and the middle cross girder are:
CG8 CG9 CG13
My Fx Fz My Fx Fz My Fx Fz
Stage 1 –19 10 16 –10 7 15 0 0 16
Stage 2 –1 –4 0 0 1 0 0 0 0
Stage 3 –86 40 180 –27 11 180 –17 1 180
Stage 4 –106 29 99 –91 29 113 –68 –26 108
Construction –212 75 295 –128 48 308 –85 –25 304
Gr1 traffic (for max shear) –436 49 901 –281 –24 843 –201 –187 806
Gr5 traffic(for max shear) –447 94 933 –276 –22 879 –184 –239 859
Total (gr5) –659 169 1228 –404 26 308 –269 –264 1163
P357 Composite Highway Bridge Design: Worked ExamplesC
reat
ed o
n 16
Apr
il 20
12T
his
mat
eria
l is
copy
right
- a
ll rig
hts
rese
rved
. Use
of t
his
docu
men
t is
subj
ect t
o th
e te
rms
and
cond
ition
s of
the
Ste
elbi
z Li
cenc
e A
gree
men
t

Job No. BCR113 Sheet 21 of 58 Rev A
Job Title Composite highway bridges: Worked examples
Subject Example 2: Ladder deck three-span bridge Section 7: Design values of the effects of combined actions
Made by DCI Date July 2009
Silwood Park, Ascot, Berks SL5 7QN Telephone: (01344) 636525 Fax: (01344) 636570 CALCULATION SHEET
Client SCI
Checked by RJ Date Sep 2009
P357-example2-D07.doc 91 Printed 17/03/2010
7 Design values of the effects of combined actions
Design values of effects are given below for certain design situations for parts of the central span. In practice, further situations for other parts of the structure would also need to be considered.
7.1 Effects of construction loads (ULS)
Generally, the effects of construction loads apply to different cross section properties, as construction progresses. For the pier girder, on the main span side, the effects are on the bare steel section for stages 1, 2 and 3; long term effects are on the effective cracked composite section. For the section at the middle of the central span, effects at stages 1, 2 and 3 are on the bare steel gross section and stage 4 effects on the long-term composite section.
Stresses at pier (main span side) Bottom flange Top flange Top rebar Axial
My Fx Fz W
(106 mm3) σ W
(106 mm3) σ W
(106 mm3) σ A
(103 mm2) σ Stage 1 –4432 4 311 115.2 –38 102.0 43 105 0 Stage 2 1307 –1 –77 115.2 11 102.0 –13 105 0 Stage 3 –9374 48 1209 115.2 –81 102.0 92 105 0 Stage 4 –6944 303 936 119.7 –58 139.1 50 112.9 62 121 –3 Shrinkage (sh = 1)
–3414 176 –15 119.7 –29 139.1 25 112.9 30 121 –1
–22857 530 2364 –195 197 92 –4
Using steel and cracked section properties
Stress at CG8 (pier girder, cracked section) Bottom flange Top flange Top rebar Axial
My Fx Fz W
(106 mm3) σ W
(106 mm3) σ W
(106 mm3) σ A
(103 mm2) σ Stage 1 –3291 0 309 96.9 –34 85.3 39 105 0 Stage 2 1004 0 –95 96.9 10 85.3 –12 105 0 Stage 3 –5267 38 1083 96.9 –54 85.3 62 105 0 Stage 4 –3825 227 828 103.1 –37 123.4 31 96.8 40 123 –2 Shrinkage (sh = 1) –3397 235 0 103.1 –33 123.4 28 96.8 35 123 –2 –14776 500 2125 –148 148 75 –4
Using steel and cracked section properties
Stress at mid-span (span girder) Bottom flange Top flange Top rebar Axial
My Fx Fz W (106 mm3) σ W
(106 mm3) σ W (106 mm3) σ A
(103 mm2) σ
Stage 1 121 0 82 48.0 3 39.9 –3 85.3 0 Stage 2 –584 0 –91 48.0 –12 39.9 15 85.3 0 Stage 3 4371 40 2 48.0 91 39.9 –110 85.3 0 Stage 4 2904 –457 0 56.1 52 194.9 –15 1590 –1.8 164 3 Shrinkage (sh = 1)
(not adverse)
6812 –417 –7 134 –113 –1.8 3
Using steel and long term section properties
P357 Composite Highway Bridge Design: Worked ExamplesC
reat
ed o
n 16
Apr
il 20
12T
his
mat
eria
l is
copy
right
- a
ll rig
hts
rese
rved
. Use
of t
his
docu
men
t is
subj
ect t
o th
e te
rms
and
cond
ition
s of
the
Ste
elbi
z Li
cenc
e A
gree
men
t
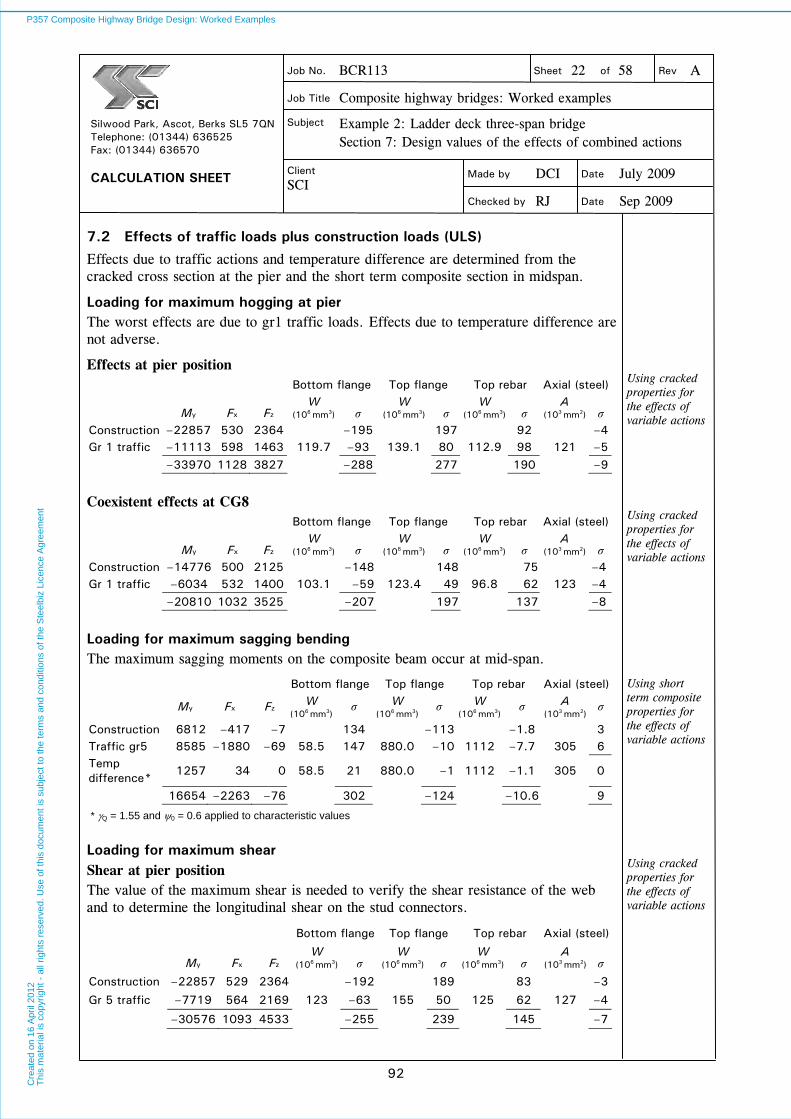
Job No. BCR113 Sheet 22 of 58 Rev A
Job Title Composite highway bridges: Worked examples
Subject Example 2: Ladder deck three-span bridge Section 7: Design values of the effects of combined actions
Made by DCI Date July 2009
Silwood Park, Ascot, Berks SL5 7QN Telephone: (01344) 636525 Fax: (01344) 636570 CALCULATION SHEET
Client SCI
Checked by RJ Date Sep 2009
P357-example2-D07.doc 92 Printed 17/03/2010
7.2 Effects of traffic loads plus construction loads (ULS)
Effects due to traffic actions and temperature difference are determined from the cracked cross section at the pier and the short term composite section in midspan.
Loading for maximum hogging at pier The worst effects are due to gr1 traffic loads. Effects due to temperature difference are not adverse.
Effects at pier position Bottom flange Top flange Top rebar Axial (steel)
My Fx Fz W
(106 mm3) σ W
(106 mm3) σ W
(106 mm3) σ A
(103 mm2) σ Construction –22857 530 2364 –195 197 92 –4 Gr 1 traffic –11113 598 1463 119.7 –93 139.1 80 112.9 98 121 –5 –33970 1128 3827 –288 277 190 –9
Using cracked properties for the effects of variable actions
Coexistent effects at CG8 Bottom flange Top flange Top rebar Axial (steel)
My Fx Fz W
(106 mm3) σ W
(106 mm3) σ W
(106 mm3) σ A
(103 mm2) σ Construction –14776 500 2125 –148 148 75 –4 Gr 1 traffic –6034 532 1400 103.1 –59 123.4 49 96.8 62 123 –4 –20810 1032 3525 –207 197 137 –8
Using cracked properties for the effects of variable actions
Loading for maximum sagging bending The maximum sagging moments on the composite beam occur at mid-span.
Bottom flange Top flange Top rebar Axial (steel)
My Fx Fz W (106 mm3) σ W
(106 mm3) σ W (106 mm3) σ A
(103 mm2) σ
Construction 6812 –417 –7 134 –113 –1.8 3 Traffic gr5 8585 –1880 –69 58.5 147 880.0 –10 1112 –7.7 305 6 Temp difference*
1257 34 0 58.5 21 880.0 –1 1112 –1.1 305 0
16654 –2263 –76 302 –124 –10.6 9
* Q = 1.55 and 0 = 0.6 applied to characteristic values
Using short term composite properties for the effects of variable actions
Loading for maximum shear Shear at pier position The value of the maximum shear is needed to verify the shear resistance of the web and to determine the longitudinal shear on the stud connectors.
Bottom flange Top flange Top rebar Axial (steel)
My Fx Fz W
(106 mm3) σ W
(106 mm3) σ W
(106 mm3) σ A
(103 mm2) σ
Construction –22857 529 2364 –192 189 83 –3
Gr 5 traffic –7719 564 2169 123 –63 155 50 125 62 127 –4
–30576 1093 4533 –255 239 145 –7
Using cracked properties for the effects of variable actions
P357 Composite Highway Bridge Design: Worked ExamplesC
reat
ed o
n 16
Apr
il 20
12T
his
mat
eria
l is
copy
right
- a
ll rig
hts
rese
rved
. Use
of t
his
docu
men
t is
subj
ect t
o th
e te
rms
and
cond
ition
s of
the
Ste
elbi
z Li
cenc
e A
gree
men
t

Job No. BCR113 Sheet 23 of 58 Rev A
Job Title Composite highway bridges: Worked examples
Subject Example 2: Ladder deck three-span bridge Section 7: Design values of the effects of combined actions
Made by DCI Date July 2009
Silwood Park, Ascot, Berks SL5 7QN Telephone: (01344) 636525 Fax: (01344) 636570 CALCULATION SHEET
Client SCI
Checked by RJ Date Sep 2009
P357-example2-D07.doc 93 Printed 17/03/2010
7.3 Effects of traffic loads plus construction loads (SLS)
The values of effects at SLS are needed to verify crack control in the slab at the pier.
Effects at pier position Bottom flange Top flange Top rebar Axial (steel)
My Fx Fz W
(106 mm3) σ W
(106 mm3) σ W
(106 mm3) σ A
(103 mm2) σ
Stage 1 –3476 3 255 115.2 –30 102.0 34 105 0
Stage 2 968 –1 –57 115.2 8 102.0 –9 127 0
Stage 3 –6943 35 895 115.2 –60 102.0 68 127 0
Stage 4 –5693 257 769 119.7 –48 139.1 41 112.9 50 121 –2
Shrinkage –3414 175 –15 119.7 –29 139.1 25 112.9 30 121 –1
Gr 1 traffic –8231 444 1083 119.7 –69 139.1 59 112.9 73 121 –4
–26789 913 2930 –228 218 153 –7
Using steel and cracked section properties
Effects at midspan
The values at midspan would be required if the ULS effects exceeded the elastic resistance but, by inspection, the stresses at ULS are less than the elastic design values.
7.4 Effects due to fatigue vehicle
The range of bending effects due to the passage of the fatigue vehicle in each lane is determined at the two locations already considered for static loading.
At pier Bottom flange Top flange Top rebar Axial(steel)
My Fx Fz W
(106 mm3) σ W
(106 mm3) σ
W (106 mm3
) σ A
(103 mm2) σ
Range, lane 1 –1803 161 226 121.5 –14.8 138.9 13.0 112.9 16.0 145.2 –1.1
Range, lane 2 –1279 –7 121.5 –10.5 138.9 9.2 112.9 11.3 145.2 0.0
Ratio lane 2/lane 1 moments = 0.709
At mid-span Bottom flange Top flange Top of slab Axial(steel)
My Fx Fz W
(106 mm3) σ W
(106 mm3) σ W
(106 mm3) σ A
(103 mm2) σ
Range, lane 1 1457 –344 –9 58.5 24.9 880.0 –1.7 1112.0 –1.3 305.1 1.1
Range, lane 2 1017 –260 –13 58.5 17.4 880.0 –1.2 1112.0 –0.9 305.1 0.9
Ratio lane 2/lane 1 moments = 0.698
P357 Composite Highway Bridge Design: Worked ExamplesC
reat
ed o
n 16
Apr
il 20
12T
his
mat
eria
l is
copy
right
- a
ll rig
hts
rese
rved
. Use
of t
his
docu
men
t is
subj
ect t
o th
e te
rms
and
cond
ition
s of
the
Ste
elbi
z Li
cenc
e A
gree
men
t

Job No. BCR113 Sheet 24 of 58 Rev A
Job Title Composite highway bridges: Worked examples
Subject Example 2: Ladder deck three-span bridge Section 7: Design values of the effects of combined actions
Made by DCI Date July 2009
Silwood Park, Ascot, Berks SL5 7QN Telephone: (01344) 636525 Fax: (01344) 636570 CALCULATION SHEET
Client SCI
Checked by RJ Date Sep 2009
P357-example2-D07.doc 94 Printed 17/03/2010
Maximum and minimum effects (for max/min stresses in reinforcement at pier)
Bottom flange Top flange Top rebar Axial(steel)
My Fx Fz W
(106 mm3) σ W
(106 mm3) σ W
(106 mm3) σ A
(103 mm2) σ
Max effect –1560 146 205 121.5 –12.8 138.9 11.2 112.9 13.8 145.2 –1.0
min effect 243 –14 –21 121.5 2.0 138.9 –1.7 112.9 –2.2 145.2 0.1
7.5 Effects in intermediate cross girders
The worst sagging under traffic actions occurs in the central cross girder.
Worst sagging on cross girder (ULS) The following stresses are elastic stresses on the effective cross section (allowing for shear lag)
Bottom flange Top flange Top of slab Axial (steel)
My Fx Fz W
(106 mm3) σ W
(106 mm3) σ W
(106 mm3) σ A
(103 mm2) σ
Stage 1 48 0 0 8.27 6 8.27 –6 27.7 0
Stage 2 0 0 0 8.27 0 8.27 0 27.7 0
Stage 3 523 2 0 8.27 63 8.27 –63 27.7 0
Stage 4 272 104 0 11.96 23 111 –2 453 –0.6 71.5 –1
Construction 843 106 0 92 –71 –0.6 –1
Gr1 traffic 1960 –93 43 12.89 152 –369 5 302 –6.5 150 1
Gr5 traffic 2192 –78 184 12.89 170 –369 6 302 –7.3 150 1
Total (gr5) 3035 28 184 262 –65 –7.9 0
Values for SLS would be needed if the total stresses exceeded the design elastic values but, by inspection, they are not exceeded.
P357 Composite Highway Bridge Design: Worked ExamplesC
reat
ed o
n 16
Apr
il 20
12T
his
mat
eria
l is
copy
right
- a
ll rig
hts
rese
rved
. Use
of t
his
docu
men
t is
subj
ect t
o th
e te
rms
and
cond
ition
s of
the
Ste
elbi
z Li
cenc
e A
gree
men
t
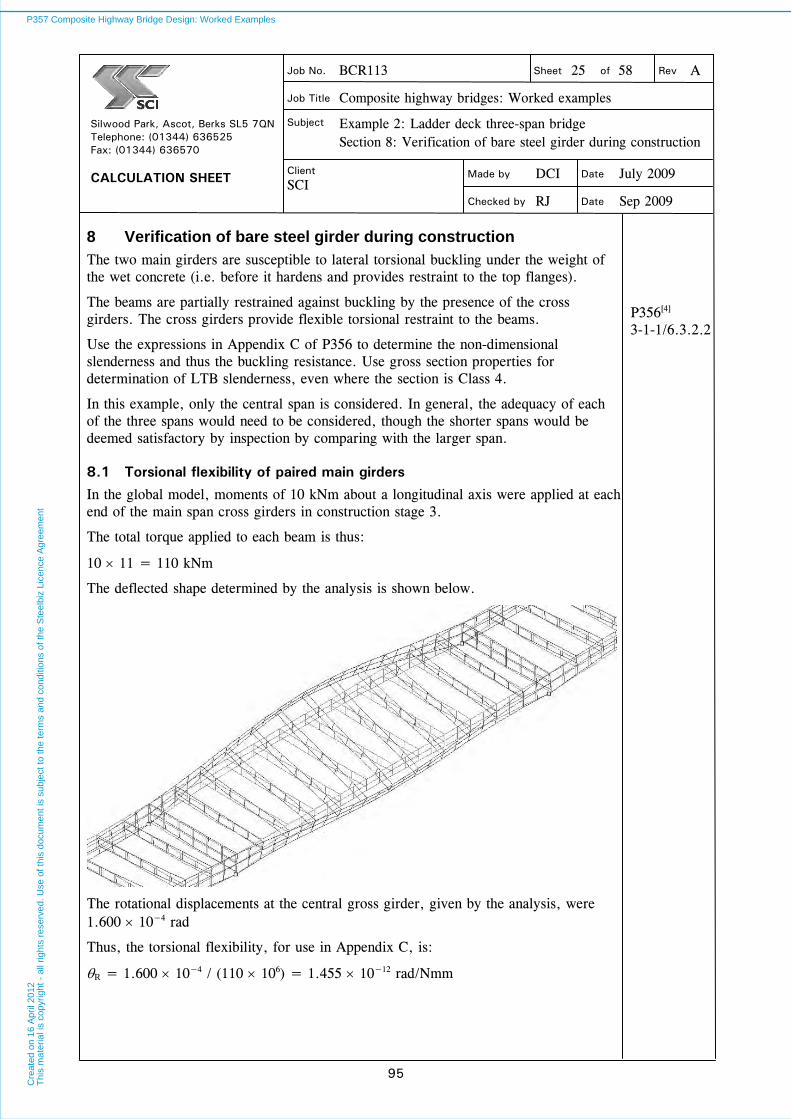
Job No. BCR113 Sheet 25 of 58 Rev A
Job Title Composite highway bridges: Worked examples
Subject Example 2: Ladder deck three-span bridge Section 8: Verification of bare steel girder during construction
Made by DCI Date July 2009
Silwood Park, Ascot, Berks SL5 7QN Telephone: (01344) 636525 Fax: (01344) 636570 CALCULATION SHEET
Client SCI
Checked by RJ Date Sep 2009
P357-example2-D07.doc 95 Printed 17/03/2010
8 Verification of bare steel girder during construction
The two main girders are susceptible to lateral torsional buckling under the weight of the wet concrete (i.e. before it hardens and provides restraint to the top flanges).
The beams are partially restrained against buckling by the presence of the cross girders. The cross girders provide flexible torsional restraint to the beams.
Use the expressions in Appendix C of P356 to determine the non-dimensional slenderness and thus the buckling resistance. Use gross section properties for determination of LTB slenderness, even where the section is Class 4.
P356[ 4] 3-1-1/6.3.2.2
In this example, only the central span is considered. In general, the adequacy of each of the three spans would need to be considered, though the shorter spans would be deemed satisfactory by inspection by comparing with the larger span.
8.1 Torsional flexibility of paired main girders
In the global model, moments of 10 kNm about a longitudinal axis were applied at each end of the main span cross girders in construction stage 3.
The total torque applied to each beam is thus:
10 11 = 110 kNm
The deflected shape determined by the analysis is shown below.
The rotational displacements at the central gross girder, given by the analysis, were 1.600 10−4 rad
Thus, the torsional flexibility, for use in Appendix C, is:
R = 1.600 10−4 / (110 106) = 1.455 10−12 rad/Nmm
P357 Composite Highway Bridge Design: Worked ExamplesC
reat
ed o
n 16
Apr
il 20
12T
his
mat
eria
l is
copy
right
- a
ll rig
hts
rese
rved
. Use
of t
his
docu
men
t is
subj
ect t
o th
e te
rms
and
cond
ition
s of
the
Ste
elbi
z Li
cenc
e A
gree
men
t

Job No. BCR113 Sheet 26 of 58 Rev A
Job Title Composite highway bridges: Worked examples
Subject Example 2: Ladder deck three-span bridge Section 8: Verification of bare steel girder during construction
Made by DCI Date July 2009
Silwood Park, Ascot, Berks SL5 7QN Telephone: (01344) 636525 Fax: (01344) 636570 CALCULATION SHEET
Client SCI
Checked by RJ Date Sep 2009
P357-example2-D07.doc 96 Printed 17/03/2010
8.2 Evaluation of non-dimensional slenderness - main girders
Geometrical parameters: Lw = 42000 mm and for the cross section at mid-span, the section properties are: Iz,c = 1.707 109 Iz,t = 2.133 109 IT = 5.104 107 iz = 212.1 mm h = 1200 mm tf = 45 mm df = 1155 mm
ht
i
L =
z
fwF = 43.7
120045
1.21242000
P356/C.4.3 and C.3.2
44.0133.2707.1
707.1
tz,cz,
cz,
I + I
I = a
aa 128.0 = 0.8 (2 0.44 − 1) = −0.12
To determine Veq, the following are needed:
= 214 aaa = 4 0.44 (1−0.44) +0.122 = 1.0
= 2wT
z2f
2
LGI
EIdπ =
27
922
4200010 5.104
6.21084.31155
π
= 1.460 (using E/G = 2.6) P356/C.4.5
Thus:
Veq = 25.0
24
2
a
a =
25.0
2046.14
46.144.02
= 0.719
Thus the stiffness parameter Veq4Lw
3/[EIz,cRdf2(1a)]= 50800
And using the expression
25,0
R2
fcz,4
34eq
11
aθdEI
LV k
w
π
The value of k = 0.209
The limiting (minimum) value of k is (1.7 - 0.7Veq)Lr/Lw
Taking Lr = 3500, the limit is:
(1.7 −0.7 0.719) 3500/42000 = 0.100, so use k = 0.209
P357 Composite Highway Bridge Design: Worked ExamplesC
reat
ed o
n 16
Apr
il 20
12T
his
mat
eria
l is
copy
right
- a
ll rig
hts
rese
rved
. Use
of t
his
docu
men
t is
subj
ect t
o th
e te
rms
and
cond
ition
s of
the
Ste
elbi
z Li
cenc
e A
gree
men
t
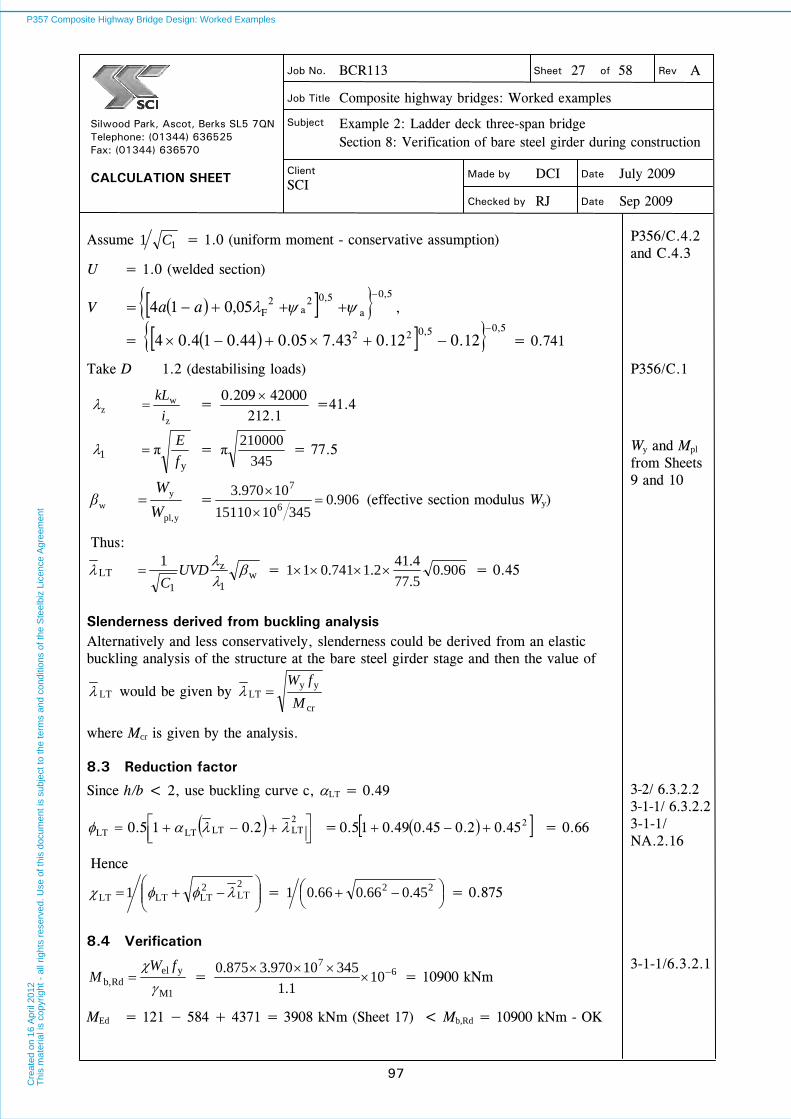
Job No. BCR113 Sheet 27 of 58 Rev A
Job Title Composite highway bridges: Worked examples
Subject Example 2: Ladder deck three-span bridge Section 8: Verification of bare steel girder during construction
Made by DCI Date July 2009
Silwood Park, Ascot, Berks SL5 7QN Telephone: (01344) 636525 Fax: (01344) 636570 CALCULATION SHEET
Client SCI
Checked by RJ Date Sep 2009
P357-example2-D07.doc 97 Printed 17/03/2010
Assume 11 C = 1.0 (uniform moment - conservative assumption)
U = 1.0 (welded section)
V = 5,0
a
5,02a
2F05,014
aa ,
= 5,05,022 12.012.043.705.044.014.04
= 0.741
P356/C.4.2 and C.4.3
Take D 1.2 (destabilising loads) P356/C.1
z
wz i
kL =
1.21242000209.0
=41.4
y1 π
f
E =
345
210000π = 77.5
ypl,
yw W
Wβ = 906.0
3451015110
10 3.9706
7
(effective section modulus Wy)
Wy and Mpl from Sheets 9 and 10
Thus:
w1
z
1LT
1 UVD
C = 906.0
5.77
4.412.1741.011 = 0.45
Slenderness derived from buckling analysis Alternatively and less conservatively, slenderness could be derived from an elastic buckling analysis of the structure at the bare steel girder stage and then the value of
LT would be given by cr
yyLT
M
fW
where Mcr is given by the analysis.
8.3 Reduction factor
Since h/b < 2, use buckling curve c, LT = 0.49
2LTLTLTLT 2.015.0 = 245.02.045.049.015.0 = 0.66
3-2/ 6.3.2.2 3-1-1/ 6.3.2.2 3-1-1/ NA.2.16
Hence
2LT
2LTLTLT 1 =
22 45.066.066.01 = 0.875
8.4 Verification
1M
yelRdb,
fWM = 6
7
101.1
34510970.3875.0
= 10900 kNm 3-1-1/6.3.2.1
MEd = 121 − 584 + 4371 = 3908 kNm (Sheet 17) < Mb,Rd = 10900 kNm - OK
P357 Composite Highway Bridge Design: Worked ExamplesC
reat
ed o
n 16
Apr
il 20
12T
his
mat
eria
l is
copy
right
- a
ll rig
hts
rese
rved
. Use
of t
his
docu
men
t is
subj
ect t
o th
e te
rms
and
cond
ition
s of
the
Ste
elbi
z Li
cenc
e A
gree
men
t
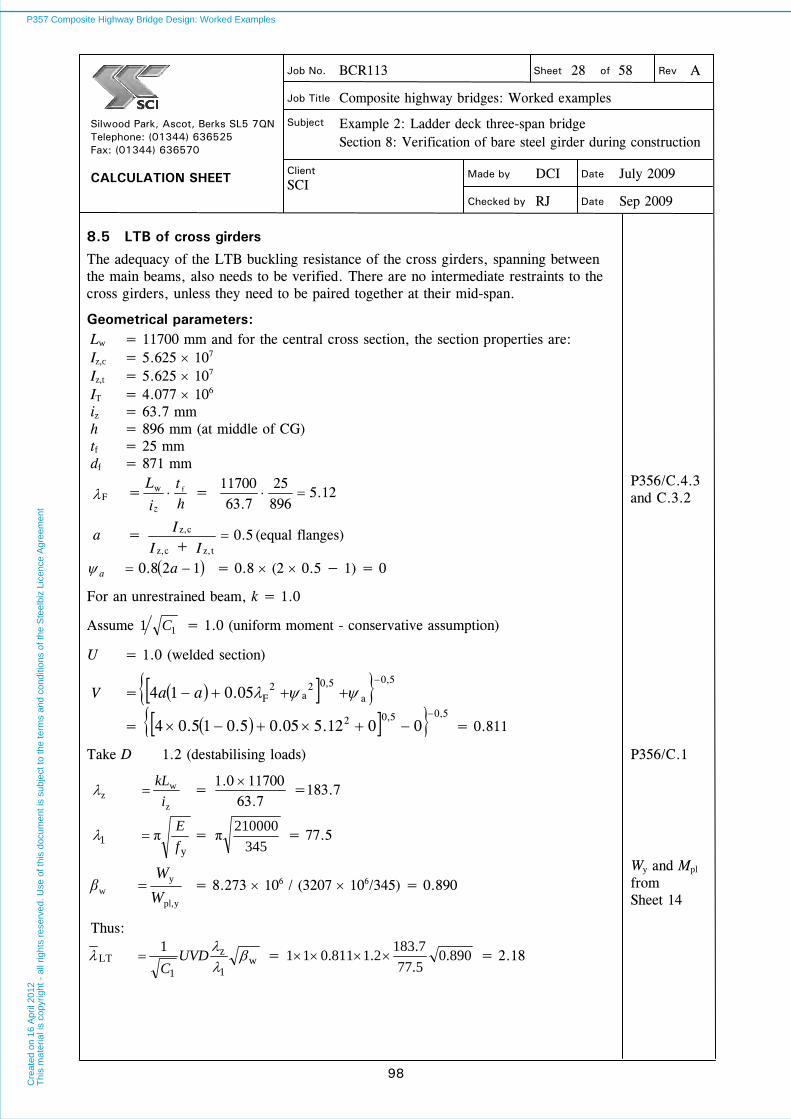
Job No. BCR113 Sheet 28 of 58 Rev A
Job Title Composite highway bridges: Worked examples
Subject Example 2: Ladder deck three-span bridge Section 8: Verification of bare steel girder during construction
Made by DCI Date July 2009
Silwood Park, Ascot, Berks SL5 7QN Telephone: (01344) 636525 Fax: (01344) 636570 CALCULATION SHEET
Client SCI
Checked by RJ Date Sep 2009
P357-example2-D07.doc 98 Printed 17/03/2010
8.5 LTB of cross girders
The adequacy of the LTB buckling resistance of the cross girders, spanning between the main beams, also needs to be verified. There are no intermediate restraints to the cross girders, unless they need to be paired together at their mid-span.
Geometrical parameters: Lw = 11700 mm and for the central cross section, the section properties are: Iz,c = 5.625 107 Iz,t = 5.625 107 IT = 4.077 106 iz = 63.7 mm h = 896 mm (at middle of CG) tf = 25 mm df = 871 mm
ht
i
L =
z
fwF = 12.5
89625
7.6311700
P356/C.4.3 and C.3.2
5.0tz,cz,
cz, I + I
I = a (equal flanges)
aa 128.0 = 0.8 (2 0.5 − 1) = 0
For an unrestrained beam, k = 1.0
Assume 11 C = 1.0 (uniform moment - conservative assumption)
U = 1.0 (welded section)
V = 5,0
a
5,02a
2F05.014
aa
= 5,05,02 0012.505.05.015.04
= 0.811
Take D 1.2 (destabilising loads) P356/C.1
z
wz i
kL =
7.63117000.1
=183.7
y1 π
f
E =
345
210000π = 77.5
ypl,
yw W
Wβ = 8.273 106 / (3207 106/345) = 0.890
Wy and Mpl from Sheet 14
Thus:
w1
z
1LT
1 UVD
C = 890.0
5.77
7.1832.1811.011 = 2.18
P357 Composite Highway Bridge Design: Worked ExamplesC
reat
ed o
n 16
Apr
il 20
12T
his
mat
eria
l is
copy
right
- a
ll rig
hts
rese
rved
. Use
of t
his
docu
men
t is
subj
ect t
o th
e te
rms
and
cond
ition
s of
the
Ste
elbi
z Li
cenc
e A
gree
men
t
Job No. BCR113 Sheet 29 of 58 Rev A
Job Title Composite highway bridges: Worked examples
Subject Example 2: Ladder deck three-span bridge Section 8: Verification of bare steel girder during construction
Made by DCI Date July 2009
Silwood Park, Ascot, Berks SL5 7QN Telephone: (01344) 636525 Fax: (01344) 636570 CALCULATION SHEET
Client SCI
Checked by RJ Date Sep 2009
P357-example2-D07.doc 99 Printed 17/03/2010
8.6 Reduction factor
Since h/b > 2, use buckling curve d, LT = 0.76
2LTLTLTLT 2.015.0 = 218.22.018.276.015.0 = 3.63
3-2/ 6.3.2.2 3-1-1/ 6.3.2.2 3-1-1/ NA.2.16
Hence
2LT
2LTLTLT 1 =
22 18.263.363.31 = 0.153
8.7 Verification
1M
yelRdb,
fWM = 6
6
101.1
34510273.8153.0
= 397 kNm 3-1-1/6.3.2.1
MEd = 48 + 523 = 571 kNm (Sheet 19) > Mb,Rd = 397 kNm - Not satisfactory
Consider pairing the cross girders together with channel bracing at their mid-span. This is then classed as a beam with a central torsional restraint.
8.8 Verification for paired cross girders
From global analysis, it is determined that the torsional flexibility of the central restraint is R = 4.73 10−11 rad/Nmm
Using the same values of F and a as before, the value of Veq is needed to calculate k.
For a bi-symmetric section, the value of Veq may be taken as equal to V. P356/C.4.6
Thus:
Veq = 0.811
Then the stiffness parameter Veq4Lw
3/[EIz,cRdf2(1a)]= 3270 and thus k = 0.494
Consider whether the cross girder would then buckle into two half waves, which is indicated by the value of the ‘arrow’ on the appropriate central restraint curve (see Figure C.1 in P356)
The value of k at the position of the arrow is given by:
25.0
2
2
π414
π1
k
P356/C.4.5
Where 999.0for1
eq4eq
2
4eq
VV
V
π
42
4
811.01
811.0
π
= 0.07725 and thus 25.0
2
2
07725.0414
07725.01
π
πk = 0.574
P357 Composite Highway Bridge Design: Worked ExamplesC
reat
ed o
n 16
Apr
il 20
12T
his
mat
eria
l is
copy
right
- a
ll rig
hts
rese
rved
. Use
of t
his
docu
men
t is
subj
ect t
o th
e te
rms
and
cond
ition
s of
the
Ste
elbi
z Li
cenc
e A
gree
men
t

Job No. BCR113 Sheet 30 of 58 Rev A
Job Title Composite highway bridges: Worked examples
Subject Example 2: Ladder deck three-span bridge Section 8: Verification of bare steel girder during construction
Made by DCI Date July 2009
Silwood Park, Ascot, Berks SL5 7QN Telephone: (01344) 636525 Fax: (01344) 636570 CALCULATION SHEET
Client SCI
Checked by RJ Date Sep 2009
P357-example2-D07.doc 100 Printed 17/03/2010
Thus, since the value of k given by the stiffness parameter and the central restraint curve is less than the value of k at the position of the arrow on that curve, it is to the right of the arrow and the cross girder will buckle in two half waves.
(Note: Detailed evaluation of the expressions in P356 for this case show that the arrow is at a stiffness parameter of about 570.)
Curve for central torsional restraint
0.40
0.50
0.60
0.70
0.80
0.90
1.00
0 500 1000 1500 2000 2500
veq 0.811
For two half waves (node at central restraint):
F = 2.56 (half the previous value) and thus
V = 5,05,02 0056.205.05.015.04
= 0.932
P356/C.3.2
z = z
w
iL
= 7.63
5850 =91.8
LT = w1
z
1
1
UVDC
= 890.05.77
8.912.1932.011 = 1.25
LT =
2LTLTLT 2.015.0 = 225.12.025.176.015.0 = 1.68
Hence
LT =
2LT
2LTLT1 =
22 25.168.168.11 = 0.36
Mb,Rd =
1M
yel
fW
= 66
101.1
34510273.836.0
= 934 kNm > MEd = 571 kNm OK
P357 Composite Highway Bridge Design: Worked ExamplesC
reat
ed o
n 16
Apr
il 20
12T
his
mat
eria
l is
copy
right
- a
ll rig
hts
rese
rved
. Use
of t
his
docu
men
t is
subj
ect t
o th
e te
rms
and
cond
ition
s of
the
Ste
elbi
z Li
cenc
e A
gree
men
t
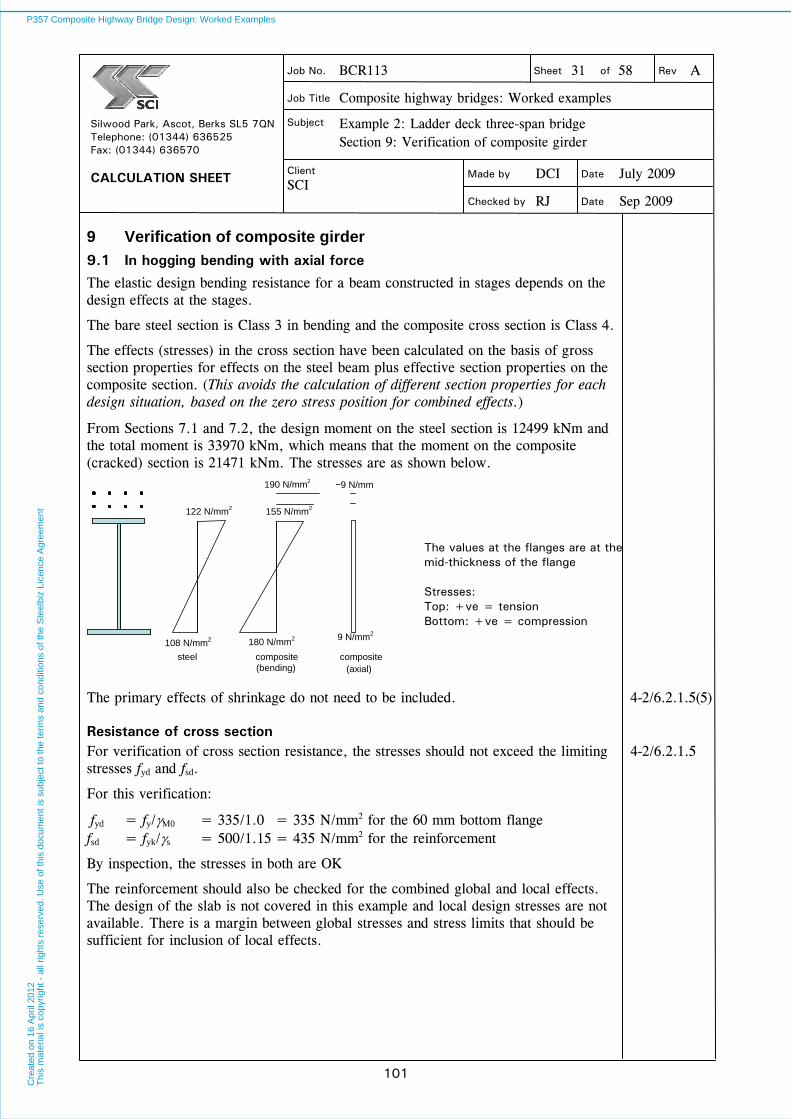
Job No. BCR113 Sheet 31 of 58 Rev A
Job Title Composite highway bridges: Worked examples
Subject Example 2: Ladder deck three-span bridge Section 9: Verification of composite girder
Made by DCI Date July 2009
Silwood Park, Ascot, Berks SL5 7QN Telephone: (01344) 636525 Fax: (01344) 636570 CALCULATION SHEET
Client SCI
Checked by RJ Date Sep 2009
P357-example2-D07.doc 101 Printed 17/03/2010
9 Verification of composite girder
9.1 In hogging bending with axial force
The elastic design bending resistance for a beam constructed in stages depends on the design effects at the stages.
The bare steel section is Class 3 in bending and the composite cross section is Class 4.
The effects (stresses) in the cross section have been calculated on the basis of gross section properties for effects on the steel beam plus effective section properties on the composite section. (This avoids the calculation of different section properties for each design situation, based on the zero stress position for combined effects.)
From Sections 7.1 and 7.2, the design moment on the steel section is 12499 kNm and the total moment is 33970 kNm, which means that the moment on the composite (cracked) section is 21471 kNm. The stresses are as shown below.
The values at the flanges are at the mid-thickness of the flange Stresses: Top: +ve = tension Bottom: +ve = compression
The primary effects of shrinkage do not need to be included. 4-2/6.2.1.5(5)
Resistance of cross section For verification of cross section resistance, the stresses should not exceed the limiting stresses fyd and fsd.
For this verification:
fyd = fy/M0 = 335/1.0 = 335 N/mm2 for the 60 mm bottom flange fsd = fyk/s = 500/1.15 = 435 N/mm2 for the reinforcement
By inspection, the stresses in both are OK
4-2/6.2.1.5
The reinforcement should also be checked for the combined global and local effects. The design of the slab is not covered in this example and local design stresses are not available. There is a margin between global stresses and stress limits that should be sufficient for inclusion of local effects.
steel composite
108 N/mm2
122 N/mm2
composite(bending)
180 N/mm2
190 N/mm2
(axial)
9 N/mm2
155 N/mm2
−9 N/mm
P357 Composite Highway Bridge Design: Worked ExamplesC
reat
ed o
n 16
Apr
il 20
12T
his
mat
eria
l is
copy
right
- a
ll rig
hts
rese
rved
. Use
of t
his
docu
men
t is
subj
ect t
o th
e te
rms
and
cond
ition
s of
the
Ste
elbi
z Li
cenc
e A
gree
men
t

Job No. BCR113 Sheet 32 of 58 Rev A
Job Title Composite highway bridges: Worked examples
Subject Example 2: Ladder deck three-span bridge Section 9: Verification of composite girder
Made by DCI Date July 2009
Silwood Park, Ascot, Berks SL5 7QN Telephone: (01344) 636525 Fax: (01344) 636570 CALCULATION SHEET
Client SCI
Checked by RJ Date Sep 2009
P357-example2-D07.doc 102 Printed 17/03/2010
Buckling resistance For verification of buckling resistance in bending, the design resistance of the cross section (on which Mb,Rd is based) has to be determined using:
Mel,Rd = Ma,Ed + kMc,Ed
Where k is a factor such that a stress limit is reached.
4-2/(6.4)
In this case the bottom flange will reach its limit first and the limit is:
fyd = fy/M1 = 335/1.1 = 305 N/mm2 (M1 is used since buckling is being considered)
Thus, considering bending stresses only:
3599021471
180108305
12499Rdel,
M kNm
To evaluate Mb,Rd, determine the slenderness
The slenderness of the length of beam in the hogging region could be evaluated considering the LTB of a composite section comprising the effective width of slab and the steel girder but it is much simpler and a little less conservative to use the simplified method of EN 1993-2, as recommended by EN 1994-2.
4-2/6.4.3.2
Consider the lateral buckling of an effective Tee section comprising the bottom flange and one third of the depth of the part of the web in compression. Take the depth in compression as that under total effects, including axial force.
Flange area is 800 60 mm
Height to zero stress: Stress Mid-height
(297/(297 + 268) (2175 − 30) + 30 = 1158 mm Top flange 268 2175
Height of web in compression = 1098 mm Bottom flange 297 30
3-2/6.3.4.2
Area of Tee = 800 60 + (1098 20)/3 = 55320 mm2
Lateral 2nd moment of area = 8003 60 /12 = 2560 106 mm4
Radius of gyration = 21555320102560 6 mm
Initially, assume that the first cross girder provides effective lateral restraint to the flange, through U-frame action.
For a buckling length of 3500 mm (support to first cross girder, CG8):
433100103500
102560210000 32
62
22
E
ππL
EIN kN
3-2/(6.12)
The lateral restraint is sufficiently stiff if its stiffness Cd satisfies:
LN
C Ed
4
3-2/6.3.4.2 (6.13)
P357 Composite Highway Bridge Design: Worked ExamplesC
reat
ed o
n 16
Apr
il 20
12T
his
mat
eria
l is
copy
right
- a
ll rig
hts
rese
rved
. Use
of t
his
docu
men
t is
subj
ect t
o th
e te
rms
and
cond
ition
s of
the
Ste
elbi
z Li
cenc
e A
gree
men
t
Job No. BCR113 Sheet 33 of 58 Rev A
Job Title Composite highway bridges: Worked examples
Subject Example 2: Ladder deck three-span bridge Section 9: Verification of composite girder
Made by DCI Date July 2009
Silwood Park, Ascot, Berks SL5 7QN Telephone: (01344) 636525 Fax: (01344) 636570 CALCULATION SHEET
Client SCI
Checked by RJ Date Sep 2009
P357-example2-D07.doc 103 Printed 17/03/2010
The stiffness of the U-frame is given by consideration of equal and opposite unit forces applied at the two bottom flanges. Following the guidance in Table D.3, this may be expressed as:
3-2/D.2.4
q
q23
231
EI
bh
EIh
C v
v Iq
Ivhvh
bq
IqIv
hvh
bq
At the first cross girder:
bq = 11700, hv = 1114 mm h = 1979 mm, (to mean level of short-term NA)
Iq = 1.02 1010 (short-term section, average value over tapered cross girder) Iv = 1.89 108 (web plus flat stiffener)
Hence
10
2
8
3
d 1002.12
117001979
1089.13
1114210000C = 44800 N/mm
The required Cd is:
495000103500
4331004 3
N/mm
Therefore the frame is not stiff enough to be considered as rigid
Now consider the stiffness of the second frame, for buckling over a length of 2 panels. Since the half wavelength has doubled,
NE = 433100/4 = 108300 kN and required Cd is then 4 108300/7.0 = 61900 kN/m
For this frame, h = 1729 mm, hv = 864 mm
736001002.12
117001729
1089.13
864210000
10
2
8
3
dC N/mm ( kN/m)
Which is sufficient to be considered as rigid
The verification may be carried out using
crit
yeffLT N
fA
Where Ncrit = mNE
3-2/(6.10)
NE is the elastic critical buckling load for the equivalent column under uniform axial force and m is a parameter that allows for intermediate lateral spring restraints and for non-uniform axial force. Expressions are given in 6.3.4.2(7) depending on the ratio M2/M1 and V2/V1, as well as on the intermediate spring stiffness.
In this case, the girder tapers over the buckling length and it would be complex to determine the value of m but the limiting (minimum) value of 1.0 may be used and is not overly conservative for this situation.
P357 Composite Highway Bridge Design: Worked ExamplesC
reat
ed o
n 16
Apr
il 20
12T
his
mat
eria
l is
copy
right
- a
ll rig
hts
rese
rved
. Use
of t
his
docu
men
t is
subj
ect t
o th
e te
rms
and
cond
ition
s of
the
Ste
elbi
z Li
cenc
e A
gree
men
t

Job No. BCR113 Sheet 34 of 58 Rev A
Job Title Composite highway bridges: Worked examples
Subject Example 2: Ladder deck three-span bridge Section 9: Verification of composite girder
Made by DCI Date July 2009
Silwood Park, Ascot, Berks SL5 7QN Telephone: (01344) 636525 Fax: (01344) 636570 CALCULATION SHEET
Client SCI
Checked by RJ Date Sep 2009
P357-example2-D07.doc 104 Printed 17/03/2010
Thus
414.010108300
335553203
crit
yeffLT
N
fA
Since h/b <2, use buckling curve c ( = 0.49)
2LTLTLTLT 2.015.0 = 2414.02.0414.049.015.0 = 0.638
3-2/6.3.2.2 3-1-1/6.3.2.2 3-1-1/NA.2.16
Hence
2LT
2LTLTLT 1 =
22 414.0638.0638.01 = 0.890
3203035990890.0Rdel,Rdb, MM kNm 3-1-1/6.3.2.1
For verifying the contribution of axial resistance in the interaction criterion, consider the same Tee section (and thus the same slenderness and reduction factor).
No effective section for axial force is given in EN 1993-2 but it could be argued that the effective Tee that would buckle laterally should comprise half the area of the web: the slenderness with this amount of web is very little different from that of the effective Tee for bending. The same area is used here for both cases.
Rdb,N = 1505030555440890.0ydTee fA kNm
NEd = 498955320Tee stressA kN
This verification of resistance to buckling may be carried out at a distance from the largest moment given by 0.25Lk (where LK = mL )
3-2/ 6.3.4.2(7)
Here, consider moment at 0.25 7000 from the support. Conservatively this can be interpreted linearly between the values at the two ends (7000 mm apart) or in this case linearly between values at the support and first cross girder.
At the support, MEd = 33970 kNm At the first cross girder MEd = 20810 kNm Hence MEd = 27390 kNm at 0.25Lk
The section is subject to combined bending and axial force and a linear interaction will be assumed since the buckling mode is the same for both.
In the M/N interaction verification, use NEd = 498 kN (on the effective column) without reduction over the buckling length.
The interaction relationship is thus:
888.0033.0855.015050498
3203027390
Rdb,
Ed
Rdb,
Ed NN
MM
OK
The buckling resistance is satisfactory.
Interaction with shear must also be considered (using cross section resistances).
P357 Composite Highway Bridge Design: Worked ExamplesC
reat
ed o
n 16
Apr
il 20
12T
his
mat
eria
l is
copy
right
- a
ll rig
hts
rese
rved
. Use
of t
his
docu
men
t is
subj
ect t
o th
e te
rms
and
cond
ition
s of
the
Ste
elbi
z Li
cenc
e A
gree
men
t

Job No. BCR113 Sheet 35 of 58 Rev A
Job Title Composite highway bridges: Worked examples
Subject Example 2: Ladder deck three-span bridge Section 9: Verification of composite girder
Made by DCI Date July 2009
Silwood Park, Ascot, Berks SL5 7QN Telephone: (01344) 636525 Fax: (01344) 636570 CALCULATION SHEET
Client SCI
Checked by RJ Date Sep 2009
P357-example2-D07.doc 105 Printed 17/03/2010
9.2 Maximum shear at support
The maximum shear in the girder at the intermediate support = 4533 kN
However, the bottom flange is inclined and contributes a vertical component of force The total stress in the bottom flange is 262 N/mm2 and the inclination is 0.0952 rad
Hence vertical component = (262 800 60 /1000) 0.0952 = 1197 kN
VEd = 4533 − 1197 = 3336 kN
Sheet 22
Assume that no transverse web stiffeners are provided, other than those to attach cross girders (3500 mm spacing).
The web panel adjacent to the support is tapered; base the slenderness on the deeper end of the panel.
aw = 3500 mm hw = 2090 mm t = 20 mm fy = 345 N/mm2
The factor = 1.0 according to the NA
3-1-5/NA.2.4
From equation (5.6):
tw
4.37 kt
hw
where 83.0345235235 y f
3-1-5/5.3
Since aw > hw and there are no longitudinal stiffeners:
77.6350020900.434.50.434.5 22wt ahk
3-1-5/A.3
294.177.683.0204.37
2090w
Since the girder is continuous, consider as a rigid endpost case. Thus, from Table 5.1:
687.0994.137.17.037.1 w w
5200101.13
202090345687.0
33
M1
wywwRdbw,
thfV kN
3-1-5/5.2
This resistance is adequate, even without a contribution from the flanges.
Using the same web slenderness, the shear resistance at the shallow end of the panel is 4813 kN. The force in the compression flange is less at that position and although the flange force is also less, VEd,net = 2865 kN (calculations not shown here). This is OK.
9.3 Combined bending and shear
The shear coexisting with maximum moment is 3827 kN less a contribution from the inclined flange of 1325 kN, giving a net value of VEd = 2502 kN
P357 Composite Highway Bridge Design: Worked ExamplesC
reat
ed o
n 16
Apr
il 20
12T
his
mat
eria
l is
copy
right
- a
ll rig
hts
rese
rved
. Use
of t
his
docu
men
t is
subj
ect t
o th
e te
rms
and
cond
ition
s of
the
Ste
elbi
z Li
cenc
e A
gree
men
t

Job No. BCR113 Sheet 36 of 58 Rev A
Job Title Composite highway bridges: Worked examples
Subject Example 2: Ladder deck three-span bridge Section 9: Verification of composite girder
Made by DCI Date July 2009
Silwood Park, Ascot, Berks SL5 7QN Telephone: (01344) 636525 Fax: (01344) 636570 CALCULATION SHEET
Client SCI
Checked by RJ Date Sep 2009
P357-example2-D07.doc 106 Printed 17/03/2010
481.052002502
Rdbw,
Ed3
VV
3-1-5/7.1
So interaction does not need to be considered for this design situation. ( 5.03 )
For the maximum shear design situation (MEd = 30576 kNm, VEd = 4533 kN, NEd = 1092 kN) the net shear is VEd,net = 3336 kN and thus:
642.052003336
Rdbw,
Ed3
VV
So shear-moment interaction does need to be considered. ( 5.03 )
Sheet 22
For interaction, consider the value of Mf,,Rd. For this parameter, M0 applies and the value must take account of axial force.
The area of the bottom flange is smaller than that of the top plus the rebars and its compressive resistance is 16080 kN. Deduct half the compressive force (conservative, since that flange is smaller) and multiply by the lever arm between the two flanges (take d = 2220 mm). Thus Mf,Rd = (16080 - 1092/2) 2.22 = 34500 kNm
Since MEd < Mf,Rd the interaction criterion of 3-1-5/7.1 does not apply and the combined effects are satisfactory.
As noted in Example 1, it is suggested in PD 6696-2 that MEd should be determined from accumulated stress, rather than as the sum of the moments. That calculation is not shown here but the value would be less than Mf,Rd.
9.4 In sagging bending
The composite cross section is Class 1 (pna in the top flange) so the plastic resistance can be utilised.
The plastic bending resistance of the short term composite section is 22519 kNm and the total design value of bending effects is 16654 kNm, with an axial tensile force of 2263 kN. The presence of tensile axial force on the plastic bending resistance is not covered by EN 1994-2; in this case, where the pna of the composite section is at the mid thickness of the top flange, the axial force only moves the pna within the top flange and there is negligible effect on the plastic bending resistance. The cross section is satisfactory by inspection.
Sheet 10 Sheet 22
It can also be seen that the stresses calculated elastically, taking account of construction in stages, are satisfactory, as follows:
P357 Composite Highway Bridge Design: Worked ExamplesC
reat
ed o
n 16
Apr
il 20
12T
his
mat
eria
l is
copy
right
- a
ll rig
hts
rese
rved
. Use
of t
his
docu
men
t is
subj
ect t
o th
e te
rms
and
cond
ition
s of
the
Ste
elbi
z Li
cenc
e A
gree
men
t

Job No. BCR113 Sheet 37 of 58 Rev A
Job Title Composite highway bridges: Worked examples
Subject Example 2: Ladder deck three-span bridge Section 9: Verification of composite girder
Made by DCI Date July 2009
Silwood Park, Ascot, Berks SL5 7QN Telephone: (01344) 636525 Fax: (01344) 636570 CALCULATION SHEET
Client SCI
Checked by RJ Date Sep 2009
P357-example2-D07.doc 107 Printed 17/03/2010
From Sections 7.1 and 7.2, the design value of stresses are as shown below.
Stresses: Top: +ve = compression Bottom: +ve = tension
For verification of cross section resistance, the stresses should not exceed the limiting stresses fyd and fcd.
4-2/6.2.1.5
For this verification:
fyd = fy/M0 = 335/1.0 = 335 N/mm2 for the 50 mm bottom flange
fcd = fck/c = 40/1.5 = 26.7 N/mm2 for the concrete
By inspection, the stresses in both are OK (bf = 311 N/mm2, c = 9.1 MPa)
If the elastic bending resistance were not adequate, to verify the shear connection the non-linear resistance to bending would have to be determined in accordance with 4-2/6.2.1.4 in order to determine the force Nc in the slab at ULS.
Combined global and local effects should be considered. Since the deck slab is not covered in this example, values of local effects are not available.
9.5 Verification of crack control at SLS (pier section)
Minimum reinforcement The minimum required reinforcement is:
As = sctct,effcs Akfkk
4-2/7.4.2
ks = 0.9
kc = 0.13.021
1
0c
zh
Here hc = 250 and z0 = (2200 + 125) − 1735 = 590 mm
kc = 125.13.05902232551
1
but not more than 1.0
height of NA of uncracked section from Sheet 10
k = 0.8 fctm = 3.5 (Table 3.1) 2-1-1/3.1.2 wmax = 0.3 mm and thus for 20 mm bars, s = 200 N/mm2 (Table 7.1) As = 1160020036782505.38.00.19.0 mm2
2-2/7.3.1 4-2/7.4.2
steel short composite
82 N/mm2
98 N/mm2
168 N/mm2
8.8 N/mm2
composite(axial)
9 N/mm2
11 N/mm2 −9 N/mm2
long composite
52 N/mm2
15 N/mm2
1.8 N/mm2
−1.5 N/mm2
P357 Composite Highway Bridge Design: Worked ExamplesC
reat
ed o
n 16
Apr
il 20
12T
his
mat
eria
l is
copy
right
- a
ll rig
hts
rese
rved
. Use
of t
his
docu
men
t is
subj
ect t
o th
e te
rms
and
cond
ition
s of
the
Ste
elbi
z Li
cenc
e A
gree
men
t

Job No. BCR113 Sheet 38 of 58 Rev A
Job Title Composite highway bridges: Worked examples
Subject Example 2: Ladder deck three-span bridge Section 9: Verification of composite girder
Made by DCI Date July 2009
Silwood Park, Ascot, Berks SL5 7QN Telephone: (01344) 636525 Fax: (01344) 636570 CALCULATION SHEET
Client SCI
Checked by RJ Date Sep 2009
P357-example2-D07.doc 108 Printed 17/03/2010
Area provided = 2 314 3678/150 = 15400 mm2 - Satisfactory
Crack control Requirements relate only to the quasi-permanent design situation and therefore local longitudinal stresses in the reinforcement are negligible.
Global stresses due to permanent loads, including shrinkage are 77 N/mm2 in the top rebars. The tensile stress including the effect of tension stiffening
are:sst
ctms,0s
4.0
f
Sheet 23
For this calculation, the following parameters are needed:
As = 129800, Is = 1.160 1011 (for the bare steel section)
A = 145200, I = 1.390 1011 (for the cracked section)
Act = 3678 250 = 919500
Sheets 9 and 11
st = 340.111601298001390145200
aa
IA
AI
s = 0167.0919500/15400cts AA (i.e. 1.67%)
s = 1400167.0340.15.34.0
77
N/mm2
From Table 7.2, maximum bar spacing = 300 mm > 150 mm provided - OK
4-2/Table 7.2
Limiting stresses at SLS Reinforcement stresses at SLS, including the effects of tension stiffening in cracked sections should also be considered. The elastic summations of stresses at ULS are less than the design values at the pier and at midspan and here it is judged that stresses are satisfactory at SLS, by inspection.
9.6 Verification of cross girders
As noted in Section 7.5 the stresses in the cross girders are within elastic limits, for the loads considered in the FE analysis. However, these transverse girders are required to prevent buckling of the slab where it is in compression. As noted in P356, Section 6.3.2, the cross girders are required to perform this function when the spacing of the main girders exceeds 30 times the slab thickness, which is the case in this example.
The cross girders need to be both stiff enough and strong enough to perform this function in addition to the resistance to the effects already calculated.
There are no explicitly worded Eurocode clauses for such design of composite girders but the following evaluation is based on guidance in Hendy & Murphy. The cross girder is considered as a transverse stiffener on the deck slab plate.
References below are to Hendy and Murphy[ 7]
P357 Composite Highway Bridge Design: Worked ExamplesC
reat
ed o
n 16
Apr
il 20
12T
his
mat
eria
l is
copy
right
- a
ll rig
hts
rese
rved
. Use
of t
his
docu
men
t is
subj
ect t
o th
e te
rms
and
cond
ition
s of
the
Ste
elbi
z Li
cenc
e A
gree
men
t
Job No. BCR113 Sheet 39 of 58 Rev A
Job Title Composite highway bridges: Worked examples
Subject Example 2: Ladder deck three-span bridge Section 9: Verification of composite girder
Made by DCI Date July 2009
Silwood Park, Ascot, Berks SL5 7QN Telephone: (01344) 636525 Fax: (01344) 636570 CALCULATION SHEET
Client SCI
Checked by RJ Date Sep 2009
P357-example2-D07.doc 109 Printed 18/03/2010
The stiffness requirement may be expressed as:
300b
Where is the first order deflection due to transverse loads and is the second order deflection due to the longitudinal compression in the slab
D6.6-22
From the analysis wEd = 13.5 mm at the centre of the middle cross girder under gr5 traffic loads. Strictly, should be the observed relative deflection of one cross girder to those either side of it, but very conservatively (since the design situation would normally have similar loading on adjacent cross girders) it could be taken as the deflection of the most heavily loaded cross girder. i.e. = wEd
For the case where there is no axial force in the cross girder, the expression for reduces to:
4
mst4
4m
0 bEI
bw
Based on D6.6-21
In which:
Ed00 www
w0 is the initial imperfection, which may be taken as L/400 according to EN 1090-2, (Essential tolerance D.1.6(5), with L = 2 3500 and thus w0 = 17.5 mm)
Hence 315.135.170 w mm
The value of m depends on the longitudinal force in the slab. From the results in Section 7.2 the maximum stress at the top of the slab is 9.1 N/mm2 (bending plus axial effects) and the level of zero stress is approximately at the slab top flange interface. The effective width of slab acting with each main girder is 3975 mm and thus the force in the slab is:
904010250795021.9 3Ed N kN
Note: if plastic bending resistance had been utilised, the force in the slab would have been much greater.
Assuming that the ratio of column-like buckling stress to plate-like buckling stress is unity (conservative) and with equal spacing of the cross girders:
44.0117003500
10904022 3Ed
m
abN N/mm2
Based on D6.6-5
Thus 08.11170044.01016.1210000
1170044.031
4104
4
mm
= 1.08 + 13.5 = 14.58 mm. which is less than b/300 (39 mm) – OK
Ed00 www
P357 Composite Highway Bridge Design: Worked ExamplesC
reat
ed o
n 16
Apr
il 20
12T
his
mat
eria
l is
copy
right
- a
ll rig
hts
rese
rved
. Use
of t
his
docu
men
t is
subj
ect t
o th
e te
rms
and
cond
ition
s of
the
Ste
elbi
z Li
cenc
e A
gree
men
t

Job No. BCR113 Sheet 40 of 58 Rev A
Job Title Composite highway bridges: Worked examples
Subject Example 2: Ladder deck three-span bridge Section 9: Verification of composite girder
Made by DCI Date July 2009
Silwood Park, Ascot, Berks SL5 7QN Telephone: (01344) 636525 Fax: (01344) 636570 CALCULATION SHEET
Client SCI
Checked by RJ Date Sep 2009
P357-example2-D07.doc 110 Printed 17/03/2010
The strength of the cross girders also needs to be checked for this effect. The destabilising effect of the slab applies an additional moment of:
196101170044.0
08.131 62
2
2
2m
0
bw
kNm
Based on D6.6-20
This results in an additional tensile stress in the bottom flange of:
196 106 / 12.89 106 = 15 N/mm2
This gives a total stress of 262 + 15 = 277 N/mm2 – OK.
Sheet 24
Note that, although the cross girders are stiff enough to act as restraints to the slab against buckling, verification of the slab still needs to consider second order effects, since the slenderness a/t (=3500/250 = 14) may exceed the limit below which such effects can be ignored (see 2-1-1/5.8.3). Detailed design of the deck slab is not covered in this example.
P357 Composite Highway Bridge Design: Worked ExamplesC
reat
ed o
n 16
Apr
il 20
12T
his
mat
eria
l is
copy
right
- a
ll rig
hts
rese
rved
. Use
of t
his
docu
men
t is
subj
ect t
o th
e te
rms
and
cond
ition
s of
the
Ste
elbi
z Li
cenc
e A
gree
men
t

Job No. BCR113 Sheet 41 of 58 Rev A
Job Title Composite highway bridges: Worked examples
Subject Example 2: Ladder deck three-span bridge Section 10: Longitudinal shear
Made by DCI Date July 2009
Silwood Park, Ascot, Berks SL5 7QN Telephone: (01344) 636525 Fax: (01344) 636570 CALCULATION SHEET
Client SCI
Checked by RJ Date Sep 2009
P357-example2-D07.doc 111 Printed 17/03/2010
10 Longitudinal shear
The resistance to longitudinal shear is verified for the web/flange weld, the shear connectors and the transverse reinforcement at the pier and at mid-span. (In practice, intermediate values would also be verified, to optimise the provision of shear connectors.)
Since the composite beam model for which moments and forces have been extracted from the 3D FE model does not include the full width of slab, the shear flow will depend on both the cross section properties in bending (applied to the shear force on the section) and on the variation of axial force along the beam, due to the shear transferred from the portions of slab not included in the beam section.
10.1 Effects for maximum shear
ULS values at pier Axial force
Shear force Pier CG8
Shear on steel section (stages 1-3) 1443 51 38
Shear on long-term composite section (cracked) 936 303 227
Shear on short-term composite section (cracked) 2169 563 351
ULS values at midspan (CG13) Axial force
Shear force CG13 CG12
Shear on steel section (stages 1-3) –7 40 40
Shear on long-term composite section 0 -457 –407
Shear on short-term composite section 755 Fx = 530
Values from Sections 7.1 and 7.2
SLS values (Only values for composite section noted)
Pier Span (CG13)
Shear on long-term composite section 769 0
Shear on short-term composite section (worst effects) 1612 559
10.2 Section properties
To determine shear flows elastically, the parameter yIzA is needed for each section
and stage.
For composite sections, uncracked unreinforced composite section properties can be used to determine shear flow.
4-2/6.6.2.1(2)
P357 Composite Highway Bridge Design: Worked ExamplesC
reat
ed o
n 16
Apr
il 20
12T
his
mat
eria
l is
copy
right
- a
ll rig
hts
rese
rved
. Use
of t
his
docu
men
t is
subj
ect t
o th
e te
rms
and
cond
ition
s of
the
Ste
elbi
z Li
cenc
e A
gree
men
t

Job No. BCR113 Sheet 42 of 58 Rev A
Job Title Composite highway bridges: Worked examples
Subject Example 2: Ladder deck three-span bridge Section 10: Longitudinal shear
Made by DCI Date July 2009
Silwood Park, Ascot, Berks SL5 7QN Telephone: (01344) 636525 Fax: (01344) 636570 CALCULATION SHEET
Client SCI
Checked by RJ Date Sep 2009
P357-example2-D07.doc 112 Printed 17/03/2010
Section at pier Section at mid-span
Web/flange Flange/slab Web/flange Flange/slab
yIzA (m−1) yIzA (m−1) yIzA (m−1) yIzA (m−1)
Steel section 0.392 0.803
Long term section 0.443 0.276 0.797 0.633
Short term section 0.464 0.388 0.790 0.753
Note that the use of the yIzA parameter applied to the shear on the cross section is
conservative at the pier because the inclined bottom flange also provides a component of the shear resistance (but, since the flange force reduces away from the support, it would not be appropriate to apply the parameter to the net shear carried by the web).
If the plastic resistance had been utilized, the shear flow would need to have been be determined by consideration of the forces in the slab, taking account of the non-linear resistance in accordance with 4-2/6.2.1.4.
Additionally, the axial force in the section varies along the girder and this must be accompanied by a shear flow.
10.3 Shear flow at ULS
Force at web/flange junction
At pier 1443 0392 + 936 0.443 +2169 0.464 = 1867 kN/m
Near mid-span 7 0.803 +0 0.797 +755 0.794 = 591 kN/m
Force at flange/slab junction
At pier 936 0.276 +2169 0.388 = 1100 kN/m
Near mid-span 0 0.633 + 755 0.753 = 569 kN/m
At the pier, the difference in axial force between pier and cross girder is:
866 − 578 = 288 kN
This is equivalent to a shear flow of 288/3.5 = 82 kN/m
The shear due to this variation of axial force at the slab/girder interface depends on the ratio of steel area / cracked area (cracked area used to be consistent with FE model):
Shear flow = As/A 82 = 129800/145200 82 = 73 kN/m
The shear at the web/flange junction depends on the area of web plus bottom flange:
Shear flow = Aw+f/A 82 = 51 kN/m
At midspan, the difference in axial force between CG12 and CG13 is:
50 kN long term and 530 kN short term
This is equivalent to a shear flows of 50/3.5 = 14 kN/m and 530/3.5 = 151 kN/m
P357 Composite Highway Bridge Design: Worked ExamplesC
reat
ed o
n 16
Apr
il 20
12T
his
mat
eria
l is
copy
right
- a
ll rig
hts
rese
rved
. Use
of t
his
docu
men
t is
subj
ect t
o th
e te
rms
and
cond
ition
s of
the
Ste
elbi
z Li
cenc
e A
gree
men
t
Job No. BCR113 Sheet 43 of 58 Rev A
Job Title Composite highway bridges: Worked examples
Subject Example 2: Ladder deck three-span bridge Section 10: Longitudinal shear
Made by DCI Date July 2009
Silwood Park, Ascot, Berks SL5 7QN Telephone: (01344) 636525 Fax: (01344) 636570 CALCULATION SHEET
Client SCI
Checked by RJ Date Sep 2009
P357-example2-D07.doc 113 Printed 17/03/2010
The shear at the slab/girder interface depends on the ratio of steel area to composite areas:
Shear flow = 85320/164300 14 = 7 kN/m (long) = 85320/305100 151 = 42 kN/m (short)
The shear at the web/flange junction depends on the area of web plus bottom flange:
Shear flow = 53320/164300 14 = 5 kN/m (long) = 53320/305100 151 = 26 kN/m (short)
The total shear flows are thus:
At the pier: slab/flange shear = 1173 kN/m, web/flange shear = 1918 kN/m At midspan: slab/flange shear = 618 kN/m, web/flange shear = 622 kN/m
10.4 Shear flow at SLS
Force at flange/slab junction
At pier 769 0.276 +1612 0.385 = 837 kN/m
At mid-span 0 0.633 + 559 0.753 = 421 kN/m
The shear flow at SLS is required for verification of the shear connectors
These values are 76% and 74% respectively of the ULS values and the ratio reflects the different partial factors at ULS and SLS. It can be assumed that similar ratios apply to the shear flow due to variation of axial force.
10.5 Web/flange welds
Design weld resistance given by the simplified method of EN 1993-1-8, 4.5.3.3 is:
afF dvw,Rdw, where
2dvw,
3
M
uff
For 6 mm throat fillet weld (8.4 mm leg length) a = 6 mm
For web and flange grade 355 in thickness range 3 -100 mm, fu = 470 N/mm2
From Table 3-1-8/4.1 = 0.9
Thus 25.19.0
34706,
RdwF = 1447 N/mm (kN/m)
Resistance of 2 welds = 2890 kN/m > 1918 kN/m shear flow in pier girder - OK
EN 10025-2
10.6 Shear connectors
Stud shear connectors 19 mm diameter 150 mm long (type SD1 to EN ISO 13918) are assumed, with fu = 450 N/mm2
P357 Composite Highway Bridge Design: Worked ExamplesC
reat
ed o
n 16
Apr
il 20
12T
his
mat
eria
l is
copy
right
- a
ll rig
hts
rese
rved
. Use
of t
his
docu
men
t is
subj
ect t
o th
e te
rms
and
cond
ition
s of
the
Ste
elbi
z Li
cenc
e A
gree
men
t
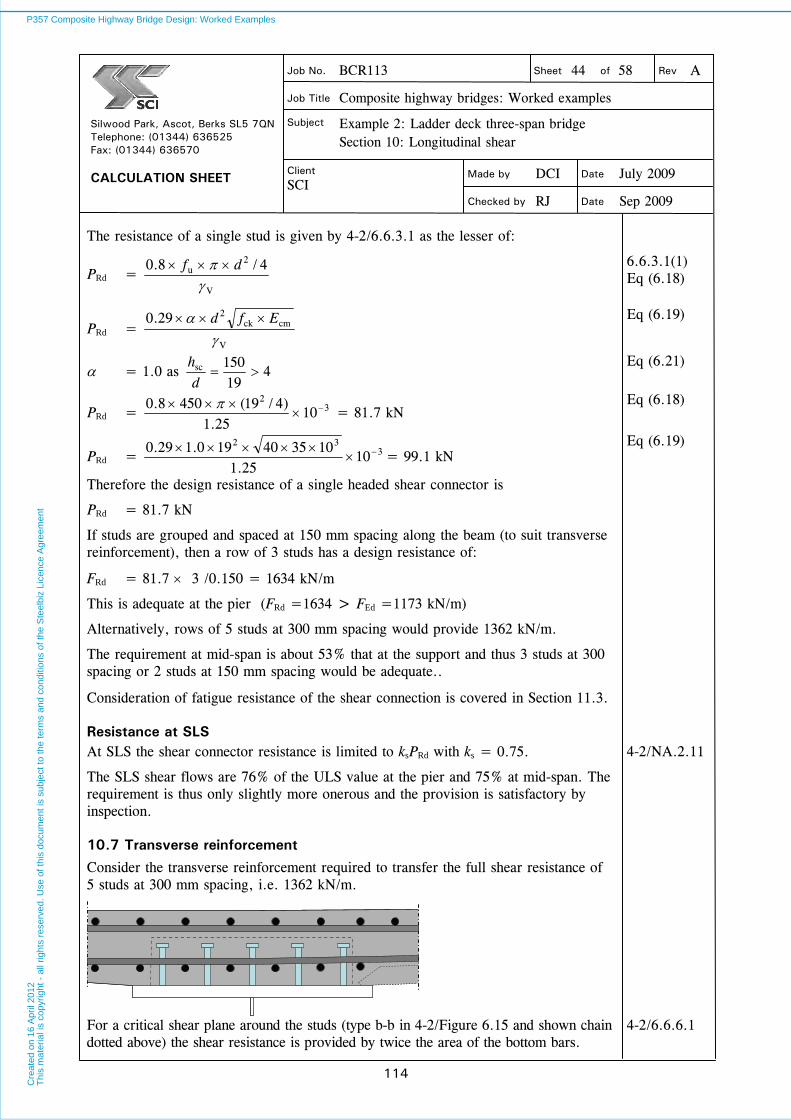
Job No. BCR113 Sheet 44 of 58 Rev A
Job Title Composite highway bridges: Worked examples
Subject Example 2: Ladder deck three-span bridge Section 10: Longitudinal shear
Made by DCI Date July 2009
Silwood Park, Ascot, Berks SL5 7QN Telephone: (01344) 636525 Fax: (01344) 636570 CALCULATION SHEET
Client SCI
Checked by RJ Date Sep 2009
P357-example2-D07.doc 114 Printed 17/03/2010
The resistance of a single stud is given by 4-2/6.6.3.1 as the lesser of:
PRd = V
2u 4/8.0 df
6.6.3.1(1) Eq (6.18)
PRd = V
cmck229.0
Efd
Eq (6.19)
= 1.0 as 419150sc
dh
Eq (6.21)
PRd = 32
1025.1
)4/19(4508.0
= 81.7 kN Eq (6.18)
PRd = 332
1025.1
103540190.129.0
= 99.1 kN Eq (6.19)
Therefore the design resistance of a single headed shear connector is
PRd = 81.7 kN
If studs are grouped and spaced at 150 mm spacing along the beam (to suit transverse reinforcement), then a row of 3 studs has a design resistance of:
FRd = 81.7 3 /0.150 = 1634 kN/m
This is adequate at the pier (FRd =1634 > FEd =1173 kN/m)
Alternatively, rows of 5 studs at 300 mm spacing would provide 1362 kN/m.
The requirement at mid-span is about 53% that at the support and thus 3 studs at 300 spacing or 2 studs at 150 mm spacing would be adequate..
Consideration of fatigue resistance of the shear connection is covered in Section 11.3.
Resistance at SLS At SLS the shear connector resistance is limited to ksPRd with ks = 0.75. 4-2/NA.2.11
The SLS shear flows are 76% of the ULS value at the pier and 75% at mid-span. The requirement is thus only slightly more onerous and the provision is satisfactory by inspection.
10.7 Transverse reinforcement
Consider the transverse reinforcement required to transfer the full shear resistance of 5 studs at 300 mm spacing, i.e. 1362 kN/m.
For a critical shear plane around the studs (type b-b in 4-2/Figure 6.15 and shown chain dotted above) the shear resistance is provided by twice the area of the bottom bars.
4-2/6.6.6.1
P357 Composite Highway Bridge Design: Worked ExamplesC
reat
ed o
n 16
Apr
il 20
12T
his
mat
eria
l is
copy
right
- a
ll rig
hts
rese
rved
. Use
of t
his
docu
men
t is
subj
ect t
o th
e te
rms
and
cond
ition
s of
the
Ste
elbi
z Li
cenc
e A
gree
men
t
Job No. BCR113 Sheet 45 of 58 Rev A
Job Title Composite highway bridges: Worked examples
Subject Example 2: Ladder deck three-span bridge Section 10: Longitudinal shear
Made by DCI Date July 2009
Silwood Park, Ascot, Berks SL5 7QN Telephone: (01344) 636525 Fax: (01344) 636570 CALCULATION SHEET
Client SCI
Checked by RJ Date Sep 2009
P357-example2-D07.doc 115 Printed 17/03/2010
The shear force to be resisted is given by 4-2/(6.21) as 1362/cot
Take cot = 1, hence required resistance = 1362 kN/m
2-1-1/6.2.4
Assume B20 bars at 150 mm spacing:
Resistance = Asffyd/sf = (2 314) (500/1.15) /150 10−3 = 1821 kN/m
2-1-1/6.2.4
The transverse bars are adequate.
The underside of the heads of the studs need to be at least 40 mm above the transverse bars. In this case an overall stud height of 150 mm should be sufficient.
4-2/6.6.5.4
P357 Composite Highway Bridge Design: Worked ExamplesC
reat
ed o
n 16
Apr
il 20
12T
his
mat
eria
l is
copy
right
- a
ll rig
hts
rese
rved
. Use
of t
his
docu
men
t is
subj
ect t
o th
e te
rms
and
cond
ition
s of
the
Ste
elbi
z Li
cenc
e A
gree
men
t

Job No. BCR113 Sheet 46 of 58 Rev A
Job Title Composite highway bridges: Worked examples
Subject Example 2: Ladder deck three-span bridge Section 11: Fatigue assessment
Made by DCI Date July 2009
Silwood Park, Ascot, Berks SL5 7QN Telephone: (01344) 636525 Fax: (01344) 636570 CALCULATION SHEET
Client SCI
Checked by RJ Date Sep 2009
P357-example2-D07.doc 116 Printed 17/03/2010
11 Fatigue assessment
11.1 Assessment of structural steel details
The design value of the stress range in structural steel is:
FfE2 = Ff 2p where 2 =1.0 and Ff is given by the NA as 1.0
3-2/9.4.1 and 9.5.1 3-2/NA.2.35
The value of = 1 2 3 4 (but not more than max)
For intermediate supports where L, the length of the critical influence line (in m) is more than 30 m 50/305.070.11 L
Here, L = (24.5 + 42)/2 = 33.25 m and thus 1 =1.73
For span regions, 70/107.055.21 L and here L = 42 m and thus 1 =2.23
The value of 2 is given by51
0
Obs
0
1m2
NN
Where Q0 = 480 kN and N0 = 0.5 106
From 3-2/NA.2.39, Qm1 = 260 kN
From 1-2/Table NA.4, NObs = 1 106
Hence 62.05.0
0.1
480
2602.0
2
For a 120 year design life the value of 3 given by 3-2/Table 9.2 is 1.037:
The value of 4 depends on the relative magnitude of the stress range due to the passage of FLM3 in the second lane and is given by:
2.0
4 1 lanein effect2 lanein effect
1
Design stress ranges at pier At the pier, the stress range p in top and bottom flanges (at their mid thickness) is:
Bottom flange: 15.9 N/mm2 Top flange: 11.9 N/mm2
The ratio of lane 2/lane 1 effects = 0.709 and thus 4 = 1.13
Sheet 23
242.113.1037.162.073.1
For support regions where L > 30 m 50/3090.080.1max L
Thus, for L = 33.25, max =1.86
Hence = 1.242
P357 Composite Highway Bridge Design: Worked ExamplesC
reat
ed o
n 16
Apr
il 20
12T
his
mat
eria
l is
copy
right
- a
ll rig
hts
rese
rved
. Use
of t
his
docu
men
t is
subj
ect t
o th
e te
rms
and
cond
ition
s of
the
Ste
elbi
z Li
cenc
e A
gree
men
t

Job No. BCR113 Sheet 47 of 58 Rev A
Job Title Composite highway bridges: Worked examples
Subject Example 2: Ladder deck three-span bridge Section 11: Fatigue assessment
Made by DCI Date July 2009
Silwood Park, Ascot, Berks SL5 7QN Telephone: (01344) 636525 Fax: (01344) 636570 CALCULATION SHEET
Client SCI
Checked by RJ Date Sep 2009
P357-example2-D07.doc 117 Printed 17/03/2010
The design stress ranges are thus:
Bottom flange: 1.0 1.242 15.9 = 20 N/mm2
Top flange: 1.0 1.242 11.9 = 15 N/mm2
The worst detail category that might apply is for a bearing plate welded to the underside of the bottom flange, which, for a flange plate over 50 mm thick, is category 36 (3-1-9/Table 8.5, detail 6).
Design value of fatigue strength = 36/Mf = 36/1.1 = 33 N/mm2 OK
3-1-9/ NA.2.5.3
Design stress ranges in mid-span At mid-span, there is negligible stress range in the top flange. The range in the bottom flange is 26.0 N/mm2. The ratio of lane 2/lane 1 effects = 0.698 and thus 4 = 1.112
599.1112.1037.162.023.2
The design stress range is thus:
Bottom flange: 1.0 1.599 26.0 = 42 N/mm2
The most onerous detail would be a transverse web stiffener, which is detail category 80 and the fatigue strength = 80/1.1 = 73 N/mm2. This is OK even for stiffeners welded to the bottom flange.
3-1-9/ Table 8.4
11.2 Assessment of reinforcing steel
The design value of the stress range in reinforcing steel is F,fatS,equ where the value of F,fat is given by Table NA.1 as F,fat = 1.0
S,equ is referred to in EN 1994-2 as E , given by:
fmin,fmax,E
2-1/6.8.5 4-2/6.8.6.1
The value of = s
and s = fat s,1 s,2 s,3 s,4
Where fat is a damage equivalent impact factor
2-2/NN.2.1
The value effectively duplicates fat but since =1.0, this is not significant 4-2/6.8.6.1
The value of the stress range due to FLM3 needs to be increased by a factor of 1.75 (in regions of intermediate supports) in accordance with NN.2.1(101). Stresses also need to be increased for the effect of tension stiffening in accordance with 4-2/7.4.3
2-2/NN.2.1
Based on cracked section properties, the stress in the top rebars due to permanent actions is 77 N/mm2 (see SLS values in Section 7.3).
EN 1991-2 Annex B
The maximum tensile stress due to the FLM3 fatigue vehicle in lane 1 is 11.5 N/mm2 (see Section 7.4) and this is increased by the 1.75 factor, giving a value of 22.4 N/mm2. Thus, ignoring tension stiffening, max,f = 99 N/mm2.
The minimum stress (compressive) due to the FLM3 fatigue vehicle in lane 1 is 2.1 N/mm2 (see Section 7.4) and this is increased by the 1.75 factor, giving a value of 3.6 N/mm2. Thus, ignoring tension stiffening, min,f = 73 N/mm2.
P357 Composite Highway Bridge Design: Worked ExamplesC
reat
ed o
n 16
Apr
il 20
12T
his
mat
eria
l is
copy
right
- a
ll rig
hts
rese
rved
. Use
of t
his
docu
men
t is
subj
ect t
o th
e te
rms
and
cond
ition
s of
the
Ste
elbi
z Li
cenc
e A
gree
men
t

Job No. BCR113 Sheet 48 of 58 Rev A
Job Title Composite highway bridges: Worked examples
Subject Example 2: Ladder deck three-span bridge Section 11: Fatigue assessment
Made by DCI Date July 2009
Silwood Park, Ascot, Berks SL5 7QN Telephone: (01344) 636525 Fax: (01344) 636570 CALCULATION SHEET
Client SCI
Checked by RJ Date Sep 2009
P357-example2-D07.doc 118 Printed 17/03/2010
To determine the effect of tension stiffening, the following parameters were determined on Sheet 38:
s = 0.0167 st = 1.34 fctm = 3.5 MPa (for C40/50 concrete)
310167.034.15.32.02.0
sst
ctm
f
s N/mm2
4-2/7.4.3 2-1-1/Table 3.1 See 4-2/6.8.5.4 for 0.2 factor
Thus, the maximum and minimum stresses including tension stiffening are:
s,max,f = max,f + s = 99 +31 = 130 N/mm2
And fmax,d,E,
fmin,d,E,fmax,s,fmin,s, M
M
Using the ratio of stresses, rather than directly using moments:
969973
130fmin,s, N/mm2
4-2/6.8.5.4
For intermediate support region and span of 33.25 m, s,1 = 0.988
(The curve can be expressed approximately, for L <50 m by the expression
0.3(L/100)2 + 0.25(L/100)+ 0.872.)
2-2/Figure NN.1
For NObs = 1 106, medium distance traffic and straight bars (k2 = 9):Q =0.94 and
9Obss,2 2.0
0.194.0
2.02kN
Q 0.870
2-2/Table NN.1
For 120 year design life:
020.1100120
1009Years
3,s2 k N
For 2 slow lanes:
080.11.0
0.29
Obs,1
Obss,4 2 k ,i
N
N
For road surface of good roughness fat = 1.2 1-2/Annex B
Thus 136.108.102.187.0988.02.1
3934136.1961300.1136.1E N/mm2
39390.1equS,fatF, N/mm2
14115.1
5.162
fats,
Rsk
N/mm2 >39 mm2 OK 2-1-1/6.8.5
P357 Composite Highway Bridge Design: Worked ExamplesC
reat
ed o
n 16
Apr
il 20
12T
his
mat
eria
l is
copy
right
- a
ll rig
hts
rese
rved
. Use
of t
his
docu
men
t is
subj
ect t
o th
e te
rms
and
cond
ition
s of
the
Ste
elbi
z Li
cenc
e A
gree
men
t
Job No. BCR113 Sheet 49 of 58 Rev A
Job Title Composite highway bridges: Worked examples
Subject Example 2: Ladder deck three-span bridge Section 11: Fatigue assessment
Made by DCI Date July 2009
Silwood Park, Ascot, Berks SL5 7QN Telephone: (01344) 636525 Fax: (01344) 636570 CALCULATION SHEET
Client SCI
Checked by RJ Date Sep 2009
P357-example2-D07.doc 119 Printed 17/03/2010
Note: The above verification considers only global stresses in the reinforcement, which is appropriate for regions close to the main girder. Fatigue under local loading should also be considered and then combined global and local effects must be evaluated; with a ladder deck the worst local effects are midway between main girders, where global effects are less. Design of the deck slab is outside the scope of this example.
11.3 Assessment of shear connection
The design value of the stress range in shear studs is given as Ff,E2 where
vE,2
In which is the range of shear stress in the cross section of the stud.
EN 1994-2 refers to EN 1993-2 for the value of Ff, which is given as 1.0
4-2/6.8.7.2 3-2/NA.2.35
The value of v = v,1 v,2 v,3 v,4
Since the span is less than 100 m, v,1 = 1.55
The values of 2, 3 and 4 are calculated in the same manner as for structural steel but with an exponent of 1/8 rather than 1/5
Hence 591.05.0
0.1
480
260125.0
2
023.1100
120125.0
3
The value of 4 depends on the relative magnitude of the stress range due to the passage of FLM3 in the second lane and is given by:
125.0
4 1 lanein effect2 lanein effect
1
Shear at pier The range of vertical shear force at the pier is 423 kN and the ratio of lane 2/lane 1 effects is 241/423 = 0.570. The variation of axial force over 3.5 m is 41 kN.
As noted earlier, the axial force in the cross section is consequent upon both the separate modelling of the edge beam and of the unequal loading on the two main girders (the FLM3 is in lane 1). These cause longitudinal shears along both edges of the portion of slab acting with the steel girder; some of that shear has to be transferred to the steel beam (pro rata to area) and thus needs to be included in the design shear flow on the studs.
Sheet 19
At the pier, the studs are 19 mm diameter, in rows of 3 at 150 mm spacing (or 6 at 300 mm spacing)
P357 Composite Highway Bridge Design: Worked ExamplesC
reat
ed o
n 16
Apr
il 20
12T
his
mat
eria
l is
copy
right
- a
ll rig
hts
rese
rved
. Use
of t
his
docu
men
t is
subj
ect t
o th
e te
rms
and
cond
ition
s of
the
Ste
elbi
z Li
cenc
e A
gree
men
t

Job No. BCR113 Sheet 50 of 58 Rev A
Job Title Composite highway bridges: Worked examples
Subject Example 2: Ladder deck three-span bridge Section 11: Fatigue assessment
Made by DCI Date July 2009
Silwood Park, Ascot, Berks SL5 7QN Telephone: (01344) 636525 Fax: (01344) 636570 CALCULATION SHEET
Client SCI
Checked by RJ Date Sep 2009
P357-example2-D07.doc 120 Printed 17/03/2010
yIzA = 0.388 m-1 hence shear flow due to bending/shear = 423 0.388 = 164 kN
Shear flow due to axial force = 41/3.5 As/A = 10 kN/m
(cracked properties used, to be consistent with analysis model)
Total shear flow = 164 + 10 = 174 kN/m
The stress range per stud = 174 0.150 /(3 d2/4) = 30.6 N/mm2
058.1570.01 125.04
991.0058.1023.1591.055.1v
306.30991.0E,2 N/mm2
The reference value of fatigue strength for a shear stud is c = 90 4-2/6.8.3
The partial factor on fatigue strength Mf = 1.1. 3-1-9/ NA.2.5.3
The design strength is thus 90/1.1 = 81 N/mm2 >30.6 N/mm2 OK
Additionally, since the flange is in tension, the interaction with normal stress in the steel flange must be verified, using:
3.1sMf,c
2E,Ff
Mfc
2E,Ff
With c = 80.
Coexistent stresses should be used but conservatively one can consider the most onerous values for each of c and c
57.01.190
300.1
1.180
150.1
OK
4-2/6.8.7.2
Shear at mid-span The range of vertical shear force at mid-span is 219 kN and the ratio of lane 2/lane 1 effects is 143/219 = 0.653. The variation of axial force is 144 kN over 3.5 m
Sheet 19
yIzA = 0.753 m-1 hence shear flow due to bending/shear = 219 0.753 = 165 kN
Shear flow due to axial force = 144/3.5 As/A = 12 kN
Total shear flow = 165 + 12 = 177 kN/m
At mid-span, if the 19 mm studs are in rows of 3 at 300 mm spacing
Stress range = 177 0.300 / (3 284) = 62 N/mm2
065.1653.01 125.04
998.0065.1023.1591.055.1v
6262998.0E,2 N/mm2<81 N/mm2 OK
P357 Composite Highway Bridge Design: Worked ExamplesC
reat
ed o
n 16
Apr
il 20
12T
his
mat
eria
l is
copy
right
- a
ll rig
hts
rese
rved
. Use
of t
his
docu
men
t is
subj
ect t
o th
e te
rms
and
cond
ition
s of
the
Ste
elbi
z Li
cenc
e A
gree
men
t
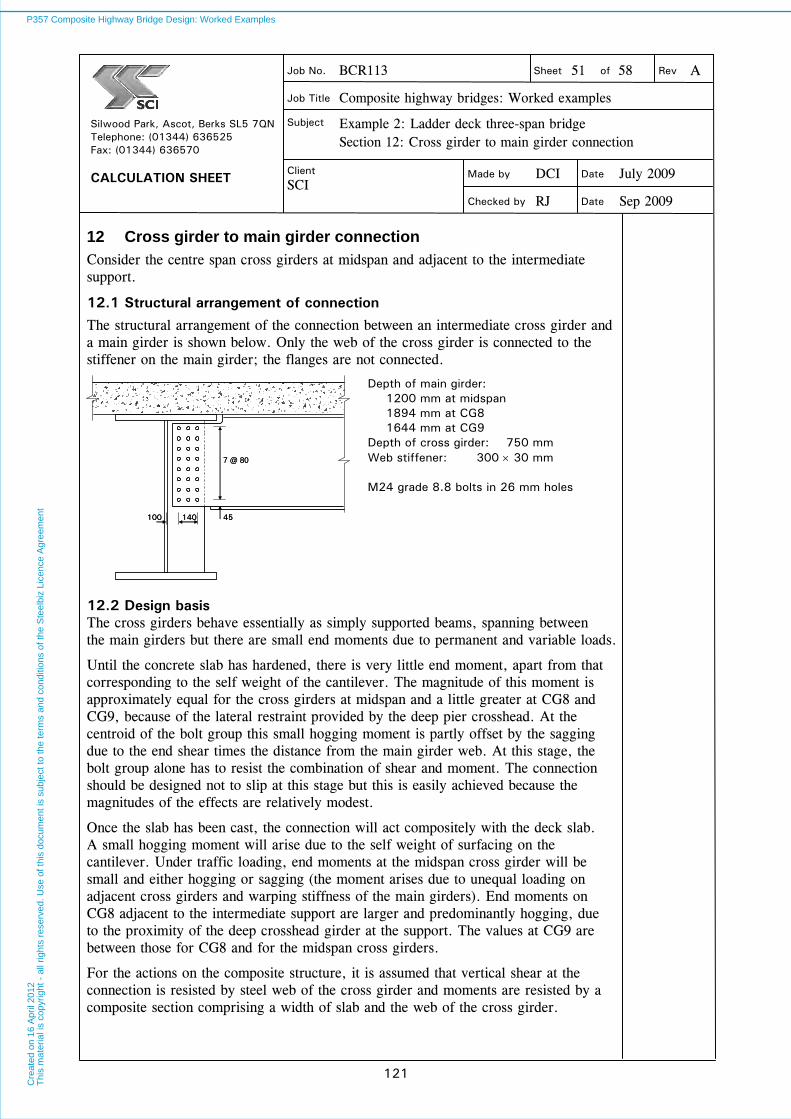
Job No. BCR113 Sheet 51 of 58 Rev A
Job Title Composite highway bridges: Worked examples
Subject Example 2: Ladder deck three-span bridge Section 12: Cross girder to main girder connection
Made by DCI Date July 2009
Silwood Park, Ascot, Berks SL5 7QN Telephone: (01344) 636525 Fax: (01344) 636570 CALCULATION SHEET
Client SCI
Checked by RJ Date Sep 2009
P357-example2-D07.doc 121 Printed 17/03/2010
12 Cross girder to main girder connection
Consider the centre span cross girders at midspan and adjacent to the intermediate support.
12.1 Structural arrangement of connection
The structural arrangement of the connection between an intermediate cross girder and a main girder is shown below. Only the web of the cross girder is connected to the stiffener on the main girder; the flanges are not connected.
100 140
7 @ 80
45100 140
7 @ 80
45
Depth of main girder: 1200 mm at midspan 1894 mm at CG8 1644 mm at CG9 Depth of cross girder: 750 mm Web stiffener: 300 30 mm M24 grade 8.8 bolts in 26 mm holes
12.2 Design basis The cross girders behave essentially as simply supported beams, spanning between the main girders but there are small end moments due to permanent and variable loads.
Until the concrete slab has hardened, there is very little end moment, apart from that corresponding to the self weight of the cantilever. The magnitude of this moment is approximately equal for the cross girders at midspan and a little greater at CG8 and CG9, because of the lateral restraint provided by the deep pier crosshead. At the centroid of the bolt group this small hogging moment is partly offset by the sagging due to the end shear times the distance from the main girder web. At this stage, the bolt group alone has to resist the combination of shear and moment. The connection should be designed not to slip at this stage but this is easily achieved because the magnitudes of the effects are relatively modest.
Once the slab has been cast, the connection will act compositely with the deck slab. A small hogging moment will arise due to the self weight of surfacing on the cantilever. Under traffic loading, end moments at the midspan cross girder will be small and either hogging or sagging (the moment arises due to unequal loading on adjacent cross girders and warping stiffness of the main girders). End moments on CG8 adjacent to the intermediate support are larger and predominantly hogging, due to the proximity of the deep crosshead girder at the support. The values at CG9 are between those for CG8 and for the midspan cross girders.
For the actions on the composite structure, it is assumed that vertical shear at the connection is resisted by steel web of the cross girder and moments are resisted by a composite section comprising a width of slab and the web of the cross girder.
P357 Composite Highway Bridge Design: Worked ExamplesC
reat
ed o
n 16
Apr
il 20
12T
his
mat
eria
l is
copy
right
- a
ll rig
hts
rese
rved
. Use
of t
his
docu
men
t is
subj
ect t
o th
e te
rms
and
cond
ition
s of
the
Ste
elbi
z Li
cenc
e A
gree
men
t
Job No. BCR113 Sheet 52 of 58 Rev A
Job Title Composite highway bridges: Worked examples
Subject Example 2: Ladder deck three-span bridge Section 12: Cross girder to main girder connection
Made by DCI Date July 2009
Silwood Park, Ascot, Berks SL5 7QN Telephone: (01344) 636525 Fax: (01344) 636570 CALCULATION SHEET
Client SCI
Checked by RJ Date Sep 2009
P357-example2-D07.doc 122 Printed 17/03/2010
It is assumed that the vertical shear is shared equally by all the bolts and that the moment (at line of the centroid of the bolt group) is determined from an elastic stress distribution on an effective Tee section comprising slab and beam web. The horizontal force in the lowest part of the web due to the moment at the middle of the connection is calculated and the force is shared between the bolts in the bottom row.
The bolted connections provide restraint to the main girder against LTB in regions adjacent to the intermediate support and are therefore designed for no slip at ULS and the effects on the connection must include an allowance for a lateral restraint force at the level of the main girder bottom flange. In midspan regions, slip could be tolerated but it is better to use the same connection detail and design basis for all the intermediate cross girders.
Strictly, the forces in the bolts due to bending moments should be derived by considering the three stages of bare steel, long-term composite Tee and short-term composite Tee, and adding the results from all three stages. However, since the connection is designed to be slip resistant at ULS and the effects at the bare steel stage are modest it is considered adequate to design the connection as a slip resistant connection for the total effects, applied to a short-term composite effective section.
12.3 Design situations
From a review of a range of different loading arrangements, it was concluded that the most onerous design situation for the connection is with gr5 loading (the SV100 vehicle) arranged such that the end shear is greatest. Situations where the end moments are greatest were found to have a lesser end shear and thus to be less onerous for the design of the connection.
The total ULS effects due to dead loads are.
At the middle cross girder (CG13): M = 85 kNm (hogging) and V = 304 kN At the end cross girder (CG8): M = 212 kNm (hogging) and V = 295 kN At the second cross girder (CG9) M = 128 kNm (hogging) and V = 308 kN (Moments are on the line of the main girder web)
Effects tabulated on Sheet 20
For CG13, the effects due to gr5 traffic load at ULS are: M = 184 kNm (hogging) and V = 859 kN
For CG8, the effects due to gr5 traffic load at ULS are: M = 447 kNm (hogging) and V = 933 kN
For CG9, the effects due to gr5 traffic load at ULS are: M = 276 kNm (hogging) and V = 879 kN
P357 Composite Highway Bridge Design: Worked ExamplesC
reat
ed o
n 16
Apr
il 20
12T
his
mat
eria
l is
copy
right
- a
ll rig
hts
rese
rved
. Use
of t
his
docu
men
t is
subj
ect t
o th
e te
rms
and
cond
ition
s of
the
Ste
elbi
z Li
cenc
e A
gree
men
t
Job No. BCR113 Sheet 53 of 58 Rev A
Job Title Composite highway bridges: Worked examples
Subject Example 2: Ladder deck three-span bridge Section 12: Cross girder to main girder connection
Made by DCI Date July 2009
Silwood Park, Ascot, Berks SL5 7QN Telephone: (01344) 636525 Fax: (01344) 636570 CALCULATION SHEET
Client SCI
Checked by RJ Date Sep 2009
P357-example2-D07.doc 123 Printed 17/03/2010
12.4 Design resistance of individual bolt connections
The connection is made with M24 grade 8.8 preloaded bolts in 26 mm holes.
Cross girder web thickness = 15 mm (y = 355 N/mm2) Main girder stiffener thickness = 30 mm (y = 345 N/mm2)
Slip resistance 3-1-8/3.9.1
Rds,F = Cp,M3
s Fnk
(3.6)
Fp,C = 0.7fubAs = 0.7 800 353 = 198 kN = 0.5 (class A friction surface) ks = 1.0 (normal clearance holes)
(3.7)
Rds,F = 2.7925.1
5.011980.1
kN
As the connection will be designed against slip at ULS, the forces in the bolts must be determined by an ‘elastic’ distribution of stresses in the web of the cross girder
For information, the following calculation of bearing/shear resistance at ULS is included. It shows that the resistance in bearing/shear is greater than against slip. This higher value could be used where restraint of the main girders against LTB is not needed but, as explained earlier, the same connection detail would normally be used on all cross girders.
ULS shear resistance of a single bolt
Resistance = M2
ubvRdv,
AfF
3-1-8/ Table 3.4
A = As = 353 mm2 fub = 800 N/mm2 v = 0.6 for grade 8.8 bolts
bolt strength: 3-1-8/3.1.1
Resistance = 1361025.1
8003536.0 3 kN
ULS bearing resistance of a single bolt on the cross girder web
Resistance = M2
ub1Rdb,
dtfkF kN
3-1-8/ Table 3.4
)5.2;7.18.2min
0
21 d
ek for edge bolts
Here, the force under combined shear and bending is not perpendicular to an edge, so use the lesser ‘edge’ distance
5.2)5.2;7.12645
8.2min1
k
P357 Composite Highway Bridge Design: Worked ExamplesC
reat
ed o
n 16
Apr
il 20
12T
his
mat
eria
l is
copy
right
- a
ll rig
hts
rese
rved
. Use
of t
his
docu
men
t is
subj
ect t
o th
e te
rms
and
cond
ition
s of
the
Ste
elbi
z Li
cenc
e A
gree
men
t
Job No. BCR113 Sheet 54 of 58 Rev A
Job Title Composite highway bridges: Worked examples
Subject Example 2: Ladder deck three-span bridge Section 12: Cross girder to main girder connection
Made by DCI Date July 2009
Silwood Park, Ascot, Berks SL5 7QN Telephone: (01344) 636525 Fax: (01344) 636570 CALCULATION SHEET
Client SCI
Checked by RJ Date Sep 2009
P357-example2-D07.doc 124 Printed 17/03/2010
)5.2;7.14.1min
0
21 d
pk for inner bolts
Again, the force under combined shear and bending is not perpendicular to the lines of bolts, so use the lesser spacing
07.2)5.2;7.12670
4.1min1
k
b is the smallest of d , fub/fu and 1.0
0
1d 3d
e for end bolts and
41
3 0
1d
dp for inner bolts
58.0263
45d
for end bolts and 65.0
41
26370
d
for inner bolts
The bearing resistances in different locations in the splice will be different. Consider the bottom corner bolt as a end-edge bolt) although the component due to shear is away from the end, not toward it)
14825.1
152435558.05.2Rdb,
F kN
So the ULS bearing/shear resistance is determined by the shear capacity of the bolt and this value must be used for all the bolts in the group.
3-1-8/3.7
12.5 Design forces on bolt group
Midspan cross girder (CG13) Moment at centroid of bolt group
M = −(85 + 184) + (304 + 859) (100 +70) 10−3 = − 71 kNm (hogging) Shear = (304 + 859) = 1163 kN
Cross girder adjacent to pier (CG8) Moment at centroid of bolt group
M = −(212 + 447) + (295 + 933) (100 +70) 10−3 = − 450 kNm (hogging) Shear = (295 + 933) = 1228 kN
Second cross girder from pier (CG9) This cross girder provides the effective lateral restraint to the bottom flange that is assumed in determining the buckling resistance in Section 9.1. For this cross girder, in addition to moments from analysis, include an allowance of 1% of the maximum force in the bottom flange over the braced length (here Lk = ).
Flange force = 297 48000 10−3 = 14300 kN Lateral force = 143 kN
Moment depends on height from flange to CG of the effective Tee section (see below)
3-2/6.3.4.2(5)
P357 Composite Highway Bridge Design: Worked ExamplesC
reat
ed o
n 16
Apr
il 20
12T
his
mat
eria
l is
copy
right
- a
ll rig
hts
rese
rved
. Use
of t
his
docu
men
t is
subj
ect t
o th
e te
rms
and
cond
ition
s of
the
Ste
elbi
z Li
cenc
e A
gree
men
t

Job No. BCR113 Sheet 55 of 58 Rev A
Job Title Composite highway bridges: Worked examples
Subject Example 2: Ladder deck three-span bridge Section 12: Cross girder to main girder connection
Made by DCI Date July 2009
Silwood Park, Ascot, Berks SL5 7QN Telephone: (01344) 636525 Fax: (01344) 636570 CALCULATION SHEET
Client SCI
Checked by RJ Date Sep 2009
P357-example2-D07.doc 125 Printed 17/03/2010
Moment at centroid of bolt group
M = −(128 + 276) + (308 + 879) (100 +70) 10−3 = −202 kNm (hogging) Shear = (308 + 879) = 1187 kN
12.6 Effective section at connection
Number of vertical ‘columns’ of bolts: 3 Number of horizontal rows of bolts: 8
Total number of bolts = 3 8 = 24
Vertical spacing: 80 mm Horizontal spacing: 70 mm
To determine forces in the bolts, consider the stresses in a Tee section comprising the slab and the web of the cross girder. Ignore the effect of the notch at the top of the web and the presence of the flanges of the main girder and cross girder (they are not connected).
(notch ignored)
250 mm
725 mm
(notch ignored)
250 mm
725 mm
There rules in EN 1994-2 for determining the effective width of the top flange do not cover this situation, where there is an end moment from the warping restraint of the girder, rather than continuity. For the design of the connection it was judged that a width of slab equal to the width of the main girder top flange should be used.
Short term section properties for composite Tee section: Slab area = 800 250 / 6.0 = 33,300 mm2 (steel units) Steel ‘web’ area = 725 15 = 613 mm2 Neutral axis of composite section = 245 mm below top of slab
For composite section, I = 2.600 109 mm4
Offsets and section moduli (steel units) for key positions in the section:
H below NA (mm)
Modulus (steel units) (mm3)
Modulus (conc. units) (mm3)
Top of slab –245 –63.6 106
Mid way rows 7 & 8 645 4.03 106
Bottom of web 730 3.56 106
P357 Composite Highway Bridge Design: Worked ExamplesC
reat
ed o
n 16
Apr
il 20
12T
his
mat
eria
l is
copy
right
- a
ll rig
hts
rese
rved
. Use
of t
his
docu
men
t is
subj
ect t
o th
e te
rms
and
cond
ition
s of
the
Ste
elbi
z Li
cenc
e A
gree
men
t

Job No. BCR113 Sheet 56 of 58 Rev A
Job Title Composite highway bridges: Worked examples
Subject Example 2: Ladder deck three-span bridge Section 12: Cross girder to main girder connection
Made by DCI Date July 2009
Silwood Park, Ascot, Berks SL5 7QN Telephone: (01344) 636525 Fax: (01344) 636570 CALCULATION SHEET
Client SCI
Checked by RJ Date Sep 2009
P357-example2-D07.doc 126 Printed 17/03/2010
While this simple model is reasonable for determining the forces in the bolts (if the effective width of slab width were doubled, to 1600 mm, this would reduce bolt forces by only a few percent), it is not reliable for verification of stresses in the slab. Slab stresses are influenced by interaction with the surrounding regions, including the presence of the cantilever, and any verification of local transverse stresses in the slab is better served by examination of the FE model. The local slab stresses were considered acceptable in this example.
Central cross girder (CG13) Share the vertical shear equally between all the bolts. Force/bolt = 1163/24 = 48.5 kN
Determine force (in web portion) at the level of the bottom row of bolts. Stress midway between lowest two rows, for M = 71 kNm (Sheet 54):
181003.4
10716
6
N/mm2
Stress at bottom of web:
201056.3
10716
6
N/mm2
Force = average stress depth = 0.2410)723808(1522018 3 kN Force/bolt = 24.0/3 = 8.0 kN
The total resultant force is thus:
F = 22 8.0 48.5 = 49.2 kN < 79.2 kN OK
Note that the above simple method for deriving the force on the lowest bolt is adequate for evenly spaced bolts and where the bottom portion of web is approximately symmetrically disposed about the bolt row. In other cases the stresses in the web should be resolved into pure bending and axial components and the moment and force then applied separately to the bolt group to derive the greatest bolt force.
The stress in the concrete due to the moment is:
Top of slab: 2.1106.63
10716
6
N/mm2 (tension)
As noted above, this value is not a reliable value but is small and well within the tensile strength of the concrete fctm.
Cross girder adjacent to pier (CG8) Share the vertical shear equally between all the bolts
Force/bolt = 1228/24 = 51.2 kN
P357 Composite Highway Bridge Design: Worked ExamplesC
reat
ed o
n 16
Apr
il 20
12T
his
mat
eria
l is
copy
right
- a
ll rig
hts
rese
rved
. Use
of t
his
docu
men
t is
subj
ect t
o th
e te
rms
and
cond
ition
s of
the
Ste
elbi
z Li
cenc
e A
gree
men
t

Job No. BCR113 Sheet 57 of 58 Rev A
Job Title Composite highway bridges: Worked examples
Subject Example 2: Ladder deck three-span bridge Section 12: Cross girder to main girder connection
Made by DCI Date July 2009
Silwood Park, Ascot, Berks SL5 7QN Telephone: (01344) 636525 Fax: (01344) 636570 CALCULATION SHEET
Client SCI
Checked by RJ Date Sep 2009
P357-example2-D07.doc 127 Printed 17/03/2010
Determine force (in web portion) at the level of the bottom row of bolts Stress midway between lowest two rows for M = 450 kNm (Sheet 54):
1121003.4
104506
6
N/mm2
Stress at bottom of web:
1261056.3
104506
6
N/mm2
Force = average stress depth = 8.15110)723808(152126112 3 kN Force/bolt = 151.8/3 = 50.6 kN
The total resultant force is thus:
F = 22 50.6 51.2 = 72.0 kN < 79.2 kN OK
The stress in the concrete due to the moment is:
Top of slab: 08.7106.63
104506
6
N/mm2 (tension)
This stress is about double the tensile strength (which is the limit for using uncracked properties for determining flexural effects, according to 4-2/5.4.2.3). Although the surface stress given by the connection model is not considered reliable for verification of the slab, it is indicative that the local stress is not excessive. The tensile force for the stress distribution given by the model could be resisted by the transverse reinforcement (20 mm bars at 150 mm centres).
The force in the slab (in this model) is introduced through the shear stud connectors on the flange of the main girder. Over a length of 800 mm the force transferred to the slab will probably be shared between at least 15 studs (3 rows of 5) and the resultant (from combined longitudinal and transverse shears) will be within the design capacity (81.7 kN, see Section 10.6). The verification of the connectors for the combined effects is not shown here.
Separate checks will be needed for fatigue assessment of the stud connectors. The determination of appropriate loading and load effects is not covered here.
Second cross girder from pier (CG9) Share the vertical shear equally between all the bolts Force/bolt = 1187/24 = 49.5 kN
Extra moment due to lateral restraint provided to bottom flange
(take lever arm as mid-slab to mid bottom flange)
M = 143 (1894 − 60/2 − 125) /1000 = 214 kNm (take as hogging)
Total moment = 202 + 214 = 416 kNm (hogging)
P357 Composite Highway Bridge Design: Worked ExamplesC
reat
ed o
n 16
Apr
il 20
12T
his
mat
eria
l is
copy
right
- a
ll rig
hts
rese
rved
. Use
of t
his
docu
men
t is
subj
ect t
o th
e te
rms
and
cond
ition
s of
the
Ste
elbi
z Li
cenc
e A
gree
men
t
Job No. BCR113 Sheet 58 of 58 Rev A
Job Title Composite highway bridges: Worked examples
Subject Example 2: Ladder deck three-span bridge Section 12: Cross girder to main girder connection
Made by DCI Date July 2009
Silwood Park, Ascot, Berks SL5 7QN Telephone: (01344) 636525 Fax: (01344) 636570 CALCULATION SHEET
Client SCI
Checked by RJ Date Sep 2009
P357-example2-D07.doc 128 Printed 17/03/2010
Determine force (in web portion) at the level of the bottom row of bolts
Stress midway between lowest two rows:
1031003.4
104166
6
N/mm2
Stress at bottom of web:
1171056.3
104166
6
N/mm2
Force = average stress depth = 14010)723808(152117103 3 kN Force/bolt = 140/3 = 46.7 kN
The total resultant force is thus:
F = 22 46.7 49.5 = 68.1 kN < 79.2 kN OK
The stress in the concrete due to the moment is:
Top of slab: 54.6106.63
104166
6
N/mm2 (tension)
As noted for CG8, this is not a reliable value for verification of the slab.
As for CG8, the shear connectors need to be verified for the combined longitudinal effects but that verification is not given here.
P357 Composite Highway Bridge Design: Worked ExamplesC
reat
ed o
n 16
Apr
il 20
12T
his
mat
eria
l is
copy
right
- a
ll rig
hts
rese
rved
. Use
of t
his
docu
men
t is
subj
ect t
o th
e te
rms
and
cond
ition
s of
the
Ste
elbi
z Li
cenc
e A
gree
men
t
P357-frontpages.doc 129 Printed 17/03/10
REFERENCES
1. TD 27/05, Cross-Sections and Headrooms, (Part of the Design Manual for Roads and Bridges) TSO, 2005.
2. TA 90/05, The Geometric Design of Pedestrian, Cycle and Equestrian Routes, (Part of the Design Manual for Roads and Bridges) TSO, 2005.
3. PD 6694-1, Recommendations for the design of structures subject to traffic loading to BS EN 1997-1 (due to be published by BSI in 2010)
4. ILES, D.C. Design of composite highway bridges (P356) The Steel Construction Institute, 2010
5. HENDY, C.R. and JOHNSON, R.P. Designers’ guide to EN 1994-2 Thomas Telford, 2006
6. Steel Bridge Group: Guidance notes on best practice in steel bridge construction (5th edition, P185)
GN 2.06 Connections made with preloaded bolts GN 5.08 Hole sizes and positions for preloaded bolts
The Steel Construction Institute, 2010
7. HENDY, C.R. and MURPHY, C.J. Designers’ guide to EN 1993-2 Thomas Telford, 2007
P357 Composite Highway Bridge Design: Worked ExamplesC
reat
ed o
n 16
Apr
il 20
12T
his
mat
eria
l is
copy
right
- a
ll rig
hts
rese
rved
. Use
of t
his
docu
men
t is
subj
ect t
o th
e te
rms
and
cond
ition
s of
the
Ste
elbi
z Li
cenc
e A
gree
men
t
Typeset and page make-up by The Steel Construction Institute, Ascot, Berks. SL5 7QN Printed by Information Press, Eynsham, Oxford OX29 4JB 1,100 03/10 BCR113
P357 Composite Highway Bridge Design: Worked ExamplesC
reat
ed o
n 16
Apr
il 20
12T
his
mat
eria
l is
copy
right
- a
ll rig
hts
rese
rved
. Use
of t
his
docu
men
t is
subj
ect t
o th
e te
rms
and
cond
ition
s of
the
Ste
elbi
z Li
cenc
e A
gree
men
t